Oil Watch - World Total Liquids Production
Posted by Euan Mearns on November 21, 2012 - 12:28pm
World total liquid fuel production data published by the International Energy Agency (IEA) suggests that global liquid fuel production has risen steadily (in stages) from 76.3 million barrels per day (mmbpd) in January 2002 to a recent high of 91.3 mmbpd in July 2012. +15 mmbpd represents a 20% uplift in liquid fuel supply in little over a decade.

Figure 1 World total liquid fuel production based on data extracted from the IEA monthly Oil Market Reports (OMR). Chart not zero scaled. All charts are clickable to get a larger version.
From May 2007 to August 2010, Rembrandt Koppelaar published an e-report called Oil Watch Monthly that summarised global and national oil production and consumption data from the International Energy Agency (IEA) of the OECD and Energy Information Agency (EIA) of the USA. Owing to time pressure involved in compiling the statistics, the publication was discontinued. Rembrandt has kindly provided me with his database and I have begun the task of updating the last 2 years of data with a view to re-instating Oil Watch Quarterly. This is the first in a series of interim reports that are co-authored with Rembrandt.
Where has 15 mmbpd come from?
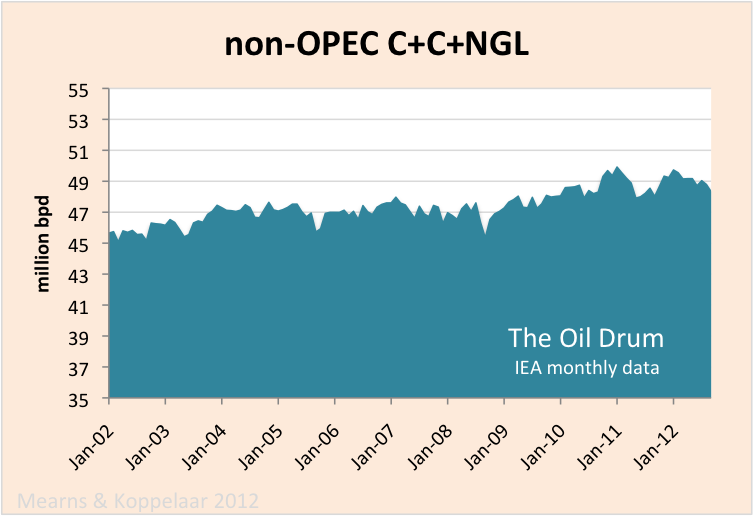
Figure 2 Non-OPEC supply has risen slowly from 45.6 mmbpd in January 2002 to 49.0 mmbpd in July 2012. The recent peak in non-OPEC C+C+NGL production was 49.9 mmbpd in January 2011.

Figure 3 OPEC supply has risen steadily in stages from 28.5 mmbpd in January 2002 to 37.9 mmbpd in July 2012. Figures 2 and 3 have the same range in y-axis scale., i.e. 20 mmbpd.
A note on nomenclature:
C = crude oil
C+C = crude oil + condensate
NGL = natural gas liquidsprocessing gains = volume expansion of liquids during the refining process
biofuels = mainly sugar cain ethanol from Brazil and corn ethanol from the USA

Figure 4 Biofuels production has risen from 0.35 mmbpd in January 2002 to 2.15 mmbpd in July 2012. As data recording techniques have improved a clear annual cyclicity is emerging in global biofuels production. Production has been flat for 3 years. Note that biofuels have a significantly different energy balance than fossil based liquid fuels. Substantial quantities of natural gas, diesel and electricity are required to produce ethanol and biodiesel, in many cases with little energy gain.

Figure 5 Refinery processing gains have risen from 1.82 mmbpd in January 2002 to 2.17 mmbpd in July 2012. The volume expansion of liquids during refining does not represent energy gain. The chemical alteration due to refinery processes results in lower density products relative to crude oil inputs. The slight rise in processing gains reflects the shift in global oil supply from light sweet crude to heavier grades that provide more volume expansion during processing.
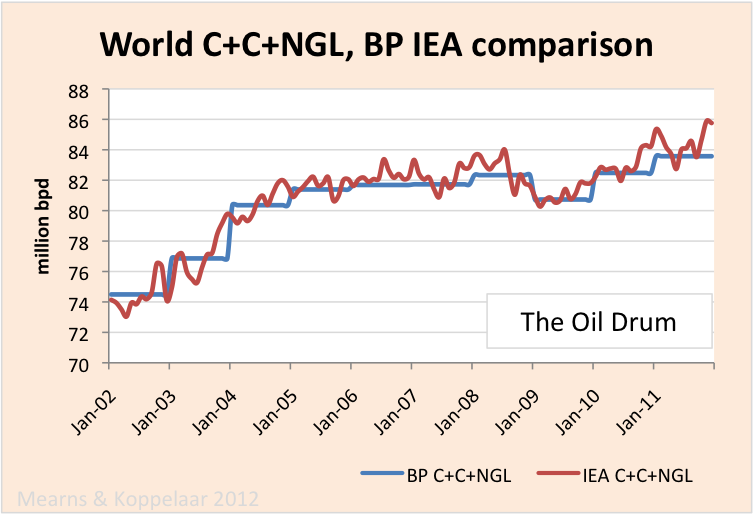
Figure 6 Comparison of IEA C+C+NGL monthly data with the annual data published by BP. In general terms there is a good correspondence.
Summary
From January 2002 to July 2012, according to the IEA, global liquid fuel production rose from 76.3 to 91.3, an increase of 15 mmbpd. The sources of this rise are as follows:
OPEC C+NGL 28.5 to 37.9 = +9.4 mmbpd
non-OPEC C+C+NGL 45.6 to 49.0 = +3.4 mmbpd
Biofuels 0.35 to 2.15 = +1.8 mmbpd.
Processing gains = 1.82 to 2.17 = 0.35 mmbpd
9.4+3.4+1.8+0.35 = 14.95 mmbpd
OPEC accounts for 63% of the rise in liquid fuel production, non-OPEC accounts for 23% in the studied period.
Contact
- Content: editors at theoildrum dot com
- Tech support: support at theoildrum dot com
License

This work is licensed under a Creative Commons Attribution-Share Alike 3.0 United States License.
Thanks for taking the time to compile these data.
Showing that processing gains are an energy supply illusion is hugely important, especially in the US where the EIA adds processing gains the accounting as US petroleum production. As
RockManRocky pointed out yesterday, there is a considerable quantity of light fraction liquids transported to Canada to be used for dilution of the extra heavy crude to enable the transport of bitumen (tar) sands back to the US. As the extraction and transport of that "dilbit" to the US is expected to increase, these resulting processing gains will also increase, further distorting the reporting. It may be worth noting that this distortion as present reported adds a larger quantity of energy to the US supply than that which is produced in the form of ethanol and other biofuels...EDIT: One should also note that the IEA's global processing gain of 2.17 mbbls/d appears to be too small, given that the EIA data for 2011 shows 1,085 mbbls/d for a crude refinery input of 14,536 mbbls/d. Why isn't the global number larger???
E. Swanson
Not really -- processing gains as a fraction of total oil supply are no different now than a decade ago. Just look a the figures from this article:
It skews things a little in the US (where perhaps 60% of processing gains should accrue to imported oil and not be counted as US production), but globally it's no more than a footnote to the story of expensive oil.
Well spotted Pitt. Processing gains have in fact risen with production / refining.
With all due respect, neither reply answers my question, which is, why isn't the global processing gain as large as that for refining in the US? The US processing gain is around 6.5% of crude+condensate+NGPL, while the rest of the world produces 1.085 Mbbl/d. The world total C+C+NGPL of 86.9 Mbbl/d minus the US C+C+NGPL of 16.719 Mbbl/d, leaves 70.18 Mbbl/d, which implies to a processing gain of only 1.5% for the rest of the world, which isn't anywhere as good as that achieved in the US. Not to mention the fact that the stated processing gain for the rest of the world is exactly twice that of the US, which would appear to be highly improbable...
E. Swanson
I think it might be because many of the Gulf coast refineries are set up for heavy oil which favours processing gains. I think : )
You are counting gain as a fraction of oil coming out of the ground, when you should be counting it as a fraction of oil coming out of the refinery if you want to do that sort of comparison.
If you did the calculation your way for a single refinery, you would get infinite gain, because the refinery doesn't have a well in it.
I am not sure how they would determine process gain for countries other than the US. The Canadian National Energy Board does not calculate or report "process gain" (after all, it's not a real product) and those countries which report crude oil by mass (tonnes) would not have a process gain because there is no change in mass.
It's possible they just multiply by a fixed percentage (e.g. 2.4%).
"...not have a processing gain because there is no change in mass"
This can't be correct in most cases because as crude is cracked in coker, C atoms break off the hydrocarbon molecule chain to become the "coke". Coke is almost entirely carbon, so unless my knowledge of chemistry is wrong, the mass DECREASES by close to the value of the coke produced. Refinery gains are a net energy loser although the volume may increase. If a catalytic process that breaks long chain hydrocarbon molecules into shorter ones adds hydrogen without producing coke, then the mass may slightly increase as no carbon atom is split off. I am not a refinery engineer but have studied chemistry as part of my engineering curriculum. Does someone know better?
Coke is a refinery product, so basically every atom that goes into the refinery in the feedstock goes out again as products. The carbon atoms do not get lost or change mass. The volume of the products is different than the volume of the feedstock, but the mass is the same.
Coke is a solid in most instances. I think we are counting liquid fuels, no?
Well, apparently the EIA and IEA are counting only liquid fuels, but it's not a legitimate accounting technique. They should be doing a mass and/or energy balance. There is quite a lot of mass and energy in the coke a refinery produces, and they don't actually throw it away, they sell it as fuel. Looking at only liquid fuels is really a very simplistic approach which gives a misleading picture.
As you note, "processing gains" aren't something which one can measure directly. The markets deal in volumes and as a result, governmental reports (such as those from the EIA and the IEA) present data in volumes, not energy content or mass. Processing gain only serves to keep the "green eye shade" crowd of corporate and financial types happy, since they are trained to look at various balance sheets in which every thing neatly adds up. In reality, "processing gain" is simply the calculated difference between the volume of product and the volume of input liquids.
The volumes reported on both sides of the calculation have numerous sources of error, not to forget the non-technical situations, such as the Saudis, where production is a state secret and various unauthorized diversions, such often reported in Nigeria. For countries (and companies) with a larger fraction of such gains, the cause might be more efficient refining or differences in the output fraction of each product type. Refiners which have access to natural gas may use that instead of crude to provide the thermal or electrical energy to run the refinery, resulting in more product output. The results might also reflect differences in emissions where a country which has strict standards and enforcement might end up with more product actually making it to market. Then too, it's always going to be difficult to contain these liquid and gaseous materials, especially in countries with warmer climates. There's also the possibility that "processing gains" might turn out to be negative, if losses are extreme.
Ideally, from a scientific or thermodynamic point of view, the accounting should be carried out in energy terms, presenting the information rather like that found in the various markets for natural gas or electricity. With such accounting, there would not be any "processing gain", only the losses during extraction, refining and distribution. The efficiency of each link in the processing and delivery chain would be clearly apparent and the market(s) would be able to include this information in various corporate valuations. Sad to say, our markets don't work that way...
E. Swanson
That's a nice summary of why the 2.5-ish% processing gain should be considered within the noise level of all of this data, and probably best ignored completely.
Updated “Gap” Charts, using annual data through 2011:
EIA Total Liquids, 14 mbpd Gap:
(2002-2005 rate of change: +3.1%/year; 2005-2011 rate of change: +0.5%year)
BP Total Petroleum Liquids., 13 mbpd Gap:
(2002-2005 rate of change: +3.0%/year; 2005-2011 rate of change: +0.4%year)
EIA Crude + Condensate, 14.5 mbpd Gap:
(2002-2005 rate of change: +3.1%/year; 2005-2011 rate of change: +0.07%year)
Global Net Exports*, 18 mbpd Gap:
(2002-2005 rate of change: +5.3%/year; 2005-2011 rate of change: -0.7%year)
Available Net Exports (GNE Less Chindia’s Net Imports), 17 mbpd Gap:
(2002-2005 rate of change: +4.4%/year; 2005-2011 rate of change: -2.2%year)
* Global Net Exports (GNE) = Top 33 net exporters in 2005, BP + Minor EIA data, total petroleum liquids
I am using what I call the Six Country Case History (Indonesia, UK, Egypt, Vietnam, Argentina, Malaysia), as an example of how an "Undulating Plateau" in production can hide a catastrophic decline in CNE (Cumulative Net Exports). From 1995 to 1999, their combined production ranged between 6.9 and 7.0 mbpd (BP, total petroleum liquids). However, by the end of 1999, they had already shipped 53% of post-1995 CNE.
Here are some simple percentage changes, from 1995 to 2001, for the Six Country Case History:
Production: -6%
Consumption: +12.5%
Net Exports: -29%
ECI Ratio: -15%
Post-1995 CNE: -75%
Note that after six years of declining ECI values, the cumulative depletion in the post-1995 supply of net exported oil was about 12 times greater than the observed decline in production.
Here are some simple percentage changes, from 2005 to 2011, for ANE (Available Net Exports), and one estimate (CNI = Chindia's Net Imports):
GNE: -4%
CNI: +63%
ANE: -12.4%
GNE/CNI Ratio: -41%
Estimated post-2005 Available CNE: -48%
Note that after six years of declining GNE/CNI values, the estimated cumulative depletion in the post-2005 supply of Global Net Exports that will be available to importers other than China & India is more than 10 times greater than the observed decline in Global Net Exports.
In order to estimate CNE (Cumulative Net Exports) from an exporting country whose production has shown an inflection point, i.e., either a production decline or the start of an "Undulating Plateau," I extrapolate the multiyear rate of decline in the ECI ratio (ratio of total petroleum liquids production to liquids consumpiton) to estimate when the ratio would = 1.0 (when production = consumption).
Given the tendency for net export declines to show an "Shark fin" pattern, I multiply the annual net exports, at the inflection point, times the number of estimated years to zero net exports, times 0.5 (to get the area under a triangle), less annual net exports at peak. That was my "Cowboy Integration" method for the following CNE estimates.
The following estimates are based on extrapolating six years of declining ECI values or declining GNE/CNI values (1995 to 2001 for the Six Country Case History and 2005 to 2011 for global data).
The post-2005 estimate would seem to be impossibly pessimistic, but one has to consider the Six Country Case History and the similarity between the six year 1995 to 2001 decline in the Six Country ECI ratio and the six year 2005 to 2011 decline in the GNE/CNI ratio.
Estimated Six Country post-1995 CNE:
9.2 Gb
Actual Six Country post-1995 CNE:
7.3 Gb
Estimated Remaining Six Country post-1995 CNE, at the end of 2001:
3.7 Gb
Actual Remaining Six Country post-1995 CNE, at the end of 2001:
1.8 Gb
Note that the actual Remaining Six Country post-1995 CNE number, at the end of 2001, was about half of the estimated value.
Estimated post-2005 Available CNE: 168 Gb
Estimated Remaining post-2005 Available CNE, at the end of 2011: 87 Gb
Annual ANE in 2011: 12.8 Gb/year
Estimated Remaining post-2005 Available CNE, at the end of 2011, divided by 2011 annual ANE per year: 7 years
This is of course analogous to an estimated R/P ratio, and of course, even if approximately correct, countries don't produce or export at a flat rate for a number of years and then go to zero, but it's a useful metric.
Are country's with less oil importation, making up the difference with biofuels production & fracking (to use as LNG/CNG in transport) as seen in the overall world all oils increase?
So the killer for 'American oil independence' is the combination of Dr Patzek's US production chart from yesterday with Westexs' last chart above:
The former tells us that after the Shale bump 'native' production will go back to decline, and the later shows us that replacing it with imported oil is going to get harder, or at least more expensive.
So. Be nice to Canada now, and/or probably better sabotage any attempts by those pesky northerners to build infrastructure that liberates the Alberta resource either east or west and onto the global market.
Related: Is the Alberta product dependent on US inputs to lighten it? If so that is a way that that Bitumen, once it hits the station forecourt, could at least in part accurately be described as a 'North American' product?
The decline in global net exports is the maker of U.S. crude oil independence. If there is not enough crude oil available for global export, then the U.S. can not import it and therefore must reduce its consumption to match domestic production plus what it can get from the Canadian tar sands. This is what the happy talk is meant to conceal.
Ha!
Finally some respect for the great white north!
(actually with global warming it may be the great brown north. but it is big)
Is it appropriate to take the growth rate that occurred immediately after a recession ended and expect that to continue indefinitely? Especially when comparing to a period from the end of recovery from one recession to midway in the recovery from another?
Consider applying that method to previous recessions:
Based on recent history, post-recession growth in oil demand should be expected to be faster than average.
I agree with you that oil supply has struggled to keep up with demand since 2005, will continue to do so, and the result will be an increasing squeeze on OECD oil importers, but I think these graphs could potentially be unintentionally misleading by suggesting that the post-recession rate of oil production growth should have continued.
A much more reasonable rate to use for extrapolation, IMHO, is the rate from peak to peak of business cycles, when oil demand was just about to start falling again due to economic slowdown; these are, roughly:
Based on the above, I think 1.5%/year is probably a reasonable baseline for "if the future had been like the past", although in the short term (2005-2010) evidence suggests 1.0%/year is more plausible. 3%/year is too high, though, and using that number undercuts the value of these graphs by bringing their objectivity into question.
A tale of two price doublings
The annual price of Brent (approximately) doubled from $25 in 2002 to $55 in 2005, an annual rate of increase of 26%/year.
The annual price of Brent doubled again, from $55 in 2005 to $111 in 2011 (with one year over year decline, in 2009), an annual rate of increase of 12%/year.
I was interested in the production/net export response to the first price doubling, versus the second price doubling.
But let's look at what I think is the key metric, from the point of view of oil importing OECD countries--nine straight years of year over year declines in the GNE/CNI ratio (the ratio of Global Net Exports to Chindia's Net Imports). The following graph shows the 2002 to 2011 decline in the GNE/CNI ratio, versus total global public debt, over the same time frame:
Not only have we seen nine straight years of year over year declines in the GNE/CNI ratio, the rate of the decline in the ratio has accelerated in recent years. At the six year 2005 to 2011 rate of decline, in only 18 years the Chindia region alone would theoretically consume 100% of GNE. While we can all agree that won't happen, the fact remains that recent data show us headed toward that theoretical point in time at an accelerating rate, at least through 2011.
As noted up the thread, an extrapolation of the Six Country rate of decline in the (similar) ECI ratio generated a net export projection that was too optimistic. The estimated rate of depletion in Six Country post-1995 CNE, during the six year period from 1995 to 2001 was 15%/year. The actual rate of depletion in Six Country post-1995 CNE, during the six year period from 1995 to 2001 was 23%/year.
The estimated rate of depletion in post-2005 Available CNE during the six year period from 2005 to 2011 was 11%/year. In other words, using a method that proved to be too optimistic on a prior case history suggests that we may be burning through the remaining cumulative supply of net exported oil that will be available to about 155 net oil importing countries at the rate of almost one percent per month.
Incidentally, it's not whether we are depleting the remaining cumulative supply of GNE & ANE, it's only a question of the rate of depletion.
Westexas, again thank you for your persistence in posting these stats and the direction exports are going. From the general lack of discussion about them, I am convinced that people just don't believe them, OR think that "something" will happen to make them untrue.
Perhaps the numbers you present in ELM are not understood by many. Talking in terms of 87 GB ANE over 18 years, or even the 7 years worth of ANE at the 2011 rate of 12.8 GB does not seem to be having general understanding.
Maybe some WAGs over where price is going over the short term would get peoples attention. My WAG using your numbers is that a halving of ANE from 2005-11 has led to a doubling of price $55-$111. A continuation of this theme would have the next doubling after the use of ~43 GB of ANE, or before the end of 2015.
Of course because the 6 country model did not have a large effect on world supplies and price, the consequences of world exports heading in the same direction will have different feedback loops. High prices are likely to make more oil available to the 155 importers from a reduction in China and Indias growth rates. You would also expect that exporting countries will eventually wake up to the fact that oil in the ground (and accessable) is more valuable than dollars or euros in the bank.
I agree that it's generally disbelief or denial, and in regard to the general population, perhaps 0.1% of the people in the world might have some understanding of "Net Export Math."
In regard to the Titanic metaphor, at around midnight, perhaps only three people (about 0.1% of the people on the ship) knew that the ship would sink, but that did not mean that the ship was not sinking. And of course, as people were given the news that the ship was sinking, the general response was disbelief or denial. According to Walter Lord, the passengers on the first (partially full) lifeboat to leave the ship were ridiculed by many of the passengers staying on board.
Here is my sketch showing the normalized six year ECI plots for the Six Countries, for GNE and Saudi Arabia along with the normalized GNE/CNI plot. Index year (set to 100%) is 1995 for the Six Countries, 2005 for the other data.
As described above, we know what the implications were of the slope of this ECI decline for the Six Country Case History, and we know that an extrapolation of the six year Six Country ECI decline produced a remaining post-1995 CNE estimate that was twice as large as the actual value. What I have described as the $64 trillion question is why would the outcomes for GNE, ANE and Saudi net exports be materially different from the Six Country outcome?
As you noted, there are some big differences between the global situation and the discrete Six Country data set, but as you also noted, those differences could produce both positive and negative effects, from a supply perspective. It's going to be an "interesting" ride down the slope.
westexas,
I've been an interested reader of your postings for several years, and thought I knew all the abbreviations, but you've used one I don't think I've encountered before: "ECI ratio"
What does ECI stand for?
Thanks!
Geo.
I believe that's a term that Jeffrey(?)/Westexas invented, Export Consumption Index.
It seems confusing to me - it's rather like miles per gallon, which Europeans wisely do not use, as both very large and very small numbers are misleading. They use litres per km, which makes much more sense.
I'd suggest instead something simpler: Percent of Production Consumed (PPC).
ECI = Export Capacity Index, ratio of total petroleum liquids production to liquids consumption. At 1.0, an exporting country would hit zero net oil exports.
An analogous ratio is GNE/CNI, which is the ratio of Global Net Exports to Chindia's Net Imports.
Something similar to GNE is happening within the US, which I would call "local net oil exports"
The horizontal drilling and fracturing in the Bakken formation, Eagle Ford, and areas of similar oil bearing strata uses a lot of energy in the process. I have mentioned before about how Tesoro's Mandan, ND refinery (70,000 bpd being expanded to 110,000 bpd) cannot produce enought diesel fuel for the local market. This is mainly due to the Bakken oil production requiring HUGE amounts of diesel fuel, besides the transport system (both trucks and railroads) being fueled to keep the oil and supplies moving. My customer each month moves millions of gallons of diesel from the Fargo ND pipeline (fed by St. Paul, MN refinery) every month to Bismark, ND. This "imported " diesel keeps trucks fueled in the Bakken formation area.
So as EROEI decreases for oil production regions like the Bakken, less percentage of that oil will ever be "exported" to other areas of the US. Tesoro's increase in refinery capacity will not help lower diesel prices in ND, now near $5/gallon, since most of the new diesel produced will be used locally for Bakken region users, IMO.
1,000 truck trips per constructed pad site, with maybe 5,000 pads to be built in the 50,000 well drill plan. That's a lot of diesel....especially since trucks keep running after the pad is built too.
mb,
That is a good example of local EROEI. It we pour more energy into getting less fuel, then those ARE diminishing returns by definition.
If we use natural gas to get tar sands oil, we are just trading one for another. I call it "scrapping the bottom of the barrel".
This is what we are doing while trying to hype a next expansion to emulate North Slope/North Sea. Perception is one thing, reality is another.
The EROEI of oil sands production ranges from 12:1 for the most efficient mining operations to about 4:1 for the least efficient steam injection projects. I tend to use 6:1 as an arbitrary number for discussion purposes.
However, the Bakken probably has an EROEI in the same range once all the fuel consumption for drilling, fracing, and trucking the product are factored in. The oil industry is indeed a very intensive user of diesel fuel.
In the case of oil sands, though, the fuel is natural gas, which is trading far below its fuel value on an energy equivalence basis, so in money terms it works out rather well for the companies in the long term. OTOH, the Bakken wells may not have a long term given their very steep production decline rates.
I found a source earlier this year where nat gas consumption for Canadian tar sands was published and this led to an ERoEI estimate of 3. When ERoEI approaches one we are really dealing with energy conversion as opposed to energy "production", and as you point out with nat gas cheap in N America, this is currently an attractive proposition.
We are happy to do energy conversions of coal and gas to electricity with significant energy losses along the way. Upgrading energy quality is a vital component of our energy system.
The thing that gets me right now in N America is how expensive shale gas has dumped nat gas prices making the oil sands more attractive.
I was working from industry numbers. Companies don't generally calculate EROEI, but you can calculate it from their oil production and gas consumption data. It's important to realize they are steadily improving the EROEI as they make improvements in the technology. A lot of the technology is very new, so an EROEI of 3 is probably from old data.
However, the low price of NG certainly makes the industry's bottom line look better. There are NG fields near and directly underneath the oil sands. A lot of the oil sands companies have their own NG wells, and no economic market for the NG other than to feed it into their own oil sands plants.
There are also shale gas fields nearby that recent studies have determined are as big as those in the US, but they are definitely uneconomic at current prices.
Will the natural gas reserves located within the areas where oil sands are located in Alberta somehow constrain the extraction process of oil from these bituminous sands?
In other words, do the available natural gas reserves match the oil sand reserves?
JB
The natural gas reserves are adequate for the foreseeable future. However they don't necessarily have to use natural gas. Any source of process heat will do - eg bitumen gasification, nuclear, etc.
Some are saying that available natural gas reserves will not enable the extraction of more than 30% of the available Alberta tar sand oil...
The building of a nuclear fission reactor takes 10 years including the time needed for the environmental evaluation/public consultation process. And good luck with the process of convincing public opinion to accept the construction of nuclear reactors these days...
Hence, if the building of nuclear reactors is not an option, are there other options available?
JB
Ten years is nothing in the time scale of developing the Canadian oil sands - most likely it will stretch out for centuries.
However, nuclear is one of the least likely alternatives for process fuel since it is one of the most expensive, and it is mostly the nuclear industry promoting it. Other alternatives include bitumen gasification, shale gas, coal and hydroelectric, all of which are available in the oil sands regions in vast amounts. It is one of the most energy resource rich areas on Earth.
Most likely it is the cheapest resource which will be used, and at this point it is natural gas. If that changes, they will use one of the other ones.
If something else than local natural gas has to used for tar sand oil processing and extraction, the EROEI of tar sand oil which is already very low is likely to turn out negative...
In which case it will likely stay in the ground unless you find a way to subsidize tar sand oil extraction at great cost by other positive EROEI energy sources.
JB
MB,
The Bakken region sounds to be a perfect place for CNG/LNG for truck/train haulage. They are currently flaring Nat gas due to lack of market, and needing to invest heaps to import diesel. Kill two birds with the one stone. Use the waste nat gas instead of expensive diesel. The drilling rigs and maybe even the frac trucks could also be converted. The technology is there, just need managers to start thinking outside the box, and start making use of all the resources available to them. This seems the easy way to decrease the amount of liquid fuel inputs into high cost oil production.
It takes more than managers thinking about it, it requires government regulation to prevent flaring.
This is an obscure historical point, but it was NG flaring that led to provincial regulation of the oil industry in Alberta. Oil companies flared off about $20 billion worth of NG (at today's prices) and permanently damaged the reservoir drive on the old Turner Valley field. It was quite obvious what was going on because people in Calgary, 100 miles away, could see the flares lighting up the night skies and smell the sulfur from the burning gas. Ducks stopped going south for the winter and people used to hunt rabbits at night with the light from the flares.
The oil companies and the federal government rejected provincial government regulation of flaring, and the supreme court stuck down several laws, but the Alberta government proved it could be very innovative at inventing new laws, it could pass them faster than the courts could strike them down, and things could turn very ugly at election time - the opposing parties were not just defeated but completely wiped out in Alberta.
Eventually the companies, the Feds, and courts agreed that it was easier to let the Alberta government regulate NG production, and it has done so very positively ever since. This was the origin of the Alberta Energy Resources Conservation Board.
Oil companies flared off about $20 billion worth of NG (at today's prices) and permanently damaged the reservoir drive on the old Turner Valley field.
That sounds like a textbook example of the short sightedness of private industry, and the need for regulation. Would you describe it that way?
Can the gas be re-injected, maybe leaving it in the ground for the future?
NAOM
I'd also like to say a big "thank you" for compiling the data, and look forward to the quarterly updates. I've been rather missing this from the Oil Drum over the last two years.
Just on the presentation side, "C+C+NGL" is a bit of a mixed bag of different things. Is it possible from the IEA data to get an idea of the split between C and NGL, for instance, or do we need to look at proprietary datasets to do that? How much of the last ten years' gain is in NGL, in both OPEC or non-OPEC? Also, is IEA data for 2010, 2011 and 2012 subject to the same sorts of weird revisions and roundings for Saudi Arabia that we saw in the EIA global data (just before the regular publication was discontinued)?
The IEA report crude only (+condensate?) for OPEC countries with NGL separately. OPEC will be subject of our next post next week. Otherwise the IEA lump C+C+NGL together for non-OPEC countries rather like BP data.
The EIA report C+C for "all" countries - I haven't got around to updating EIA tables yet, will get to that once I'm done with the IEA.
Thanks Euan and Rembrandt. Quarterly is good!
--to Black, I think it was Rocky, not ROCK commenting on bitumen
What's the graph look like when you subtract out the increasing amount of energy used to reach the 91 mb/day?
MrEnergyCzar
Rembrandt used to report energy content also, I may get around to that. However, noting that most of the rise in global liquids over the past decade has come from OPEC, the net energy issue is not as important yet as many may think. It is of course most relevant to US biofuels, tar sands and shale oil and will likely have a distorting effect on the N American numbers (which I haven't tabulated yet).
It is of course most relevant to US biofuels, tar sands
Of course, it's really Liquid Fuel Return On Liquid Fuel Invested that's most important here, right?
Most of the energy inputs are natural gas, not liquid fuel...
That may depend on where ng production and costs go. The current paradigm is that those costs will stay low and production high. We'll see.
If natural gas costs fell, other non-liquid forms of would replace it for process heat - coal, solar, heat-pump augmented electricity, etc.
And, of course, liquid fuel isn't essential - eventually, as liquid fuel costs stay high much of the roughly 20% of input energy that is in the form of liquid fuel will be displaced by rail, EREV trucks, etc.
Oil and other liquids' production may have increased by 20% since 2002 but the strategic issue is by how much has net energy production risen?
This is particularly important since the EROEI of extracted oil has been declining steadily since 2002 and since the EROEI of other liquids is either low or negative...
JB
What if the NET energy generated from an increased volume of oil and other liquids was in fact flat or even DECLINING...
That might explain why real global economic growth has become impossible to achieve since the financial crisis of September 2008... simply by way of lack of additional available energy. In a zero-sum international environment what one gets, others must lose. In other words, if China still gets real growth from increased oil and other liquids usage, the OECD and others must relinquish.
JB
MrEnergyCzarand and JB
This link below is to my rather limited attempt to answer the ELM combined with EROEI question. My apologies for the rather limited information and lack of relevant references.
My gratitude to Jeffery Brown (user Westexas) for his assistance with the ELM data.
Oil Export Declines by 2020
The earlier post by Jeff further up the thread on the growing gap gave me another panic attack. ELM is always very problematic. Add in EROEI declines and it starts to look frightening.
Please note the oil export EROEI numbers are just illustrative. They are very subjective and susceptible to assumptions. Projections are also dependent on decisions e.g. petrodollar recycling.
I am not a techno cornucopian, far from it, I suspect most people would class me as a doomer. However I believe that there are potential technical solutions. As I see it the main limitation is in the infrastructure scale up time.
Without going into to much details, let me just remind you that in our modern interconnected world critical systems can fail long before the last drop of oil stops flowing. Time to adapt and build new infrastructure can mean the difference between life and death.
This is why ELM is so frightening for me.
I have to agree.. looking at the numbers presented strictly as liquid volumes confuses the net energy of each barrel. A Barrel of Heavy crude has a higher energy density than condensate. This appears to give them equal billing! We must convert each type of energy to a common unit and then add them to see if we are gaining or losing energy. Using barrels does not show actual net energy increase or decrease.
I am beginning to believe that the use of liquid volume is designed to confuse and show gains where there are in reality losses! We can clearly see that the volume of crude is in decline and the volume of other liquids is increasing.. but the net energy must be showing a decrease if calculated correctly!
I suggest that future statistics all be baselined on a common energy unit and then presented in contrast to the liquid volume so that the real net energy is displayed against the liquid volume. That is more valuable than just showing total liquid increases..
Seriously .. If I add 1 barrel of water to every barrel of crude can I really say that my total liquids is an increase in usable energy?
Agreed.
The total energy content of all the extracted liquids is a much more important data than the total volume...
Since the energy content of various types of liquids is not the same, it is deliberately confusing to only report the higher volumes extracted.
In addition to that specific issue, we all know that the EROEI of one of those liquids i.e. "oil" has been steadily declining and hence the net energy content coming from that source has been declining even if the total volume of "oil" extracted at planetary level has been stable since 2005.
JB
I'd prefer to say that oil supply / demand imbalance, leading to sustained high oil prices is one cause of ongoing recession in many OECD countries - which has knock on effects else where, for example, reduced demand for Chinese manufactured goods.
The 2011/12 uptick in crude production is described in my latest post:
21/11/2012
US shale oil hype
http://crudeoilpeak.info/us-shale-oil-hype
Excluding US shale oil, June 2012 crude & condensate was not higher than June 2005
Thank you Matt.
I find your presentation very clear.
I strongly suggest that someone at The Oil Drum attempts a measure of the evolution of the NET energy produced as compared to the gross volume of oil and other liquids extacted.
JB
I would suggest that the critical figure is the amount of oil produced with an EROEI of greater than 10-12.
In the case of exports the situation is complicated by the need to calculate the Effective EROEI of the exports. There is often a complaint that accurate oil production and export figures are hard to come by. Consider how much harder it is to calculate the Effective EROEI of exports.
Calculating the Effective EROEI of exports requires information not just on the EROEI of production, which is hard enough to obtain, but also how much net energy is exported.
This is not a simple calculation, few groups/countries export oil for free. If energy intensive goods are received then this must be subtracted from the exports to obtain the Effective EROEI of the exports.
For example when in the past Saudi Arabia was allocating most of its petrodollars to long-term US government bonds and now the US gov just prints mony to buy back those bonds the Effective EROEI of those Saudi exports was very high.
See my post above.
EROEI at the point of usage (of refined oil by-products) is the strategic data that should be precisely calculated.
I agree that it is not easy to calculate but if there is an expert team, that should attempt at least a reasonable approximation based on available data, it is one associated with The Oil Drum.
The resulting findings might be surprising.
JB
P.S: You can reasonably bet that this data has been gathered by the intelligence-military communities of all the large countries on the planet.
Thank-you Euan and Rembrandt for resurrecting the Oil Watch.
I posted this chart, EIA World Crude Oil & Lease Condensate Production from January 2000 to June 2012, back in the Drumbeat of Sept. 29, 2012, but since the EIA is late in updating their data for July and this thread is the more appropriate location, I repost it.
Thank you, BlueTwilight. As much as I appreciate Euan's and Rembrandt's work to bring back Oilwatch, I still think that adding NGL to C&C is similar to adding apples and oranges. We are interested in oil production mostly because oil is the primary transportation fuel-source. What proportion of NGLs is used to produce transportation fuel?
hinson - OTOH it's easy to agree with your point of view. OTOOH it only makes a difference if one tries to extrapolate that metric as a single entity. That's where the arguments start IMHO. In reality it's an easy problem to fix: just state values separately for crude oil, condensate, NGL, biofuels, GTL, refinery gains, etc. Each metric has its own controlling factors which are independent of each other for the most part. Get those separate long term projection down on paper and analyze each separately. Then we can add all X numbers of curves together to get whatever global total liquids value at any point in the future. Not sure what use that number would be since, as you point out, each component enters the system differently and has different implications.
Thanks for the update.
Although it basically confirms the story that is being pushed by the, for a lack of a better word, moderates in the Peak Oil community.
Not stagnation, but a strong slowdown.
The bulk of the increase came from 2002 to 2005.
From Jan 2005 to Jan 2012 the increase was only 4 mb/d or 0.517 mb/d per year.
This is consistent with a rising, but slowly rising, world oil supply that is forcing prices to go up.
As an important reminder, growth now entirely hangs on US/Iraq and to a lesser extent Brazil and Canada.
A decade ago, it wasn't unusual to hear that Saudi was going to produce 20 or even 25 mb/d by 2025.
Well..
'Keeping oil capacity is challenging says Saudi Aramco'
We will likely see a stagnation of Saudi production for the next decade, at best.
The question, as always, is how much will the new oil finds compensate for the increased decline rates elsewhere.
But we can now, with high accuracy, say which three, four countries will essentially have to come through in the coming decade for the situation to continue to stabilise.
The mirage of unknown amounts of gushing oil is dead. And that means that if these four countries(US, Iraq, Canada and Brazil) don't produce as they should, there is nothing to put up as a fig leaf anymore.
You could add Iraqi Kurdistan that given stability may chip in with 2 to 5 mmbpd over a decade and the African continent, no single country here but much activity in E African rift, the Indian Ocean Margin and off shore West Africa, e.g. Ghana.
'Keeping oil capacity is challenging says Saudi Aramco'
A while back (it had seemed like years to me but it was actually March 23, 2012--is it just me or did this last presidential election cycle actually stretch time?) Joules Burn posted From Qurayyah to Khurais: Turning Water Into Oil which contains links to part one (9:47) and two (13:06) of From Qurayyah to Khurais
the following are direct YouTube links to the same
part 1
http://www.youtube.com/watch?v=axjEk8zDvy8&feature=relmfu
part 2
http://www.youtube.com/watch?v=C7MH9MhOpRk&feature=relmfu
My end of the wire bottom of the line DSL connection made loading those clips downright painful but it was worth it. It is a very well done animation and really fleshes out the process your linked article describes.
EIA Russia Crude Oil & Lease Condensate Production January 2000 to June 2012
EIA Saudi Arabia Crude Oil & Lease Condensate Production January 2000 to June 2012
EIA United States Crude Oil & Lease Condensate Production January 2000 to June 2012
Let's suppose that one accepts the premise that obtaining accurate figures for total world crude production is going to be problematic at best, and that we are dealing with ballpark figures, to use that term lightly. And this premise is based on the idea that statistics on oil production are undoubtedly politically motivated, and that even if transparency was as good as former American standards, we would still be dealing with rough estimates.
Alright, if one accepts this premise, then one must conclude that dealing now with "world total liquids" will be even more problematic, especially in an era of permanent economic contraction and what will inevitably be defunding of areas thought to be secondary or academic.
I suspect this is largely true now. I do enjoy these posts, but what we should admit is that only country by country production and import/export stats have any meaning now, and even those may be largely tampered with.
It is possible and in fact likely that world production could soar while entire countries find themselves out of the market, or that world production could plummet even while a select few are always able to fill their cars and jets.
This was always the danger of peak oil, wasn't it? That the forces it would unleash would in fact undermine any attempts to properly categorize, understand, and deal with it.
Perhaps there never will be a PO 'aha moment'.
Various clever schemes may continue to extend the liquids production for decades, while all-liquids/capita (of course even worse with 'traditional oil/capita') slowly deceases, and adaptations (fewer and fewer vehicle miles/year driven, more smaller/more efficient vehicles, more ride sharing, more bikes and e-bikes, more Transit-Oriented Development (TOD), more public transit, more telecommuting, more simplifying, more doing less with less, more walking.
There will be for quite some time an upper crust which will be able to afford the large vehicle SUV/truck 'Happy Motoring' concept, but increasing numbers of people (eventually the great majority) will adapt to less fast/heavy/frequent mobility, with more public mobility options.
It won't be a matter of what people /want/, it will be a matter of what must be.
Yes Ulan. But you only list quite positive things; Transit, walking, cycling, TODs etc
I think it is clear you also need to add rising inequality as energy access is priced out of reach for more. The wealthy will all buy luxury low mileage hybrids or EVs and enjoy emptier roads and complain about the increasing numbers of the poor. It is unlikely that many will understand or accept that the ultimate cause is resource scarcity but will continue to blame laziness and state support etc for the breakdown of society and physical infrastructure. And ultimately institutions. This has begun.
The powerful will continue to fight to control society's investment to suit them, ie will still be building highways even though the transit and rail freight sectors desperately need investment which would help the slide down the slope a great deal.
But you're right I think there still won't be acceptance, no one here will be thanked! It'll largely be blame and denial.
Patrick R
My post and your reply are in no way in conflict.
I did not mean to paint such a future as happiness and light.
I agree with your prediction that that income/wealth/ resource inequality distribution will continue to skew towards a rather small number of wealthy people...and the rest.
My point is that change may be gradual enough...over the course of several decades..and including the time already on the meter, that there may never be a PO epiphany...no profound Presidential fireside chat series on the TV machine to the country stating the situation, no mass realization, and a fading memory of how things were, residing in the old folks, and the knowledge of how things were and how things came to be, among a small number of scholars.
It didn't even cross my mind whether TOD site creators or luminaries would be thanked or blamed...when the post-PO phase transition is ~~80% played out, perhaps TOD will be a faded memory known to a few obscure researchers. TOD is a small internet site with a rather limited influence on the World presently...no disrespect, just the observation.
PO web search interest:
http://www.google.com/trends/explore#q=Peak%20Oil%2C%20&cmpt=q
PO vs pizza web search interest:
http://www.google.com/trends/explore#q=Peak%20Oil%2C%20pizza&cmpt=q
The Google Analytics site list 30 people active on TOD right now...given, it is Thanksgiving in the U.S., but still...for the vast majority of people, PO...let alone Limits To Growth, or sustainability, isn't even a term in their vernacular.
Global Warming and/or Climate Change has much higher 'term awareness', yet this means very little in the way of provoking positive action.
So how can we get Peak Oil associated with the Pizza movement? Pizza activists seem to be good at getting the message out.
Peak Oil, Pizza, Climate Change, Global Warming, Prius
http://www.google.com/trends/explore#q=Peak%20Oil%2C%20pizza%2C%20climat...
Looks like Prius is about as searched as global warming and more than climate change.
Global Warming, Prius, Chevy Volt, Nissan Leaf, PV
http://www.google.com/trends/explore#q=global%20warming%2C%20Prius%2C%20...
PV more searched than Global Warming, more than Prius.
Environment, Cars, Earth, Pizza, Jobs
http://www.google.com/trends/explore#q=Environment%2C%20cars%2C%20Earth%...
Jobs beats cars, Earth, Pizza, and the Environment. Very odd drop-off in the Earth.
Jobs, Love, Sex, Porn, Food
http://www.google.com/trends/explore#q=jobs%2C%20Love%2C%20sex%2C%20porn...
I think we have a winner. Between sex and porn the Earth is a distant memory - not even Jobs matter.
Peak oil needs to be sexy.
Bush I: "Jobs not Owls"
Didn't PBO just make public statements to the effect of 'Focus on Jobs, not Climate Change?'
Yes, he did :(
skip to 1:10 and listen from then on if you are impatient...
http://whitehouse.blogs.cnn.com/2012/11/15/obama-focus-on-jobs-not-clima...
Maybe if folks have to bicycle and walk a lot more, they will get into better shape and the sexy will follow from that!
The First Rule of Fighting Climate Change: Don't Talk About Climate Change
Luntz know his subject.
The vast majority of U.S. Americans will not listen to lectures ans scolding.
It grates on many enviros' nerves, but it is what it is.
Ulan - Very frustrating for sure but not unique to the enviros. I suspect many here working in other fields have had the same experiences I've had. Many times I've had to explain (read: sell) complex technical matters to unsophisticated investors. Not only ignorant but also suspicious…a natural state of anyone who someone else is trying to get money from. I’ve seen more than a few geologists screw the effort up. First mistake: going into detail as to how much the listener doesn’t understand the subject. Most egos don’t tend to respond well. Second, trying to force them to absorb technical details they really don’t care about. Everyone here can imagine similar bad angles so I’ll stop there. I've seen geologists more interested in proving how smart they are than closing the deal. I suspect some enviros fall into that same class.
So how do I sell them: generate desire to improve their lives. For oil patch investors the specific motivation is simple: profit. So that’s my focus. I approach it ethically…some don’t. Both sides of the effort manipulate the listener. And that brings us to your point: find an approach which creates the mental image of personal gain. I’ve never found an investor that was motivated by the idea of drilling a well to help me or anyone else out.
Except that plug-ins (PHEVs, EREVs, and pure EVs) are entirely affordable - their lifecycle cost is at or lower than the cost of the average new light vehicle.
Heck, the Prius C costs 60% as much as the average new vehicle, and uses 40% as much fuel as the average vehicle on the road.
For better or worse, "happy motoring" is in no dange of being unaffordable - ever.
After 10 years, less than 1% of the cars on the U.S. roads are hybrids, getting only 40% better mileage. We will not get to "oil independence" at that rate.
The last 10 years includes the weakening of the California Zero Emission Mandate, General Motors crushing the EV-1's and little effort to convert. The progress during the last 3 years might be a better indicator of the future trajectory.