Consumer Confidence and Gas Prices
Posted by Stuart Staniford on November 30, 2005 - 5:38am
The Conference Board, a private research company, said that falling gasoline prices and an improved jobs outlook had lifted confidence in November to a reading of 98.9, up from 85.2 in October.Intrigued by the idea that gas prices are a major driver of consumer confidence, I wondered if the connection is really that strong. Militant empiricist that I am, I went and got the data...
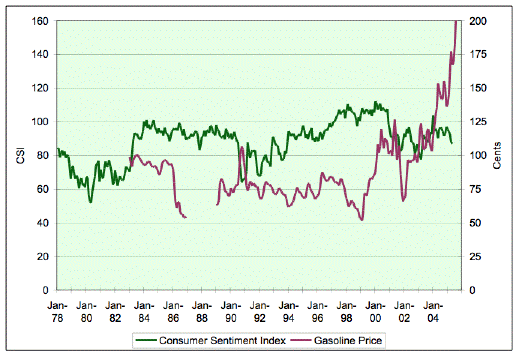
Consumer Sentiment Index (left scale), and gasoline price in cents (right scale). Gas prices are nominal (ie not adjusted for inflation) due to laziness and difficulty finding long monthly CPI deflator series.
Just in case the situation was better at short range, I constructed month on month percentage changes and examined those. A short section of the plot is shown here (I didn't want to count on you having a 30" flat screen as I am fortunate to).
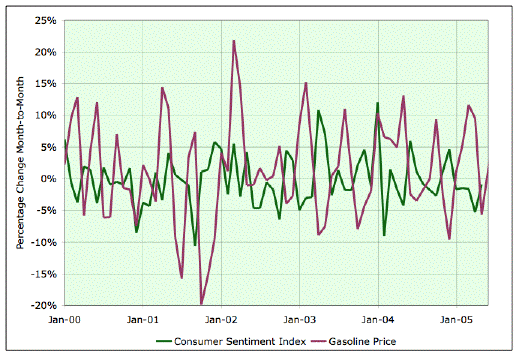
Month on month change in Consumer Sentiment Index and gasoline prices from Jan 200 to present. Gasoline prices are not adjusted for inflation, but this is probably negligible in month-on-month changes.
But, who's to say that this month isn't the one the 7% is showing up - hard to falsify the AP reporter altogether.
Contact
- Content: editors at theoildrum dot com
- Tech support: support at theoildrum dot com
License

This work is licensed under a Creative Commons Attribution-Share Alike 3.0 United States License.
Inflation is also incredibly important when dealing with price issues - although, admittedly, I'm not sure how important it is in this particular case.
For future reference - this is how you do it. I'm assuming you are using excel. Build yourself an inflation column, to be used whenever you need it. I'll send you mine, it just depends on whether you trust it or not.
In the meantime this is how you build one.
Two sites. One uses CPI, the other GDP deflator, or whatever. If they are the same, whoa did I make a mistake.
http://www.westegg.com/inflation/
http://www1.jsc.nasa.gov/bu2/inflateCPI.html
I just checked them, they are both CPI, but they are different(yet similar) - there must have been a reason I chose to do it this way at the time:) Doesn't matter, add a GDP one in for your own recipe.
Make an excel table. List your years down the left. Get the percentage change year to year. add these values.
The trick is to build the damn thing. I averaged two sources. Whether this makes mine less accurate or increase the chances of it being accurate in the first place is anybody's guess.
The farther we progress into the future from the past, the less important accuracy concerning the past is. As long as we are in the ballpark.
My favorite example of this is Michael Economides' chart in "The Color of Oil" showing the inflation adjusted price of a barrel in the 1880's as about $200. The book was written in 2000. In 2002 he took part in a debate with Deffeyes and a couple of other academics in Houston, I believe. I have read a summary of the debate. In it he claims that same price in the 1880's as $1000. Now that is a discrepancy that deserves an explanation.
So anyway, once you have your list of yearly percent increases you just cut and paste into any spreadsheet with nominal values.
My number for 1983 in 2004 dollars, for instance is, 87.85%. If you come up with 95% or 70% it doesn't really matter. Ballpark is key. We are just trying to get the graph to make all years appear closer to reality, i.e 2006, then they would be in nominal values. But you already know this.
Like I said, I'll send you my list. Laziness is not an option.
Is there anyway you can convert the Consumer confidence to yearly, or a 12-month moving average?
What about comparing percentage change rather than overlapping price and CCI numbers?
Maybe I'm the lazy one. But laziness cannot be an excuse, so I've got to find another excuse. Hahaha.
I really like the idea you've got here on this correlation, I'm just trying to think of an accurate way to measure it.
The Pre-Clinton CPI numbers are bigger because inflation was much bigger(Pre-Greenspan).
If inflation was 12%(I'm guessing) in 1978 versus %1.5-%3.0 in the 1990's, that 12 percent is not going to compound.
For the sake of argument,let's say inflation was 12% in 1978 and 1% every year after that. Well 1978 dollars would be converted to 1979 dollars(in 1979) by mutiplying them by 1.12. End of story.They are now 1979 dollars.
In 1980 we would be converting 1979 dollars to 1980 dollars by multiplying them by 1.01. The 12% is history.
If we revise that 12% to 15% later we only have to go back to the one calculation in 1979 to make the change. There is no compounding.
For instance, if we start with a dollar in 1970, and call inflation 5% in 1970, and 2.5% every year afterwards, we get $1.31 in 1980.
If we go back and correct inflation by a huge 5% in 1970 to 10%(highly unlikely, worst case scenario), we get $1.37 in 1980. 6 cent difference. But 5 cents of that occurs in first year, the other cent takes 9 years to accumulate due to this compounding.
Assuming corrections happen in both directions, cancelling each other out over time, would it be reasonable to assume that that "ballpark" is again the key to dealing with inflation?
Thank you. I like very much the level of detail, effort and intelligence that you always put in your articles.
As I've said somewhere else before, what would happen if we charted oil prices in Euros instead of US dollars?
I know that oil prices are high in Euros too, but, have you considered that the US dollar is not as strong as a few years ago?
For instance, other commodities (grains, gold, silver, etc) are expensive, too.
As a local analyst said to me: "The only cheap thing is the US Dollar".
Fernando
Alan Greenspan, who is a deep student of economic indicators (no matter what your view is of his policy setting record) has little regard for consumer confidence, because he believes that consumers simply spend all they have, at least until you get to the upper income brackets. Therefore personal income is a better predictor of spending behavior. So far, the way we see consumers going mad for the Black Friday Christmas deals almost regardless of the economic outlook, would seem to prove him right. Most Americans seem to spend like crazy as long as they have a job.
Just as a side note: I happened to have spent last weekend in Detroit. The Detroit Free Press carried lots of coverage about Black Friday consumer madness, noted approvingly (at least it seemed to me) when it discussed families who had figured out how to scramble for the latest and greatest gadgets on their list. Just after GM announced the closure of 17 auto plants, which is not exactly good for Detroiters. Is this a sign of addiction, or what?
But here's a tongue in cheek prediction: if it's a cold and "peaky" December, the major influence on the subsequent consumer confidence stat will be the number of times "I'm Dreaming of a White Christmas" get played at WalMart.
http://www.conference-board.org/economics/methodology.cfm
1- There are many kind of confidence index, some are related to the current business conditions for instance. The age subgroup may also have an influence.
2- gas prices are significantly higher since 2003 which gives only about 24 months of data where there is maybe a potential connection(the consumer index is available only up to May 2005).
I'm not inspired to do more - the correlations are almost certain to get even tinier the further away we look.
It's a pity we don't have the data from the seventies. That might show more of an effect.
Anecdotally speaking, although folks gripe when gasoline goes up, they have become accustomed to an initial high spike and downward correction. At the beginning of this last spike, coworkers told me that gasoline was still a bargain because it had not risen with the CPI. As it drifted over $3/gallon, even our estimators seemed a bit nervous. If gas had stayed near $3/gallon, that might have made an impression, but once again it fell almost back to where it was, so, "all is well again, I think I'm gonna be alright."
To look at the correlation in the early 70s, when this situation was more severe, or the next few years, when Peak Oil instructs people that there is a bottom to the energy well, might create a negative correlation, where one did not exist in a 20 year bull market in stocks where everyone was fat and happy.
So then, if you want to make a correlation, why not try Consumer Confidence vs the number of announced jobs that have been cut...ala GM's anouncement of some 30,000 jobs, or Ford's 4,000 jobs. This is what gets consumers' attention.
I think that's where you will see a more robust correlation.
I suspect the memory of the past is short, and present cash flow and fear of the future are going to have more of an impact.
The fuel price spike from the hurricanes probably did not get big enough or last long enough to affect consumer confidence much, and therefore the smaller changes (in what was a pretty low cost to begin with) are probably not going to show up either. So I guess the lack of correlation is not surprising.
Indeed, the expectation might even be for the opposite; a strong economy should boost demand for gasoline and thus gas prices and simultaneously increase consumer confidence.
But a price spike, if sustained, will clearly hurt the consumer. As a result, the recent drop in gas prices, as it was believed to signal a "return to normal" and not, what it actually is, a temporary reprieve, has boosted consumer confidence significantly.
What we have seen is a massive sigh of relief; the irony is truly tragic.
http://thinkprogress.org/2005/12/01/oreilly-lowers-gas-prices/
Also, another good article from Tom Whipple:
The story, which appeared on November 24, reported that on October 5, the Secretary of Energy wrote to the National Petroleum Council (NPC) asking "for a study of the industry's ability to produce enough oil and natural gas at prices that won't cripple the economy." Craig Stevens, an Energy Department spokesman, amplified the letter by saying "He's asked them to take a big-picture look out several years... He wants to get some definitive information"
http://www.fcnp.com/539/peakoil.htm