Graphs that Blow Your Mind...
Posted by Stuart Staniford on January 30, 2006 - 12:03am
...or break your jaw when it hits the floor. I was working on a different piece when I stumbled across these numbers and I couldn't resist posting this graph immediately.
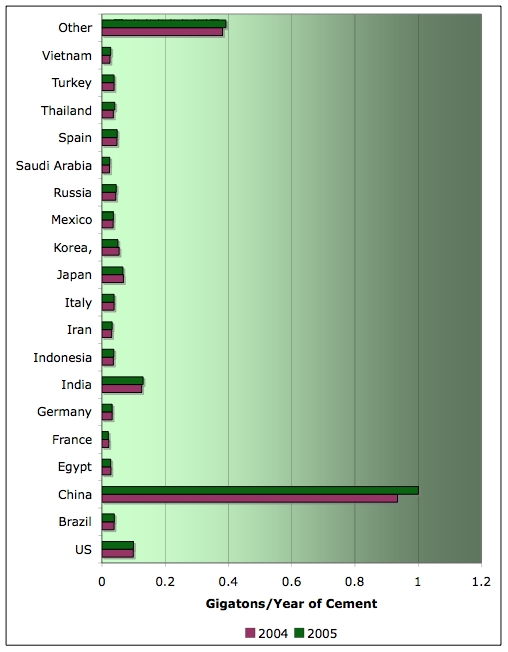
Annual production of cement by country in billions of metric tons. Click to enlarge. Source: USGS.
Cement is mainly used to make concrete, and is sort of the "active ingredient" in concrete - it is combined with sand and gravel in roughly fixed proportions. So cement production is a rough proxy for the total amount of construction going on in a country.
“If kindness and comfort are, as I suspect, the results of an energy surplus, then, as the supply contracts, we could be expected to start fighting once again like cats in a sack.”
—George Monbiot
Contact
- Content: editors at theoildrum dot com
- Tech support: support at theoildrum dot com
License

This work is licensed under a Creative Commons Attribution-Share Alike 3.0 United States License.
CaCO3 + heat > CaO + CO2
and the heating of limestome to
make the CaO is done using a
fossil fuel, and the cement is
transported to the construction
site using petrol/oil vehicles.
So all that concrete equates top a
massive contribution to global
warming.
So our debate now should be centred
around 'which will get us first,
energy depletion or abrupt climate
change?'
"We Are Officially Fucked - A blog called The Oil Drum is now going to focus its attention on the carbon cycle just as data showing possible 10% declines surfaces"
/sarcasm off
Seriously guys, what the fuck?!
And while I can curse with the best of them, this site does not really benefit from poor language all that much.
...understood about the language. Beer/fatigue does strange things to vocabulary. :)
1) here is a link to one estimate of the embodied energy in cement
Clearly cememt requires much energy to create and transport.
2)I just got back from 4 days in DC meeting with energy wonks and environmental NGO types. Enviros are very interested in the link between peak oil and climate change, as the main current liquid fuel options are biofuels and fisher-tropsch CTL both impacting GHGs
- I learned how severe and relevant the US current coal shortage is- the tracks from the Powder River Basin have been damaged from the coal dust mixing with water over time. There is also a limitation of coal cars. The bottom line of this is it is impacting future natural gas prices - even with the mild winter, post 2006 natural gas prices keep going up, because NG and coal make up majority of our electricity grid.
- I also discovered that "Peak Oil" while worrisome, may not be the nearest danger. US has been running at 100% capacity for 18 months in natural gas production vs deliverability - this is the first time this has ever happened. There is plenty of crude available (presently) but the ability to refine it and DELIVER it is what is most fragile. These deliverability problems in refined product and natural gas mean there is little room for error (or growth)
- Essentially, the short term (medium term?) limits to coal, the tightness in natural gas deliverability and the refining and delivery limitations point to the possibility of an energy train wreck in US that could occur with world crude production still on the upslope - I need to research this new direction and will post some links
So, cement production is VERY central to peak oil, as it is energy intensive and shortages there limit scalable alternatives to oil. Everything is linked at this point. There is not alot of switching ability. One a bright note, I met with an efficiecy expert who is writing a paper suggesting there still is a great deal of low hanging fruit in US that can reduce energy use and increase efficiency, with behavioral changesSo:
a) China is using a HUGE % of their oil to make cement.
b) China is using a mix of other energies (coal, hydro, etc) to make cement.
Again, I second Stuarts observation that this is jawdropping.
Just as in the Great Leap Forward when every bit of spare metal was contributed to communist party to create iron for growth, it seems that its happening again, yet cement is the goal....
And cement production in China is inefficient. There are hundreds of small plants, both wet and dry processes, and the local environmental impact is severe.
It's no joke that that national bird in China is the crane :)
If you have something specific, I'm all ears. But otherwise, I'm moving on. The figures below seem much more relevent to this board and my concerns.
1,000 / .60 = 1,666.66667
1,000 / .65 = 1,538.46154
1,000 / .70 = 1,428.57143
I look forward to more discussion on oil and decline rates now that it's probable that we past the 50% mark ten years ago, ironically when Hubbert originally predicted it would happen.
I do have one problem and recommendation: Acronyms that become part of the TOD vocabulary. I do not mean the silly ones like IMO, but the technical ones pertaining to oil.
I am acronymed to death. There should be a place that lists the acronyms and their meanings. Otherwise, anyone coming in here for the first time is bloody lost. I get lost, and I come here twice a day! Maybe a popup that could give definitions?
I am no expert on concrete/cement, but I recall that the curing of cement is a pozolonic reaction that absorbs CO2 from the atmosphere(as long as there is sufficient moisture). This re-absorbtion of CO2 should be approximately equivalent to the CO2 release during the calcining process.
You might consider looking it up as a good memory does not equal pale ink...and mine is surely not a "good memory"
My position was actually contrary to the idea that "dams are always bad" because it's got to depend on what kind of biosphere you are flooding, and what kind of preparation you do.
OTOH, Three Gorges looks pretty forested, and too big to be really scraped and cleaned (with vegetation hauled off to be buried in dry ground as CO2 incarceration).
Does anyone know if the CO2 emitted by cement production is counted towards a country's emissions for Kyoto?
It's all high-rise apartment blocks and roadways, equivalent to building a brand new Houston from scratch every year.
It's the same process the U.S. went through in the early 20th century, but a lot faster, and with a lot more people, and with cement instead of wood, because there just aren't that many trees to go around.
Other major and even "midsize" cities are planning comparable systems in proportion to their size.
Also, concrete is commonly made with coal in China.
I was well aware of these concrete #s (as of 2003/4) already. Steel production went up 40% in a recent year.
http://www.latimes.com/business/la-fi-chinabubble8jan08,1,4708397.story?track=morenews&coll=la-s tory-footer&ctrack=1&cset=true
I'm kicking myself now for not making a copy of the content while I had the chance.
For example, if the peak is now, 5 years from now will our knowledge and analyses have improved to the point where we can say for certain - "We peaked in 2006, and it's all down hill from here". Or, say the peak will happen in 2015....in 2010 will our analyses have improved to the point that we can say fairly certainly that peak will occur in 2015?
I guess my question is about the sources of uncertainty in all of the models and analyses. And whether these uncertainties are diminishing over time, or will they still be just as uncertain 5 or 10 years from now as they are today?
Simmons says that we will only know the peak date after we are well past it and have the production data to look at. If this is so, it seems like it will be difficult to get people/countries to agree that there's a problem until after it's already too late.
TOD is in its early days, less than a year in, perhaps only 6 months since it really grasped its reality. Consider this the 'exploratory days'.
In 5 years peak will probably be past and the TOD emphasis will have likely changed to analysing and modelling decline rates. There will have been spin offs to explore mitigation, conservation, survival, technologies.
Meanwhile, data will get better (one hopes), models will be refined, hypotheses will be tested. Yes, the picture will be much clearer. But that may not be a comfortable feeling.
Certainty is unreal. Who knows which flap of wing might dramatically change reality? What is unclear now will be clearer in future, but other important things will be unclear then. Accept uncertainty, for it will always be with you. Seek to know the times of change and risk that you can be alert and responsive. Tune in ;)
Back in the '70s, my employer added automatic adjustments to its large contracts for fuel and asphalt. The prices went up so suddenly that if we held the contractor to them, the contractor went bankrupt. So now the price we pay them for those items increases automatically with the market price. Last year, we added similar automatic adjustments for concrete and steel.
I was just reading this article, from the Grand Rapids Press:
Material Costs Put the Heat on Business
The costs of plastic, resin, steel, etc., have all spiked.
...last year, cold-rolled steel was up 66 percent while hot-rolled steel surged 124 percent, according to the Bureau of Labor Statistics.
The article doesn't quite put the pieces together, though. It talks about how energy prices are killing business, and about how commodity prices are just as bad, but doesn't seem to realize there's a link between the two.
Some business owners seem to be hoping China starts to export steel, and floods the market the way they have with clothing and gewgaws. I'm not holding my breath on that one.
This is about my personal observations on concrete, energy, betterment of lives and the fascinating situation in China, also points north:
Long winded preface that has relevance:
I've been in alternative energy research for 35 years, including for Exxon, EPRI, others. My curiosity is high about everything. It can be manifested by such things as tracking power lines in the Yucatan jungle to see where they go (In one case a Maya pool hall). I am also very interested in and have published on climate. My house has also been a low rent refuge near Stanford in CA for foreign grad students/ scholars at about 1/2 the normal rent around here. The students and I have greatly enjoyed the arrangement. Among others I have housed 10 Chinese (PRC) scholars over the past 10 years. That's my China connection.
So -- with a backpack no less -- I went to Beijing (a) at the invitation of a Chinese Ph.D and and (b) for a USEPA/UN/China Global warmimg conference
http://www.ergweb.com/methane_china/
Gave a paper on landfill gas energy which is actually very greenhouse cost effective wherever it can be done in the world.
Shown around greater Beijing (greater area than Belgium) by my grad student friend for 10 days. (Bus. and cheap cabs were about 25 cents US/mile) I was stunned, awed by the number of construction cranes with heights probably 100 meters. Not just one at a site but in clusters of 3, 4, 5, simultaneously at work, building, on and on. Photographed a few thousand.
I lived in Manhattan 40 years ago. The Badaling highway north from Beijing reminded me of 3 or more Manhattans jammed together complete with crowds and traffic that is already approaching maddening.
China undertakes a massive task -- to bring say 20-30 million previously impoverished people each year to a better life. But note that those 20-30 milion people a year are only about 2% of their population annually attaining that better life. And speaking with my friends, life is getting better even though needs and arguable shortfalls and flaws and hurdles remain great,
Economic activity, and materials and energy use as China strives for these things strongly affects the world. China is becoming to us somewhat like Pierre Trudeau of Canada once said of the US--like being in bed with an elephant. It is not in the least surprising that Chinese purchases about doubled the world price of steel scrap and concrete last year. Or that Chinese consumption will be a huge factor in world oil and natural gas. And climate --they well recognize this but when you want to raise the standard of living of well over half a billion people what can you do? China is short of wood--thus relying heavily on cement.
China gets into some CO2 abatement solutions. Merits of these will vary according to persectives. There is the 3 Gorges 20 GWe hydro project, and China recently finshed constructing a couple of Canadian CANDU natural uranium/thorium reactors in fine style. But I do not know how much greenhouse-neutral energy they are developing in their total mix. I suspect there are major gaps in statistics, in the same way that elements of internal Chinese economy were not measured. Just the inclusion of these in World Bank figures raised Chinese GDP from sixth to fourth in the world
Took the railroad north to Mongolia, Siberia and Moscow. All the way north to China/Mongolia border at Erlian power plant after power plant is under construction. All coal fired. Even in Mongolia where pop is about 2% of China's the coal fired electric plant construction goes on. Got photos. And later on the great trans-Asian Siberian railroad artery I recollect clocking returning empty Russian coal trains at about one every 10 minutes. I do not know whether Russian coal consumption goes up or down but back of the envelope tells me that each train has fueled about half a gigawatt-day. This is big time. Is Russian coal-firing of electricity sparing natural gas for sale to Europe -- including the Ukraine?
Stuart--another great post. I recognize that I have rambled on and postings should be relevant. But all of these many issues like cement and Chinese energy are extremely relevant to peak oil. Your post has prompted me to release my own pent-up thoughts.
Better get used to coal. With so many environmental thickheads around nuclear will not make it.
/ramble off
I can only hope that we get to it before we've dug up and burnt every bit of coal we can fid, destroying our land, water and atmosphere. But unluckily I don't believe so - coal is the easiest path to take both for the West - because of the lack of opposition and for the East because it is still abundant and requires less capital investments. Eventually we are all toast:
LevinK, you sure know how to win friends and influence people :) Nice graph by the way. I'm curious how wind could emit more CO2 than nuclear "during burning". For the record, I think nuclear is too expensive, too risky (melt-downs and appropriation of fuel by "rogue" elements) and an environmental nightmare for future generations. The money would be better spent on renewables and necessary storage devices (for example).
I've got another proposal. Why don't we all get rid of the cars and trucks and start commuting and carrying things around with human and animal-propelled vehicles? Is it possible? Sure it is. Does it fit our current living arrangement? Hell NO. That's what enviromenatalists do regarding the nuclear power alternatives - poke around some seemingly feasible solutions which unfortunatelly is worthless in the real world. It would be funny otherwise but somehow I don't feel like laughing - the end result is that we see more and more coal power stations, CTL, tar sands etc. not wind and solar.
BTW how many nuclear meltdowns being "environmental nightmare for future generations" are you ready to point out? I'm offerring you a real picture of an environmental nightmare happening here-and-now. Eventually here is what you get:

Go with electric cars because they are only twice as expensive as gasoline cars.
Nobody will want to make a 50 year invenstments worth several billion if he/she does not have some certainty in the future. With the public feelings largely hostile to nuclear power how do I have a guarantee that the next administration will not simply shut down my plant so that it wins the elections? It's very simple - yes, enviromentalists do not have the influence to enforce any decision directly, but can very well stop some things from happening by modelling the public opinion.
The vital point here is that these things are of nature that does not require average Joe to make any sacrifice. It is easy to bash nuclear as long as there is coal. It's a peace of cake to stop building a new refinary as long as there are imports. The final result is that we get a zero sum game - we may improve some things locally but we don't change anything on a planetary scale.
Here is a formula that can and will work: electrical transportation, 70% nukes + 30% wind and solar. But we will never do it because we are too dumb for that.
FWIW, I think some nuclear power is inevitable. I think that we will have to do everything, wind, nukes, coal, to keep up when peak oil hits. The U.S. doesn't have the engineering, construction, or manufacturing talent anymore to concentrate on one thing. So I think the chance for 70% is out; but some percentage will be nuclear for sure (if we don't collapse).
But to get started the U.S. reactor industry will just have to build a couple. Do what corporations do all the time; put the thing in a poor area where there are few residents who have any political power or desire to resist it. You only get effective NIMBY in rich areas. IIRC, Toshiba is building a demo pebble-bed for an Eskimo town and giving it to them gratis. Yeah you'll have to invest $1 billion without a guaranteed return (though I think the risk is minimal), but you'll have something to point to.
Ask yourself how many of them will be reelected if they openly advocated nuclear power in their own state. You can call "pronuclear" the Congress as much as you want but I don't see that fit very well with the fact that no nuclear plant has been built in US for the last 20 years.
We've become an elderly and self-content society that is unable to face changes and the depletion of fossil fuels will be the change that will most probably leave us in the back pages of history. We are obviously unable to meet it, we are locked in our windy/solarly/efficiency delusions and that's where we'll stay until TSHTF.
If nuclear was cheap and risk free, I would agree with you. Your assumption that I would like us to go back to either human or animal powered transport is incorrect (although a bit more walking/cycling would do wonders for the obesity epidemic, and probably help reduce consumption of Prozac too).
Here's my formula (roughly modeled on Lovins):
Efficiency + European mileage on non-hybrid vehicles + biofuels + plug-in hybrids + solar + insulation + distributed generation + wind + smart grids + cogeneration + HVDC transmission + nanotech battery technology + emerging storage technologies = roughly the same creature comforts we enjoy now.
Hopefully we'll do it because it would be too dumb not to.
Nuclear is cheap. Fuel cost represents mere 9% of the end-cost of electricity compared to 60-70% for coal and NG. 9% - this should be able to say it all. With fossil fuel prices going through the roof, the only thing that remains cheap and abundunt is nuclear. And it can be even cheaper as the resource base is virtually limitless when you include uranium in seas and the breeder reactors.
The bulk, the other 91% of the energy cost is for repaying the construction and waste disposal. These two costs have the potential of dropping at least in an order of 2, maybe even 5 times. For the construction we are simply missing economies of scale: there is not enough standartization in the industry - shortly said there is no "conveyor" producing nuclear plants. This is primariliy result of the disinvestment in the last 20 years due to the cheap fossil fuels and the opposition from enviromentalists. For the waste disposal... it is actually ridiculous. A single large fuel reprocessing plant and a waste disposal site in the middle of Sahara can solve the problem of the whole world. How much will it cost? 40-50 billion!? This is breakfast money for the world energy industry and will get repaid for 5 days in electricity production. Instead every country is trying to handle it on its own, spending almost as much money to overcome NIMBY-sm as it would cost it to build the damned thing.
I'm already pretty much certain that the vested interests from coal and oil industries are the main reason these otherwise obvious things not to happen.
As long as the risks go - ok, there are risk of catastrophes. But tell me what is the thing we humans do that does not envolve risk? How much is the risk of a catastrophe ala Chernobyl? 1 / 1000000? And how much is the risk of a collapsing society in 20-30 years? 100%?
LevinK, I agree with you. This is the point.
The USA import 60% of crude oil. The oil production will decrease year by year. The world oil production will peak very soon (or maybe now). There will be a fierce competition to get oil internationally.
The coal production peak will happen in USA between 2035 and 2060. If we increase the production of coal to replace other energy source, the peak will come earlier than that.
The natural gas production is peaked in North America. The USA needs to import LNG more and more from now on. The world natural gas peak will happen around 2030. Most of natural gas reserves are located in Russia, Iran, and Qatar.
US primary energy is supplied by oil (40.4%), Coal (23.3%), Gas (22.8%), Nuclear (9.0%), Hydro (1.1%), Waste & Renewable (3.0%), and Geothermal & New Energy (0.9%).
If you look at those numbers, you will know that nuclear energy must be with us for energy security. New Energy and Biofuel can mitigate only a small fraction of energy problems because they have issues in energy density and availability. France and Japan have worked on nuclear energy from the point of view of energy security rather than economical reasons. We need both nuclear energy and energy conservation for our energy security. Japan has an energy conservation agency (http://www.eccj.or.jp/index_e.html). Why don't we have this kind of agency to encourage energy conservation?
We are moving out from a country with abundant energy to a country which needs to import a lot of energy resources. We are entering a period of paradigm shift about energy issues.
Moral Free Riders.
These are people who have the luxury of advocating positions for which the consequences may be undesirable yet enjoy the "moral high ground" of advocating popular but unworkable policies.
As I've written in these comments sections before, some of us have day-to-day responsibilities for the safe operation of energy generation. When the lights go out, friends, neighbors, other citizens look to us and hold us accountable.
Some people are free to advocate wind mills and solar panels all they want - if they don't work out, so what? They will move on to some other trendy subject while complaining about those of us left holding the bag.
While I welcome responsible interest in world energy production issues, I have no respect for moral free riders.
Yes, solar and wind can play a role but it will be a tiny one. Domestic solar hot water is one application that I think deserves wider application. Solar electric panels connected to the grid and big wind farms are demonstrably a waste of money.
I wish! And as for nuclear being cheap, did you see my post that decommisioning UK nukes is going to cost $98 Billion or more than 5% of UK's GDP? For the record, I am paid by no-one :)
Actually my home country - Bulgaria has started decomissioning 2 of its 6 nuclear reactors, mostly thanks to the pressure from european idiocrats and ecofacists. The decomissioning of the total 4 reactors due will cost about $1 billion, which have been raised from the plant operation just for several years. So, what do you have in UK that requires $98 billion? 400 nukes? Or, possibly Bulgaria is more technologically advanced? Everything is a matter of will and organisation. I guess you can make it both for $9.8 and $98 billion - whatever your accountants say.
And when the free market applies to Nuclear power, I'm all for it.
Get rid of the Anderson damage cap and make power firms responsible for the long term risk of radioactive waste.
Solar electric panels connected to the grid and big wind farms are demonstrably a waste of money.
Based on what? A comparison of out of pocket costs without government subsidies?
With the government law capping damage and power producers having to take on the waste, nuclear looks very profitable.
Nuclear power in a free market doesn't work.
But while these are both viable solutions, there is still a huge investment to be made in infrastructure, and I don't think we'll be able to make it in time. Especially with what I suspect is going to happen to our economy very soon. The key issue to me is whether we'll be able to make these transtions soon enough to be able to maintain food production and distribution.
So instead, we'll just go with coal for everything we can - with all that implies.
Coal is baseload.
Nuke is baseload.
Geo is baseload.
Biomass is baseload.
Wind is intermittant.
Solar photovoltaic is peaking and intermittant.
Gas is peaking and standby.
Hydro is peaking and standby.
Solar releases hydro and gas from peaking use to standby use.
Another way is to add more basload capacity and more electricity use that can be turned off and on on a short notice. My favorite is right now electrolytic hydrogen manufacturing.
As has also been pointed out if non-breeder reactors were adopted on a large enough scale to replace a oil depletion post peak we would soon be reduced to mining for lower grade uranium ore and the greenhouse gas emisions from mining and refining would rise to significant levels.
Again all of this is not science fiction it's doable on a large scale and can get started now - if only we did not have that NIMBY and BANANA thinking.
Apparently you are using a new definition of rational that I've been unaware of up to this point in my life.
Any idea when we'd hit peak-uranium? I've done this before, here. Even using optomistic industry stats you'll be dealing with peak oil by mid-century (assumming you really could build fast enough to provide all the projected power we'll need, and convert it into whatever form is needed).
To update this line of thinking, I gathered uranium production data from 1945 for non-Communist countries from industry sources and provided to Stuart. We thought that Stuart could find the time to apply his statistical analysis techniques to historical production data.
However, when one looks at the last 60 years of data, it is clear that we've just begun uranium extraction and are in that early, noisy part of the curves where predictions would be extremely unreliable. Perhaps Stuart would like to comment on this further since this is my conclusion and I wouldn't want to speak for him.
Historically, uranium mining is a very new mineral extractive business, unlike tin, iron, or even oil. The Uranium Information Center (Centre?) make a good point that we are still discovering new forms of ore bodies and mineralization modes - it ain't just pitchblende. We've just begun to know where to look.
They also make the point that uranium's crustal concentration is roughly the same as tin or lead. One claim that I'd like to understand and critique further is that uranium is available from seawater at 4 to 6 times current market price. I think that source might be very energy-intensive and so energy price dependent.
Of course, if uranium gets expensive, we have three times that in thorium. Using thorium in breeder fuel cycles presents no fundamental engineering difficulties.
An example news story of a recent Russian project.
http://www.gov.karelia.ru/News/2005/11/1130_02_e.html
Aside: while most americans are close to the most ignorant of humans on this planet, the very small minority who travel and experience widely are amongst the most wise and knowledgeable I have met on my travels.
Did you see any example of China beginning to use sustainable energy? I've got the feeling they are moving in that direction quite fast, though they continue to depend on coal as their major energy source. Also their public transport infrastructure - has that been improving, are they investing significantly in it?
China knows its people want electricity, it is the great enabler. Currently it is adding as much as the total UK generating capacity every year. Interesting to note that China is about equal to UK on GDP.
If you can work out how to include photos in your post I would like to see some, maybe you should ask to do a guest thread?
They are talking about renewables, but I don't think they're serious, any more than we are. They say by 2020, they want to quadruple their economy, while "only" doubling their use of coal. While they are giving lip service to wind power, I suspect they are planning to make up most of the difference with oil.
Yes, China is working on renewables and climate. But China must must respond to the intense pressures to burn whatever fuel will bring more of their previously impoverished (and I mean desperately impoverished -- like my PhD student's mom) population into a better life. I mentioned 3 Gorges and the CANDU reactors. I currently work on landfill gas to energy and China operates some pretty good first of a kind (for them) landfill gas recovery sites. It is just that this task of bringing a better life via energy to tens of millions each year is so massive that coal and fossil fuels (like Russian and perhaps soon Iranian gas) must be their principal answer short term and likely medium term.
One depressing thing about China is the spectrum of motor vehicles, from what I saw in Beijing, too similar to the United States'. I cannot believe the number of knockoff "Great Wall" SUV's I saw. Really.
Which gets into some thoughts on vehicles. And other thoughts on the wider issue, of the broad range of peak oil solutions, some of which get almost no attention. And non-solutions.
I have for some time thought a simple "go to market" or "go to store" vehicle that grandmother could easily drive to the store. and not tip over, could be a winner -- something quickly mass produced to give substantial US petroleum conservation. Such vehicles need be no more dangerous or emissive than 3-wheel motorcycles such as our CA Gubernator drives. To this end I investigated neighborhood electic vehicles (NEV's) offered principally here by Daimler. They are expensive at 6-10K USD (United States Dollars) and limited speed (25 MPH) and range (25 mi more or less).
The convenience of personal transportation vehicles is unmatched compared to alternatives like taking buses for bringing home 6 bags of groceries. Personal vehicles will be used. I was just for the first time in Peru (part of my family is Peruvian, another of my world links). There I marveled at "Cholos", typically lightweight 3-wheeled framed-cloth cabined motorcycles with bicycle-style wheels. Similar vehicles -- with 0.5 liter US emission compliant engines -- could bring about big economies quickly in US oil consumption. They might have to stay on side roads in the US. But in Peru they were incredible--out fearlessly on all traffic arteries. Got pictures of them on the Pan American highway keeping up with traffic and dodging trucks. A Bangladeshi engineer in my house tells me that south Asian versions are widespread. Because of light weight I would judge Cholos' urban gas mileage better than hybrid sedans', their range severalfold that of NEV's and cost less than half of the NEV's. And safety would have to be comparable to motorcycles'. (They are after all cloth cabined motorcycles) The question I have is what impedes these from operating in the US. The belief I have is that rapid manufacture and market penetration of Cholo like vehicles could take place and cut US petroleum consumption quickly.
This thinking about Cholos -- of all things a working third world product -- is but one of several factors making me believe that the US could find ways to avoid a catastrophic crunch. Many of these ways, like the Cholos, are not necessarily current wisdom.
The United States' problem is in essence an oil and natural gas demand rate that has altogether the energy content equating to roughly 30 million barrels of oil equivalent (BOE) a day. Oil/gas interchangeability is a little greater than we think and it is practical to think of this as an aggregated demand total that must be reduced. The solutions could come from several sources that could cut this enormous consumption by several million BOE/day. I would put among solutions the conventional, like wind, solar heat, insulation. Definitely tar sands. Other things that would perforce pop up in importance are the woodpiles like New England's, that heat millions of homes, and in the prairie coal and even corn stoves. These would heat to the detriment of air quality but better than freezing. Some uncomfortable trades there.
In my house there is an older Chinese nuclear physicist (now working on high energy particle cancer treatment) who rode a bus in Beijing as a child. The piston engine of that bus was fueled by wood via a "producer gasifier". Someone I knew well who was unfortunately for him in the German army invading Russia tells me that the Germans had wood and coal fueled tanks--which they foisted off for the Rumanians to use--but they worked. Wood fueling has worked on over a million vehicles in times of serious oil shortage like WWII. I reviewed a fairly recent World Bank report on wood fueling of piston engines for use in remote locations. And I have worked on these (an EPRI report was one product). On fundamental grounds there look prospectively to be quite promising avenues to greatly improve wood fueling of IC engines.
I have been around the block on energy alternatives. In a future post I would like to offer some seat-of-the pants guesses with some backup, on how any United States' immense (say 5-10 million BOE) shortfall might be met. There are solutions. But many frequently invoked strategies have so many real problems and barriers that there seems no likelihood of overcoming those multiple barriers. I won't go into reasons, except that I was asked to do the work, but I have worked for over 30 years, on (a) algae and (b) ethanol from ligncellulose. I think they just aren't going to happen, and i think that wood fueling of IC engines has far better prospects. As to the fact that people keep trying, I have seen corporate pursuits of the unworkable go on for year after year when fundamental barriers were obvious. (Laser implosion hydrogen fusion by a major oil major was one example) Hydrogen has so many barriers and drawbacks that it is at best a political campaign promise.
One must take the promise of any one "silver bullet" technology with a grain of salt. But for the future there are enough things in the wings, so that even with peak oil we should be able to avoid freezing in the dark, or spend too much of our time waiting in the cold for the occasional bus.
- What about Stirling engines for anything-burning cars?
- Do "producer gas" fired vehicles produce charcoal--which might be highly saleable in any economy that needs wood-fired vehicles?
- Why won't algae work? I found a few people on the web who are growing spirulina in their backyard, and it didn't look too much harder than maintaining a swimming pool.
ChrisAlas, the lack of 100+ years of mass production and refinements to the external combustion engine VS all the mental work done on Internal Combustion engines.
Why won't algae work?
Most algae projects, to be 'profitable' are taking the CO2 from some source and using it for the algae.
Algae needs warm water, so the snow-belt is out for 365 day production. Algae needs sunlight, so oil is only being made when the sun shines. Algae needs land for the sun - and if you are using sewage as a feedstock for the algae - most of the land near cities is occupied. No matter what, energy WILL have to be inputted into the system, and there would be others wanting the electrical power for something else.
Nice plan when you have blank slate. Thus far, no blank slate.
This is why most of the 'algae tank' plans have 'em in the desert. But desert plans means waste from Minneapolis can't get there, unless very large sewer pipes are made, and we humans do an energy exchange of electricty for transport to oil.
Algae oil doesn't scale to serve 6-9 billion people on the planet.
Not too surprising, cement manufacture is one of the most energy-intensive of the bulk commodity industries. These cement kilns are huge and operate at a very high temperature (a feature that has made them attractive for the co-incineration of hazardous wastes). Though my numbers may be a bit outdated, energy consumption for the manufacture of portland cement is roughly on the order of 0.15 to 0.2 tons of coal per ton of final product. However, some of the newer facilities with energy recovery probably do better. So, if China is producing a billion tons of cement a year, that would imply that doing so consumes on the order of 150 million tons of coal.
Anybody out there: does this figure make sense when compared to China's annual coal production?
Maybe I'm more surprised that India beat the US in concrete production? I guess we kind of knew that too ... the world is not flat yet ... but it's flattening.
Point on India, she is moving into the 7% growth rate area and when your "middle-class" numbers 200,000,000+, granted at their economic scale, I can see how the concrete gets consumed.
Just listened to Meet the Press this Sunday and in discussing the State of the Union speech coming up there was 0/zero/zed mention of energy or greenhouse gases. Coming on the heels of Thomas Friedman's NYTimes editorial on 1/27, I was surprised.
You can read it at http://www.evworld.com/view.cfm?section=communique&newsid=10830
P.S. Friedman forgets that it will be the poor of this nation and in the world who will have the greatest difficulty in making any lifestyle changes.
TODA's = (acronyms)exp n (where n=days of site acitivty)
Conclusion: we need a glossary
While I don't contribute, I read TOD daily. Not knowing the acronyms has forced me to read more elsewhere, which is a good thing, but if it were possible to handle this acronym data as well the peak oil data, TOD might be more educational. I'm not saying dumb-down the blog, just make it easier to follow. Thanks.
- the type of source & its production
- supply & demand (including ecomomics)
- the consequences of our consumption
- alternatives to those consequences and scarcity
Under #3, we can include the way humans have actually altered the Earth's carbon cycle by adding a whole new component through our exploitation of hydrocarbons. It is an entirely appropriate topic for discussion at TOD. For example, switching from coal to natural gas for electricity generation has been seen as a much cleaner alternative--and justifiably so because so much less CO2 is emitted. But natural gas brings its own attendant problems.So, to those who might think this is not an appropriate subject for discussion here, I disagree. I look forward to reading Sturt's series on the carbon cycle and commenting on what he says.
And it's surprising to me that some people even know (outside climate scientists & other specialists) that cement production is a source of CO2. Its overall contribution is relatively small but apparently not in China! That graph is shocking.
By the way, if China is determined to pave over the very natural resources it needs to survive, maybe we should coin the term The Greap Leap Backwards.
Man, that drives home the old "imperial presidency" thing. I mean, sure this stuff might have happened in the past, but it seems like rather than the "public service" model of democracy the very roots of government are being driven to support an individual, the president.
However, I guess they all have a wary eye on the funding agency. It puts this disclaimer over at RealClimate in a rather different context doesn't it?
It seems to closely parallel the quote from Dean Acosta, the NASA public affairs official in the NYT story:http://www.msnbc.msn.com/id/11079935/
Some think it's already too late.
In a world where the most irrelevant trivia is hyped and debated and commented on ad nauseum as if it was a matter of life and death what chance is there for rational debate or proper analysis of important issues and data? Reality will have to use its hammer first.
BTW, we are seriously fucked, lol :-((
I am indeed picking up the pieces of my jaw bone. Those two years back to back are absolutely astounding. We can imagine what the preceding 6 or 7 years look like.
I am reminded of Winston Churchill's position in the mid-1930's. He kept telling the House of Lords that trouble was coming. His point was very simple.
He said: Germany is building, building, building... what happens when they stop?
That sounds flippant, but if China is building on the assumption of huge foreign tralei2C then they have an interest in continued world trade.
Does China simply run out of cement? And thinks it's OK?
By becoming semi-capitalists they've un-hobbled themselves.
But I'd feel much worse if someone could show me, say, that the Chinese were pouring as much of their GDP into war industries as Germany had done.
Is these cement production figures are representing domestic consumption or aslo include exportation?
I heard on CNBC a few weeks ago that there was a shortage of cement in the US due to the hot housing market and that most of the cement was imported from Indonesia and China.
According to my rough back-of-the-evelope calculation, I was quite surprised to see that every ton of cement produced puts almost a ton of CO2 into the atmosphere.
The basis of this calculation was as follows:
- Coal @ 80% carbon
- 300 lbs of coal burned per ton of cement produced.
- Typical cement composition of 62% CaO (the remainder being primarily silica, alumina, ferric oxide, plus a variety of other minerals)
Interestingly, the amount of CO2 produced from the calcination of limestone is almost the same as the amount of CO2 from the burning of the coal to power the kilns.
So, that billion tons of cement produced in China last year also produced roughly a billion tons of CO2.
When you see a picture of Hoover Dam, just keep in mind that roughly its weight in CO2 was emitted to the atmosphere as the result of its construction. While I'm sure that over the years Hoover Dam saved many times that amount of CO2 emissions due to the clean hydro power it produced, it is still a good reminder that all energy generating systems have a not-insignificant amount of initial energy investment.
I've heard many suggest that we can build fleets of hybrids, plenty of rail systems, as well as nuclear and "clean coal" plants. I've also heard people suggest that we can build enormous "air cleaning" plants to extract carbon and other pollutants from the air to be sequestered.
My sense is that while we must use some high-tech, energy-and-materials-intensive technologies, our most effective and most essential strategy will be to change the way we live. Intensive relocalisation, permaculture, and reorganisation of our culture so that walking and biking are our primary means of daily transportation are strategies which I think will be both essential and more effective than building new fleets and structures.
We need to plan our way out of needing huge fleets of energy-intensive machines to move around. We need to plan our way out of needing massive energy-intensive infrastructure to sustain our population.
Here's a Minneapolis, Minnesota, USA anecdote to illustrate my point:
Today, my son and I took my cargo trike to a neighborhood park. He wanted to try out his new ice skates. We were the only human-powered vehicle on the street. There were many cars, many carrying only one or two people. At the park, the sign said that the rink was closed. The ice was too soft due to warm weather.
I've lived in the region for over 30 years, and note that I don't recall a day in January or February when it was too warm to skate -- until maybe last year or this year.
My son was disappointed! We talked a bit about global warming, and noticed the huge parking lot of a church near the park. On Sundays the church also uses the parking lot of a nearby public school and much street parking to accomodate all the cars of parishioners. They hire off-duty Minneapolis Police to direct traffic. We noticed SUVs and Audi sedans and all kinds of other cars pouring in and out of the parking lot between services.
This same phenomenon was no doubt occuring all over town at churches, movie theatres, shopping malls, and the like.
Yet the people in the cars seemed to me to be existing in a parallel universe, oblivious to the fact that our weather is changing.
People here are warned of thin ice on lakes at a time when they "normally" drive trucks out on the lakes towing large ice houses for fishing. But no comment is made about global warming or climate change.
I spoke with an elderly friend who grew up on a dairy farm near Mitchell, South Dakota. She said that when she was a child, her mom was concerned about whether or not it was *too cold* to go ice skating at this time of year, but never about whether or not it the ice would be too thin or too soft.
Here in Minneapolis, there are more "indoor" ice rinks to accomodate ice skating sports. They require a bit of concrete to make, and a bit of energy to operate. "Hockey families" joke about the need for new big SUVs to haul all their kids and equipment from home to games in various rinks in town and in the metropolitan area. Again, no mention is made of global warming related to our living patterns.
Scientists who speak of global warming do not fit the facts to accomodate the narrative needed to continue the "non-negotiable American way of life." The American people are kept in a dis-infotainment bubble. We will be told, no doubt, that we are victims of bad people who want "our" energy and other resources. We will be told that we need to fight and build our way through the bottleneck of the next two or three decades.
I wonder if we can develop a narrative fitted around the facts to guide us to a peaceful and rational approach to the bottleneck we are in?
If we replaced 30% of our cars with walking and biking instead of shiny new cars (hybrid or otherwise) think of the energy and material we'd save. If we transport less food and other "stuff" around the world to sell, think of the materials and energy we could save.
I know we'll need to build some energy-efficient transport and some infrastructure, I suggest, though, that we think carefully about how to design our lives so as to need the least cars and energy-intensive infrastructure possible.
It takes far less energy and material to build a cargo trike (or quad) than a car.
Is it possible or needful to design a future where we do not need so much concrete?
Sometimes I'll drive to a local (pretty nice) shopping district, park my car and walk the loop of stores I need to visit (rather than driving from one to the next). Whoops, in that planter between parking lots is a homeless guy.
I've only actually been mildly pan-handled once, but I don't see the division between "suspect" walkers and "safe" drivers breaking down anytime soon. SUVs are derided as urban assault vehicles, but a woman is going to feel saver locked up in a mobile security device.
Cities may have a dynamic set up, with rules of engagement that everyone understands ... but suburbanites aren't used to it. (And yes, I know that driving also lets the driver forget who might be sleeping in the flower bed.)
Do you see the resistance to change as overwhelming the perception of a need for change?
I see our culture as dominated by inertia and inflexibility rooted in just the sort of things you mention.
The SUV is the "mobile safety bubble" of sorts but it is also the "portable toxic waste generator." Even more, our culture is dominated by folks who believe that they will never have to suffer even mildly for thier own good, let alone for the common good.
I have a cargo trike and a pedicab in the garage and two more frames ready to assemble in my basement. I wonder if they will ever make (ahem!) economic sense?
Once again, I suggest that we need to think about how we can use what we have most efficiently. It is healthier to bike and walk. This saves on the health care costs. Also, studies show that areas with lots of legitimate bike and pedestrian traffic have lower crime rates. Energy and pollution are reduced greatly if we design our lives so that our daily errands can be done walking and biking.
As another example, building cargo human-powered vehicles could be a good local industry, with designs tailored to bioregional specifics -- weather, terrain, and so forth. The energy and materials used could vary as well -- recycled steel to various kinds of wood. Such local industry would strengthen local economy and autonomy and help "the environment" as well.
The energy and materials used and the lowered pollution related to the full life of HPVs beat the numbers for the most efficient cars.
If we design our landscapes permaculturally, we can harvest more food from our urban and suburban communities. If we also rely on farms within our own bioregions, we can cut our need for long-distance agriculture.
Not new ideas, but ideas that we need to try if we are not simply going to fall into the "fight and build our way out of this" mentality.
Again, I see cultural inertia as our biggest obstacle to meaningful progress in addressing global climate change as well as resource depletion.
China and India are following "the West's" lead, but now we do not seem to know where to go from here. Do we consume ourselves to death, or find a way to live?
For what it's worth though, I can see biking catching on more easily from a "who will I meet?" standpoint. A bike rider is a little more mobile and a little less connected to the "place" than a walker.
Things are closing in on us from many, many directions, even though I still think Peak Oil is going to hit first, is hitting first. After Peak Oil, how would one prioritize the problems? Climate, soil depletion, metals, etc. Any informed speculation? Of course, war and geopolitics make all such projections highly iffy. But just on the basis of what we know about the resources and the workings of the globe, what might one say? There's nothing more interesting than these questions. There have never been more interesting times to live in! Scary, but interesting.
But if we collapse to a largely pre-industrial state it will be much harder next time around to re-industrialise since many of the raw materials required will be less easy to exploit, the low hanging fruit having been consumed and largely wasted. Any second industrial revolution will almost certainly be much more difficult than the first, and will probably be very different.
If we don't sink back far enough to lose knowledge of what's possible, then we could easily see carbon fiber or even buckytubes being used where steel and aluminum are used today. In fact, we might start to see that even in our current system. A few months ago I wandered into an exhibit of industrial robots, and a few of them had main structural components built of carbon fiber instead of steel.
Nanotech is about to get pretty amazing. Ideas in the labs today is showing how to replace mined materials with carbon. And what's going to be developed in the next decade or so may well lead to general-purpose manufacturing on a large scale.
Chris
First, I work in wind energy development, and the cost of wind energy projects has gone up 50% in the last 2 years, in large part because of the +/- 100 m3 of concrete in the foundation and many, many tons of steel (I don't have an exact number, but can say that it takes a crane weighing 500 tons to put up the newest and biggest turbines). The Chinese appetite for concrete and steel have been playing havoc with our economics for several years.
Second, my wife and I are expecting our first baby in March. The most interesting piece of advice that we've gotten from a stranger was to teach our child Mandarin at a young age.
Thanks again, Stuart, for your biweekly world-changing information!
According to this:
http://www.wbcsd.org/web/projects/cement/tf2/R2002_UK.pdf
Cement manufacture uses temperatures up to 1450 C.
Solar power towers can reach at least 1100 C, according to this:http://www.volker-quaschning.de/articles/fundamentals2/index_e.html
Could concentrated solar power be used to reduce fuel requirements for a cement plant?
BTW, the first-linked article suggests using not only tires and ground-up cars, but also slaughterhouse residue such as meat and bone meal, and even sewage sludge as fuel.
Chris
There is one person who has a solar powered kiln. Dig about on the web for 'em.
But remember, solar energy IS used to seperate the CO2 from the Ca. It just happens to be very old sunlight.
One ton of cement requires about 4 M BTU. That's about 1000 kWh. A large cement kiln processes 300 tons per hour. That would require 300 megawatts.
According to
http://en.wikipedia.org/wiki/Solar_power#Solar_thermal_electric_power_plants
http://www.volker-quaschning.de/articles/fundamentals2/index_e.html
The largest solar plant in the world today is a trough plant that generates 330 MW. Of course that's electrical, so it's collecting many times that much heat energy; trough plants are only 15% efficient. The trouble is that a trough system is low-temperature, maybe 400 C.
A large power-tower system has apparently never been built. But they can heat air to temperatures of 1100 C, if you use a compressed-air design, or 850 C with an open-air design. Even at that, a tower is only 20% efficient for generating electricity, so a 10 MWe (megawatt electrical) plant is actually a 50 MW-thermal plant. And the second URL talks about tower plants being cost-effective at 50-200 MWe; certainly more than enough to drive a large cement kiln.
The cost to gather solar watts for electricity is about 0.15 euro/kWh. That's for plants with a generator and a grid hookup, and probably heat storage (liquid sodium?!?!) as well. Divide by five for the difference between thermal and electrical, and then probably divide by two for the generation equipment you don't need, and you get a pretty competitive rate of about $0.02 per (thermal) kWh or $5 per million BTU.
I assume that cement plants fire round-the-clock, so this would only save a fraction of the fuel--it only helps while the sun is shining, and you probably still need some fuel to boost the temperature from 800 or 1100 to 1400 or 1500.
But I'd think that a cement plant in a sunny area could pretty easily install a tower and a few mirrors to pre-heat their incoming air. And as far as I can tell from these numbers, it does seem worth doing.
Chris
You could build solar ponds for preheating air and reduce power consumption of cement plants by something on the order of 1% I suppose. Heat exchangers for exhaust would work better if cement kilns weren't so cruddy. They would crud up the heat exchangers in days if you used them. They work better for preheating air for the kilns.
Bottom line, they're probably doing 99% of what they can be doing, energy wise.
Your argument that they're already doing all they can to recycle heat is irrelevant. Solar isn't recycling heat, it's adding a new heat source.
Chris
They would work quite well for dehydrating alcohol if you used some heavy salts like bitterns. They could dehydrate the desicants if you chose them to match the temperature profile of the solar pond.
Don't tell me my calculations are wrong by an order of magnitude, and then two posts later, explain that you were talking about a completely different technology.
Chris
Also, 1% is 1%, and solar ponds are pretty cheap.
Also, most of the groundwater is more than a little above freezing in China, even in the north. Run the groundwater through a heat exchanger to preheat the incoming air at the energy cost of pumping it up to the surface? How deep and how hot is the water at the particular plant?
Perhaps line focus trough heating of the incoming air to around 500 degrees would help even more. That's achievable pretty easily and China has lots of cheap construction labor so it could definitely be done. I think that's probably best of the lot off the top of my head.
If they have 450lbs of cement + 47lbs of ash per cubic yard of ready-mix... that's 1.83 metric tons per standard 9cubicyard truck...
I doubt they get even close... but say they get 2 metric tons of cement in every cement truck.
That's 500 MILLION loads of cement in one year.... I'm truly frightened to think what the average emissions out of the average chinese cement truck is.
I just can't comprehend that...
I was there for a week in May 2004 to speak at a bio/nano conference. I saw three cities, Dalian, Hangzhou, and Shanghai, of which Shanghai was the biggest.
I don't speak Chinese, but felt I was able to interpret their body language pretty well, perhaps because I lived near Silicon Valley for 15 years. I spent quite a few hours wandering the cities un-escorted and looking at how people lived and interacted.
I saw a lot of SUV's, despite the fact that a gallon of gas cost (if I remember right) something like a day's wages for the typical city dweller. Apparently, it's even more true in China than here: if you've got it, flaunt it. The traffic rules are simple: obey traffic lights; aside from that, the bigger vehicle has the right of way--except that a small car with VIP's on board can claim right of way by honking.
In Shanghai, we stayed in an old, formerly grand hotel, built in the first half of the 20th century. It was 18 stories high. I was told that until 1983 it had been the tallest building in Shanghai. Now there must be hundreds of taller buildings; even residential buildings (row upon row of them!) are taller.
Although I walked through several areas where poor people lived--including alone after dark--I never saw or felt anything that made me feel unsafe, or that I was in a high-crime area. It just didn't have the "slum" or "inner city" feel of American poor areas. (I heard that Beijing and other northern cities are more dangerous.) My impression was that people there are comfortable with large wealth disparities, and don't resent them or feel an urge to turn to crime out of a sense of poverty. I speculate that part of this lack of resentment comes from a feeling that things are getting better and everyone has a chance to improve their lot, and meanwhile everyone can at least make a living.
I hope some of these impressions will be useful...
Chris
From photographs and from what I can remember of Shanghai, Nanjing and Beijing, I can easily explain Stuart's remarkable graph of cement production and consumption. Thirty years ago there were virtually no buildings over twelve stories anywhere. There were large government buildings in the center of Beijing but they were not remarkably tall. Only party officials drove cars and there were a few buses. The train system, as I recall, was pretty good but modest for the size of the country. People moved on bicycles, millions and millions of bicycles clogging streets. As awful as the Chinese probably found it, bicycles work and confer considerable mobility for the energy expended. Local inter-urban freight often moved by cart drawn by mules or water buffalo or men.
Since that time, the Chinese have developed cities that look like gigantic versions of mid-town Manhattan, all in the space of twnety years.
And yes, China and other developing countries cannot or will not spend extra funds for employing building techiniques used in this country, so they use more cement and concrete. It is a reasonable cost/benefit trade-off.
So many "coal-mine canaries" have been identified: bleaching of the coral reefs, melting of the permafrost.... Each time one turns around, a new canary is found: Now the amphibian population. Climatologists really should talk with the biologists; both should talk with the economists, only the last seem to have the ear of the politicians and the business world. How we do business is at the heart of everything, including "peak oil."
Climatologists deal with an incredibly complex system. If they try to understand just the dynamics, they will miss seeing some of the effects. To speak simply of rising sea levels in eighty years or the abrupt halt of the Gulf Stream misses the point, leaving us to believe that we can escape the effects for another sixty or so years. The effects are here and increasing, not quite so much to affect us seriously, yet; but they will shortly.
The unease many of us feel lies in the fact that each time we turn around the situation has changed. Each year we notice something else that escaped our notice. And what we notice seems only to make matters worse. Now it appears that plants produce much more methane than we ever thought. Who knows? Maybe life itself has played an important part in past climate swings.
I suspect that in two or three years climate change, a.k.a. "global warming" will be, along with peak oil, a much "hotter" issue in the press. Critical mass for both these issues is approaching.
Economists, pay attention. You have the ear of the media, politicians and businessmen. Until the businessmen listen, there is little hope.
I'll repeat here that a recent LA Times piece covered a fight with Mexico about trying to make them reduce cement prices to us.
And what about building and repairing roads, bridges, etc? There must be huge amounts of energy required to just patch up a mile of potholed freeway.
Crumbling infrastructure will be a positive feedback pushing us that much further into collapse.
Worse, as noted above, China has become a gross importer of grain as of only a few years ago. They are moving out into world markets sucking in grain bigtime. But grain equals animal protein (processed grain) equals essentially what we live on. This could drive our food prices skyhigh in a very short time. I'm no economist but it would seem that if our massive debt is unpayable, China could ask for payment in grain--"our" grain! Lester Brown covers the grain story in detail at www.earth-policy.org.
This is why I have serious doubts about ability to maintain our technology in the post-carbon age. Building wind turbines, electric vehicles, bicycles, solar panels, or nuclear power plants is going to be very difficult and expensive without cheap oil - especially if suddenly everyone in the world is doing it. We'll all be competing for the same cement, steel, aluminum, silicon, glass, diesel, etc.
requires the most amount of cement
that any single project has required.
It is not just the massive amounts of concrete, and coke needed to produce it, that is scary; it is the amount of reinforcing steel required to make it all work. Without the steel, one is limited to the ancient Roman scale of concrete construction--thick walls, arches, and lots of bricks.
With the steel, there needs to be coal for coke, and ore for iron. So, although there is an impact on petroleum for raw material extraction and casting, I say 'yikes' about the overall CO2 emitted!
What worries me is that it looks like India is trying to catch-up to China...
They're building roads, sidewalks, highways, dams, factories, massive apartment complexes, stadiums, you name it. The Three Gorges Dam is but one of several massive hydroelectric projects currently underway that completely dwarf Grand Coolie or Hoover in size and scope. I'm sure some of it is going to military uses as well, but it's mostly just infrastructure improvements on a massive scale as one might expect for a population of 1.3B people starting essentially from scratch (i.e., dirt).
(We're paying for this concrete, by the way, with our massive trade deficit.)