| The Vincent E. McKelvey Lifetime Achievement Award | The Oil Drum | TOD 2.0 goes over 1 million visitors |
A little more illustrative info on Russia
Posted by Heading Out on February 10, 2006 - 1:29am
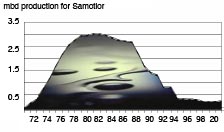
Browsing around to see if I could come up with any pictures to show how the oilfield production at Samotlor and Romashkino in Russia depleted, I came up with two sources for the illustrations that follow. The first were some rather small pictures in Matt Simmons presentation to CSIS, which can be found as a pdf if you scroll to the Feb 24, 2004 date on this site. The picture that I have used is slightly redone to try and clear the numbers.
The second source I came to, for the Romashkino curve, was a part of a review by IHS (note pdf file). This gave the overall production for the entire Volga:Ural basin, that includes Romashkino, which is what I was looking for.
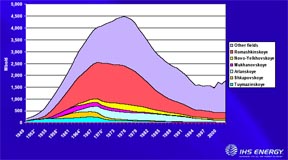
I am putting these up to show that large fields, and these were two of the worlds giants, can collapse fairly rapidly. And once they are gone it takes a lot of smaller fields to make up for the production that has disappeared. It is worth downloading the IHS presentation since it has some illustrations that show where the various fields lie.
Sibneft, which has been acquired by Gazprom, has announced that it's production will fall this year. Whether this is due to poor investment or a return to more old-fashioned management is still being debated. A review of the situation by Platts suggests that this gradual state takeover is not likely to lead to the production gains that were once anticipated, although the article still holds out some hope for increased exports, with some of those coming from refined products, as Russian refineries move toward reaching EU standards.
“Most people spend more time and energy going around problems than in trying to solve them.”
—Henry Ford
Contact
- Content: editors at theoildrum dot com
- Tech support: support at theoildrum dot com
License

This work is licensed under a Creative Commons Attribution-Share Alike 3.0 United States License.
Great stuff, thanks again.
I posted my theory on USENET calling it 'A "Peak" Into The X-Files'. I saw the Soviet peak on hubbertpeak.com at the time and saw the connection. Once the USSR couldn't sell oil, they had their hard currency supply cut off, causing their eventual collapse. I figured it out BEFORE I saw the CIA file on the Web. Talk about a wakeup call about oil peaks! The CIA declassified file merely verified what I already knew. The file discusses the 1970s Lower 48 peak, the embargo, and economic disruption as the precedent to "staying the course" until collapse of the Soviet Empire.
If economics was the driving factor, then wouldn't it stand to reason these fields would have some additional life in them and that past decline rates would not represent future decline rates.
Economics certainly plays a role in an oil field's productivity.
Check out this chart...
![]() http://photos1.blogger.com/blogger/6004/823/400/ProductionGraph.jpg
http://photos1.blogger.com/blogger/6004/823/400/ProductionGraph.jpg
This is from posting I made to my blog on a small oil field not far from where I used to live. Note the depletion curve is interrupted a number of times.
1996 as prices increase a little, production levels off
1998 as prices collapse, so does production
1999-2002 as prices surge, owners invest in steam injection. Production rises above original curve, peaking again in 2003.
Each of those changes in production were instigated by the market and only guided by geology. Read more of that post here:
http://unplanning.blogspot.com/2005/07/depletion-happens-little-bit-at-time.html
The link is ok. You just need to use a img tag and specify the src, like this:
< img src="http://static.flickr.com/36/97844621_6479fffb51.jpg?v=0" >
I hope Dave's comming post can help us out.
In any case, when Texas peaked in 1972, and when oil prices went up by 1,000%, we had the mother of all drilling booms--and we succeeded in increasing the number of producing wells by 14% over a 10 year period, which corresponded to a production drop from 3.5 mbpd to 2.5 mbpd. The smaller fields could not make up for the declines in the Big Old Fields like East Texas.
The severe production drop in Russia starting in 1989 corresponded to the 50% of Qt mark AND to the political problems resulting from the collapse of the Soviet Union. A lot of the fields were able to get some "rest." And IMO, most of the rebound in Russian production has been a result of the fields making up for what was not produced in the Nineties.
In fact, the East Texas Field itself might be a good model for Russia. The first peak was in the Thirties. Production dropped when the Texas Railroad Commission (TRRC) stepped in and curtailed production--because oil prices had dropped to 10 cents per barrel. The second (lower) peak was in 1972, following a steady increase for 10 years. East Texas then began a terminal decline. The point is that the second peak did not correspond to any "new" oil being found--the field was just making up for what had not been previously produced. The TRRC is to the East Texas Field as the post-Soviet collapse is to Russia. Granted, in both cases better technology was applied, but these are just incremental increases in URR. Today, the East Texas Field is producing 1.2 mbpd of water, with a 1% oil cut. Technology can't do much for a field that was watered out.
The Hubbert Linearization (HL) method accurately predicted--using only 1984 and earlier data--96% of post-1984 Russian production, and the HL method is predicting that Russian production--at least Russian production in existing fields--will soon start showing a double digit annual decline rate, which is also implied by the P/Q intercept. The recent dramatic slowing of the year over year growth rate suggests that the decline will begin this year, which is again implied by the fact that Russia is getting close to catching up to where production should be based on the HL model.
History suggests that the smaller fields yet to be found in mature areas won't make much of a difference. The problem with the lightly explored basins is timing. It takes a lot of time, expertise and capital to put large new fields on line. Soon, Russia should start showing annual declines in the 500,000 bpd to one mbpd per year range.
All of this gets back to my original concern about net export capacity. Just look at all the gradually leaking internal reports about production declines in Big Old Fields in exporting countries--Burgan, now Cantarell. I think that we are facing the prospect of severe cutbacks in net export capacity--probably starting this year.
http://energybulletin.net/12764.html
If Cantarell's decline rate is less than 8% per year i will be very surprised.
Oh, and Burgan, Kuwait, another of the big four, is on downslope too. That was a late 2005 news item.
On the other hand, have you folks noticed the collapse in natural gas prices since December? After hitting a high of $15.57/mmbtu in New York December 13 natural gas is now selling for $7.35/mmbtu as I write. Seems like warm weather (perhaps driven by inceases of atmospheric greenhouse gas concentration) has put a large dent in demand for this winter's heating season. And if current weather patterns hold, demand for natural gas may grow less slowly than many respected analysts, including Matthew Simmons, anticipated, at least for North America. (As I noted the other day, with the melting of polar ice and its effect on the Gulf Stream, the reverse may be happeing in Europe.)
I'm not advocating either complacency or air pollution, just saying that North American gas consumers seem to have caught a break this year, and if they are lucky the break might extend another year or two.
Remember, at peak in summer, 45% of our electricity is from nat gas - so a hot summer could mean higher prices before next winter. Only 5 of our 21 TCF annually is used for home heating...
On the other hand, have you folks noticed the collapse in natural gas prices since December? After hitting a high of $15.57/mmbtu in New York December 13 natural gas is now selling for $7.35/mmbtu as I write. Seems like warm weather (perhaps driven by inceases of atmospheric greenhouse gas concentration) has put a large dent in demand for this winter's heating season. And if current weather patterns hold, demand for natural gas may grow less slowly than many respected analysts, including Matthew Simmons, anticipated, at least for North America. (As I noted the other day, with the melting of polar ice and its effect on the Gulf Stream, the reverse may be happeing in Europe.)
I'm not advocating either complacency or air pollution, just saying that North American gas consumers seem to have caught a break this year, and if they are lucky the break might extend another year or two.
I'd love to see a discussion of that.
Other Voices: G. Michael Bolser He maintains that the NG prices have been so weird that he believes there has been central bank kinds of interventions. He has a web business @ interventionalanalysis.com trying to find indicators of gov/banking meddling, and maintains this is especially true with precious metals. Could this be?
There is plenty of evidence of manipulation of gold prices, just hunt around the gold sites and you'll find opinion and some hard evidence. There is circumstantial evidence they intervened in oil markets when the Katrina spike hit, probably mostly to get their proxies out of a short hole. I know almost nothing about NG trades so won't comment on that. They are occasionally active on stocks to prevent significant falls. It's why they are known as the PPT (plunge protection team).
But the effects are much greater than their intervention. Just the awareness that the PPT may meddle changes market behavior quite significantly - it knows the risk in the 'bad' direction is more limited than in a 'true' market. 'Problems' will occur, however, should the PPT or whatever fail to hold the line, then the market may take real control and perhaps over-react.
The recent price breakout in gold may be an example. It's now about 20% higher than a few months back, the move happened quite fast, the 'controllers' didn't have the bullets to stop it so had to stand back and let it rip. They will be intervening already or soon, the price may drop back to $500 or even lower, then another upwards wave will force the price higher. Spotting that moment could be lucrative, getting it wrong, costly. I'd be looking to late March as a buying time for gold unless geopolitics intervene, I'd be selling just now.
Warm January saved winter gas supply
Here in the northeast, the weather has been so warm it's a scary. The pear tree outside my window budded in January. I think it's close to blossoming - or would be, if a nor'easter weren't blowing in this weekend.
The warm weather is not all good news. It means not much snow pack, which might mean drought this summer. And if the summer is also unusually warm, we'll be using up natural gas for air conditioning.
1. January was one of the warmest Januarys on record for much of the midwest and northeast. This pulled the rug out from under demand and allowed inventories to build.
2. The fall was dryer than usual in many grain growing areas, requiring less gas than usual to dry the crop for storage.
3. Some heavy industrial users of gas cut back their use because of the high prices. Supposedly fertilizer manufacturers, chemical companies, and some plastics manufacturers have cut back significantly. There have been some accounts of these companies selling their gas from forward contracts back into the spot market to make money.
4. Insulation and wood stove sales have been unusually high. Lots of people are getting the message and conserving in various ways.
5. Production is slowly coming back on line in the GOM.
The trend is probably still intact
but we dodged a bullet with the near record warm January. Next year we get to try our hand at dodging another bullet!
Natural Gas futures usually follow a seasonal pattern of bottoming around mid-February. It is very consistent pattern.
...hopefully it will occur this year too since I just started nibbling long on NG... :)
In the short run, it is going to be interesting to see where natural gas prices end up. But, as a natural gas insider told me one time, "In the natural gas business, the difference between a glut and a shortage is 2%." Volatility does not begin to describe natural gas prices. In the past few weeks, one day fluctuations in prices were greater than the absolute price that we were getting at the wellhead a few years ago.
There may be some pretty interesting buying opportunities this summer in domestic oil and gas companies that are heavily weighted toward natural gas.
Where it will get interesting is if, as I suspect, Cat 5 hurricanes are going to be a recurring phenomenon on the Gulf Coast. The damage will be cumulative as both the production and drilling infrastructure is damaged, plus the personnel factor. In 2007, for every two experienced oil and gas professionals that we had in 2000, there may be only one left.
It seems that the behaviour of offshore fields lend itself, particularly in bad weather areas, to steeper decline curves and possibly sudden loss of URR. If there is a problem in an onshore field and there is still some accessible reserve left it must be relatively easy to replace simple infrastructure, like multiple stripper well pumps, and "suck out the last drop". If the field is offshore and you lose a platform to a Cat 5 or whatever there needs to be a lot more left to justify putting a new platform out. Thus an offshore field could suffer a "loss" in URR from factors which would be overcome onshore. Or am I just displaying my ignorance here?
I have heard that offshore insurance rates are already up 400%. If we have more Cat 5 hurricanes this summer, the industry and their insurance carriers may begin to have serious doubts about putting billion dollar platforms in the way of recurring Cat 5 hurricanes.
In any case, this is against a backdrop of long term declining North American natural gas production.
http://www.mms.gov/
As of Feb 8th:
"Today's shut-in oil production is 364,195 BOPD. This shut-in oil production is equivalent to 24.27 % of the daily oil production in the GOM, which is currently approximately 1.5 million BOPD.
Today's shut-in gas production is 1.554 BCFPD. This shut-in gas production is equivalent to 15.54% of the daily gas production in the GOM, which is currently approximately 10 BCFPD."
These numbers haven't changed much recently, a substantial proportion of what is currently offline is likely to remain so until the next hurricane season which officially commences on 1st June.
Offshore, and especially deep water, is prone to higher decline rates for economic reasons: it is expensive to produce on a daily basis so operators seek to get to max production asap and hold it there for as long as possible, then cut and run when the production and economics go against them. They typically plan and use all the EOR tech that might help from the start.
It is completely possible that some wells are not deemed eonomically worthwhile restarting after the 2005 hurricanes but I know of no collective source of such data.
[Note: I am a non-industry outsider from UK so maybe better if an insider from the GoM commented]
Russia is offering to defend Iranian nuclear facilities, which should raise the temperature in the middle east quite significantly IMO. It'll be interesting to see how the US responds. I wonder if Russia is trying to increase ties with Iran in order to compensate for its own impending production decline.
The Permanent Energy Crisis
The parallels to the 'Great Game' are more pertinent IMO. There has already been significant juggling. China has been tying up contracts for oil and gas, Russia has perhaps been flexing its muscles and making arrangements, the US has laid its hand on the table with the Iraq war and that is not a clear win yet, lol. I see a lot of US chips on the table but few from the other players who have not declared their hands as yet. In this company the US looks like a drunken boaster amongst professionals.
China would veto any significant UN sanctioned action against Iran, their minimum price for not doing so would be Taiwan, probably plus a bit.
Russia is not giving any guarantees regarding Iraninan safety but simply making business. With the same validity you can claim that USA has been defending Saddam Husein-ruled Iraq during the Iran-Iraq war.
Now, every sovereign country thinks it has the right to obtain nuclear weapons if it so chooses, and defend its nuclear installations. In this KLevin would seem to be defending Iran's point of view, and it that is an understandable one.
My only question is: if Iran obtains a nuclear weapons capability, what happens next? Will Iranian nukes make for a better world? If you think so, you like the Russian arms sale. If you are Israel, and Iran has threatened to wipe you off the map, you most assuredly do not like the Russian arms sale. I would also note that Iran is the first country since World War II, to try to obtain nuclear weapons with a publicly stated intent to attack another country.
In this transaction the Russians are making a moral choice, and that choice would be the flip side of the moral choice any other power might make in the attempt to forestall Iran's nuclear effort.
"I would also note that Iran is the first country since World War II, to try to obtain nuclear weapons with a publicly stated intent to attack another country." Not true. The US has been threatening the use of nuclear weapons ever since it got them and continues to do so. It repeatedly and absolutely refuses the no-first-use pledge even against non-nuclear powers (such as Iran.) Nor is it true that Iran has threatened Israel with nuclear weapons. The wipe-off-the-map threat was not nuclear, nor would it be credible were Iran to possess such weapons, since as we know, Israel does possess such weapons. Indeed, the wipe-off-the-map threat is bluster and not credible in any case for just that reason.
What is credible is the mounting campaign to isolate and demonize Iran preparatory to some kind of attack. Iraq disarmed itself thinking it could appease the Junta. Wrong. The Iranian leaders would have to be complete idiots to think appeasement will work with these guys. I don't know what's in heads of the other powers who have connived in this: it's another Munich that guarantees war, and guarantees their lunches too will get eaten. Amazing, amazing, amazing.
The cosmological justification of this is that we are The Chosen to save the world. If you don't beleive me I can provide you with tons of movies where it is proven beyond any doubt. Trust me.
This move makes a future involvement of Israel/USA in Iran less likely, hence I feel much better now that we're not going to pay (in terms of much more blood and much much more $) for another miscalculated imperialistic adventure. As for Iran taking a crusade nuking the world and its suburbs, please give me a break. The elephant in the room is US, not some poor country trying to avoid being bombed/nuked whatever.
So, fine! Let's let Iran get nukes. Let's not complain as Russia sells air defense assets to Iran. Do you understand what this means? It means that when the day arrives that Iran chooses to nuke Israel (and that day will happen), Israel will have no choice (from their perspective) other than to die willingly to the mullahs OR to take Iran with them. You know those cruise missile submarines that Israel has been buying? Did you hear about those? Do you know why? It's so they can still "pull the trigger" after Israel is radioactive dust.
And if those two go full out at one another, I would not want to be the person to predict the political ramifications of what would happen afterwards.
Your belief that Iran will not do exactly what it says flies in the face of history when others have said and done things that the west found incredible. Take Saddam Hussein, for example. The west completely believed that he was doing the same thing as western politicians - posturing - when he threatened Kuwait's oil fields. Thus the US ambassador didn't treat his question seriously when he asked if the US would intervene. And look at what has happened in the subsequent interval.
Mahmoud Ahmadinejad is a religiois fanatic. He is deadly serious when he says he is going to destroy Israel. In fact, he, personally, says he is going to destroy the world in the next two years to hasten the arrival of the "hidden iman", a savior like figure from Islamic religious tradition. This is the man who wants the bomb. A man who's first governing act was to give $10 million to a Moslem shrine devoted to this very sect that believes that they can "hasten" the arrival of the Mahdi by fomenting violence, terror, and war.
He is completely serious. Russia may not believe him. The US may not believe him. But he believes in himself and his mission. So plan to enjoy the fallout (literally) of inaction. The entire world will be getting some eventually if Mahmoud Ahmadinejad has his way. Russia and China may think they can play Iran against the US. If that is all they think this is, then they are about to make a world-altering mistake.
1. I've yet to see reference to when Ahmadinejad has said Iran would nuke Israel. This is conjecture based on what he actually did say, and the assumption (with no evidence) that Iran is pursuing nuclear weapons. While Ahmadinejad has said he'll wipe Israel off the map, he does not have the means to do this, and even if Iran did get nukes, they would be committing national suicide if they used them.
2. Iran has been subjected to the most intrusive international inspection regime I've ever heard of, and yet no evidence of a nuclear weapons program has been found.
3. But we know they have one, because the Bush administration says so. These are the same people who told such abundant and obvious lies to start a war with Iraq, resulting in the very real deaths of tens of thousands, and the destruction of that nation's infrastructure. Keep in mind that this is a war crime of the highest degree. Is there any source of information that less credible, less believable?
4. While Ahmadinejad has SAID threatening things about Israel, Iran is not actually involved with direct military action against anyone. Israel has been in a state of war with the Palestinians since it was created. They are not just threatening, they are acting. I place more credence on actions.
5. Israel actually has nuclear weapons, and has not even bothered to participate in the NPT. Everyone's ok with this? How are the actions of Israel more responsible than those of Iran? When will Israel be reported to the UNSC?
I do not believe it will be necessary for anyone to wipe Israel off the map, as they are taking care of that themselves. A nation that is crated by force of arms, maintained by force of arms in a state of perpetual war, and bankrolled by huge transfers of money and weaponry by the US is not viable long term. Especially when that nation is small, resource poor, and is losing the demographic battle to the nations that surround it. If a serious economic collapse occurred in the US, and we could not support them anymore, how would they survive? You cannot nuke your own backyard. The only real security is to learn to live in peace with your neighbors, and that means you'll have to make sacrifices. The support of the US and the power of nuclear weapons have caused Israel to believe they don't have to do this, and thus they will fail.
And as for Ahmadinejad, he is a puppet of the ruling regime in Iran. You may choose to believe that they are insane, but they've been acting pretty astutely so far - it's just that they're not on our team. And if Russia supports them, that should be no surprise, as they are not fools either and they know the US is not their friend. How is Russia's support of Iran any different than our support of Israel? Or of our previous support of Iraq, when we supported their attack on Iran?
Iran is indeed an issue and should be taken seriously. But -
- Mahmoud Ahmadinejad's statements about destroying Israel are nothing new in the Mid-East. The record shows this has been going on for 60 years. And, several Arab countries and groups have, in fact, actually tried to push the Israelis into the sea. The reality is that his statements fit the definition of Islamic posturing perfectly. They are meant for his own people.
- This is brinksmanship. Please read Shmuel Rosner's piece in Slate http://www.slate.com/id/2135659/
There is every reason to believe that the Iranians are pushing as far as they can so that they have a bargaining position for whatever comes next. As Rosner points out, so far the the ball is still in the West's court. They will push until we push back.- While Iran's possession of nukes is exremely alarming, they are still a long way from having the reliable, deliverable, reportedly 200+ devices that Israel has.
- Nobody doubts that he is serious about what he says. But Ronald Reagan was serious about what he said as well. History shows that leaders' actions end up frequently being a lot different from their rhetoric.
- How much of what we read and hear is actually part of a psychological warfare campaign being waged by Mossad? or the CIA? Where do you get your advanced psychological profile of Ahmadinejad? We can't even determine that he's one of the original embassy hijackers.
I would be very wary of what we think we know and where that knowledge came from. How much of it came from the same apparatus that gave us Iraq's WMD? How quickly forget the sketchy record of our intelligence services.In James Risen's new book he talks about how post-9/11 the entire CIA's Iran network was probably rolled up because some "spymaster" couldn't figure out how to use email.
This entire episode is about intelligence. Know your enemy. Through the looking glass. All that. Ask yourself, how much do you really know?
The link you provided, while disturbing, does not say he is going to destroy the world in the next two years.
But before you get worked up that this is the Washington Times, I've followed both the Post and Times and both are as accurate as the other on reporting world affairs. And further, though other sources don't specifically say "two years", we do have multiple sources, including CNN saying that Ahmadinejad expects the 12th Iman's return to be "imminent" and that he has reformulated Iranian foreign policy on the basis of that expectation.
What amazes me here is that so many of you are willing to just take charges that Bush is a religious zealot at face value (which I won't dispute) yet then, when facing even more persuasive evidence, refuse to acknowledge that Ahmadinejad is just as much a religious zealot as Bush, or even worse.
Further, as Iran Press service notes, Ahmadinejad (or Ahmadi Nezhad, as they spell it), believes himself to be the chosen of the iman.
If you do any research at all, you can see that these reports permeate liberal and conservative western reporting about Iran. Both political sides in the west try to spin things to their advantage but neither side seems to take him at face value.
Australian article about Ahmadinejad.
An Iranian article about Ahmadinejad's devotion to the return of the iman.
(There are plenty more if you bother to research.)
This man is an ideological extremist, even more so than George Bush, by a long margin. If you bother to study him, you discover that he's replacing people who are not inclined to agree with his positions whenever and wherever he is able. To assume that he does not mean what he very clearly says seems extremely foolish to me.
And finally, those of you saying that this is just posturing, I remind you that the Middle East has had nearly half a dozen wars since Israel was founded solely for the purpose of destroying Israel. If you seriously believe that these people do not mean what they say, then you must be deliberately ignoring the history of that region for the last 60 years. These nations have repeatedly lost yet never wavered from their positions and come back again and again to try to accomplish their stated goals. Not every Middle Eastern leader is an Anwar Sadat, willing to break new ground, and even fewer are willing to risk Sadat's fate for doing so.
The things you say are valid opinions. Some of us just happen to disagree.
That being said, the world has seen its share of crazed despots. Nobody is doubting that Ahmadinejad is a potential threat. We all know that he is an enemy of Israel and that he would rather do that nation harm than good. But as even you yourself have pointed out this hardly makes him unique in the Middle East.
It is therefore important to note what the man says. especially when it involves blowing up the world.
you said:
In the original post it was in bold red type. But you still haven't shown evidence that he has said this. You have come to a judgement(and not necessarily a bad one) based on your reading of several of his statements and opinions - one of which contains a reference to his "reckoning" that the imam will return in two years. But this is a far cry from him actually having said this.
This is a far cry even from the House of Saud who clearly tried to warn FDR off of supporting a Jewish state in the Middle East and who have never been comfortable with Israel's presence there (at least publicly). It's a far cry from many other leaders who have mouthed the words but been very calculating in their actions. But Ahmadinejad appears eager to enter into that conflict with the west.
The Saudis can be negotiated with because they have at least some goals in common with us (business goals). Ahmadinejad cannot because his views and goals are completely antithetical to our very civilization. And he even sees himself as a sort of cure for the plague of western democracy.
And by the way, it was in bold red type because it was a link to one of many articles discussing his position, just like the links in the prior response to you. You might consider clicking those links and reading the references, just as you might also do with the Sharon link in that other thread.
Yeah, it does matter - he didn't say it.
Unlike you I don't make a distinguishment between Islamic and non-Islamic type thinking. There is a common thing among all human beings - they do not want to die. Islamic extremist leaders may use indoctrinated suicider bombers to achieve their goals but beleive it or not they are not suiciders themselves. If you take some time to study their doctrine, their goal is not a total anihilation of the world, but to free their land from those they consider aggressors. Even Saddam Hussein, whom you incorrectly cite as an islamic leader, was not that stupid and reportedly tried to gain (or gained depending on whom you decide to believe) approval for his agression in Kuwait from USA.
There is a simple truth regarding nuclear weapons - if any country tries to use them first it will be smashed to peaces by everyone else. Except probably if it is called USA. The only reason to try to obtain them for a country is to restrain its enemies from doing the same thing first.
I found Iran's desire to have nukes absolutely logical - when you think about it almost all of its neighbours or nearby countries have them (USA - occupying Iraq and Afganistan, Russia, China, Israel, Pakistan, India). I don't like their desire but the alternative is to try to stop them by force without any legal right to do it. With American troops in Iraq and Strait of Hormuz at Iran's crosshair this could very easily escalate to an Armageddon scenario envolving everyone from France to China and Russia.
Overall, thanks for the proposal but I also don't want to die.
"...without any legal right to do it."
Do legal rights ever play a part in international diplomacy at this level? At this stage everybody is playing for keeps.
I know that international law tends to be a vagualy defined set of rules, being applied selectively according to the interests of those who are "in charge". But the other option - living without it would result in a world looking like Central Africa.
I've thought about this a bunch before but it was your comment that reminded me of what I think is somewhat fascinating about this aspect of diplomacy. Go back 4000 years. All the major historical events in at least that period are about rewriting international laws, not following them.
Look at Ahmedninejad(sp?) - when he speaks about nukes, he doesn't talk about Iran's complying with NPT. Only about its "rights." In other words, in the same breath, he is breaking the old law, writing a new one, and expressing how important it is to follow the law, because the new one is his. I think the phrase is "everything is subjective."
Seems to be a pattern in history. "The law? - I'm the Law." Or, "Badges? We don't need no stinking badges."
But those were movies. Let's move to real life. Churchill said,"History will prove me right and you wrong, because I'm going to write that history."
The only laws that will be followed in a confrontation between the US and Iran are those that the US chooses to endorse. Whether or not they are followed is entirely up to Iran. The US won't be following any of Iran's laws. And Iran doesn't get to choose new ones to follow. So as far as any "rights" are concerned - realistically(and I'm not saying this is the way it should be - only the way it is)these only belong to the US. The US is the policeman reading Iran "its" rights. Again, this is crude analogy for what I believe to be the situation.
The US promotes democracy for individual nations. We've never endorsed any such thing on the world stage - which is not a democracy. A nation in this arena doesn't get a qualified lawyer, a judge, and a jury of his peers. If you decide to gamble, you might win, but usually you die.
Iran's smartest move would be hiring Kissinger as a consultant.
Also, we live with "international law" now, and the world may still end up looking like Central Africa.
What is more unacceptable to them, especially for the weaker ones is that if things get bad they may be the next on the list. That's why we have UN, and as long as nobody kills his neighbour, or the neighbour is not a convenient victum for the majors things go by so-so well.
Of course, considering what is on the horizon, this fragile internetional equilibristics will probably break to pieces in the future if we do not find an effective way to enforce it. Here I'm also a pessimist, I think there will be wars but soon it will become apprent how fruitless they're destined to be and we'll have to find another way.
Given all the evidence, including the two articles that GreyZone cites, I think it is had to argue against the view that, at the very least, Ahmadinejad seeks to destroy Israel or, more likely, welcomes a global coflagration in line with his apocalyptic religious beliefs. Given this, it seems obvious that his ability to develop nuclear weapons must be neutralized. If the E.U. and the U.N. can do this without resorting to armed conflict, all the better. But if they can't, what option is there other than military force?
Those who disagree need to demonstrate, in the face of all the evidence, why we shouldn't take Ahmadinejad at his word, and why Iran would not pose a mortal threat to the West should Ahmadinejad achieve his aims.
I am launching tomorrow a nuclear missile towards the Moon. Prove me that I can not/will not.
According to GWB we'll get rid of our oil addiction by stopping our alcoholic addiction. According to Vladimir Jirinovski Russia has a weapon that can change the gravitational constant in some areas and cause whole continents to sink in the ocean.
Of course both are plausible statements. But I can make my mind about them without feeling the need to launch a private investigation. In all cases when I see a pair of lights on the road late at night I'm assuming it is a car, not a couple of motorcycles riding in parallel against me. Maybe more importantly I'm not trying to drive between those two motorcycles.
Here's a thought experiment for you. Imagine that an unelected group of fundamentalist Protestant clergy held supreme political power in the U.S. Imagine they had at their command a secret religious police to enforce social control. Imagine that no one could run for public office without their approval. Imagine a newly elected leader who believes that the existence of communist Cuba is a blemish on the honor of Christianity, and who is committed to driving all Cubans into the sea. Imagine he denies that Batista regime in Cuba ever existed and claims Castro just made the whole thing up to justify taking power. Imagine he is developing a new secret weapon of catastrophic power. And imagine he has no fear of world war because he believes we are in the "end times" and that Jesus is coming again soon. Wouldn't this make you just a little worried? Wouldn't you hope that the E.U. or someone would attempt something along the lines of regime change?
I agree totally with Twilight's comment about similarity of Bush and Ahmadinejad, have made same myself here before. Listen to their utterances. Is it any more reasonable to applaud Bush's war on 'terrorism' than Ahmadinejad's diatribes on Israeli infidels (or US imperialists when he gets round to that)? They both seek to manipulate and inflame their audience and obfuscate their failures. Either could cross the brink with stupid rhetoric or action, though the odds are the US is more likely with action since it has shown this disposition in past, and Iran with rhetoric cos it gets attention and plays well (to many) at home.
Why take Ahmadinejad at his word when you cannot take Bush at his? Look, if the american people are stupid enough to re-elect Bush then what right do they have to criticise the Iranians for electing their president? K, if the Iranians re-elect him the criticism may be justified but till then look to your own sins. Ahmadinejad is doing little more than Bush does in terms of rhetoric, I've not heard that he has called the US an evil empire, Bush named Iran part of an axis of evil, how would you expect them to react to that?
So, the Bush regime and many americans think Ahmadinejad is a dangerous nutter. Well, forgive me, most of the world thinks the same of the current US president.
LevinK said he found it absolutely logical for Iran to have nuclear weapons, I totally concur. IMO Iran has a more logical need for them than does the US. Think about it. I also think it would be logical for Iran to withdraw from the NNPT, at least until Israel, Pakistan and India deigned to negotiate to re-sign and the current major nuclear powers (US, Russia, China, UK, France) agreed to massive reductions in their nuclear arsenals.
On the lunacies of Islam and Christianity: I hear that Nicaragua (? might have been Venezuela) have chucked out missionaries who had been out converting rainforest tribes, who'd had almost no contact with modern society, to Christianity, sweetened by some modern healthcare and pharmaceutical drugs. Have they no damned respect? That makes me real angry and nauseous - like a sweetie lil girl, now suck... REAL angry. At least I've not heard of muslim missionaries behaving in that deplorable way.
I could say much more but won't. I'll end with this: if Iran had a few newks they could not cause the end of this world; the US and others have ample to achieve that - get your bloody risk assessment right and thinking appropriate!
OK, there are several variants:
1) He is a maniac and he does it. Builds a nuke in some underground place and drops it over Tel Aviv. In couple of hours his country and the whole ME turns into a nuclear waste disposal site. What can we do about this now? We can:
a) Attack him now and face a WWIII scenario.
b) Attempt an regime change (hm, how?). But even if we succeed and install someone there is no guarantee he or his successors will not turn worse than A.
c) Let him continue his nuclear program under strict IAEA supervision. Where is our legal right of stopping it? Is he trying to stop ours?
I suggest c) as an obvious solution. I'm asking myself, if we have a peacful solution why the fuss? Probably because we are the ones that want this country under control of some kind.
2) He is trying to lure us in doing 1 a) - this is my favourite and I put a 99.99% probability on that. It fits perfectly in their interests and the way they intend to gain victory on us - using our own might and slowly draining our resources in doomed wars. This strategy is already being applied against Israel for 50 years, and now more successfully in Iraq. This is the name of their game and it would be stupid if we go in playing it. Something more - this would mean the end of the game, and we'd lose.
http://www.energygrid.com/society/2004/05jb-kingdom.html
The Muslim and Christian versions of the Rapture seem to have quite a lot in common, notably a requirement for a conflagration in the Middle East before the long reign of the Mahdi or Christ can begin. Both sides make me nervous.
I make no claims to what they mean, if they mean anything at all. The following are just some thoughts.
The first runs for the last three years - the numbers for November being the latest available. I have added both a 6-month and 12-month moving average to "smooth out" the peaks and valleys and get a better view of the trends. You can see that something of a "peak" has formed recently, but we haven't really begun to slide. Compare this to the first 6 months of 2002, where we were winding down after the 2000-2001 recessionary period. We obviously had a lot of upside following that period.
The second graph uses the exact same straight monthly numbers, but is zero-scaled. I think this does a good jod illustrating how our perception of numbers can be influenced by their different visual representations.
BTW, North Korean pilots in Mig-15s I think were shot down by Americans in a ratio of about 20 to 1, although it may have been higher. Also it is hard to know for sure the ethnicity of somebody you shoot down over enemy territory.
Any time you are tempted to underestimate Russians, remember Charles XII of Sweden, Boney the famous Frog, and Hitler, leader of the Super Race.
The following graphs show a slightly different "view" of worldwide oil production. They use basically the same monthly EIA numbers that Stuart has recently used, but the difference is in the graph design.
I make no claims to what they mean, if they mean anything at all. The following are just some thoughts.
The first runs for the last three years - the numbers for November being the latest available. I have added both a 6-month and 12-month moving average to "smooth out" the peaks and valleys and get a better view of the trends. You can see that something of a "peak" has formed recently, but we haven't really begun to slide. Compare this to the first 9(count'em - 9) months of 2002, where we were winding down after the 2000-2001 recessionary period.
We obviously had a lot of upside following that episode. Could we repeat? I only ask the question. You, Dear Reader, must answer.
The second graph uses the exact same straight monthly numbers, but is zero-scaled. I think this does a good job illustrating how our perception of numbers can be influenced by their different visual representations.
Quite exciting, I know.
In the end, of course, the whole issue is not about how much is produced as much as it is about what the rates of decline are for older fields and off-shore fields that are economically unfit for heroic tertiary recovery methods. Higher decline rates are implied by the recent apparent peaking, but they are not proven. We have a couple of recent admissions of decline in giant fields, but the Saudis, as always, hold the key and they aint talkin'. Except to say there's no problem because High Tech is ridin' to the rescue.
I wish we had more real information on the decline rates, but since we don't, your chart is the sort of information we have to consider. Thanks again.
I would interpret both as indicating we are on the plateau and are probably waiting for the first real signs of the downslope. They are both walking and talking like a plateau, to me; the first looks more likely to soon be wiggling her butt as she skis down. (ooops, my dirty-old-man-ness is exposed)
But reality is not all smooth, seductive, curves; there may yet be a brief bit of upside to go. 90 mbpd, unlikely, 95 mbpd probably a pipe dream, 100 mbpd, 'nother planet.
Heyyyy! I aim to please. Glad you liked it.