How Periodic Are the Oil Price Fluctuations?
Posted by Sam Foucher on September 22, 2006 - 11:20am
The amplitude of the big slide in oil prices from $75 to $61 was a little bit a surprise for everybody. I'm trying to answer the following question: is this big drop significant or simply a consequence of a very volatile market?
There are some cycles in oil price fluctuations. For instance, the seasonal fluctuations in oil demand or even the change of oil contract at the end of each month. On top of that, there is the usual chaos of geopolitical events, Hurricanes, etc.. The objective is to see if we can apply the Periodicity Transform in order to capture eventual cycles and get an idea of future oil market volatility.
I consider the prices from 2002 to end of July 2006 (the data is from the EIA). We fit a straight line in the log domain (Fig. 1). The fit is quite nice with a correlation coefficient equals to 0.97, the slope is 0.2615/year which represents a 30% per year increase in prices.

Fig 1.- Linear fit in the log domain. Click to enlarge.
The residuals are Gaussian distributed with a standard deviation equals to 0.095:
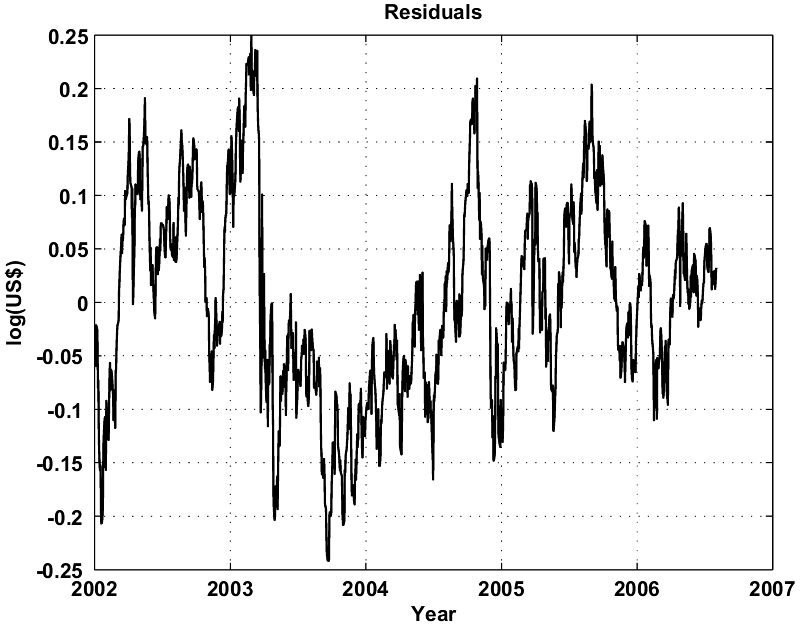

Fig 2. - Residuals of the fit shown on Fig. 1 and corresponding pdf (the red line is the Gaussian model). Click to enlarge.
If we apply an exponential transform to go back to the normal price domain, we get a nice exponential trend (Fig. 3). The dotted lines are the 95% confidence interval derived from the above gaussian model for the residuals. Note that even if the residuals can be modeled as a gaussian additive noise, once the exponential transform is applied the noise becomes multiplicative and non gaussian (that's why the confidence interval becomes wider with time).

Fig 3. - Exponential trend and 95% confidence interval. The red points are the recent drop from Aug 1 to Sept 19. Click to enlarge.
The Periodicity Transform is quite a new tool proposed by William A. Sethares and Tom Staley in 1999:
Periodicity Transforms decompose a data sequence into a sum of simple periodic sequences by projecting onto a set of periodic subspaces, leaving residuals whose periodicities have been removed. As the name suggests, this decomposition is accomplished directly in terms of periodic sequences and not in terms of frequency or scale, as do the Fourier and Wavelet Transforms. In consequence, the representation is linear-in-period, rather than linear-in-frequency or linear-in-scale. Unlike most transforms, the set of basis vectors is not specified a priori, rather, the Periodicity Transform finds its own "best" set of basis elements. Technically, the collection of all periodic subspaces forms a frame, a more-than-complete spanning set. The Periodicity Transforms specify ways of sensibly handling the redundancy by exploiting some of the general properties of the periodic subspaces.
Applied on the residuals, we get 29 basis elements. I show the four most important periodic basis elements in terms of energy contribution:
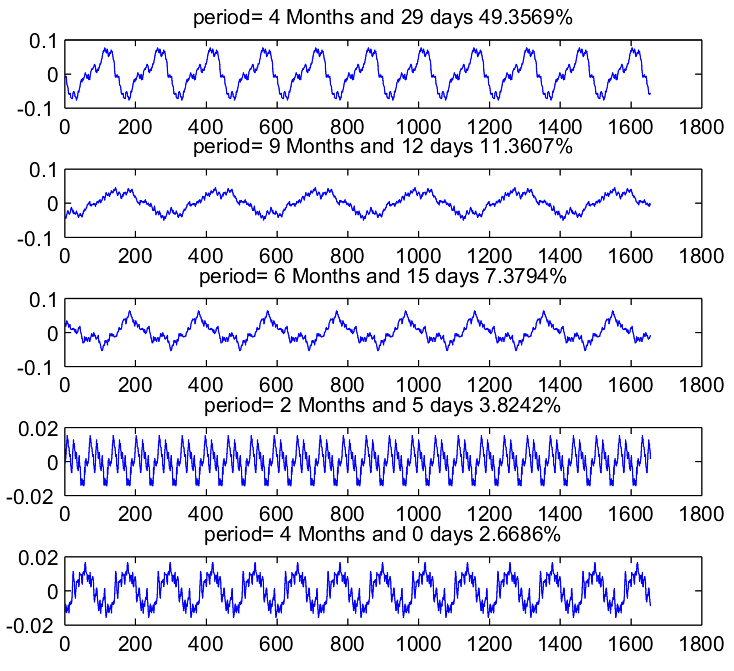
Fig 4. The 4 top basis elements out of 29. Click to enlarge.
We can reuse the periodicity basis in order to estimate future fluctuations of the residuals:
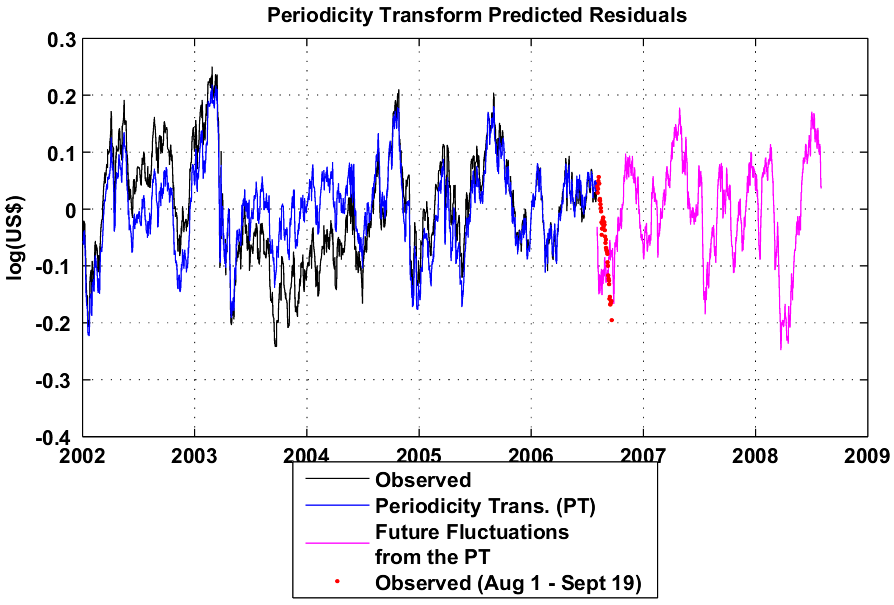
Fig 5.- Modelisation of the residuals by the Periodcity Transform. Click to enlarge.
Back in the price domain, we get the following prediction:

Fig 6.- Periodicity Transform Extrapolation. Click to enlarge.
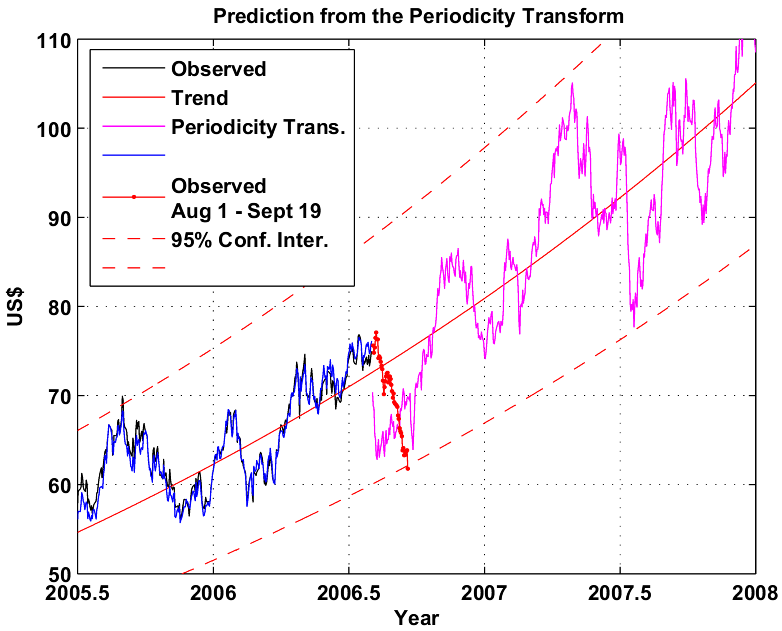
Fig 7.- Zoom in on Fig. 6.
A few comments:
- The recent drop in oil prices is still within the confidence interval of the exponential trend observed since 2002.
- There is about a 2% probability that prices could drop below $61. It seems that $60 is the actual lower support line for the oil prices right now.
- The periodicity transform gives us a rough idea of what future volatility could look like.
- The PT basis elements are hard to interpret in terms of known price cycles.
- The predictive power of the Periodicity Transform is probably limited because of the chaotic nature of price fluctuations. The PT seems to have predicted the recent big drop in prices and is predicting a big rise at the end of the year.
- Of course, this is a very simple approach that is assuming that the exponential trend observed since 2002 will stay a valid model for the coming years.
Contact
- Content: editors at theoildrum dot com
- Tech support: support at theoildrum dot com
License

This work is licensed under a Creative Commons Attribution-Share Alike 3.0 United States License.
The twelve $10 moves are marked in red. These all occurred within 2 month periods. I've also counted 10 2-month periods where the price traded within a $10 range.
I've got one more I'll throw in here at the end of the line. But after that I'm done.
But I will tell you this. If you were to substitute Americans for those frogs you speak of. And if you substituted gasoline prices for the boiling water. You'd probably be right.
http://www.econbrowser.com/archives/2005/07/100_a_barrel_wh.html
This is a one standard deviation measure of how much prices are likely to change in a year. For shorter periods, we reduce it proportionately. For two months, 1/6 of a year, this is about 6%.
Now, that's one standard deviation. In general there is a 68% chance of staying within 1 SD, or plus or minus 6% price change. 68% of the time, prices will change by less than 6% in a 2 month period.
Two standard deviations would be twice as much, and correspond to 95%. 95% of the time, price will vary by no more than plus or minus 12%.
Three standard deviations would be plus or minus 18%, and corresponds to 99%. 99% of the time, prices will change by no more than 18% in a two month period.
In this cases, prices fell from about 78 to 61. This is a drop of 22%, or more than a three standard deviation change, in fact almost four standard deviations. It should happen something like one in ten thousand times. Either oil price volatility has increased markedly (and I don't know that we see much evidence for that prior to the recent change) or else this was an extremely rare occurance.
Well, I suppose that's no surprise, we already knew it was rare, prices haven't fallen this much this fast in many years. This just shows how rare it is.
Now, one caveat - these statistics are based on a normal distribution. However financial prices are slightly "leptokurtic", a fancy word that just means "fat tailed". (If you like to live dangerously, try telling your girlfriend she's leptokurtic and say it's latin for beautiful.) What it means is that extreme moves are more likely than would be the case for a classical normal curve. Market psychology is more likely to lead to extremes than the kinds of physical processes that are often described by normal curves.
The bottom line is that this 22% drop in two months is in fact rare, but maybe not quite as rare as the calculations above would suggest. Four SD drops do happen in the market but they are certainly noteworthy.
And let me point out that Khebab's prediction graph shows us climbing back up to around 85 in November. An increase from 61 to 85 in two months would be 6.5 standard deviations! That would be even that much more remarkable than the drop we've already seen.
If I look at the lognormal distribution properties:
the variable mu is a linear dependent function of time in my case (log(Price)= 0.2615*(t-2002)+3.1). We have the following relationship for the mean and the variance of lognormal distributed variable X:
so the standard deviation is proportional to the mean. The coefficient in my case would be sqrt(exp(0.091^2)-1)= 0.0912= 9.1% wich is not far from the 6% you are using. So volatility would be given by the following function:
0.0912 * exp(0.2615*(t-2002)+3.1 + 0.091^2/2)
using this formula for mid-September 2006, we get a volatility between $6.89 and $7.03. The 95% confidence interval would be [$61.2, $89.2]. The recent drop of $22 is 22/75.2= 22.6% which is 22.6/9.3= 2.43 SD. The move toward $85 would be 3.44 SD with my value.
Can you point me towards some references on this issue? I of course see the same thing in the MSM that you do, but have not seen the evidence that contradicts that story.
Thanks.
Anyone have any current figures for forward coverage in oil and/or gas?
There are more graphs here.
Matt Simmon's link (http://www.simmonsco-intl.com/files/060997.pdf ) is old -- from 1997 -- but he's the only guy I can find who addresses this important topic -- what are the "minimum" level of oil inventories? Does anyone have any newer information than this? I suspect that as our usage has grown our "minimum" level of oil inventories for proper function of our petroleum industry is higher than 280M to 300M barrels, but I am not certain.
It is easy to get this idea of a contradiction -- the latest EIA weekly oil report released 9/20/06 begins with the title "How Low Can it Go?" and relies on both "technical" chart data (it is stated that the decline represents "the second-largest uninterrupted decline in the history of the survey (dating back to August 1990") and then also uses inventories as a reason why oil prices are dropping. A chart is very conspicuous that shows higher than average crude oil inventories (of course no mention of world oil inventories and the fact that we've withdrawn from the SPR). No other reasons are given for the price decline. see: http://tonto.eia.doe.gov/oog/info/twip/twip
This bigger picture being a shift in the way the world community thinks of Oil. Here in Australia, petrol consumption has decreased by 5% over the past year, even though domestic GDP growth remains strong (we're benefiting from the commodity boom due to the rapid expansion of demand from China and India).
In market-speak one could say the fundamentals have changed once Oil passed through $70 per Barrel and that consumers around the world have decided to act differently.
So to me the question is: Will $70 per barrel be sufficient to continue this drive away from consuming Oil, or will further price increases (like the 30% per year trend line) be required to balance supply and demand?
However, gasoline consumption is still up 2% from last year in the US despite higher prices:
Not much sign of the population falling here. Although it probably is aging - compensated for by migration from East Europe.
Whatever the reasons, I am an optimist in the aspect of that policy makers around the world are starting to embrace the fact that the oil age is approaching to an end. I expect it to become a race very, very soon. The ones that manage to implement alternatives will prosper in the long term, the others will lag behind.
Additionally, dollar amounts should be adjusted for inflation. Not sure you did the latter.
Nonetheless, very interesting work.
You can't read history backwards.
The drop from $78 didn't happen when the conflict ended, nor did the run-up begin when the conflict started. That's being projected on the price graph. Im not going to say that it was coincidence, or that it was unrelated, but I will say that there is no provable correlation. And I said that from Day 1. Nobody ever thought the Levant had anything to do with oil.
Oil is not seasonal.
I too believe that $60/barrel is the floor, the "bounce" price -- right at the low end of your 95% confidence interval.
OPEC issued a public warning recently that prices below $60 would lead to production cuts. In light of your modelling, I would say that somebody else has done a similar analysis. The fundamentals justify the rising 95% interval now and for some time to come. OPEC and The Oil Drum -- finally on the same page!
-- Dave
BTW, can I email you? I've got some topics I don't have the time for. You might. And you're one of the few I trust.
Though the analysis says there is There is about a 2% probability that prices could drop below $61. It seems that $60 is the actual lower support line for the oil prices right now and I agree, the bottom line is that the current downturn of the oil price is not normal with respect to similar intervals in the recent past.
When you ask is this big drop significant or simply a consequence of a very volatile market, the question seems a bit oversimplified.
Volatility? Yes
Significant? Yes and No.
No longer term significance. There is near term significance, however. From Bloomberg
I agree -- prices could fall below $59/barrel next week. The large but amateurish funds are running scared. They have poured a lot of money into energy commodities since 2002 in order to ride the wave but now many are getting out. This is a one-time deal. There's the shorter term significance. I believe as your modelling suggests that $60/barrel is the real floor but be prepared for a price anomaly.Another question, since the price drop started well before the Amaranth annoucement, is why now? -- but I won't speculate about that here.
So, no, I won't bet that cup of coffee.
To e-mail me, just click on my name in the right side bar & voila!, there I am.
http://www.financialsense.com/fsu/editorials/2006/0922.html
And China's Peoples' Daily seems to agree (hat tip Energy Bulletin):
http://english.people.com.cn/200609/18/eng20060918_303908.html
I would note that far too much market attention is paid to the weekly oil reserves data, it is more statistical guesswork that measurement. Every now and again (a couple of times a year?) they make an effort to reconnect the weekly data with a more accurate view of reality. I ought to know more in detail about this, if anyone here does - please inform us. If not, when I find out more I shall report back.
The 'bottom line' oil price is around $56, it has been since late 2005, if it breaks below that (highly unlikely, << 5%) then $40 is plausible, if it fails (in its fall) at around $60 then that would probably become the 'new bottom line' as far as the markets are concerned since virtually everything has conspired to reduce the price in the last 2 months.
$85 in November plausible? yes, but it's a mighty leap - as Halfin commented - could be something nasty in the weather or geopolitics associated.
The modeled spike to $105 around Easter 2005 troubles me more. If the model proves predictive $75 becomes the bottom line from yearend 2006.
When OPEC has talked about defending a price in the past it has always been in reference to their own basket which is worth less than WTI. Have they now switched to WTI as their reference point?
I saw this as well, and was somewhat surprised. Historically, the received wisdom has been that OPEC wanted to keep prices at a lower level than that, in order to dampen both price volatility and enthusiasm for alternatives.
It would seem that they have changed their tune. This could be because they have discovered that the world can and will endure sustained prices in the $60 range. Or it could be that they are desperate to rest their fields. I'm sure there are other options I haven't considered.
Thoughts?
They said the same thing in the 70's - they set up quotas - then everyone who could, started pumping as fast as they could - all the while ignoring their self imposed quotas. Not caring about prices either - because as the prices fell - they had to pump more and more to get the same revenue. Just wait - world is going to be awash in oil like the 70's.
Libya and Algieria are two other countries producing over quota.
Venezuela, Iran, and Indonesia being the main ones who cannot produce their quota, except with "inflated" numbers. Inflated in quotes as most experts don't believe in those numbers.
The recent price cuts have hardly amused Putin, whether brought about by US manipulation or not. Some time ago tod ran a discussion of a high level meeting between russia and SA, with the title 'well, i'm sure its just a friendly chat!'.
OPEC would love to have russia join them, and russia's price might be, ok, but we want to influence price immediately rather than later. A cut of 5% production of those over quota from opec + russia would take 1mmb/d off the table and this , plus the idea that a strong price hawk, the number two exporter, had joined opec, would likely move the market in the desired direction.
SA leaders are rather timid, but they, and their populace, would like to have a counterbalance to belligerant US. So, the move would inprove the popularity of SA leaders both within SA and throughout the arab world. Russia's population would see their country's growing clout, and they would like this, too. Bush has repelled much of the world away from the US, thereby driving some into each others arms.
This analysis seems like simply what market traders call 'technical analysis' only with more traditional statistical methods. Kind of interesting to divorce the trends from the 'fundamentals' but totally shaky-flaky if one ignores the fundamentals altogether.
There's nothing at all new here, as Khebab makes clear, the pattern repeats itself.
Each time prices approach a short-term peak, "buy" recommendations by the media also reach a crescendo, causing the most uninformed participants to rush into the market. Meanwhile, insiders and professionals use this opportunity (which can last several weeks) to unload their shares, purchased near the prior low, at great profits. Typical market behavior during this period is to see rising prices at the beginning of the trading day, when amateurs are usually most active, followed by retreats later on (although the market may still close up on the day), as insiders continue their gradual selling. Finally, once insiders and professionals have finished unloading their shares, amateurs suddenly realize that the rug has been pulled out from under them (again), and the correction ensues. Near the end of the correction, the media reaches a bearish extreme, advising the uninformed to stay clear of the market altogether, since further declines are more or less inevitable. At this point, of course, insiders and professionals are buying heavily. For the reasons described above, it's always a good idea to keep a close watch on what the media is saying, and what insiders are doing.
While the behavior of the media and insiders gives some insight into the short-term ups and downs characteristic of both bear and bull markets, the most important piece of information which needs to be obtained is whether or not we are in a bull or a bear market to begin with. For example, in my opinion, we are currently in a commodities bull market, but an equities bear market, both of which began 4 or 5 years ago. This information is vital, since even someone following a, "buy and hold" strategy will make money in a long-term bull market (witness the equities market of the 80's and 90's), sometimes even more money than those who are frantically jumping around trying to anticipate every short-term dip, while in a bear market, the, "buy and hold" strategy is an obvious money-loser.
With regards to the markets today, I would make several points: media reporting on commodities has not yet reached a bearish extreme, insiders are not yet heavily buying commodities, money has been pouring into treasuries over the last three months (Just take a look at a chart of TLT to get an idea of this phenomenon. TLT has risen from 83 to almost 90 over the last three months. Also, keep in mind that the Treasury market dwarfs the stock and commodities markets. So, although the rise in Treasuries is only on the order of 5 or 6%, if that rise came about as a result of outflows from the commodities and equities markets, one can easily understand why most commodities are down over 15%), and finally, recent, very-negative economic news, especially out of the housing market, has not yet led to a significant decline in equities.
Keep up the good work, AC!
Not sure which specific post, but try these:
http://www.theoildrum.com/comments/2006/9/20/91437/0414/168#168
http://www.theoildrum.com/comments/2006/9/17/9148/29769/48#48
AngryChimp usually signs off this way, ==AC
I did a TOD search using his sign-off in the search box to bring up his listings of posts.
Bob Shaw in Phx,Az Are Humans Smarter than Yeast?
http://video.google.ca/videoplay?docid=-6708190071483512003
If that is the case then I begin to wonder about the commodities Bull run too. Will it not run out of steam as the broad market / economy falls ahead of it?
CW
Still, either path, I think I'll buy a little more gold.
I don't think this necessarily has to be the case.
First of all, bull markets tend to be significantly longer than bear markets. I anticipate that the final plunge of the equities bear market will take place in 2010 (with prior severe collapses in 2000, 2006, and 2008), while the commodities bull market should run at least 5 years longer than that. So, during the final five years or so of the commodities bull market, it will actually be rising in tandem with equities.
Second, we can't overlook the dollar. The media has completely ignored the fact that the dollar has been strengthening versus most currencies since Dec. 2004. They haven't reported on it because it doesn't fit with their script of a falling dollar leading to rising commodities. The truth is, for over a year now, the dollar and commodities have been rising together. Once the dollar does resume its decline, which could be quite severe, the effect on commodities will be profound (bullish). So, we have to be careful to separate powerful long-term trends (falling dollar, falling equities, rising commodities) and whatever might be happening in the shorter term. At any given time, equities might be making a short term bounce higher (like this year), commodities might be making a short term dip lower (like right now), or the dollar might be moving higher (like it has been since Dec. 2004). But, IMO, the long term trends are clear: falling dollar, falling equities, rising commodities.
with prior severe collapses in 2000, 2006, and 2008
For sake of absolute clarity - are you saying there is a severe collapse in equities still due this year? (what we just had doesn't really qualify as a severe collapse - right?).
And is it possible to trade into a post-collapse bounce that may last 18-24 months?
So I guess you see some hedge funds going bust?
And will it not be the case that commodities equities will get dragged down along with everything else?
Thanks for your input - its still uncommonly warm and sunny here in Aberdeen for the time of year - good weekend.
CryWolf,
A lot of people are coming up with a lot of really good arguments for why oil prices will fall now that oil prices are at $60. But where were these arguments when oil was at $78?? They weren't there. At $78, everyone had good arguments for why oil would continue to rise. Now it's down 20% and everyone has arguments for why it will fall. It already fell! I wouldn't initiate a short position on oil at this point if someone put a gun to my head. The risk/reward just isn't there. Even though I still think oil will fall to $57 by around November 15th, knocking another 10% or so off the price, this pales in comparison to the rise that will take place later on. And I just don't think a potential 10% fall is a good enough reward to take the big risk on the short side right now. 30% was good enough, but that time already passed.
To be honest, I'm beginning to worry about you, my friend. Now that oil has already lost 20% of its value, you seem to have developed a very convincing system of arguments for why it will drop. Too late. It already dropped. It's not a good sign when you start to buy into these arguments after the fact. By the time oil prices bottom out, your reasoning will have become irrefutable. I don't mean any offense by this, but I think you need to slap yourself. You're becoming your own worst enemy. People need to understand that human logic doesn't work. When oil is topping and everyone has irrefutable arguments for why it will go higher, I listen to music. At the bottom, all of the irrefutable arguments will have moved to the other side. Music.
Back when oil was at $77 and I said that I thought it would drop to $57, everyone used very convincing human logic to prove me wrong. At that point, I made a statement along the lines of, "Sometimes I wake up in a cold sweat at night worrying that once oil finally bottoms out, everyone will have convinced themselves that it has further to fall." At the time, it sounded ridiculous. Can you imagine the peak oil crowd predicting falling prices? At $57? It was the same with gold. This was back when HUI was at 380 and I told you that I planned to start getting in once it hit 260. You made a comment along the lines of, "Get in now. You'll never see prices this low again." Now HUI is at 294. I'll start getting in (GDX) once HUI hits 260. By that point, of course, it will have become obvious to everyone that gold still has a lot further to plunge. After all, the stuff is pretty much useless. It'll be in a free fall by that point, reports of central banks the world over unloading it, and on and on and on. I hope you're not upset abour what I said above, I have to slap myself sometimes too.
So $57 on 15th Nov - I seem to recall this was your birthday.
If I tried to present this at my job, I would be asked why I looked only at a time period that seems selected to create a favorable conclusion. I would have to then go back and do the same thing using period of say five years or ten, which would produce an entirely different result.
Khebab did select a shorter subset of the same data and got the same result, but there is no reason to think either of these periods in isolation explain the future.
I don't think there is any theoretical underpinning for why this analysis should be meaningful or why the period of time selected representative. I provided a link to a recent article on failures of technical analysis.
I do think there is a lot that can be gained by looking at longer term trends and price histories. However, it is an art more than a science and is very easily manipulated. To be useful, the assumption have to be as rigorous as the math.
If you did the same analysis using dry bulk shipping rates for June 04 to June 05, you would think they were going to shoot through the roof, but instead they peaked. In the end, as you note, it is fundamentals that rule the day.
I don't mean to be critical of Khebab, who I think is experimenting and learning. The math is far over my head. However, asking that math to predict the future is asking to do something it just can't do.
After expressing some doubts about SAT's predictions, I more or less began to at least partially agree with him after I read the WSJ front page story about an oil trader who raised over $100 million in a blind pool private offering. His stated purpose was to buy an oil company. He had no oil industry experience, other than his trading background.
At the time this story came out, I said that if I didn't believe that we at, or more likely past, Peak Oil, I would be selling every energy asset I had. (There was also the report of Chesapeake leasing the DFW airport for $10,000 per acre.)
Like SAT, the housing situation gives me the willies. At a minimum, I think we are facing the little "d," deflation, because of debt burdened consumers and businesses trying to unload highly leveraged assets. We could be in the very early stages of the big "D," a depression.
Our current total public and private debt load in the country, as a percentage of GDP, exceeds what we had in the depths of the Great Depression. In the thirties, the ratio spiked because GDP collapsed. Also, the nature of our GDP is fundamentally different from the Thirties, since the majority of Americans today live off the discretionary income of other Americans.
Always appreciate your insightful remarks about how the markets work, I've learned some things.
-- Dave
This is a very interesting analysis. Can you explain why you chose 2002-2006 as your range? Wouldn't this analysis be more informative if you chose a range of a hundred years or so?
I was about to chip in with much the same point, but you got there before me. I would suggest a more modest range -- say 1990 to 2000, or 1995 to 2003, etc. 'Hindcasting' (is that the term?) may not provide much information about the present (which has already arrived) but it does tell us something about the predictive value of the models used. The default assumption is, presumably, that the models that provide the best 'hindcasts' are also the ones that provide the best forecasts.
As Khebab himself states:
In other words, the model would fall apart completely if the commodities bull market were to come to an untimely end.
Incidentaly, I think the point of view most lacking on TOD is the idea that the current, commodities bull market may be killed in its infancy by the coming, housing-led economic difficulties. I don't happen to subscribe to this scenario, but I don't think it should be discounted either.
If I may ask, why not?
I am income, not trade, oriented. I also think an equities bear and commodities bull regime is in place.
BUT, Richard Russell http://ww2.dowtheoryletters.com/ is very concerned about a real estate crash. Thinks by 2007 it will be obvious. He is a big deflation, gold and Treasuries kind of guy right now.
Stephen S. Roach has a bit worth reading too...
US catches cold and the World gets pneumonia.As I mentioned in a response to CryWolf above, I think we need to consider very carefully what the dollar will be doing over the course of the next three or four years, especially if there are economic difficulties in the U.S.. The gradual strengthening that the dollar has experienced since Dec. 2004 may have lulled people into a false sense of security dollar-wise. Remember, just before that, people were in panic mode. The long term trend for the dollar is powerfully down. This will be very bullish for commodities.
Also, U.S. imports from the rest of the world only represent 4% of global economic activity. Given the strength elsewhere, and given the fact that the coming economic decline here will be largely the result of, "pay back" for years of borrowing and spending (a local phenomenon), I think this time the U.S. might catch a cold and the world might sneeze.
My conceit is all present currencies are fiat money; that has prevented me from looking at currency markets. I look at the minute strengthening of dollar every day. Huge amounts of debt in the US need servicing which creates demand for dollars. Central banks have been buying Treasuries to sop up their dollars which tends to support the dollar, but Russia and China have been diversifying out of dollars as reserve currency lately, right?. Not that it matters, but what is supporting the $? Richard Russell just reported that M3 is growing at 9% annually. Plenty more $s available to feed the apparent demand (dollar strengthens). ??
Similar to the top-down banning of cameraphones as a solution to Abu Ghraib, a bit after it hit the news.
The housing bubble or asset bubble has infected a lot of Western countries and China. Also a lot for foriegners invest heavily in American properties. Finally my experience has been that the global economy is very real in my area technology so America still has a powerful effect on the worlds economy.
For example out sourcing of technology workers has been a big driving force for many economies esp India. A meltdown in the US will have a pretty big effect on India.
The real problem is if the US goes into recession there is not a lot of growth anywhere else to take up the slack.
Having lived in China and being married to a Taiwanese wife I thing the view most Americans have about the Chinese economy is distorted at best. It vaunted growth has enormous problems if you look closely.
Its a bastard mix of corruption five year plans and exports.
Pork Barrel is not even close too describing the crooked economy.
If I had to guess I'd say the "real" or modern Chinese economic growth is closer to 5-7% or less this is what I call the internal Chinese economy and exports not dependent on the cheap labor differential. Also I don't think they can last many more years without introducing pollution controls
the pollution in China is a ticking time bomb that will explode. Not to mention water and soil issues.
Once you get past the ooooh look at the growth of China you see a nation with a large number of major problems becoming increasingly more difficult to ignore in favor of growth at all costs.
Finally the central government has not faced a serious recession since converting to a market driven economy the relentless growth has papered over unsolved problems within the government and between the government and its people. Any major hiccup in the flow of wealth could easily cause a major political crisis in China. The autonomous provinces along the coast are just that they basically pay tribute to the central goverment. I expect a pretty big political/tax revolt from them if the Chinese economy stumbles.
If the central goverment does not put the squeeze on the costal region then they will be facing serious political problem from the poor interior provinces. Right now there is already serious tension between the have/have nots in china.
Illegal internal immigration to the coast for jobs is the only thing keeping problems under control.
On the other hand, if China has sufficient momentum to become a self sustaining consumer based economy then falling manufactured exports may be replaced by growing sales at home - is that a possible scenario?
The UK is still joined at the hip to the USA - so if the US catches cold, the UK will still get a doze of flu. Strange thing with the FOOTSIE now is that increasingly it has nothing to do with the UK economy - being top heavy in oils (bp, shell, bg) and miners (anglo, rio, bhp, xtrata + others) - problem with these companies now is that they have reached production ceilings - especially the oils, so faced with flat / falling production, dip in price and escalating costs - they are not the place to be right now IMO.
But I guess you are talking about trading in commodities direct - which I have found is territory best left to the pros.
You made a comment earlier about the buy and hold strategy for equities - which just doesn't work in a bear market - and I obviously have to agree with you on that. Problem is that is exactly what the majority of the large pension funds do. The UK still has a dire pensions crisis which if you are right about equity drops in 2006 and 2008 - is set to get a whole lot worse. Not only that we have a lot of these endowment mortgages with hefty deficits between redemption value and outstanding debt - so folks on retirement, instead of getting a windfall lump sum - have to find a way of covering the differnce at a time when they learn their pension is only going to be a fraction of what was planned.
I was thinking what's needed is taking a look at the time frame of 1998 through 2001.
The parallels:
- Oil prices rise, roughly tripling over 3 years.
- Fed raising rates.
- Bubble in progress.
Anybody remember what happened after that experience?You will recall further that my year-end target for USA contract crude is currently $52 and in reality has fallen from its peak of $69 to $57. The former playground of speculators, Spot Oil, no longer has a 20% premium over contract prices. It is now less than 8%.
Those who made decisions based on "spot oil" were duped. Those who saw the dramatic rise of spot oil as a reflection of their premise of oil shortages were similarly misguided. This was always about "perceived" shortages and media hype bordering on hysteria.
And i luv it...
Main question though is where do you see a lot of the additional capacity - Caspian, Angola and Brazil for sure - may just be able to compensate for decline else where. But with Russia essentially re-nationalising their whole industry - that will likely lead to supply falls, deep water proving to be a technical nightmare for bp - where is the surplus capacity?
Jul 14, 2006 76.8 226.50 231.00 182.86 43.64
Jul 21, 2006 73.52 226.90 234.15 175.05 51.85
Jul 28, 2006 73.3 227.00 224.00 174.52 52.48
Aug 04, 2006 74.78 227.45 225.58 178.05 49.40
Aug 11, 2006 74.38 204.25 199.50 177.10 27.15
Aug 18, 2006 70.93 196.13 196.13 168.88 27.25
Aug 25, 2006 72.13 187.01 185.76 171.74 15.27
Sep 01, 2006 69.24 177.85 173.60 164.86 12.99
Sep 08, 2006 66.3 162.48 161.10 157.86 4.62
Sep 15, 2006 63.3 162.25 157.38 150.71 11.54
Sep 19, 2006 61.77 152.75 150.25 147.07 5.68
I've always thought that Fourier Transorms and Series were the last word in finding periodicities in data. I've not had a chance to assillate the Periodicity Tranform paper you link to, but it appears, at firt glance, to be slicker than flingin' pig sh*t off a greased shovel.
A couple comments/questions: 29 basis elements seems like little more than noise to me. What percentage of the energy do the 4 largest basis elements compose?
Have you done any (retrospective) modelling were propsectivly extrapolate existing data? How far can you
extrapolate with a 95% confidence interval? 90%?
Jeez, this looks like a crystal ball.
Of course now its broken 'cause it public. If it works, the big boys will use it. Then we'll get postive feedback causing chaotic oscillations, disrutping any periodicities that measured to begin with.
The percentage are shown on top of each basis element plot (49.4%, 11.36%, 3.82%, etc.).
re: Have you done any (retrospective) modelling were propsectivly extrapolate existing data? How far can you
extrapolate with a 95% confidence interval? 90%?
That's a good question, I could try.
Have you done any (retrospective) modelling where you propsectivly extrapolate existing data?
Sorry.
Here's a test. Try taking some period in the past, like the time leading up to this year. Do your same fit, using the same components and the same number of terms. Then extrapolate it forward and see how closely it matches what actually happened in 2006. In my experience predictions like this always fail these kinds of tests.
That's probably right. Even if the periodic components perist into the future, there is probably enough "phase jitter" to flumox any exprapolation. And as I mentioned earlier, IF it did work, then it still wouldn't work as the market's use of this information would undermine the forecasts.
Before Katrina/Rita, the PT prediction is pretty good.
The error is below 12% for the 6 months of 2005.
Halfin? Next excuse? We're waiting.
In any case the proof of such techniques is in their predictive value over time. We will see how things go over the course of the next few months and how they compare to the prediction in the top post. Basically it indicates that we should very soon begin a strong climb that takes us to near $85 by the November time frame, followed by falling back to the mid 70s at the end of the year. If this is close to what happens, it will be a great success for this technique (and a great surprise to me!).
After all, what could drive oil so high over the next two months? All I can see would be maybe a couple of major hurricanes in the gulf, maybe renewed tensions in the Middle East. But how could this graphical technique possibly predict events like this? On the back test it failed to predict Katrina, so apparently it has no power to compel hurricanes to move about. Is it plausible that this curve has power over global politics, that it can cause some Israeli border incident, or force Iran to announce some ominous nuclear milestone? I don't think so!
It would be beyond peculiar for this prediction to come out correct. It would seem to almost imply that Fate exists and that humanity is a mere pawn as we are compelled to take actions that obey this predictive curve. I don't believe that's how the world works.
I'm having also a hard time believing that it can happen. Volatility for the two last quarters has been relatively moderate. I just tried that new technique for simple intellectual curiosity. There are little theoretical justifications for its validity. Many people have tried to find esoteric "key" patterns in stock markets based on Fibonacci numbers and log spirals.
http://www.economist.com/finance/displaystory.cfm?story_id=7953427
Has links to two academic studies as well.
Excellent work as always. From eye-balling the last upswing in early 2008 from Fig. 6: it looks like it swings from about $88 to $144 in about 3 months in the last charted upcycle. Assuming swings of such drastic time-compressed amplitudes are possible, it creates vivid pictures in my mind:
- How much of an upswing in gasoline prices can detritovores tolerate before they get violent? If prices are jumping 5-10 cents a gallon every day, and this keeps up for weeks without end-- at what point do people start freaking out?
- At what point does this increasing detritus volativity cycle become out of synchronization, and therefore at cross-purposes with natural cycles of weather and growth in plants? For example, if farmers cannot afford seed, fuel, and fertilizers at the correct planting times--they miss taking advantage of the natural growing cycle resulting in less total food grown. Or if they cannot afford the fuel to harvest the crop, and/or the food companies cannot afford to process & distribute the foodstuffs in a timely manner.
We are already seeing evidence of this in Zimbabwe. Inflation is now projected to be approx. 4,300 %, massive bread shortages are evident, and potable water problems are getting worse. Yes, Zimbabwe is mis-managed, but if modern economies cannot wisely plan, then effectively manage their operations due to these wild pricing swings--we will be in the same situation.I throw this out for you to consider as I have no idea on how to chart effects from detritus swings butting heads with natural swings.
Bob Shaw in Phx,Az Are Humans Smarter than Yeast?
Thxs for responding. In the recent past, people have used credit from charge cards and their house ATMs to continue their access to energy flows, but this will soon change. As more and more people will be forced to paying cash, or not buying anything but the bare essentials, I think this will add to economic volativity, but experts may know better than me.
Farmers constitute such a small percentage of our population [0.7% source: CIA Factbook] that it would not take much residual cash from the other 100 Americans to price the farmer out of the market entirely unless the govt came to their aid so they could prepare their fields in a timely manner. Recall the Peakoil TV docudrama, about a year ago, that showed the farmers leading the protests. If global warming is causing increased weather volativity, and it is combined with the rising FFs volativity: it might be a solid 1-2 punch for farmers. Yikes!
Bob Shaw in Phx,Az Are Humans Smarter than Yeast?
Other alternatives for generating electricity for transportation have a better--or at least, potentially viable--future. CO2 sequestration and all that--it's a problem, of course, if we use coal to get that electricity. But alternative sources that make electricity are at least part of the solution. Price volatility has a depressing effect on all attempts to harvest any kind of energy, whether it is fossil fuels, biofuels, solar, wind, hydro, high-tech batteries, storage systems like hydrogen, you name it. Better we should live in a world of steadily and predictably rising prices.
Ultimately, this is one of the two reasons I care about prices. The other is that if the prices become depressed for a long time--given a global recession resulting in much lower demand--then development of any energy source to get us out of this mess is impossible. This last remark applies particularly to new oil & gas supplies since everything is so expensive to develop now. But we need a bridge to a different world and these new fossil fuel supply sources give us that. I don't want to fall off a cliff. Price volatility is bad for us. It's also a sign of the beginning of the end (sigh). Is there no way out?
-- Dave
Thxs for responding. Agreed, I am in favor of less volativity, and/or steadily, but slowly rising prices too: if it allows farmers and localized permaculture to adequately plan, farm, then harvest at optimal resource and climate levels. We can always bicycle, but we won't last long without food.
The big problem is if FF prices radically spike higher around harvest time: then the farmers can maximize their profits by selling to the ethanol and biodiesel producers, thus insufficient amounts are diverted to replenish foodstores. If we get a drought in the next farming season, and even if FF prices have rapidly ratcheted down, it will make no significant difference without rain-- we could quickly find ourselves in the Zimbabwe situation.
You can store crude indefinitely, but you can only store grains or ethanol for a much shorter period. If FF prices whipsaw around too fast and too much--the ethanol producers go broke because now they can't sell their raw material, or their finished product before it spoils. Pretty ugly scenario.
Bob Shaw in Phx,Az Are Humans Smarter than Yeast?
The 2nd column is WTI spot Cushing Ok.
The 3rd column is Gas spot NY in cents/Gal
The 4th column is Gas spot Gulf Coast
The 5th column is Cushing spot in cents per gallon
The 6th column is column 3 minus column 5
As you can see, why was the difference in July and August up in the 50 cent range, and now with oil at 60 dollars it is in the 5 cent range? I need to down load this data for the past 5 years and see what the normal or average difference is. It would seem to me that the 50 cent range would be about the average. Does this have a fishy smell or is it just due to excess inventory of gas, however the inventories have only changed by less than a days consumption. Of course this data doesn't actually reflect refinery margins because of inventories and contract purchases of crude by the refineries.
J-07-06 73.76 218.62 220.62 175.62 43.00
J-14-06 76.80 226.50 231.00 182.86 43.64
J-21-06 73.52 226.90 234.15 175.05 51.85
J-28-06 73.30 227.00 224.00 174.52 52.48
A-04-06 74.78 227.45 225.58 178.05 49.40
A-11-06 74.38 204.25 199.50 177.10 27.15
A-18-06 70.93 196.13 196.13 168.88 27.25
A-25-06 72.13 187.01 185.76 171.74 15.27
S-01-06 69.24 177.85 173.60 164.86 12.99
S-08-06 66.30 162.48 161.10 157.86 4.623
S-15-06 63.30 162.25 157.38 150.71 11.54
S-19-06 61.77 152.75 150.25 147.07 5.679
I think maybe Bush & Co. had some influence with the producers & refiners to overproduce, thus driving the price of gas down just in time for fall elections. Why was Cheney so certain that the US House would remain in the hands of Republicans during his exchange on the news program (Meet The Press?) last week? Remember most users of gas are voters while most users of diesel are not (corporations & institutions).
Unless you were on the other side of the trades. Then, the party is just beginning.
http://www.bloomberg.com/apps/news?pid=20601103&sid=aDOS5DfPpLX4&refer=us
The money was not likely "lost". It transfered hands.
Speculating in energy futures is dangerous.
You are dealing with super-smart guys who know how to make money even from a guy like Nicholas Maounis. And who are totally invisible.
The simplest answer comes from the economic cycle. From the graph below, you can tell that From 1969 until 2001, a US recession has followed everytime the yield of the 3mth Treasury (red line) has exceeded the 10yr Treasury's yield (blue line), the event is called a Negative Yield Spread (NYS).
Since the US has historically been the largest consumer of oil in the world, each time it went into recession, it brought international oil prices (black line*) down to the levels they started climbing from in the preceding years.
On July 17th of this year, the NYS reappeared for only the seventh time over the last 40 years (see arrow). Since we had a recession the other six times it showed up, the probability we get another R over the next 3 to 15 months is very high. Hedge Fund managers, a completely different breed from oil traders, have been reading this simple message since July, and because the NYS has persisted, they have started to act on it. Just by the incredibly violent nature of the fall in prices, you can tell it is the hedge fund's $150-200 billion-plus money that is coming out.
Also, notice on the graph that the NYS always coincides with sharp oil-price increases, that is because high energy prices usually cause the Fed to increase short-term rates and while both factors choke US transportation companies, their massive employee layoffs start flooding the economy with the void of demand that eventually leads to recession. Additionally, today we are facing a prominent third factor that assures our imminent dive to bottom GDP numbers, the housing bust,
In the end your curve-fitting argument, no matter what we call it, has no chance of lifting a hair off the massive oil price drop that is coming.
SOURCES:http://research.stlouisfed.org/fred2/, http://www.eia.doe.gov/oil_gas/petroleum/info_glance/petroleum.html
True, recession has followed a persistent Negative Yield Spread, yet not before during world wide peaking oil with depletion rates of 6-8% or what ever they really are. Even if oil should go down to $50, it can't revert to $12 or $2, there won't be the supply to balance even drastically reduced demand.
In the Business as usual case I'd say you are right in general.
But if peak oil is really here then no the price won't stay down for long. Think about even if a 3% drop takes place in the economy it we use 3% less oil its not a huge change in the overall amount of oil used. Now I'd say 3% drop in the economy probably does not cause a 3% drop in usage I'm sure its smaller then that say 1-2% and we are not even to the point of recession yet, soon but not yet. And even when it does kick in in earnest say 2007-2008 it will be a while before we hit 3% decrease in the GDP.
I think the recession will effect consumption but if you look at the numbers it probably will come in step with declining production. If we are lucky recession may slightly lead declining production the first few years but its going to be a close race. Now your assuming that production capacity is a constant or increasing in a recessionary environment which has been true in the past but probably not this time around. The rules are changing.
src: http://www.gold-eagle.com/editorials_05/milhouse082906.html
Barring any major calamities/disruptions/major recessions I think this trend line will hold out for another year or two. I just cant see it going much past that, either due to panicked buying to increasingly noticable depletion rates or panicked selling as the global economy enters a self reinforcing downcycle that drops demand below geological capabilities.
Great analysis and future trend prediction. I took your graph and added some "predictive media explanations"
Barring any major calamities/disruptions/major recessions I think this trend line will hold out for another year or two. I just cant see it going much past that, either due to panicked buying to increasingly noticable depletion rates or panicked selling as the global economy enters a self reinforcing downcycle that drops demand below geological capabilities.
Take a moment to look for example at a little pet of mine, Bill Barrett Corp., a western U.S. natural gas driller...
http://finance.yahoo.com/q/bc?s=BBG&t=2y&l=on&z=m&q=l&c
Went  public to great fanfare in late 2004 at about $28.00 per share, and by 2nd quarter 05 had broken over $40 per  share.  Barrett the elder is no newcomer, having had a long and successful carreer in the gas business, and this firm, founded by himself and a son, despite at that time having no earnings, showed tons of promise.  After topping in 4th quarter 05, however, the companies shares have slid, to the point they are today, approx. one year later, to a per share price of $24.38, almost 20% below where they went public (!).  This despite now having a very respectable for such a young small firm, P/E ratio of 16.00.  Rumors are that they are reducing drilling contracts and commitments to contractors because the natural gas price is so low, despite promising drillng prospects (they can "store the gas in the ground" easier than anywhere else!)
Apache Oil, with a P/E of 7.10

http://finance.yahoo.com/q/bc?s=APA
Anadarko with a P/E of 6.63

http://finance.yahoo.com/q/bc?s=APC&t=2y&l=on&z=m&q=l&c
Chesapeake Energy Corp. with a P/E of 7.35
http://finance.yahoo.com/q/bc?s=CHK&t=2y
Conoco Phillips with a P/E of 5.38 and a dividend yield of 2.50% (!)
http://finance.yahoo.com/q/bc?s=COP&t=2y
This is not exactly the "great bull market" for oil and gas that one is given to believe, is it? The infrastructure and oil services companies, on average, have done no better.
What does this tell us? Several things"
- For whatever reason, there seems to be no real faith in "peak" anythng among the energy investors. If there was, these firms shares would be a steal, but it is certainly not being viewed that way by the big players.
- If routine drilling on easy prospects is not profitable by young lean and hungry firms, and even secondary "tertiary" drillers, what are the prospects for investment in pipelines, LNG facilities, or expensive arctic or offshore drilling programs? (McKenzie Bay comes to mind)
- Given todays costs, what price does it take to inspire real E and P efforts in gas or oil?
Much more speculative is the idea of long cycles of the Kondratieff Cycle type. The Kondratieff cycle is sliced up pretty good lately, notice the page onhttp://www.whiskeyandgunpowder.com/Archives/2006/20060116.html
This is why I used the term "type". If the Kondratieff long cycle has proven inaccurate in it's period, (said to be about 52 years) is it correct in theory, that there is a "long cyle pattern" to economic cycles, and to commodity prices, including energy, prices?
If so, what is the period of the long cycle? What causes it? We know that in 1982, against all odds, the price of energy worldwide (and not just crude oil, but natural gas and LPG as well) began a sharp decline, and stayed at or below the historical mean line for 20 years, despite growing world economies, and increasing demand. We are now in the 5th to 6th year (roughly) of a steep run up in price, before this recent downturn. The run up of course could be explained by impending peak oil, and the knowledge among traders/speculators/market makers. After all, if they did not realize peak was upon us, they would not buy energy shares and futures in the volumes and at the prices they did, correct? But that surely would not explain the recent steep downturn. Did the market makers suddenly forget that peak was upon us?
Or, as some suggest, is the price move purely part of a market cycle or fluctuation of long cycle? Cycles of 20 and then 6 years would qualify as secular market trends, not just cyclical shifts.
The question now is, how long will the energy price decline have to run before it can be considered a secular shift back to low energy prices, until the next shift comes back to rising prices? Referring back to my examples at the top of the page, how long will the downturn in energy price have to go before we get a "bloodbath" of the 1980's type in the oil and gas industry?
My bet is 5 to 7 years, IF, and this is a big IF, peak is not in the immediate offing. But a good indicator that there is a real supply problem, as opposed to financial, political and logistal stalls, would be if prices returned to the upward march within 6 to 9 months, and matched or topped the $75 highs. This would be the time to start being concerned, and assume that $100 or slightly above would be possible.
As I have said before, I do not think any crude oil price above $120 inflation adjusted is sustainable for long because there are simply too many good alternatives, and if the $100-$120 don't happen within 5 years, the quality and variety of the alternatives will only be even greater then than now (remember, the alternatives DO NOT have to replace ALL crude oil consumption, only enough to be "swing" amounts, and regain price leverage). And recall that time is a factor. In 5 years, a fair market price for crude oil will be back over $80 per barrel based on inflation alone, peak or no peak, and even $100 will be more annoying than anything else.
So why is all this more than just an egghead argument? Because if you can guess it right (and who has more than a guess at this point) it turn a small bit of chump change into a life altering amount of money.
Futures are being made. If you had bought oil and gas and held some 2 years ago, it would have seemed like the safest bet you could have made.
But, as we see, you would have bounced around a lot, gotten high blood pressure trying to guess what to do, and lost two years of investment time, and remained in park. It's an interesting world, isn't it?
Roger Conner known to you as ThatsItImout
BrianT, you said, "What is interesting is that everybody (John Q public included) agrees that $60 crude is cheap and $2.50 gas is cheap."
I have not seen that reaction here in central KY. People here are waiting with baited breath for that $1.25 a gallon gas so they can break out the big Dodge and tow the speedboat to the lake, or the RV our west! :-)
But, allow me to speak for myself....$60 crude is GIVAWAY CHEAP if there is actually a crisis of production. The Brits made made azzes of themselves by giving it away at $20 and $25 dollars per barrel, as they were within a decade of major crisis. Will other nations now do the same? Who knows....
I like to play a bit of a game....tack on some zeros and imagince oil is something else....
If a house cost let us say between $12,000 and $25,000 in the early 1980's, would we be surprised if it cost $60,000 to $70,000 now?
If a year at a college cost say between $12,000 and $25,000 in the early 1980's, would we be surprised if it cost $60,000 to $70,000 now?
If a medical procedure cost say between $12,000 and $25,000 in the early 1980's, would we be surprised if it cost $60,000 to $70,000 now?
No, we would consider that pretty much normal inflation....but if oil moves as much as a dime, everybody comes unglued...., and remember that we are leaving out the late 197'0s spike to what would $90 bucks a barrel, which would further average down the price of oil by comparison now....
Yeah, I would take $60 dollar oil from now on into infinity and be overjoyed!
Roger Conner known to you as ThatsItImout
The Banksters have influenced our thinking.
About half of the $60K in your example is due to "normal inflation". The remainder is a 150% profit in 26 years.
During the Iran hostage action in 1980 oil was $80; if a lot more oil wasn't being produced "normal inflation" would put the price today at over $196. How long will cheap oil will last is the $$$$$ question.How long will cheap oil will last is the $$$$$ question.
My bet is that until the Amaranth et al disaster is done unwinding their positions it would be difficult to determine a low on Oil prices. The effect of this sort of extraneous event (of supply/demand) cannot be determined, IMHO. However, in the absence of such events, your conclusions seem well reasoned, if somewhat over my head...
Once these forced liquidations stop, we will get a clearer view of the marketplace.
I am new to this form. Thanks for learning so much!
I want to learn more about PT as mentioned by Khebab.
To make a first comment: Each of 29 basis elements can be composed with Fourier in (co)sinus functions IF they were of infinite duration. If you choose another period for example the end of 2000 to the end of July 2006 you get another list of finite periodicals and hence an other prediction. Or does this not make a big difference with oilprices?
How to get Matlab to make some analyses on my one?
Thanks in advance,
Aart
Before 2002, oil prices behaved differently probably because of the 2001 recession. I'm not sure that 29 is the optimal number for the basis (I have not checked beyond 32).
Unfortunately, Matlab is a commercial software. There are open source equivalents (SciLab, Octave,..), see here for a review.
Thanks!
Also for the quick reply and the link!
I have contacted MathWorks to buy MatLab but they didn't respond. May be they are closed by too much succes...
I'm quite keen to be able to do routine periodic forcasts and some analysis on their short-medium term reliability.
And while I might be rather a bit clever wiht Excel, that won't really cut it - my only exposure to Matlab was installing it as a tech years and years ago...
If I install Scilab, would you be prepared to give me a bit of a handgetting to grips with running the periodic analysis (I'm hoping I can pick up the scripts(?) without having to understand them too much.
Of course, I'll make all the output available to TOD in some fashion.
I really think it would be interesting to see if (say) fortnightly directions and magnitudes are significantly better than average (I'm stunned by the 2002-2004 results you posted - was it a fluke...)
Also to play round with some longer term runs - see what comes out looking back over the flat pre 2001 period (yearly patterns etc)
So much I'd like to look at - but I don't have a clue what I'm doing - signal analysis ain't quite the same as curve fitting I suspect..
Regards,
--Justin
My questions / comments:
The last drop in oil price is more likely to have something
to do with:
price would keep going up and incurred losses
Sachs Commodity Index
No offense but your decomposition doesn't prove anything.
is so important to understand the variations that we see.
http://www.financialsense.com/Market/kirby/2006/0925.html