Further Saudi Arabia Discussions
Posted by Stuart Staniford on April 6, 2007 - 9:05am

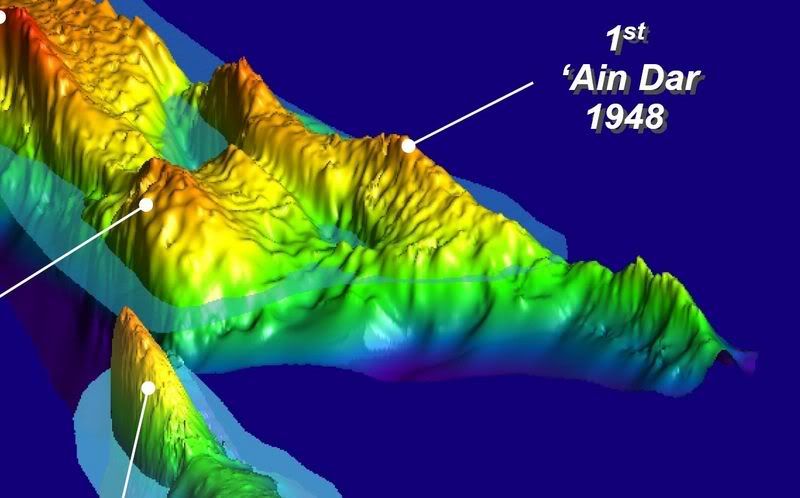
And the rest of North Ghawar might not be too far behind... Bob Shaw found this picture here:

The temptation to publish all this gorgeous reservoir simulation porn has just been overwhelming to Aramco's engineers I guess...
This post is a place to continue the Saudi Arabia discussion. To keep the ball rolling, I've extended a couple of my graphs. The above graph is the production data, with all series extended back to January 1995, or as far back as they are available online. I've also added a fifth series from the Oil and Gas Journal. Plotted on the picture is Saudi Arabia's OPEC oil quota.
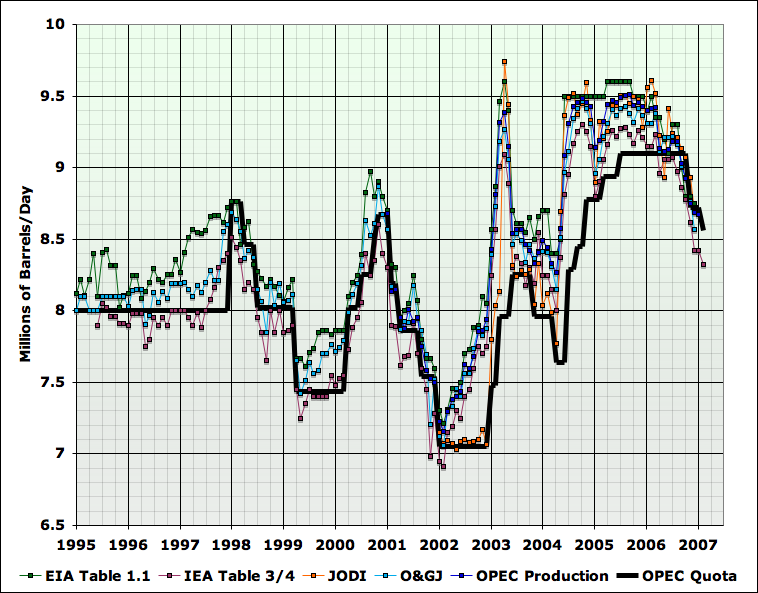
I showed production against the quota since some folks have been suggesting that perhaps the recent declines represent Saudi Arabia's attempt to return to quota. Here's a production index constructed from the five series, together with quota (and rig count at top).
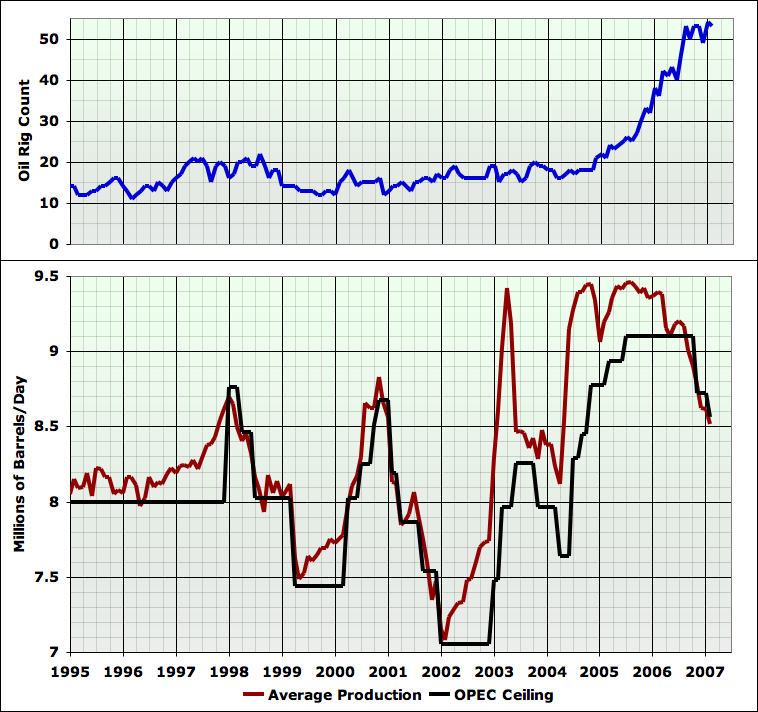
I don't find the "return to quota" explanation very appealing, since the decline begins over a year before quota starts to drop, when prices were rising, and the index has now gone below quota despite continued fairly high prices. But another few months of data should say a lot more.
Contact
- Content: editors at theoildrum dot com
- Tech support: support at theoildrum dot com
License

This work is licensed under a Creative Commons Attribution-Share Alike 3.0 United States License.
"I don't find the "return to quota" explanation very appealing"
Looks more like a "return to below quota" at a glance.
"I don't find the "return to quota" explanation very appealing"
Just 'glancing' at the first chart - without the average production, I see that Saudi production tends to lead the quotas (especially for IEA data). That is what it is doing now. I fail to see an anomoly based on the chart..
----
My grandfather pumped oil with an engine-house,
my father pumped oil with a 20 lb. electric motor,
can't I just pump it online?
But I'd say that they're historically quick to lead on the upside and reluctant to lead on the downside. You'll also notice that when prices were going up, or were staying high, they were far exceeding the quota (most likely to take advantage of the high prices). So that last bit of the trend, being quick to lead on towards the downside, and at or below quota during times of high prices, represents a departure from history (over the span of that graph) to me.
Re: So that last bit of the trend... represents a departure from history (over the span of that graph) to me.
Yes but oil inventories are still at record level for OCDE countries and OPEC has historically always used inventory levels as a way to assess the demand and supply equilibrium.
ROFLMAO Great tag line. Keep that.
Actually to me it looks like quotas are reactive to what production is already doing.
Request
I'll put up a new thread after I get home tonight (Pacific time) -- as this one is getting full -- but in the meantime, if anyone isn't busy and wants to help the project, see if you can dig out any information that bears on the thickness of the Arab D reservoir throughout Ghawar, and particularly in North 'Ain Dar. We have the Greg Croft average numbers for each area, but if someone can find a map or picture that shows in detail how the reservoir thickness varies throughout the topography, I think that would be a big help.
Don't know if this is what you are looking for but here is a title: Geostatistical Model for the Arab-D Reservoir, North 'Ain Dar Pilot, Ghawar Field, Saudi Arabia: An Improved Reservoir Simulation Model.
Behind firewall at:
http://www.gulfpetrolink.net/publication/vol1.php
This one has lots of pretty pictures.
http://www.searchanddiscovery.com/documents/2004/afifi01/index.htm
Deleted
Sorry, I just posted the Greg Croft URL before realizing you already had it.
Hello SS,
Jean Laherrere has an excellent, next generation 3D rendering of Ghawar looking from the SW --> NE [opposite direction of garyp's post]:
http://lpsc.in2p3.fr/gpr/Dautreppe/Laherrere/Image78.jpg
This might come in handy later, maybe Jean has original software.
F_F & Euan: I am fascinated with Uthmaniyah's far eastern ridgeline. If you look at GaryP's cross-sections and compare with Ghawar Oil Sat graphic--hasn't the waterfront rolled over the crest? How is the fractional flow skewed, watercut ratio best managed, and reservoir sweep best accomplished with pressurized water going downhill? I have no idea, hope you can help SS out.
Where do garyp's slices go on the Laherrere 3D and on this Uthmaniyah Graph [scroll down inside website please]:
http://home.entouch.net/dmd/ghawar.htm
Notice this above graphic from Alexander was in 1996-- has Uthmaniyah had a lot worse waterfront problems since then? We can't see the Western side of the Eastern Crest
My guess is the thick green rollover about halfway down Uthmaniyah Eastern ridge, but on the unseen western side in the Ghawar Oil Sat is where those slices best match up--but you guys might have better ideas!
From Greg Croft website:
--------------------------------
The fact that the Ghawar oil-water contact is substantially higher on the west flank than on the east indicates a hydrodynamic gradient to the east, which may explain the much larger volume of oil in Ghawar than in Khurais.
The oil-water contact at Ghawar dips to the northeast, dipping more than 660 feet between the southwest end of Haradh and the Fazran area.
-------------------------------------
This suggests to me that Aramco should have put Uthmaniyah's water injection more heavily on the west side to drive the oil east and upcrest--they did the opposite [eastside injection wells watered over the crest in a western direction instead]. Could you explain?
Another thing from Ghawar Oil Sat graphic: why is the Southern lower half of Abqaiq orange instead of yellow--what is the significance? Major reservoir sweep problems compared to Northern lower half, which is solid yellow?
One last thing:
When I blow up the PDF of the Ghawar Oil Sat graphic with the magnifying tool to 1600%--you get much more detail--for example the Shedgum to Uthmaniyah thin connection looks all blue at normal resolution but shows green breakthrough at high magnification. Farzan is only 3 miles wide at its max [approx. 3 cells wide at 1600%]--can this be a tool to generate our own cells for our own Ghawar graphics?
Bob Shaw in Phx,Az Are Humans Smarter than Yeast?
Bob, your doing an amazing job here digging up all this stuff - heres the picture you posted. Does Lahererere indicate what the coluours mean here? I'll respond to your questions in a separate post
http://lpsc.in2p3.fr/gpr/Dautreppe/Laherrere/Image78.jpg
Any idea on the data source(s) for this impressive graphic ? Date of data ?
My guess is that this is an educated guess for today based on available information.
It may be worth noting that the most important thing I have learned so far from this extended discussion is NOT when Ghawar production will drop
A) Now
B) Very Soon
C) Soon
although that it is critically important.
The most important lesson is that it will be a very sudden and rapid collapse for each affected section, and the "at risk" sections (see multiple choice above) total an irreplacable ~4 million b/day !
Best Hopes,
Alan
Hello Euan,
Sorry, can't help with any more details on the graphic--I don't know French.
The TopToders have got to carry the ball forward. I have practically turned into a zombie trying to stay up with you guys. I have even been googling, then reading sponge coring links after F_F mentioned it---is that sick? =)
Bob Shaw in Phx,Az Are Humans Smarter than Yeast?
OK Bob, doing the same as yesterday (and wasting even more time).
First off the modeling grid from the "When 4D seismic is not available: Alternative Monitoring Scenarios..." and "Reservoir Monitoring with Permanent Bore Hole sensors", both by Shiv Dasgupta are the same. You can have great fun lining the things up and finding that there are more bore holes on one than there are on the other. That means we have the top down data from one and the cross section data from the other to compare.
Doing the now normal and arranging each on top of the 3D view leads to the two resultant image below. Its harder to decide exactly where these lie this time, but I think this is about right. I've highlighted the area I think is oil from the cross section in the overlay.
Thus in 2004 there was a good 120feet of oil across a reasonable area of Uthmaniyah.
Everyone can now commence saying I've got it all wrong !
Has anyone "picked up the phone" so to speak and called/wrote greg croft, Laherrere and asked to signon and take a look at the discussions here? Matt Simmons talked about this series of posts(financialsense.com), etc.
These two as an example have put alot of work into these pictures and graphs, would they be interested in the discussions here?
How about sending out emails to Heinberg, Croft, Laherrere, Simmons and asking them to take a look and maybe comment?
Worth a try.
If you refer to yesterday's discussion about how North Ghawar will or has played out would you rather
1. Accept the fact that North Ghawar is watered out and it is reflected in that 1 MMBOPD production drop and deal with it.
2. Know that if that drop hasn't occurred it is bound to happen, it is in process right now and who knows where we will end up. Some other problem has or is occurring.
Next stop Uthmaniyah.
Hi Stuart
Euan Mearns argued here that the average oil production per well did not show any sign of decline until 2005. are you arguing that it dropped actually since this date.? what's the difference between number of rigs and number of wells, is it the same?
Gilles,
The post you reference is a post where the comments are tremendously important. Euan's post had a few pretty big and important holes shot in it in the comments section...visit these links for the greatest hits...
Ace's original post proposing the effects of MRC/Hori wells on well productivity: http://europe.theoildrum.com/node/2372#comment-170432
Well productivity with cumulative horizontal wells on same graph: http://europe.theoildrum.com/node/2372#comment-171280
Well productivity revised for 3 to 1, vertical to horizontal equivalent: http://europe.theoildrum.com/node/2372#comment-170649
I addressed the issues I saw with Euan's post toward the end of Water in the Gas Tank
What Substrate said. Read the comments. IMO, the meat grinder of TOD pretty much blew Euan's post right out of the water.
Which doesn't mean he's wrong, but if he's right, that post doesn't provide any support.
Leanan, since you are an editor of The Oil Drum, I think you really need to back this comment up with some pretty meaty details.
As far as I was aware I was merely reporting a data set and making what I still consider to be reasonable interpretations. The main weakness was the fact the data series stop in 2005 - and I did not feel inclined to simply make up data to plug the gap.
So a detailed response please of all the errors and weaknesses in what I presented. I think you also need to add some details on how you would interpret the OPEC data - or would you simply choose to ignore them?
I'm just the news editor. I have no say in the content of the other articles.
It's all laid out in the comments to your post. Substrate and Darwinian have already posted in this thread the most salient points.
Don't get upset. This is how it's supposed to work. This is TOD at its best.
I agree. That's TOD at its best.
All the contrubtors take their knocks. I just wish I had as much to offer the board as you.
Euan keep posting, without great contributers such as you TOD suffers.
I'm not upset I'm just sober and waiting for a response. WRT to the opinon you expressed I would have thought you should have at least 2 to 3 good arguments at your fingertips and could at least have the courtesy to jot these down for everyone's benefit.
Hi guys
I didn't intend to cause any trouble between all TOD contributors ;-). I really find you're all doing a fantastic job, and I understand quite well that there may be some divergence and/or dispute to establish the truth, considering the complexity of the problem.
I DO believe that Euan's approach is potentially interesting - but may be a little bit more argumented : for instance, do we see, or not, a clear variation of the average oil production per well in the historic cases of peak production? (Texas, US, North Sea?) Is there a linear trend similar to HL, or an abrupt phase transition? and of course, what is the situation of KSA since 2005 ? looking at Stuart's plots, it seems obvious that nothing very special happened before 2005 - just chaotic production caused by the "swing state" status of KSA, but that something actually changed after 2005. It confirms the study I made on EIA's forecasts vs real production, showing a sudden plateau after June 2005, which was not planned at all. So is there a clear indicator that we can construct, clearly showing something has changed (and may be rotten) in the Kingdom of Arabia?
Gilles - I think you are entirely right that the avearge well porductivity with time needs to be examined in other countries - I've been thinking about doing this and will now give this priority.
The key points to me were the ones you conceded (or at least, it seemed to me that you did - perhaps I am mistaken).
1) The data ends just before it gets interesting. Therefore, it doesn't prove your point. It doesn't prove Stuart's point. The data you presented is mute on the period we were discussing.
2) The horizontal vs. vertical wells. Your graph looks very different when that is taken into account (and you posted it yourself, to your credit).
Given those two issues, the rest really doesn't matter.
Leanan, thanks for repsonding. As I've said here on several occassions the only time your hear the word crash used in the oil industry is with reference to stock prices and hellicopters.
So if Saudi production was about to crash (as the current decline rate would suggest if this were natural decline) I'd expect to see some evidence of trouble ahead leading up to 2006 (though note my comment in response to Gilles). I still find evidence for trouble ahead lacking in the average well productivity data. I'm sorry the data series ends in 2005 and as noted I feel disinclined to make data up to plug the gap.
I've also indicated that I find the horizontal versus vertical well debate to be rather sterile. The fact is that the Saudis used to have vertical wells that did 50,000 + bpd, but as these have progresively watered out, the productivity of these wells has declined.
The Saudis are using horizontal wells in two main settings:
1. Short radius horizontals placed at the top of old vertical wells to provide a tool for balancing dry oil production with wet oil production to acieve a target water cut.
2. Single bore and multilateral horizontal wells to produce oil from low permeability reservoirs (which are the norm throughout this part of the Arabian Gulf). These reservoirs are very difficult to produce at high flow rate using vertical wells.
I'm afraid I just plain don't understand this statement.
To me, the essential argument of your post is that well productivity was not declining, and it should be, if Stuart is correct.
But given the two factors I listed previously - that we don't have data for the period Stuart thinks the decline began, and that horizontal vs. vertical wells could make a big difference - that argument doesn't doesn't hold. It doesn't mean you are wrong, but it doesn't provide any reason to believe you are right, either.
Given that, I just don't think the rest of it matters. It's like arguing about what color you want to paint the walls when the foundation has collapsed.
There may be solid arguments that prove you are right, but if so, they will be built on a different foundation than well productivity.
At least until we have more data...
Euan - have you read the discussion of the monthly interpolation I did in Water in the Gas Tank yet?
No - but I guess I better had.
TOD could be described as a "meat grinder" but does that mean we have to act like "meat heads"? We can surely have a discussion about very speculative areas without this continual degradation into veiled personal attacks on people we happen to disagree with?
Sure, there's a robust and confrontational atmosphere, but where does the bile get us? The current discussion about Saudi Arabia is a case in point. It's hard to know what's going on there. It's a difficult and complicated country, yet some people appear so sure of what's happening their, based on data which is highly problematic. The publically available data is only part of the story, the real numbers are a state secret. Twenty years ago my Saudi friends didn't trust their government's statistics, and nothing's change for the better since then.
Given the "difficult" nature of this whole subject, and the fact that there's a lot of gropping around in the dark going on, arrogance is not only irritating, it's also juvinile. I think arrogance is a kind of ignorance.
Two things: one is to avoid being provocative other than with ideas; two is to not take an occasional jab in the ribs too personally.
"Don't get upset. This is how it's supposed to work. This is TOD at its best."
It's called peer review.
Writerman, DaveBG and Cid, I'm not sure who your comments here are aimed at and I do appreciate what is being said. I certainly take this as part of the TOD rough and tumble. I took exception to what Leanan said for a number of reasons. This is what she said:
This in my opinion is devoid of objective technical analysis and laced with subjective opinion - we've come to expect this from certain posters.....
This is an interesting concept. From the first weeks I contributed to this site I have asked PG where the truth lies. The real question here is how many posters contributing here are genuinely qualified to read and understand SPE papers published by Saudi Aramaco and the interpretations placed upon those by TOD contributors?
This is a serious issue, because we are increasingly rulled by the technically ignorant masses, who rule the media. IMO, on ceratin issues, technically sound minority views must prevail.
I have no gripe with Leanan's off the cuff remark - and I don't want to start a serious debate on Web - based peer review right here. But I think there are some serious media based issues at large here.
I'll mail this to PG, HO, Stuart et al and see if they want to join in - I want to concentrate on the technical content.
FWIW, I am totally in favor of involving as much expertise as is willing to comment. The more expert the better. I am willing to champion guest posts at TOD from anyone willing to put a decent effort into the subject regardless of their conclusion. But I think what we need is detailed technical forensics on the data that is in the public domain. What I don't think we need more of is CERA style PR blasts with no supporting detail, or vague assurances based only on the quality of Nansen Saleri's resume or a general sense that life usually works out ok.
And while it's true that other fora might have had more qualified people, I'm not aware of any public debate on this topic to go look at. It's happening here because it hasn't already happened somewhere else.
Sorry, I honestly thought it had been hashed to death already in the other threads. It wasn't my intent to do a drive-by trashing, just to avoid beating a dead horse.
Leanan, this is about the worst Troll comment I've seen on the site for months.
I got a lot better things to do with my time that sit here to be insulted by the likes of you.
Have the site to yourself and wallow in doom!
Huh? How is it an insult?
Leanan, my sincere applogies for the comment above which is clearly below the belt and unwarranted.
Its probably best to leave discussion about the quality of comments and "peer review" to another day.
Euan
Pax.
Way over reacting. She was apologizing to you.
There is also an unfortunate implication that non experts, and possibly even women as well, should keep their mouths shut.
Huh??? How do you get from what she said to this reaction?
Ghawar Is Dying
The greatest shortcoming of the human race is our inability to understand the exponential function. - Dr. Albert Bartlett
Wow! I can't get there with what she said. Somebody deserves an appology.
Calm down Euan. I've had a "don't know what you're talking about" comment to something I've written on TOD Europe, without sulking about it. Leanan is hardly Mr. Hutter!
Euan,
One of the implicit questions that continually arises, between the snipping, is, who are the "peers"?
TOD is full to the brim with lots of interesting posts and the replies are fascinating, but real peer rieview? I on't think so. What we have is vertual peer review, in a vertual school. Not only that, we've also dealing with a pretty obscure subject based on a great deal of rather defuse data. There's room for massive ammount of disagreement and controversy, given these wide and unclear parameters, and boy do people jump in!
That's alright, it's informative and fun, as long as we remain reasonably respectful of each others views and also retain a little bit of humility, which is an attractive quality especially in those who regard themselves as being strikingly brilliant. It's a secret, but a touch of modesty actually makes the brilliant appear even more brilliant.
righterman, the internet peer review committee reminds you 'virtual' is spelled with an 'i'...;P)
Yeah, I know, but then I don't know. I have two languages in my head all the time and I mix them up continually. Here, at home we speak two languages, and we also mix them up into almost thired one. It gets slightly confusing, and bits seem to drop off now and then.
Gilles, Euan Means argument is totally meaningless. Since the mid 90's many Saudi wells have been completely shut down, or their flow has been cut because of "Rigless Water Shut Off", or existing wells have been "Sidetracked" with horizontal drilling. Production in north Ain Dar dropped by about 20% beginning in about 1998 because of these changes. This is clearly visible in Figure 1 of SPE 93439:
http://freeoil.1111mb.com/spe/spe93439.pdf
So while the average production in many wells were dropping the average production in wells in Haradh and Shaybah, because of the type of wells, are several times that of older wells. The wells in Haradh III are supposed to produce 10,000 barrels per day. Just a little common reasoning will tell you that if the new wells are producing much more per day, then older wells much be producing much less per day. And, if new wells are being added with no increase in production, (or with the current decrease in production), then production from older wells must be dropping or, are being closed down completely.
And just one more not so minor point; Euan’s chart ended in 2005, the very year Saudi peaked! I would bet a pretty penny that “production per well” is currently dropping precipitously.
Ron Patterson
The Norwegians used horizontal wells to try to get max. production as the oil-water contacts rose. It worked for awhile, but the declines eventually happened. The drops in production from North Sea water driven fields were steep. Yibal was going well for a long time, then it started to slip, they have proped it up with tertiary CO2 driven recovery, it might collapse again as it will gas out like Cantarell in Mexico.
I cannot see the $300 barrel oil in the immediate future. Shell concluded some agreements with local governments and is supposed to bring some spare capacity in Nigeria online this summer. Nigeria is in the process of auctioning more onshore and offshore exploration blocks with a stated purpose of increasing reserves to 40 billion barrels and production to 4 mbod by 2010.
The Caspian Sea oil will be coming online in increments over the next decade. The Iranian Caspian is a potential growth area, yet undeveloped.
Canada is expected to increase oil production over the next ten years. Venezuela talked about developing the Orinoco heavy oil region, but cut back production there when worldwide oil prices started to fall.
Eventually Iraq should calm and reject killing people as an alternative. They might almost double production to about 4 million barrels a day.
Yet as time goes on and giant oilfields continue to fall, as more nations pass their peaks or secondary peaks, then oil supplies might diminish. Many little fields that were being brought in to create new production might see most of their expected lifetime production to occur within ten years. There were yet multi-billion barrel fields being found, thus suburbia is not over yet.
Continued economic growth in China, India, US, Russia, and OPEC nations might take up slack oil production. OPEC price controls have manipulated prices higher than might be the case if Saudi Arabia did a crash program to develop 80 undeveloped fields. Two new fields have been discovered in KSA during the past 12 months. Kuwait and Iran also announced major oil field discoveries in the past year.
There were yet multi-billion barrel fields being found, thus suburbia is not over yet.
Continued economic growth in China, India, US, Russia, and OPEC...
If I am not mistaken (and this is the forum to correct me), it has been over 25 years since a super-giant oil field (not oil equilavent in NG) has been found outside Kazakhstan. Mere "giant" oil fields have been found, but the trend is down for finding these as well.
And supporting US (as opposed to Moscow) suburban oil demands without the exports to pay for the oil imports is a game that is winding down quickly.
Best Hopes for Reality Based Planning,
Alan
Rainsong,
Too little, too late and a lot of wishful thinking. Let me correct that, Outright Fantasy. World financial markets are about to get real screwed up real fast. The cork is out of the bottle and the Genie is coming out. Everyone won't understand, but enough will and the rest will find out soon enough to their own detriment. CYA is now the rule of the day. If we invade Iran in the next few hours, God help us all. I got out of the markets before they closed.
well, you point to a lot of "potential" sources of new oil but some or all of these could and probably will be delayed some may not materialize at all.
if nigeria is auctioning exploration blocks, isnt a 3 yr timeframe a little short for these to be brough into production ? it is possible, but is it likely ?
you refer to multi-billion barrel fields being found, can you give specific examples ?
and finally do you have some details on saudi's 80 undeveloped and 2 new recent discoveries ?
Fractional_Flow,
I've been out of the loop for a while but may join in this discussion today. Could you perhaps start by remininding everyone what evidence exists to support this statement:
EM
Euan, try SPE 93439:
http://freeoil.1111mb.com/spe/spe93439.pdf
I think the evidence is absolutely overwhelming.
Ron Patterson
Ron, the main reason I was out of the loop was x country skiing in Norway. I just happened to take a copy of SPE 93439 with me - I read it several times together with my friend who is a senior production geology advisor. As you know I am a geologist with just a little bit of reservoir engineering expertise.
So its strange - you see the evidence for the watering out of North Ghawar as overwhelming and I don't.
Maybe you can go first and list the key points from this paper to support your position, then I'll respond.
Looks like I'm in for a busy afternoon.
It's good that your technically strong and have studied the paper in detail... it won't take me long then.
The paper explicitly states in several ways that the displacement feature here is gravity dominated.
Construction of a synthetic fractional flow curve using the Honapour correlation for a 600 md intermediate wettability carbonate with a 15% connate water saturation and 21% residual oil saturation results in the construction of a fractional flow curve which exhibits a 65% average water saturation behind the flood front at breakthrough. The endpoint Saturations exactly match the reserve figures in Saleri's May 2005 reserve pie chart. The 65% average water saturation behind the flood front matches quite well with the water saturation cross sections. The water cut at breakthrough via tangent construction is 93%, but the curve is steep here and the value could be as low as 85% -I think.
Now since this is a gravity dominated displacement we seek the vertical rise in water throughout the structure. Aramco gave us the 4.6 ft/day front velocity which I'm sure you noticed, and at an average 3 degree dip (stewart graciously analyzed the Greg Croft structure map for a 4.4 and 2.3 yesterday), the vertical rise in the water level is 0.24 ft/day on average, or about 2.88 inches per day.
Now, it has been about 3 years, 3 months and 5 days since 1/1/04 so that is about 1190 days. The horizontal movement of that front is 1190*4.6 = 5474'. So the total vertical rise up that structure is 5474 * sin 3= 286.5'.
Now, it depends very much on where we started. Here is where looking at those cross sections gets tricky. I posted over 2 weeks ago that some advanced image analysis was needed. Bunyonhead is to be commended for going through the process with me yesterday.
Now, I think there would be gravity equilibrium between Ain Dar and Shedgum, Stewart questions this. Please note that injection wells are widely spaced and the rise in water level is less than 3" per day. There is not much convection here. In my mind gravity dominates... and I believe the 4.6' day frontal velocity from the stream tube simulation must include the effects of the connected reservoir and injection activities at South Ain Dar and Shedgum. Reasonable men of good conscience can differ, I understand.
However, in the end, we must understand that breakthrough or not breakthough is the ballgame. As you know, the large mobile oil saturation and the tangent construction horizontally on such a large Sw span with the low oil viscosity must result in a high water cut at breakthrough. This is supported by the production logs.
I was alarmed with the height of the water rise from the frontal velocity over 1200 days. I think you should be too.
Cordially
FF
FF - lets take this in bite sized pieces to make sure we reach mutual understanding on some key points:
And so please correct me if I'm wrong. Original oil stauration is 85%. Final residual oil saturation is 35%. Suggesting that about 59% of the oil is recovered? That does seem pretty high to me - but there again this is a world class reservoir.
I'm not sure what you mean by this? Do you mean they had the same original OWC? I have read that the contacts on Ghawar are staggered, almost certainly suggesting a degree of reservoir compartmentalisation ± a dynamic aquifer.
I'm not sure what you mean by this either. I thought that first water breakthrough in Ain Dar occurred around 1976 and that water cut has been rising in stages ever since.
What I see as the key issue is whether or not Ain Dar (north or otherwise) still has a dry oil column that can be produced to compensate for wet oil being produced from old vertical wells.
Finally, I think it is very important to be aware of a couple of key geographic / structural features in SPE 93439:
1. The paper describes North 'Ain Dar which is the most mature part of Ghawar. North 'Ain Dar represents about 50% of the whole of 'Ain Dar.
2. The water saturation simulations (Figure 9 in SPE 93439) are from the flanks of the structure and tell us nothing / very little about oil saturation at the crest.
I think these are details that should not be overlooked.
I hope the skiing was good.
Goodbye.
FF
For the benefit of the non-experts among us, could you possibly explain why Euan's take on the paper in question is beside the point?
I for one, am lost, but it is not clear to me whether and why Euan is.
I'm just trying to learn what's going on here. And I have to say that I find the recent discussions on SA to be very valuable - an impressive tour-de-force of a free-for-all approach to things leading to helpful and well-argued results.
The skiing was great - 6 days of blue sky, no cloud, no wind and 3 m of snow on the ground.
If I have time I'll call back with some maps to set this in context, some comments on fractional flow and production in 'Ain Dar and Shedgum and water saturation profiles in Shedgum.
I was hoping you would continue to comment because as I said my understanding of reservoir engineering is a bit limited.
Hi Euan,
If you go back over the posts of the last 2 weeks, specifically Stuart's posts and a few of the drumbeats (search on F_F), you will find it all laid out in detail.
Now we are getting somewhere- the link between North Ain Dar, (and just what that is), South Ain Dar (and just what that is) and Shedgum needs to be worked hard. If you wonder why I wonder exactly what those boundaries are look at Figures 3 and 4 of the paper closely in comparison to the gregcroft.com. What and where is that hole??
But I will be hardpressed to believe you can buildup a 300' wall of water on the North Ain Dar structure independently.
And I am glad the skiing was good.
Well here's my interpretation of where the hole (more conventionally called a saddle) actually is, the basis for saying that N 'Ain Dar represents about 50% of all 'Ain Dar. This is based on matching the map outlines, the fact that it is called North 'Ain Dar and the fact that IPTC 10395 shows a small saddle in the exact location at the SE end of N 'Ain Dar.
The large saddle feature at the join between 'Ain Dar, Shedgum and Uthmaniya is way to the south.
The original map was nicked from Stuart's gas in the water tank post.
So we are talking about water saturations on the flanks of the most mature part of the most northerly extension of Ghawar - right?
Thanks very much for that I agree.
And yes we are talking about North Ain Dar... but we are not just talking about the flank. Are we not to assume that the area encompasses the entire -5750 closure... if not then it is hard to see a dry oil area if not (which existed on 1/1/04).
Then we are talking about the Northern Anticline which shares a crestal -5750' contour with the Southern Anticline and Shedgum.
Then the discussion should rapidly move to whether the Northern Anticline can fill without equilibrating to the other anticlines. And whether this is a wise reservoir management practice that Aramco would endorse.
And you are to be commended for leading this discussion here.
The cross sections (9a and 9b) clearly include the crest right? We can debate how far North or South they are, but you aren't trying to say that the cross-sections don't go all the way to the crest are you?
No Stuart, I'm not trying to say that because I don't know where the sections are located (but I gave you a guess on the map down the thread).
However, Saudi Aramco say this:
"Fig 9 shows simulation results on water evolution at the eastern and western flanks" (page 2 SPE 93439).
So its Aramco that says the sections are on the flanks - what ever gave you the idea that they go all the way to the crest?
I'll say this, however, if these sections did depict water saturation at the crest then N 'Ain Dar would be history. The oil production from horizontal wells not yet drilled would go out like a light.
But this of course raises the question why they are planning to drill some bilateral wells if all the oil has gone? But there again - they say these sections are on the flanks.
Here again is the west side (a) one:
Note that the two simulation cells on the right of the image both slope down (very slightly) to the east, whereas the rest of the cells slope down to the west. So the highest point in this piece of reservoir is two simulation cells over from the east side. I claim that must be the crest of the reservoir (in an East West sense). For it not to be, there would have to be a horizontal shelf on the west side of the structure. There is no sign of that in the contour map. Furthermore, it would make the overall scale not work. We know that the original oil layer thickness was about 200' (from Greg Croft). If we measure off the 1940 picture, I make the overall vertical scale as follows:
Here, I've shown my interpretation of the original 200' oil layer in the 1940 9a cross on the left, and based on that, the green boxes represent 250' intervals. So the whole structure is ballpark 850' high (probably plus or minus 100' given uncertainty as to exactly where the OOWC is in the picture). On the right is the Greg Croft map, and that shows the whole structure running 750-1000' high - around the same height as the cross section is. So I just don't think there is room for any interpretation other than that the cross section goes all the way to the top of the ridge.
The situation is even clearer with the eastern cross section, where it quite obviously folds over the top of the ridge:
I'll address the North/South issue below where you showed your hypothesized placements for the cross sections.
On this good Friday all I can say is "Praise the Lord"
From Mar 22 Drumbeat
http://www.theoildrum.com/node/2395#comment-171688
The ability to position that was way beyond my ability... it might be beyond anyone's.
It is in very much more capable hands now.
To any I have offended over the course of this discussion, I sincerely apologize.
Hope you all learned something, I know I did.
FF
Stuart:
I don't wish to detract from a very interesting dialog but could we for a minute think about turkey in reference to cross sectional images and the suppositions being made in reference to a "crest?"
Slice a turkey breast along the flank of the breast and you end up with a cross section which appears to capture the crest. But this is only the crest of that lateral slice, it is not a true transverse cross section of the bird. The true cross section of the bird would be presented by a cut through the bird perpendicular to the backbone.
I am acting as devil's advocate here, but if these images are in fact a lateral cross-section (which is what I understand Aramco to be claiming) then it makes the intent to drill further wells on this structure somewhat more understandable.
Cheers!
"I'll say this, however, if these sections did depict water saturation at the crest then N 'Ain Dar would be history."
I'm glad we now agree on that point, and it's just a matter of debating placement/timing.
"But this of course raises the question why they are planning to drill some bilateral wells if all the oil has gone?"
Well, my contention it's unlikely the demise of the oil layer is perfectly uniform, and so there's places where it makes sense to go in with a few extra wells to clean up the remaining patches of oil layer. That's what IPTC-10395 is about in my view. It's also why the anticipated life of the wells studied in IPTC-10395 is so short (see the pictures in Water in the Gas Tank).
it seems to me that we also have to keep in mind that we are dealing with a computer model that is history matched, in the final analysis, to production data (and possibly to some well log and/or 4d seimic data). if that is so, as i have pointed out previously, the history match is "probably not" a unique solution. the supposed "wall of oil" could be nothing more than the model's resolution* of production data and oil in place estimates.
* it would seem that saudi aramco would have "top notched" reservoir modelling experts. i would like to point out that i have seen some "top notched" reservoir modelling experts present some really bogus forecasts.
Great!
Surely you jest! If there were no watering would there be a need to shut down some wells as they did? If there were no watering would there be any need to plug some wells above the water line as they did? If there were no watering would there be any need vertical short radius horizontal drilling that limited the input to the well to the top ten feet of the reservoir?
The whole point of the SPE paper was to report on how they were attempting to control water intrusion into the field. If there were no watering out then there would be no need to do anything.
And the text clearly says that of these “Rigless Water Shutoff” operations, 77% of the time, by shutting off the wells above the high water line, they were successful in getting the water cut below 50%. In 19% of the cases they were successful in getting the water cut below 75%. And in 4% of the cases the water cut remained above 75%.
We saw in Figure 1 that production was decreased when these measures were initiated.
Euan, they are milking the oil from the top ten feet of the reservoir because below that point the reservoir is completely watered out. My God man, what further evidence do you need?
And Saudi admitted on 1/1/2004, 3.3 years ago, that Ain Dar and Shedgum were 60% depleted. Page 21:
http://www.saudiaramco.com/sa/webServer/general/Presentation_Fifty_Year_...
Knowing Saudi’s predilection for exaggeration, I would bet that on January 1st, 2004, Ain Dar and Shedgum were more than 60% depleted. But at any rate, even taking them at their word, that would put the area between 65% and 70% depleted today.
Let me repeat, what more evidence do you need?
Ron Patterson
Ron, SPE 93439 is for North 'Ain Dar and the water saturation sections (Fig. 9)are from the flank and not the crest of this small but important part of the North Ghawar area. The 10 ft oil column of which you speak is on the flank and tells us nothing of the size of potential dry oil columns up dip in crestal positions.
So how do you manage to extrapolate statements from the flank of North 'Ain Dar to include the whole of North Ghawar - which includes all 'Ain Dar and Shedgum?
Sounds to me we are in real good shape for a few years at least - even if they are 75% depleted - still 25% to go in this most mature part of the Greater Ghawar structure.
If I'm not mistaken, reading the charts in SPE 93439, Ghawar produces either water or dry oil (mixtures of the the two in vertical wells) and this gravity driven system performs like a piston. So if there is 25% left, this can probably be produced at high rates as dry oil from horizonatl wells.
Euan, this statement by you says it all. You think that if they are (northern Ghawar) is 75% depleted they are still in real good shape because after all they still have 25% left. Euan, though we are certainly concerned by how much oil is left in the reservoir, that is not our immediate concern. Our immediate concern is the decline rate. And in the past northern Ghawar has been the most productive area of all Saudi’s fields. The area has produced the bulk of Ghawar’s 5 million barrels per day for about 50 years.
Saudi says their existing fields are declining by from 5 to 12 percent per year. And if any field is 75% depleted then you can be assured that it is one of those near the 12% mark. If North Ghawar is declining by anywhere close to 12% then Saudi Arabia should in an absolute panic. And from all indications they most certainly are.
Ron Patterson
Euan - you need to indicate exactly where you think those cross-sections might be on a map or picture of Ghawar such that there is somewhere left for a significant amount of dry oil in reasonable rock to be hiding.
I would not normally be so speculative, but since you asked, here would be my very, very rough guess for the laocations of sections (a) and (b) from SPE 93439, Figure 9.
(a) is roughly in the same location as your prognosis. (b) is radically different.
Where I have drawn (b) is on the flank of the structure, rolling over the N-S orientated anticline in an area of exceptional reservoir quality. This seems to tie in with the shape of section (b) and the fact it is extensively water flooded. You drew section (b) in a crestal position with poor reservoir quality which does not to my mind match the data or the fact that the paper says the sections are from the flanks.
The yellow area indicates the crest of S 'Ain Dar which based on the data we have could still contain much dry oil. The reservoir quality here is less good - so if I were the Saudis I'd feel inclined to develop this using horizontal wells - someone should write and suggest this to them.
The map is from Greg Croft:
http://www.gregcroft.com/ghawar.ivnu
Would not the toes of the pay zone be getting wet in 1940 on a. -6250 -204 = -6444'
Thanks
FF
I'm afarid you're about 10 years out - the toes of the pay zone will have started to get wet around 1950 - so what?
I'm really intrigued to know what mental image you have of the Ghawar reservoir in 2D - any chance you can run up a sketch? I got lots of other stuff I want to post this evening which I hope you will comment upon - but if I find the time I'll run up a sketch of how I see the reservoir.
WRT a comment you made higher up the thread. Would it not be the case that once the saddle between the crests of N and S 'Ain Dar waters out that the crests behave as two independent GIANT FIELDS?
My guess would be that the saddle is already water, and sure we are talking about the beginning of the end game of northern, northern Ghawar. The difference here between the different positions being discussed is that I see this as the beginning of the end, while others see it as end in 2005.
The relationship of the structural crest/ pay thickness to the position of the water oil contact in 1940 is the only semi-reliable (although speculative as hell- I wish we had better data believe me) method I can see to position these cross sections.
Now we should be arguing about the ss of the original oil water contact on that west side. It is not readily apparent to me.
With regard to your post about being the beginning of the end or ending in 2005.. you redacted my original post to read "The Northern End of Ghawar is watered out" when basically it gave the choice of two options the Northern End being watered out or the watering out of the Northern End still looms ahead- I'm not certain which is worse.
In an effort to understand the too and fro here, I've been doing a little searching. I came across this paper "Ghawar: The Anatomy of the World's Largest Oil Field", which I'm sure is old hat to you guys, but makes things a bit clearer for us morals. PDF of the presentation is here.
In that presentation was a slide of a 3D view of the field, I grabbed the image of the northern part of the field, below.
The view is from the north east, looking south west.
At a rough guess I's suggest that shape of the eastern flank features could place the cross section at a number of points along the north-south line towards the northern 'peak'. See what you think.
You rock!!!! It is blindingly obvious where 9b) has to go on this from it's shape. Hold on....
Ok - here we go. There is only possible place for the 9b cross section on this picture. And it is within a mile or two of the very top of the crest:
Click to enlarge if need be.
There is nowhere left for oil to hide in North 'Ain Dar.
I consider that this removes all conceivable doubt on the location of the 9b) cross section. Anyone disagree?
I have to say that it is far from "blindingly obvious" that this removes "all conceivable doubt"! It is one possible location, but the general features you highlight of "sharp crest", "steep", "shallower" and "steep again" would apply to many points along that ridge as we sweep north and south from your chosen location. Keep in mind that the vertical and horizontal scales are probably not the same in the two diagrams. A cross section quite a ways north of the ridge peak would also go steep-shallow-steep along the east flank, and if the relief looks "gentler" than the cross section diagram, that could be accounted for by varying the vertical scale.
Again, I'm not saying your location is wrong, just that the degree of certainty you have expressed is far from appropriate given the quality of the data.
Take a look at my positioning of the cross-section, further down the thread.
The cross section location can be moved, but getting ALL the features to match limits the possible locations to points close to the peak of that field. I've put Euan's suggestion on my image and pointed out why I don't think it fits.
I spent quite a while this morning trying out locations, scaling factors, etc. There aren't as many possible places as you might think.
Go ahead and propose an alternative hypothesis Halfin.
Holy Heisenberg.
And for those who say the Saudis wouldn't release this info if it revealed this much...I disagree. A lot of intelligence work is not the cloak and dagger stuff you see on TV, but just putting together publically available information - research papers, newspaper stories, etc. - in ways not imagined by those approving the releases bit by bit.
Hello Leanan,
Good Morning! Please see the discussion between Garyp and I far downthread! Will you post a visual [possibly topthread?] of my recently discoverd Ghawar 3D oil saturation chart--I don't know how. Thxs!
Bob Shaw in Phx,Az Are Humans Smarter than Yeast?
Here you go:
It's from here.
Holy crap Look at Uthmaniyah
Thanks for this
FF,
Take a look at the modeled change in Sw for Uthmaniyah 2003-2004 that I reference below. To me it looks like a lot of oil in the big white patch downslope of the peak, but I'd be interested in your view of this and the rest of the PDF.
Gary-
Send stuart an e-mail.
He knows how to reach me.
There is a lot here to talk about but I'm weary of the public domain.
FF
I can understand you guys talking in private about all this, but please, please come back with some statement afterwards...
If nothing else say whether we're "dead men walking already" or "I'd get my affairs in order within the next 18 months"
Or something...
Thank you all for your hard work and everything you have done for the public on this one.
The talent and knowledge here is incredible.
Thanks
JOhn
Hello F_F,
Full credit to you, SS, and the other TopTODers-- you guys set me off on big google Easter Egg Hunt! Hopefully you and the other TODers can make good use of this if it was indeed an accurate chart circa 2004. Can you and SS somehow match this up with the other slices and data? Have at it--give it your best shot.
Bob Shaw in Phx,Az Are Humans Smarter than Yeast?
Note the text references "over 4,000 wells" in the simulation.
I wonder how many are injectors and producers to make the 5.6 MMBOPD claimed for the field in yesterday's WSJ wood mckenzie table??
According to ths rather excellent post here:
http://europe.theoildrum.com/node/2372#more
Saudi Arabia had around 1900 producing wells in total in 2005. So the 4000 wells on Ghawar will include the historic data set used to tie seisimic to stratigraphy and to record water saturations.
Aramco drill a fairly large number of observation wells (used to observe pressure, temperature and saturations).
So the 4000 will probably include watered out wells, injector wells, producing wells, old exploration and appraisal wells and of course suspended wells waiting to come back on when global oil demand once again picks up.
Help! How about a clickable enlargement? I can't see the right half of the picture and don't know what I am looking at directionally.
use firefox, and drag & drop the picture in a new tab.
Great find!!! We don't know the exact date, or exactly the color scale (though I can guess :-) but what I think it does do is let us make a fairly plausible extrapolation from the North 'Ain Dar data to the whole of North Ghawar, and I would say it tends to support the following points:
Those are my quick reactions (I have to shoot off and do some paying work) - we can tear it to bits further in coming days... In particular, we can start trying to correlate the Uthmaniyah cross-sections with this picture.
The picture very much begs the question of what rate they can (or will) produce the oil from Haradh and Hawiyah.
I'm interested to hear Euan weigh in on the last 12 hours of developments...
You would not believe how many people are waiting for Euan to weigh in on this. If you, FF and Euan come to an agreement...I think you can propose an "official" announcement from TOD about the state of affairs in KSA.
Stuart Staniford wrote:
See, the guy needs funding.
Matt Simmons and Boone Pickens and other peak oil money-bags take note.
http://www.theoildrum.com/node/2420#comment-174937
Bob Shaw - a fantastic, find. I'll make a few comments here and suggest that Stuart re-posts this on a fresh thread tomorrow as this one has gotten pretty unwieldy.
What can I say - look at all that oil in N 'Ain Dar!
One think that intrigues me is what different folks see when they look at this. Yesterday I suggested F_F should post a sketch showing his view of Ghwar in x section and now I'd like to ask Stuart to do the same. I will prepare a sketch to show tomorrow. What I wonder is if a significant amount of missunderstanding stems from a poor mental image of the reservoir. There is I believe vast vertical exaggeration in this depiction - and so in the real world you need to visualise this without that exaggeration. The Arab D reservoir is about 200 ft thick and that northern part of Ghawar is about 79,000 ft across. The structure amplitude is about 1300 ft - maybe some drafting whizz kids to run up a true vertical scale x section using Greg Crofts contour map:
http://www.gregcroft.com/ghawar.ivnu
1. What does the blue show? In SPE 93439 a "dry area" means an area with a full (200ft) oil column - no water ingress at the sole. If that is what the blue is showing here then N Ghawar actually looks in relatively good shape. Imagine that 200ft thick slab of limestone full of oil covering all that area.
2. Yesterday I said that I imagined the saddle between N 'Ain Dar and S 'Ain Dar was probably water - this in fact shows there is still oil in the saddle (probably gone by now).
3. We seem to have extensive oil in the crests of N and S 'Ain Dar and Shedgum. Abquiaq is near history - but Aramaco seem to have done a great job ensuring efficient sweep.
4. The real shocker here is N Uthmaniya - but this needs to be kept in perspective. That tongue of oil is still 2 to 4 miles across, 20 miles long and 200 ft thick. It is interesting to note the less efficient sweep in this area that may be attributed to the poorer reservoir quality.
Are wolves smarter than humans:)
EM
Hello Euan,
Thxs for your analysis--I think you and fellow TopToder SS do a great job of taking turns holding each other's feet to the debating fire. Both of you need to stay calm and composed, but keep the facts and analysis coming for the normal TODers trying to keep up [like me!].
Bob Shaw in Phx,Az Are Humans Smarter than Yeast?
For what it's worth, I am an image analyst and my quick assessment puts the east flank profile here:
Without knowing a good deal more about the various scalings in these data sets, we are way out in SWAG land. Probably just WAG actually.
That area ends up being too far south in my estimation since the cross-section can't trail away correctly. Also peak width to 'saddle' width need to be comparible.
I agree with you that there are areas up and down that ridge that could be made to fit the profile data. Here are 3 versions of the profile laid over the basin model that look plausible, just depends on how you scale the axis'.
The view angle on the 3d model can also make you see things that aren't really there.
I guess my main point would be that we do not know enough about the resolution or binning of the profile data or the basin model to really match them up.
And what is that light blue horizon line running through the elevation model? Water level? If so when and what is the depth?
Too many ?s. Too many assumptions to make.
My assumption was the blue level was the original water level - see my posting for matching. Also the 'general' shape had to fit, not the specifics of particular bumps (which you are right, you can't really be sure if they are gridding or geology). Take that as a constraint and you see that options decrease.
As far as gridding is concerned, check Abqaiq.
To me, these don't pass the sniff test. The orange one has no way to get all the way down to the water without the grade shallowing out again - the actual cross has the grade steep as it goes into the water.
And both of them, but especially the blue one, suffer from a vertical scale issue. Again, my interpretation of the vertical scale (based on the Greg Croft numbers) is:
That blue one would make the pay and the reservoir really thin.
Actually I think the orange line would reach the presumed water line without flattening out, my graphic doesn't follow the ridge exactly. But that's not really the point. We're reading tea leaves here.
The vertical scale on elevation models is routinely exaggerated for display purposes and not always linearly.
We're also assuming that the profile is perpendicular to the ridge crest but there is no reason it has to be.
Perhaps I've missed this in the discussion,but on the 200' of oil, are you assuming that thickness along the entire ridge peak? Seems unlikely, but not my area.
"my graphic doesn't follow the ridge exactly. But that's not really the point."
No, that's exactly the point. If it doesn't fit all the parameters that's not it, Stuart's fits all the parameters. No one is reading tea leaves here. Everyone is being extremely careful.
There's a quite obvious large lump sticking out below your orange line that it would have to go over to get to the water (clearly visible by the shadow on top of it). That doesn't match anything on the profile.
"But that's not really the point. We're reading tea leaves here."
I agree that you are acting in that way, but I'm attempting to be as careful and precise as possible. You may feel free to make up random facts with no support (like assuming a non-linear scaling), but I'm attempting to find the best possible match given the facts we know.
There could easily be a valley behind that ridge, you only have one view angle here and it's a jpg of a 3d model created for a powerpoint presentation. Not a reliable data source. View angle, scaling and resolution have a huge effect with these models. It is very easy to be mislead by data like this and it happens far too often.
Given the undocumented data sources I think you may be working very hard for high precision but likely achieving low accuracy.
I haven't made up any facts, I'm merely pointing out that you know very few facts about this data set and are unlikely to come to a reliable conclusion.
You are the one assuming to much, I'm only mentioning some of the possible ways the data has been transformed.
Rugbman - thanks very much for this which at least shows differnt options. A few comments.
1. Stuart and others are right in saying that the tail end of the profile needs to dip below the pale blue plain depicting the original OWC.
2. Stuart I believe is wrong in placing this at the crest (your red line) because the paper says explicitily the profiles are on the flanks - I'm therefore drawn to your orange and blue lines (which are on the flanks) and which lie in the vicinity of my own prognosis (which I spent 2 minutes preparing).
3. How are you dealing with scaling? Both vertical and lateral scales.
4. A general comment - if the profile goes all the way from OWC to crest then it is about 4 miles long and 200 ft thick. There are about 17 grid cells (vertical and lateral) in the model so this would require cell dimmensions of around 12 ft thick and 1240 ft long. Cells in these models are always elongate but this seems extreme to me. So it would be interesting to play around for a match that allowed the profile to be much shorter.
Fabulous work!
What do you believe is the vertical extent of the 9a) and 9b) cross sections (top of simulated reservoir to toe of the watery region), and why?
(I agree completely that the vertical scale on all these models is exaggerated - we've got about O(1000') of height and O(10miles) width in 'Ain Dar). However, I don't see why it bears on the discussion at hand. The shape is the shape regardless of the scaling factors.
To be honest I haven't a clue and that's why I believe this debate of these cross sections could lead nowhere. Are they a half mile long? a mile long? or as you seem to favour cover the full structure from contact to crest - about 4 miles long?
You make them different lenghths then you can fit them in lots of different slots - as Rugbman I believe shows. So of course scale matters.
Hunt and Peck. Since it's all speculation, didn't see need for a systematic approach.
Do we know if this is profiling the entire 200'X4 mile structure or just a subset? 12'x1240' does seem like an odd bin size.
Photobucket will not allow registration without giving them a valid cell phone #.
I will NOT do this !
You should not use such hostile sites.
Alan
Didn't ask me for a valid cell #. shrug.
Site was suggest by TOD FAQ. I don't generally use such things.
And for what its worth, here's my guessimate of the location of the eastern flank cross section - with the image overlaid on the 3D view. A cross section somewhere close to the peak, probably somewhere very slightly to the north of the very peak (not south, sorry Stuart). This is the best match to the 'peakiness' of the peak, relative to the width of the 'saddle' area. Its difficult to be exactly precise given the bumpiness of the real data, but I've tried to match all features, including what I take to be the original water level.
Edit: For fairness I've a added my best guess at Euan's position as well. The problems as far as I see are the 'peakiness' is wrong in order to get the saddle right, and the water level is now off as well. Make up your own minds !
I disagree - I think the shape match is better a shade south of the peak. However, it doesn't matter to the conclusion.
Its the shape and steepness of the side as it comes off the peak that makes me shift it north. I've pawed over it in Photoshop at high magnification looking for the fit and the wall seems too steep at the peak to the south.
However, as you say it doesn't really make much difference north or south - either way it seems to have to be very close to the peak point.
For those reading up afterwards, Stuart and I came to our conclusions as to position independently, posting the original guesses within a minute or so.
I just don't think there's enough of a shelf where you've got it. However, I guess if these are the only two candidates, I'm not going to get into a massive statistical image processing exercise, since the difference between them doesn't change the conclusion. Here again is where I think it is - with and without:
With that, I'm going to bed!
Bed? I've just got up!
There is one further thing that comes to mind when I look at the overlay I made of the cross section and the geological data. That thin red band of dry oil in the simulation looks a lot like the same thinkness as the 'lumpiness' of the geology.
As you push the oil up and across with your water front, when you get to that thin shell, surely it begins to break up via the shape of your capping stone. Its difficult to tell if the artifacts are real geology or data sampling, but by comparing to Abqaiq I'd say real. Doesn't that mean you get more pockets of dry oil left behind unless you stick a well point into each and every local peak in the structure?
Something I hadn't thought about before.
Click to enlarge.
Agree with Nate.
Thanks Euan, F_F and Stuart for having the debate in public. I view all these posters as equally competent but having different experience and hypotheses. If they all believed the same thing there would be nothing to discuss.
Maybe it's not obvious to everyone but the debate (and data to support the debate) is what is important. No one is stating as fact that this how it is in SA. They are comparing notes with each other. My perception is they all learn new tidbits and concepts as they go and refine their arguments and hypotheses.
No one knows what the real state of affairs is but being privy to the discussion is educational for me. The overall impact is great concern but not dogmatism.
This is better than American Idol and Perry Mason combined!
No kidding! Thanks, both Euan and FF.
So I argue a better placement is like this:
This is about the required 250' or so below the very summit of the ridge, hits the crest in a fairly broad place (which matches the rather flat crest top that the simulation cross-section shows) and also, is about right for where I placed it on the permutation picture. Notice in the 9a cross that there is a notch downards four simulation cells over from the eastern side. I believe this matches the slight shadow that crosses my a) line 1/2 way along it in this picture:
So all of this works out fairly consistently. And as far as I can see, that area is of roughly average permeability (I agree with you it's implausible that these cross sections would be in regions of sub 100 millidarcy permeability, but think they could well be in averageish 500-1000 millidarcy territory).
Let me post this comment, and then turn to the 9b) eastern cross in a separate comment.
Ok. Let's do the same analysis for the 9b (eastern) cross section. Here is my analysis of the vertical scale, together with the original OOWC and Greg Croft contour map.
My analysis of vertical scale is this cross-section is taller - around 1100'. That means it pretty much has to go close to the summit of the ridge. Where you have it at the Northern end of the -6000 contour, there's only 750 feet of structure, which this cross section cannot be made to fit in. If I put it close to the summit, I have enough vertical space for it. Furthermore, the fairly distinctive shape of the reservoir here matches up on both the contour map and my reading of the shadows in the permeability visualization:
Your location does not look like the right shape to my eye.
My one problem is the OOWC looks somewhat high. However, there are two readings close together on the 1959 map that are very different, so maybe the original height of the OOWC is a bit variable in this area (the permeability is also changing fast around the bottom of the cross section too).
Overall, the permeability where I place the cross section looks to be around 400-800 millidarcies. I don't see that as low enough relative to the reservoir average to justify your concerns about the sweep efficiency at this location.
Finally, here's a summary of the state of the reservoir at the beginning of 2004:
Again, the green boxes are 250' in height (estimated).
Overall, I don't think there can be more than small patches of oil layer left behind. It's worth noticing that in the cross sections, the oil layer is of fairly uniform thickness but is not level. The OWC varies in height by two or three hundred feet and is hugging the top of the reservoir. So even if you think I'm wrong on the b) placement and think that cross section is a few hundred feet lower on the structure, still the most natural model of the three dimensional structure is it's like the two dimensional structure - a thin layer of oil hugging the top of the reservoir.
I have shown SPE #93439 to petroleum (reservoir) engineers from British Petroleum. I have talked to them. These people indicate that the SPE paper merely describes a mature reservoir. There is no evidence whatsoever in the paper to indicate that North 'Ain Dar has "watered out". To be more accurate, there is no way to "confirm or deny" anything regarding the field.
These discussions have also indicated that the Saudis would not disclose anything in SPE that might indicate trouble in any case. This is a thought I'd had myself. It is implausible, given Saudi Arabia's secretive policies. Therefore, it follows that there is little of substance in the paper, which was the conclusion of the BP reviewers.
The Oil Drum may be a "meat grinder", as Leanan said above, but it's not the kind she had in mind, I think.
I am tempted to just stay out of these discussions and let people give themselves enough rope to hang themselves with. There is such a thing as journalistic standards & practices, and that applies to those studying "peak oil" more than anyone else, because it is us who hold the controversial position. I also believe that a lot of naive people reading TOD get many wrong impressions. That's a shame.
My cynical view, moreover, is that people will believe whatever they need to believe, and will not let anything interfere with that agenda, disregarding evidence that contradicts their position or misinterpreting evidence that does not support their position.
More and more, this Saudi Arabia obsession takes a bizarre turn down a familiar road in human affairs. Apparently, fewer and fewer on this weblog give a damn about its reputation.
But, I guess I still care because here I am, writing this.
That reminded me of the "dry air" popcorn popper I had in college- man that thing sucked
You make many comments (like this one) that reinforce Dave's point. I am usually just a lurker, but I have to say, Dave voiced my thoughts extremely well.
Oh, Please. We have been presented with all the data Stuart, FF(and Bunyonhead yesterday) have been using. They have presented step by step analysis throughout. They have put there argument up for peer review on The Oil Drum. We have yet to see(other than cursorily by Euan) any arguments actually addressing the data and conjecture. Yet, the connucopian trolls start ringing in with "I know nothing but I think everyone is equal" and "I'm not going to comment on any of the data and cannot reveal my sources who tell me you are full of shit". Give me a break. Dave, go get your gun.
http://www.theoildrum.com/node/2330#comment-166160
Dave, if you have any dirt than spill it. If not shut the f* up.
Sorry to be blunt, but some of us have a lot riding on this.
Myself, I live in Japan. In response to peak oil I am in the process of relocating my wife and me to the US where my father is preparing a farm for PO.
Therefore I take this personally. You've twice now called Stuarts and FF's contrubutions BS without the slightest proof.
If North 'Ain Dar hasn't watered out then tell me why. Don't insinuate. For a lot of us its not academic. It sure as hell aint for me.
Maybe I've had too much beer tonight to post. You sure have posted good material in the past. But Dave, if you have the goods then spill them. I'd sure as hell love to see your evidence go toe to toe with FF's.
good night.
You think?
So you resent any information - even tentative information - that even suggests in the tiniest way that this drastic relocation could just conceivably, possibly, be an overreaction? If so, a site such as this, which specializes in analysis, really might not be the best place to be...
You have that completly 180 degrees backwards.
What I resent is the lack of information, unsubstantiated insinuations.
I would absolutely love any information that even in the tiniest way suggests my relocation is an overreaction.
You see I can't just casually move back home if the economy gets bad. I have to get a visa for my wife. This takes a huge investment in time and money. I'm talking several thousand dollars and a full year from start to finish. That's just for the visa, I'm not talking relocation costs.
I've been contemplating this action for a while now. I don't feel my employment position is secure here in Japan and I would have a much better chance of riding out any economic downturns in the States.
Based on what I've seen recently (Stuart's, Euan's, Fractional Flow's, Simmons, etc etc) evidence I've decided to begin that visa process. Once you start it you really can't stop it (or so says the immigration lawyer I consulted).
So yeah, if Dave has some good info from some BP engineers than I would really like to see it. This argument may be academic for most of the people on this board but it sure as hell aint for me.
Edit:
I have found Dave's work to be of the highest caliber in the past. That is why I am especially frustrated with his recent lack of transparancy (even if he stated he is working on getting the information out there.)
Let me also appologize to Dave. Dave I am sorry for my outburst. I didn't not mean to tell you to F off.
this is pretty much true for everything about Saudi Arabia! it's a black box and any discussion about Saudi Arabia will always be highly speculative based on sketchy evidence and crappy data. But webblogging is about being speculative, isnt'it!
If KSA were a black box, which is not quite true, then another approach to guessing at what the insiders there are seeing would be to analyze their geo-political actions. Why is that interesting? Because it just happens that KSA has only very recently begun a 180 degree shift from passive diplomatic observer to active participant. Why now? One reason could be that they see Ghawar starting to decline, they understand the implications of that better than anyone, and they see a need for a new political direction (toward a peaceful neighborhood) as a result.
Perhaps their thinking goes something like this:
1. Our asset base has always been valuable, but at scarcity-pricing for oil ($100?, $250?, $500 - you pick a number) it will be seen as vital to first-world prosperity.
2. Suddenly the number of potential take-over threats expands from just Osama/Al-Queda to who knows? - maybe even the US itself. Maybe a consortium of powers. In other words, if oil scarcity is recognized globally, a small weak country that controls the biggest supply of it is looking increasingly vulnerable - over time.
3. There are small fires breaking out in our neighborhood: Iraq, Lebanon. They threaten to spread. The more fire there is in the neighborhood, the more likely it is that some big power(s) will eventually use that as an excuse to bring in the First World Fire Department. They might use KSA as a landing strip and deployment point (otherwise known as an occupation). We don't want that, so let's start to turn down the heat in the neighborhood, put out these fires ourselves.
My point: one KSA action that's well documented is a huge buildup in recent years of new drill rigs. But a second one, just in the past few months (as KSA production has fallen dramatically): a 180 degree turn in KSA diplomacy. These two observable changes may not be unrelated.
if you look at stuart's 2nd graph (oil production vs quota) and focus on 2004, one might conclude that the saudis produced all out to the benifit of their useful idiot (that would be bush) and as a result are "resting".
a sprint followed by a nap.
With respect to your views, I really don't want to get into one of these tiresome, testosterone tumbles; I wonder if you're right about Saudi Arabia stepping forward as an active player in the Middle East, compared to the more passive role its had until recently.
Hasn't Saudi Arabia, in reality, played a key behind the scenes role for decades in the Middle East, only now its chosen to step forward into the limelight and go public?
I'm thinking about Afghanistan here, where Saudi Arabia was crucial to the war against the Russians, providing men, money and ideological backbone to the struggle. There's also their role in the Iraq-Iran war, which is too big to go into here.
I think you right about the main reason they are entering the stage so openly and actively. They are deeply concerned about the enormous destabilizing effect of american envolvement in the region. Specifically can the disasterous destruction of Iraq be confined to Iraq alone, or will it spill over to eventually engulf the whole region? Saudi Arabia's new, overt, policy shift, can be seen as a sign of deep frustration and profound fear that all the conflicts in the area could bleed into one another, into an unstopable and uncontrolable river of blood, or perhaps that should be tidal wave?
So, Saudi Arabia, above all wants stability in the Middle East, not more regime change, not a New Order, not more war. However, peace in the Middle East is easier said than done. Some kind of peace between the Palestinians and Israel is the key to reversing the slide towards chaos and extremism. Somehow the two warring peoples have to be forced to share the land and its resources. With their money the Saudis can probably, with luck, buy most of the Palestinians off. But only if the Israelis return to their old 1967 borders. But who will force the Israelis to do this? Only one country - the United States has the power to do this. How likely is this? Not very likely at the moment. But what of the future? Is Israel really, or objectively, all that important or of vital national interest to the United States? Will the United States one day decide its "had enough" of Israel? That Israel just isn't worth the cost? It's a very difficult question.
But how much time do we have? How long can we allow the festering sore to pollute the Middle East? I'm talking about the Israeli/Palestinian conflict here, not Israel. Saudi Arabia clearly thinks that time is running out.
Thanks, Oilaholic, for bringing up politics, and thanks, Stuart, for extending your chart back to 1995. A comment I made to Stuart 3/26 under "Water in the Gas Tank" seems worth restating here:
Stuart, you may be giving too much emphasis to geology and not enough to politics. So I ask again, Is there more room for a political analysis here? Under your 3/8 Post, A Nosedive Toward the Desert, I said in part (slightly edited and [annotated]):
"Politics tempers geology. Stuart's post may give too much emphasis on the geology, leading to a too pessimistic downward projection in KSA production in 2007-10.
"The two KSA swing-production events in 2003-04 tend to distort the shape of the 2002-06 KSA production curve – the large [but brief] increase for the Iraq invasion is the clearest of the two, and the second larger surge (larger in area/volume, not vertical scale), MONTHS before the 2004 U.S. presidential election (the elephant in the room no one wants to mention - the KSA tribe looking out for their Bush tribe friends - can we forget the picture of the two clan members holding hands at the ranch?) If you [arbitrarily] level these out [to partially adjust for the possible politics at play], closer to the OPEC quota limits for these periods, and then extend the production chart back to 1997 [for visual perspective - close to the lowest price in real $$ since 1973], then the later KSA declines don't look so severe.
"(Note also that the steep production drop at the end of 2004 closely matches the price drop for that period.) [But it is only a fraction of the pre-election increase, in relation to the price change.] In addition to KSA's offset for the Iraqi production increase in 2006 [observed elsewhere today (3/8)], note also that Russia continues to increase production to the end of 2006. (The overlapping KSA-Russian production chart posted, sorry I forgot by whom, yesterday was telling in this regard. While KSA swings, Russia steadily increases from 2002-2007.)
"Assume KSA has economists and sees OECD economic softening, and demand destruction in the third world; it's not too hard to imagine them in July 2006 anticipating lower demand beginning soon and continuing for some time, thus jumping the gun on the price peak. An added geopolitical factor is KSA's growing impatience with U.S. failures in Iraq: this could explain their reversion in 2006 to more closely hewing to the OPEC quota limits than in the prior three years (don't listen to us, invade; oh, you failed... now we need extra $$ to defend our Sunni Iraqi friends...)."
When you compare the huge KSA production response in 2004 in Period A (coincidental with a modest price increase from ~$30 to ~$36/bbl) to the smaller KSA production response in 2005 in Period D (coincidental with a less modest price increase from ~$34 to ~54/bbl), you have two main factors to consider, geology and/or politics. My only point here is that KSA's huge 2004 production increase might be equally or more greatly attributed to the U.S. election than to just an exercise of their swing role. This is not "tin hat" stuff. Bush needed that boost and the resulting moderation of the price increase (change a few thousand votes in Ohio...): imagine how a price spike resembling 2006's would have changed things.
Just for discussion purposes, modify your chart by taking the slope of 2005's production increase and superimpose it on the 2004 period, starting at the beginning of Period A - - the result is a slope that increases uniformly, blending well into Period D, almost to the point of peak (the end of Period D, or just after).
Thought experiment, Stuart: If KSA's production curve looked more like that posited above (i.e., the Saudis refrained from playing politics), would you have viewed the production drop in the last half of 2006 with the same level of concern... and (will you) would you have been less surprised if KSA resumes a higher level of production as we go forward in 2007 (in their swing role, assuming no major demand destruction)?
P.S.: We can also ask whether/why KSA "let" the Dems prevail in 2006 by NOT responding to the price spike - - were they just sending Bush a message (what do you say about a small country that gets to order the Vice President of the United States of America on a plane ("report to us immediately, we have a message for W"), that posts a veiled message in the Washington Post about their dissatisfaction with the treatment of their Sunni friends in Iraq, and, suddenly (check out the timeline for yourself) administration officials are dropping hints and making "surging" statements, and like, WOW, we get a surge...
____________
Rex Tillerson says the world’s oil would not run out in his lifetime. Means nothing... this guy doesn't buy green bananas.
Khebab,
Your correct about the value of speculation. So long as we try to remember that it is speculation and not fact. Models are fine, but one relating to the future, based on questionable data are problematic. Slowly but surely we are moving closer to real empirical data on which to base our theories about Peak Oil. It's just that the emperical data is always out of date, which seems to be why we're forced to use predictive models which will always be, in essence, inaccurate. How much this really matters in most cases is debatable. However, given the importance of oil to our whole civilization, these numbers are of enormous significance. It's just a shame, which is an understatement, that for a variety of reasons the available data and the models are so "fuzzy".
I make a distinction between empirical data (all real data collected is actually empirical) and empirical models. An empirical model can be one either based on first-principles or one based on an equation that you pull out of your butt. The latter is sometimes called a heuristic.
I agree that we get better empirical data but try to stay away from empirical/heuristic models.
Hello Dave :-)
See, your problem, Euan, is that you're sober. And for me, it's still way too early in the day. I see FF told me I "sucked" and told you "Goodbye". And, I've been told to f**k off. So much for this. I'm quite sure these British Petroleum people have no idea what they're talking about, right?
Giving people here a useful "heads up" here on my the outcome of my discussions was clearly a mistake. I'll publish and when I do, I'll post the link here. And you know what will happen? — nobody will pay any attention. And Khebab's remark — that the weblog is for speculation — well, that says it all, does it not?
Many of you may now resume your journey through
And now, adieu...
DAve says "m quite sure these British Petroleum people have no idea what they're talking about, right?"
As soon as you tell us what they say we can make a judgement Dave, you're trying to put the cart before the horse, and claim victory.
you say,..British Petroleum people have no idea what they are talking about.
This Dave is called pleading your case from Authority. This is not part of the scientific method Dave. There are no experts in the unknown, don't try and claim there are to prove a point. Its bad journalistic practice too.
Quid Clarius Astris
Ubi Bene ibi patria
The other option here is that maybe nobody knows what they are talking about - after all, these same BP people were presumably working there in 2001 when Lord Browne said BP would grow organic liquid production at 5.5% per year. Instead it's gone down at something like 5% per year. It may well be that the BP engineer has a different idea of what a "mature" reservoir means than the rest of us - if their meaning is along the lines that "Prudhoe Bay is a mature reservoir," we are still in plenty of trouble.
Bottom line: The future is cloudy, whether in Saudi Arabia or anywhere else. That in itself is cause for concern.
Re: speculation
Speculation is good for the mind.
The strongest arguments prove nothing so long as the conclusions are not verified by experience. Experimental science is the queen of sciences and the goal of all speculation.
Roger Bacon (1214?-94?) English philosopher, scientist.
Dude, it is very simple. If you think SS or FF or Khebab are wrong, then tell us why they are wrong. Let us have your analysis. This forum is open to all.
But all you have done so far is cast aspersions on their work based on the opinions of anonymous sources that are known only to you. Naturally, you should expect some hostility.
You are probably a nice guy I didn't imply that you sucked... your post had no butter.
FF
Dave - these contributions are utterly useless. If the experts in question will express their view in public in detail, then there's value. But "I know an expert who thinks there's no problem and therefore you guys are all idiots", is going to persuade no-one. Until we see people's reasoning and have the chance to debate and dissect it, "anonymous experts from BP say don't worry" is exactly as persuasive as "Daniel Yergin says don't worry". For some reason, you seem to be trying to persuade TOD that you are now vastly more knowledgeable than everyone else and have the real inside information. But saying so while failing to actually exhibit any such information is just going to undermine your credibility.
The main idea of Dave's post is not really the "I showed this to experts". The real substance is in the idea that people are seeing evidence that supports their position, and not seeing the evidence that does not support their position. In this very article, you show a graph and then say
And I can't help but note that my impressions from the graph is that it showed virtually nothing at all that one could draw any conclusions from. The behavior of their "return to quota" looked a like their their previous "return to quota" behaviors during previous declines. There were times in the past when they appeared not to be able to rise with the quota. So what? It is like reading the HL graphs - a lot of graph reading starts to look like tea leaf reading and all the so-called "experts" are seeing things that, surprise surprise, match up exactly with the forecast they've been predicting all along. We see what we want in the graphs, and so any disinterested lurker, like myself, despairs of finding an "expert" willing and able to stay objective.
Address the specific argument at hand. Do not point at some post that does not pertain to the analysis of Northern Ghawar and say "you ignore your own data". That is not providing a counter argument.
Your comment made no sense to me. Where do I say "you ignore your own data?" What argument at hand am I supposed to be addressing?
Jeeeeeeeesus Christ, Stuart, I sent you an e-mail telling you exactly who I was talking to. These are BP people within the peak oil community. I'm waiting around to get them on the record. It's hard to get people's time & attention when they think something is of so little importance.
This is too much. Give me a break. The craziness around here is just totally out of control.
You ain't seen nuthin' yet, just wait a year.
The main problem, as Khebab alluded to above is that there is no concrete data on many of the myriad pieces of the peak oil puzzle. Imagine we are trying to build a state of the art stereo system. We have alot of smart people on this site trying to contribute - some are running around with the volume knob while others are running around with a tuner amp, and others are refining the best type of wire to go to the speakers. Collectively we are connecting dots that arent being connected in the mainstream - every new dot we connect is a step towards pure sound.
What we do once we have music should also be being discussed.
Except that, to extend the metaphor a little, it is starting to look as if many of those waiting to hear the final result of the efforts are tone deaf, and lots of others have ear plugs in :(
It's also true that there are people know as "audiophiles" who apparently listen to the sound of their audio, hi-fi system and not to the actual music being played. Don't get me started on the difference between valves and transistors and which one plays music more accurately, that could so easily lead into controversy between the two camps and an awful lot of meat grinding.
and i would be running around looking for the nicest oak to build the cabinet from.
I'm with Stuart, if someone has something to say, then say it. If they don't have time to deal with it then it is a non-issue, there is no point to have unknown experts with knowledge that they can't tell you about. I really don't see craziness that you are talking about, people just are wanting to understand the argument.
My point is that until you actually have useful detailed responses, you aren't offering anything except generally insulting folks' competence. No-one here is going to take "I talked to an expert and they said not to worry" as of any evidentiary value whatsoever. So why bother saying it? In particular, why bother saying it wrapped in insults to other people's competence? I agree that if the person ASPO is talking to produces a detailed response of some kind, it may well move the debate forward and that will be a good thing. But in the meantime, we have no useful information at all from that source, and your attempts to suggest that you do, but you can't share it with anyone, are simply unhelpful.
Re: For some reason, you seem to be trying to persuade TOD that you are now vastly more knowledgeable than everyone else and have the real inside information
The whole point is that I wasn't vastly more knowledgeable than everyone else in the world. Part of wisdom is knowing when to punt the question off to someone who is.
This remark you made to me is beneath you. You have high standards I have always assumed ... [part deleted because I will not say anything I will regret later out of anger].
Dave, your original post here violates all those rules of journalistic integrity that you espouse. So rather than upset the apple cart with no proof, please do tell us when your article is ready and where we can read it. Right now you are simply appealing to authority and even you wouldn't accept such an appeal if done by someone else. I have no doubt that you feel you have good reasons for your position but unless or until you are able to discuss them publicly, we can't hold much of a conversation, can we?
So please do tell us when your article is up and where. It will most definitely be on my reading list.
Ghawar Is Dying
The greatest shortcoming of the human race is our inability to understand the exponential function. - Dr. Albert Bartlett
When did comments in a blog become journalism? Dave wants to say that math modelling articles on the main page are BS, well, fine, that's his prerogative. I disagree, mainly because none of the contributors are under the illusion they're reporters. But applying journalistic standards to comments?
Dave applies his "journalistic integrity" argument to any article he dislikes and to any comment he dislikes. He then turns around and does the same thing himself. There is a word for this.
Yes he can call the math modeling articles BS but then when people say hostile things back at him he shouldn't act all indignant as if his holy righteousness had just been questioned.
In short, he can't have it both ways and expect to be respected.
Ghawar Is Dying
The greatest shortcoming of the human race is our inability to understand the exponential function. - Dr. Albert Bartlett
No, no it wasn't. I appreciated it, and I'd bet a lot that many other lurkers did too. The site is threatened with being overrun by some of the personalities here and their followers. Clearly some of these personalities are not here strictly out of desire to share and receive information, and are therefore suspect in their objectivity, IMO.
Dave, Thanks for takin' the 'slings and arrows' to keep the discussion balanced!
Just wanted you to know - there are (still) many people reading this site who are seeking the truth, and do not consider the issue closed. Although many here have taken the recent inferential analysis on Saudi's reserves as definitive (while dismissing Euan's inferential analysis of well productivity as unfounded), I believe most of us recognize that both arguments are weak because of the lack of solid data, and need to be seen as conjectural. Solid input from experienced engineers is hugely valuable - please post it when you can.
I appreciate the expert analysis from you, Euan, SS, and even FF (when I can decipher it:). Hopefully we can all recognize that this is not a contest to see who "wins", or who is "right", but more like a "Lost"-style mystery, with plenty of plot twists yet to be revealed. There aren't any points for shouting the loudest, or being the most "faithful" to the Peak Oil cause...
CW
Global peak: 2007 - 2010
Global decline rate, Post peak: 2%
Economic response: Severe global recession, ~5 years, then slow recovery
well said,
you too speek
Solid input is valuable. Baseless name calling and throwing tantrums because someone won't accept Dave's "authority" is not.
Ghawar Is Dying
The greatest shortcoming of the human race is our inability to understand the exponential function. - Dr. Albert Bartlett
I very much agree with this sentiment. I've been involved with this board for a long time and I remain of the position that the situation is highly uncertain and that there is no clear indication of whether a near-term Peak Oil scenario is likely to play out. I have always found Dave's input to be valuable and he has been one of the best contributors to this forum since the beginning.
It's kind of ironic that just as we may be approaching a possible test of some of our theories, we seem to be seeing a new level of disagreement and even acrimony among contributors here. What happens in Saudi Arabia over the next few months may well shed considerable light on the true Peak Oil picture, particularly if there is a supply disruption somewhere in the world, or a new surge in demand that really puts pressure on SA to up their production.
Unfortunately, instead of adopting a wait and see attitude, many posters seem determined to come up with the answer at the very first possible moment. This is leading to these micro-analyses of every breadcrumb of information that leaks out of Saudi Arabia, trying to fit it into the big picture. And everyone is arguing over what these tiny fragments of information mean.
I would suggest that we should just chill out for a bit. Chances are that things will look much clearer by the end of this year. I know that uncertainty is not pleasant, and in a way, knowing that the answers may well be coming soon makes the waiting that much more difficult. But we have been waiting for a long time, most of us, for a clear indication of what the future may bring. I think we can wait a few more months.
If you have a counter-argument to FF and Stuart, present it. If not, then your comments are less than meaningless. "I like Dave" and "What Dave has said in the past has made me warm and fuzzy inside" Does not address the argument or it's conclusions. I believe if there was an error in their argument it would have been presented by now, especially with the fervor whith which you debunkers are trying to shout them down.
I agree. I think we need to exhibit some restraint and bit of caution until we get more hard, empirical data, rather than endless arguing about numbers that don't add up because they aren't there yet.
I would hate to think that attitudes on TOD are somehow a metaphore for how the future is going to pan out.
Dave, you say
That would be "Rethin". He apologized.
I have been on the internet for about 15 years now. I have seen group after group fall for extended Godwinization on USENET. Believe me, apologies on the internet are extremely rare.
The only way a civilized discussion takes place is by being stoic about namecallers, which rethin appears not to belong to, by the way. Just prove your point.
Just prove your point.
Agreed, no more bones.
I don't see what the conflict is. "Mature"="watered out" it seems to me. Nothing unusual about a mature/watered out field for a petroleum engineer.
Ding, ding, ding. We have a winner. There may be absolutely nothing extraordinary about the situation except that it involves the undisputed heavyweight champion of all the world's know oil reservoirs.
The only reason people are going back and forth on this argument so much is that spot oil prices are relatively low and people are generally not jumping up and down about a shortage. In short, the Mighty Consensus (informed or not) apparently says Everything Is OK (of course this consensus may be manufactured/simulated by all sorts of tricks). The vast majority of people, whatever their GPA in school, are simply not able to hold an idea that diverges from what they perceive to be the consensus. They will consider it, then feel lonely standing apart from the rest of the sheep, so they wander back towards the sheep ("maybe everything is ok"), then wander back towards the out-of-consensus argument if some interesting data appear, etc. etc. It's more of an emotional process than a rational one.
Quote "I am tempted to just stay out of these discussions and let people give themselves enough rope to hang themselves with. There is such a thing as journalistic standards & practices, and that applies to those studying "peak oil" more than anyone else, because it is us who hold the controversial position. I also believe that a lot of naive people reading TOD get many wrong impressions. That's a shame".
You were "tempted", and did not fight the temptation,.. you broke "the rules" and make claims without backing them up. This is not journalistic at all, its familiar of similar tactics used by the media of this administration. Basically the tactic "if you can't dazzle them with your brilliance, baffle them with your BS". The BS here is, I am a journalist, and have info, trust me,. I think a few majors have had to apologize for such "trust" over the last few years, when supposed sources and info was not there, but the journalist claims it was.
If you have info like the others said, lets have it, if not, why are you claiming journalistic evidence and then not producing it, yet laying claim to your journalistic prowess. You have not done this once, but on multiple posts concerning this subject.
Why are you delaying giving the evidence you claim to have.
I work in the media also Dave. I find your statements lately very troubling in how I am supposed to judge your 'standards".
EDited to add,
ALso Dave you claim to do something again in the future, and there will be "consequences" for those that disagree. You bring this out in the public. It can be regarded as a "threat" by some.
Disneyland Dave, Disneyland is a theme park of dreams, that break the known reality. A reality that has come true from many of their "exhibits".
Its meant as a disparaging remark from your POV. From my POV and knowing what "Disneyland" represents, you are way off base IMO in this tactic.
Bring on your evidence Mr. Cohen.
Quid Clarius Astris
Ubi Bene ibi patria
A few observations that spring to mind;
You see that's more interesting to me than anything else because it indicates that to these people, whom we are asked to believe (via an appeal to authority) are experts in their field, this is routine. Nothing new here, all completely expected, move along now.
To me what they are saying is 'yeah, that's a field at the top of its game. Seen it plenty before in other places. So what?'
So why release something that can obviously be interpreted to show trouble ahead? The Saudis are smart and know their game, if there is trouble to be inferred from those numbers they must have known it was their. Surely they are smart enough to have edited the worrysome bits out?
Finally I am reminded of a Quote Mr Gore used in his recent movie;
The quote is from Upton Sinclair
Yeah, like try getting Gore to understand that his family business of livestock (cattle ranching) is responsible for more anthropogenic co2 equivalents (18%) than all of transportation (13%), according to a recent UN report.
Which offers me the perfect opportunity to say thank you, once again, to Ralph Nader and all those who demand sainthood from Al Gore, for the past six years. They have been so lovely for us here in the US, and even more so for those in the Middle East.
Look, when someone makes a big documentary about global warming without mentioning livestock, it's equivalent to making a lung cancer documentary without mentioning smoking!
Except that it involves food, a topic which immediately flips the Off switch in most people's brains!
Asking for Sainthood it is not. In fact it's a pretty egregious error! And by the look of Gore now, he ain't gonna give up the steaks, and will probably keel over from a heart attack before you know it. Sad.
He did look a little large at the Academy Awards, talking about global warming to nearly a billion people.
By the way, when is your movie about livestock coming out, and where can I see it?
Riiiiiight, only those who make big screen documentaries are qualified to criticise Al Gore - now who is trying to make a Saint of him? Sounds like YOU! That being said, I supplicate myself and bow down before Al's inherent environment-loving greatness! Oh, how I wish to tickle one of his chins, just to see that sweet Angelic smile shine through!
I see - the livestock industry is the source of more than 80% of the anthropogenic forcing, since it's equivalent to lung cancer caused by smoking. Why are we trying so hard to regulate CO2 emissions when they're a small fraction of the problem?
Assuming you're referring to the unmitigated methane release due to livestock raising: CH4 has GHP of 21 re: CO2. In 2003, world emissions were 25*1012 kg CO2 and (I project based on linked data) 0.15*1012 kg CH4 from livestock (31% of total 0.50*1012 kg). These are GWP equivalent to 13% and 42% of the CO2 quantity respectively. Thus, out of total anthropogenic CH4+CO2 forcing, the livestock industry is directly responsible for 9%.
That's rather less than 80%; I would go so far as to call this "...a pretty egregious error!"
Edit to add:
I forgot to address the 18% number (although that's still a bit less than 80%). Mind posting a link to that UN report?
Since there is a three year delay (or more) between drilling and production, won't we see a big spike in production in 2009 after those 55 rigs kick in? Seems like it is too soon to expect increased flows.
Of course, it may have dawned on the Saudis that this blog is correct, the price of oil is about to go through the ceiling, and if you leave it in the ground until it reaches $300 a barrel you do not meanwhile have to figure out how to invest it in ways that other countries cannot readily steal.
George
Just out of curiousity, and frankly ignorance, since I'm new to TOD and relatively innocent of middle-east knowledge: is it possible that the overall strategy of the Saudi's is to convert as much oil as possible to "liquid" wealth that can be taken with the Sauds when they flee the country in their jets ahead of an inevitable revolution? That would certainly represent another aspect to their own calculations on oil left in the ground...
Welcome, greenish:
As another of the ignorant ones, i'm glad you're here.
The Saudi royal game can continue as long as they can pump enough at high enough prices to keep their restive youngsters appeased &/or paid off. When either price or volume falls, their massive demographic and economic problems will swamp them, maybe resulting in the revolution you foresee. So "leaving it in the ground" would only guarantee an early end to the other Magic Kingdom.
I lightly tiptoe thru the comments and dare to post thusly:
Greenish person...Its not Ozzie and Harriet with the Princes and King fleeing with all the wealth.
Its High Stakes Geopolitics with the stakes being the End Of The World as we know it.
Bush and Co. are very very synched in, though many here believe him to just be a chimp, very aware and playing the game. What they are not playing for is you and our lives. They are playing to be on top of the game of SUPER SUPREME EMPIRE.
We are just the useless pawns. Yet if they make some bad mistakes in gamesmanship then they could find out that an angry pissed off bunch of citizens can be very unruly.
They I suspect also realize this and have plans in place.
What you should do therefore IMO is make your own plans.
To not do so then invites a lot of very tough risk.
One needs to be able to hunker down when all this starts to play out.Stay out of the spotlight.
Airdale-"You better stay away from Copperhead Road"
Ok Cid? My kinder music. No HuHu.
Stuart
I find the spike in oil rigs that began in the 4th quarter 2004 very interesting. It coincides with a a small sharp drop in production.
Do you know what caused that drop in production?
If you look at the data from late 1998, late 2000, early 2003 and late 2004 you will see that Saudi production also fell prior to any quota cut. OPEC quotas are not the best way to judge Saudi production aims - Saudi Arabia esentially sets the quota unilaterally given its role as swing producer. I would argue that the drop we have seen recently was a sign of the Saudis deciding early that production needed to be trimmed. US and OECD oil inventories were particualrly high towards the end of last year (in fact they remain high) and there was real concern that prices could fall. Indeed the market bought into this and we dipped below US$50/b for a time.
Of course that does not prove Saudi Arabia is not experiencing a critical production problem in the north of Ghawar. However, the pattern certainly does not prove that this is the case as past examples do show similar patterns, and Saudi output and quotas are not always on the same page. Looking at the data I would suggest they are actually more in line with quotas now than at many times in the past.
Looking ahead I would expect the drop in Saudi output to at least stabilise (from a market perspective) though an increase in production may not come until the second half of the year. This is definitely a wait and see. The test comes when the market needs more Saudi crude - if they cannot deliver then I think the hypotheiss gains strength. Until then I cannot agree that output patterns really tell us anything at this stage.
But another few months of data should say a lot more.
Good, that's not even one Friedman.
Friedman's are the basic quantity used in software engineering to give the final production date.
Free Software has broken with the concept and uses the much stronger estimate of ...
When its ready.
I like to hide the use of Friedman's by using the range estimate of 4-8 months.
In general the people requesting a piece of software cannot understand why you cannot get it done on time as they continually lower the amount of resources you have and increase the requirements inducing friedman behavior.
another few months of data should say a lot more
I am reminded of a comment by Robert Rapier a few weeks ago.
Although he expects a KSA production increase in late May/June, if they do not increase production and exports then, then we have a strong signal of production problems (or words to that effect).
IMVVHO, June exports from KSA are the pivotal point in time and place for confirmation of a World Oil Production Peak !
In theory, the world could peak slightly after KSA peaks (perhaps a year) but the delta is of little consequence and may be due to above ground factors (peace in Nigeria, Iraq, increased production from Venezuela after skilled people are finally replaced, etc.).
In our rear view mirror, May 2005 may have been the all time C + C production peak. And has it not been said that we would know the peak only a couple of years after the peak ?
Best Hopes for Reality Based Planning,
Alan
I would not take any short term increase for KSA this summer as a signal. Euan makes a convincing argument that they have taken some wells off line. Next they consistently claim they manage production we have no reason to assume they don't throttle back wells. In short regardless of the oil price we can expect KSA to be slightly conservative in their production .
And they do have significant tank storage.
All three of these factors indicated that the 8% drop represents either of two conditions.
1.) A mix of falling production and contrained production.
2.) Constrained production only.
As of now we have no reason to believe that the 8% decline is 100% from falling production.
Depending on the ratio of the amount lost from constrained production and decline and adding the ability to overproduce we can expect KSA to surge production for a short time sometime this summer.
We can expect them to continue too rotate wells and rest them even as production declines since its sounds like good management. And it allows them to surge briefly to counteract spike and oil prices. Not to mention the political effect of slight unsustainable production increases.
What we have good evidence for now is that they probably no longer have any wells with good flow rates that are shut-in for the long term. Basically all their production capacity is now being used in their rotation plan.
We can only determine depletion effects better once they are
put in a position to increase production at least once allowing us to determine how much production is offline at any point in time via rotation.
Next the fact that all wells are in rotation would show as a fairly quick decline back to a safe production level. They don't want to surge production for long.
Finally the number of well that are being rested at any point in time is basically a constant so spare capacity from stopping rotation briefly is basically a constant. I would expect them to continue to manage as they have in the past albeit with this constant shrinking over time.
Depletion will ensure that this constant spare capacity is being increased from a lower and lower base production rate.
If this is a correct view the fact they keep dropping production seems to indicate that depletion is a real problem and maintaining a constant amount of spare capacity
requires them to lower production.
So a increase should be expected whats important is both how high they go and more important how long they are willing to stop rotation. My guess is about three months max then they will drop regardless of price and claim they are now comfortable with 70 per barrel.
I don't think they will ever stop rotating wells except for brief surges. But we can expect the rotation to be reduced to the minimum they feel comfortable with for maintenance reasons. I suspect the best rotation rate is done on a well by well basis.
Finally we really need two data points at least if they are post peak so we need to see the surge and drop this summer and the next surge and drop which could be required as early as the fall. Its the second call on KSA to increase production that is the most important esp if they refuse or continue to decline.
In any case the current production profile seems to indicate they are in decline but the exact decline rate probably cannot be determined without a better understanding of the rotation policy.
What about their failure to increase production after Katrina?
I recall news reports claiming that Saudi Arabia had taken over the floating oil rigs as the leases came up, and that was going to keep the Gulf to maintain production. Lots of rigs for water off the coast of SA.
Quid Clarius Astris
Ubi Bene ibi patria
Although generally convinced by the Peak Oil argument I am very far from being convinced by the graph posted. The IEA table 3/4 figures show the exact same trend during reductions in quotas in 1998, 1999 and 2002. Although it is possible that KSA has peaked the first real indication will be the reaction next time OPEC quotas are increased. (As they surely will be some time this summer). These ARE exciting times. And it is possible that KSA has peaked - but the evidence presented above definitely doesn't convince me!
Look more closely at the graphs. In every other previous OPEC quota cut, KSA moved in exact sync with the timing of the quota cut. But for this last drop, the fall begins over a year before the cut even occurs. This is what is remarkable here.
Ghawar Is Dying
The greatest shortcoming of the human race is our inability to understand the exponential function. - Dr. Albert Bartlett
I am astonished at how many people believe Saudi Arabia when they say their cuts are “voluntary”, but totally ignore them when they say their “existing fields” are declining at from 5% to 12% per year and need an additional 500,000 to 1,000,000 barrels per day of new production just to stay even.
In my humble opinion a person would need to be stone ass blind not to be able to see the true situation in Saudi Arabia. The decline in production has put them in panic mode. That is why they are paying top dollar for every jack up rig available and their total rig count has tripled.
It is true that they are very secretive and no one really knows what is going on. But all we must do is look at the evidence, the preponderance of evidence!
The Saudis admit that Ain Dar/Shedgum are both way over the hill. And even using their figures, the whole of Ghawar is also over the hill. (48% depleted three and one third years ago.) Saudi is clearly counting on “New Projects” to make up for the one half to one million barrels per day that their existing fields are declining.
And one word about the word “crash” which Euan refers to above. A decline of 5% is a steep decline rate. A decline of 12% is by any definition a crash!
Ron Patterson
The difference is you are seeing the multiple smoking guns and making a conclusion, while others are awaiting the decomposing corpse... wishful thinking is the hallmark of our species.
Dude, some of us, who are into math, are looking at Stuart and Khebab's work and seeing that they correlate pretty well with the SPE paper, especially the cross sections. Engineers and scientists use models all the time and are fairly comfortable with them. Others are applying journalistic standards, ie, a journalist is neutral until he finds evidence one way or another. To someone like Dave, having BP experts or RR say KSA hasn't peaked is more definitive than math.
To me, Euan made the only argument against FF possible. Someone has got to explain why a field that is 90% green and 10% red isn't watering out. Euan said the cross section isn't representative; he could be right, but at this point he has a busted flush vs two pair. BP engineers stating a field is mature doesn't explain the massive green.
Dude, some of us who aren't into math can still do a little math. Saudi Araia says their existing fields are declining at a rate of 5 to 12 percent per year. Now I take "existing fields" to mean all those giant fields that have been producing oil from 45 to 60 years. These fields combined produced, in 2005, well over 8 million barrels per day of Saudi's 9.5 mb/d of production.
Okay, that's only what the Aramco Exec, (Senior Vice President), is saying. How do we know he was not telling a bald faced lie? That is how do we know that Saudi's "existing fields" are even declining at all. The evidence says, (evidence produced by Aramco) that Abqiq is almost completely depleted. They also said, over three years ago that Ain Dar/Shedgum was 60% depleted.
Okay, I don't have much any information on the other existing fields like Berri and Safaniya but it is very likely that these very old mature fields are in decline. In other words, the Senior Vice President was likely telling the truth concerning the rapid decline of Berri and Safaniya as well.
And let me remind you, Aramco is investing its capital in projects to revive several very old fields that have previously been mothballed because of poor production or reservoir problems. What does this tell you? It tells me that there is very little new oil to be found in Saudi Arabia. Little, if any, new oil and their old giants are all in steep decline. And they are currently trying to revive old, much smaller fields, that had already been given up for dead.
Okay Dude, do the math!
Ron Patterson
Hey. I'm with you. Like I said, those cross sections tell the story. When they are almost all green, it's not a mature field, it's toast.
One can read it as Saudi are confident that their large fields will still produce and not fall as a cliff, so they have just have to bring back their 60+ old fields back into production to stave off the declines.
I think they are preparing to explore for more oil. They definitely cannot maintain anything above 10mbpd without bringing several new mega fields into production every few years.
If they had a lot of proven oil on the ground with good production potential, they would have already stated how they can reach 15mbpd. They have said if demand requires them to get to 15mbpd after 2020, they will be able to provide it. They claim they can ramp up from 10+mbpd to 15mbpd by 2020, but all they show is evidence to 11+mbpd by 2010 and maybe 12.5mbpd if they are lucky.
If this is not evidence of PO, then I don't know what will.
It's the new math!
Obviously, they have 12.5 million bpd capacity, of which they can produce whichever 8.5 mbpd you like!
Due to the decline of existing fields it seems unlikely that SA will produce more than 10.5 mbod at the end of the next seven years (Al Jazeera article):
http://english.aljazeera.net/English/archive/archive?ArchiveId=11252
I had read a general formula that the world used 2 mbod more in the winter than in the summer due to heating needs. A winter drawdown of stocks would not seem unusual given this formula.
Read that Russia was able to increase production in 2006 by about 300 or 400K bod, but that they used the added production internally and did not increase exports.
Ok, I get it. So they shut down older fields because the were poor producers and now they are spending huge amounts to try to revive them? Wouldn't if make more sense to start producing some of the Billions of Barrels they claim to have in undiscovered reserves?
But of course those are still un-discovered. Hmmm! So we can see a massive build up in drilling rigs for the revival. Where is the investment in Seismic or other exploration activities for the discoveries?
Stuart:
Are these values C + C? Condensates do not count against the OPEC quota if I recall correctly. Only crude production.
Second, aren't the quotas "export quotas," not "internal consumption (or trade within OPEC) plus export quotas?"
ST, I am not sure about C+C but I think it is counted because it is just mixed in with the crude. Now mind you I am not sure about this as I have asked the question many times, on this list, what happens to the condensate after it is produced. But I have never gotten an answer. Is it mixed in with the crude or is it shipped out seperately and refined seperately?
But quotas are production quotas, and definitely not export quotas. Indonesia has a quota yet they export nothing. They are a net importer.
Ron Patterson
Very informative post. Great discussion.
One graph that I think would be very informative would have these three data series:
A) oil price
B) Saudi oil production minus Saudi OPEC quota
C) Three year delayed Saudi rig count
D) World stock levels.
You have to have at least some estimate of the stock levels regardless of price since the producers are going to back off production when the refiners have no more storage regardless of the price of oil. This is the refinery throughput constraint.
E.) World Refinery capacity
Are the refineries running at capacity world wide or is a significant amount offline for maintainece.
F.) Projected seasonal demand and historic stock levels worldwide.
There is some evidence that OPEC sets quotas based on the world price of oil. But I know of absolutely no evidence that oil producers look at world stock levels before deciding how much oil to produce.
History shows that most world producers produce flat out whenever possible. During oil gluts, in the late 90s for instance, nations that were previously increasing production, Norway, UK, Mexico, Russia etc. etc, just kept right on increasing production, adding even more oil to the glut. OPEC paniced over the price collapse and stepped in and cut quotas. But it was the price of oil, approaching $10 a barrel that got their attention, not the inventory levels.
Ron Patterson
Interesting yet today world stock levels are being used as the key argument for cuts. Its a big change from the past according to what your saying.
Can you clarify a bit more since obviously supply cannot be more than demand. It seems to me that your saying that as far as we know the world would use all the oil provided at a given price point down to like 10 a barrel. This means demand is for all practical purposes infinite ?
I'd guess this is caused by industrial fuel use as apposed to NG and or NG/Oil feedstocks for chemicals. So their exists a huge potential demand based on the price of oil vs NG ?
Yes, OPEC for the first time ever is using inventory levels as a reason to cut production. That is why it is so very dubious. They are cutting production while the price is still very high. True world inventory levels were a littlt high last fall when they inituated the cuts but not that high. Since then they have been falling. In January OECD inventories fell by 8.6 million barrels and I am sure they have fell far more since then. But OPEC says they are "still high". Yeah Right!
Of course there is a level where producers, even Russia or Mexico, would cut production. That level is where it would no longer be economical for them to produce oil. If it costs them more than they are getting for the oil, they will stop, I promise you they will.
Ron Patterson
Wouldn't there be a water cut where it would be uneconomical for the Saudis to keep a well open? The Saudis are after all pumping sea water hundreds of miles. There probably is even a water cut where the EROIE is less than 1, which would imply that the wells would never open again ever, even if oil went to $1000/bbl.
Your confusing two things.
Negative EROI is fine if the energy source is different from the energy produced. I.e is perfectly fine to use coal to make electricity to pump oil and have the total EROI negative if your more interested in the form the energy takes i.e liquid fuel.
The price point is not important since the cost is using the electricity to pump oil vs using it for some other use. The price point at which even negative EROI oil is still usable is probably a lot less than $1000/bbl and related to creating liquid organic fuels with other feedstocks including plant material. I've guessed this is around $500 or so a barrel at that point almost any feedstock is viable.
The worst feedstock case would probably electrolysis of water and reaction with C02 for methane thence via GTL to liquid fuels. You would not do it exactly that way but you get the picture most of the energy is in the hydrogen production once you have hydrogen you can make any organic fuel given a carbon source regardless of its state.
Using a nuclear reactor for the electricity. This would be the most expensive way you could make liquid organic fuels.
So this provides the absolute upper bound on the cost for liquid fuels.
Btw thats why I never understood the hydrogen economy stuff since you can always make methanol using carbonate or air extraction of co2 with NaOH and from methanol you can make anything or use it as your H2 source. We have never needed
pure H2 it makes no sense. Since its trivial to use a bit of extra energy up front to create the methanol instead of high fixed costs or compression costs for moving and storing hydrogen.
That point is probably well in excess of 99 percent water. KSA however may be constrained by separation plant capabilities and is probably not yet interested in processing "oil stained brines."
One other point. There is no loss of water inherent in processing fluids with a high water cut. The oil and water [and gas] are separated. The oil goes in the tank. The water goes back into the formation down dip from the producing wells. The gas can either be reinjected or used.
At a minimum a field producing 3mbpd of oil would require 3mbpd of salt water staying in the ground if it's water flooded. That's got to be pumped in from somewhere.
True, but that is different question. To maintain pressures, the fluids being extracted need t be replaced.
The operators are already extracting a volume of fluid and injecting a like volume of fluid. If in the future water represents 99 percent of the fluid being extracted, much less additional processed sea water would be needed as the oil field brine would travel in a closed loop from the prodcuing well to a separator then back [down dip] into the formation via an injection / SWD disposal well.
Maintaining millions of bbls of oil production per day with these sorts of water cuts is wildly improbable.
Assuming supply is unconstrained we did not hit this number even at $10 a barrel in the past so its lower than that.
Also as you say some production is not economical at the various price points so its simply not produced.
This explains the $20 bl estimates given a long time ago as a good price point for oil and even the 30-40 band on the outside.
Not till you get below that are you going to even effect the supply demand equation and the main effect is to reduce supply as expensive production is removed.
So the whole over supply argument is a bunch of hogwash ?
Not exactly. Supply cannot possibly be divorced from price. If there truly is an oversupply then it will be reflected in the price of oil. It will fall.
But, and this is a very big but, if the Saudis are claiming an oversupply while prices are still high, then their argument is hogwash. And right now it is totally hogwash. World oil supply is very tight. Brent spot, at this moment, is $68.51. It would be an oxymoron to say that the world is oversupplied while oil is trading at $68.51.
Ron Patterson
I echoed the same idea downstream: Demand is not equivalent to the level of supplies.
http://www.theoildrum.com/node/2437#comment-176688
I still don't get it sorry. The market as far as I know has been able to absorb any and all oil produced throughout history. Certainly the price drops over time as oil suppliers compete for customers. But they never have once ran out of customers willing to buy oil. Even down to $10 a barrel at that point they cut supply because of the price demand was still their.
The whole supply/demand or oversupply argument makes no sense.
Now it does make sense to say that the market demand for say 60 bbl oil is lower than they want so if they supplied more oil the price would go down. But at all times demand exists regardless of supply its just that the price is too high to use oil as a fuel source for the demand.
Its better to say they were not happy with the demand destruction at 60 ?
Oversupply at 50 makes no sense as you state further down.
Oversupply at 40 makes no sense since demand increases as the price drops.
At best you could say they claimed the market at the 60 price point was oversupplied ? I'd not call it oversupply and demand but simply demand.
A better way to put it is maybe 60 oil destroyed so much demand that the price dropped ?
I never bought the argument that 60+ oil is not hurting us and to say that continued high prices eventually resulted in a real demand drop at that price point from demand destruction makes sense.
It also means they eliminated potential customers and they don't care. You cannot expect demand/supply/demand destruction to stay balanced so you get constant higher prices. If they are really cutting production on purpose they almost certainly will undershoot demand and cause skyrocketing prices and and assuming they can increase production they will hit the same problem on the backside as demand destruction kicks in after a certain price point dropping demand.
At best they are simply increasing the imbalances in the market. Since the current price points are way beyond simple demand supply considerations and demand destruction is a big factor.
memmel,
There is definitely sense in saying "The world is oversupplied" even when the price is at $60 or much higher.
In the short term (ie. measured in months or even quarters) demand is inelastic. i.e. Supply too much and price falls like a rock. Supply to little and price blasts off. So, arguably there is a sweet spot that KSA, as a swing producer, can target. What KSA wants is a stable price that still allows world GDP growth. (And OPEC continually talks about targetting an oil price that allows for growth).
If oil is $100, and the world economy is still growing nicely than KSA could claim the world is over supplied if new supply comes on that drives price to $90. And then could reasonably cut production in response.
Medium term (measured in years), things are different. If KSA has vast nearly unlimited oil resources remaining, one could argue it might be rational for them to drive the price down to $40, say, in order to create over a period of years a world economy that consumes their products in much larger volumns.
But they are not behaving as though supply is endless.
Instead, they want decent world GDP growth and the highest price of oil possible consistent with that.
In my view demand destruction is not a large consideration for anybody now because the world economy is growing quite nicely.
I don't know as far as I can tell real demand exist for oil at any price that its been sold at. The supply/demand equation will control the price but at no point have you had oversupply ever in the sense that more oil was pumped than existed buyers. No oil supplier have ever stopped pumping oil simply because no one wants it.
Next you don't go from a over supplied market to under supplied with small changes in the supply over almost a year.
You can say things like they did not have buyers at a certain price for their oil sure. But thats different. And the $60 bl is a fair price argument came out later.
The comment seems to have come out in Q4
http://in.news.yahoo.com/060926/137/67xz9.html
Exactly at the time that supplies were not sufficient not when they started cutting.
I'm not arguing that the cuts are voluntary are not. I am saying that it looks to me like the market is not and has not been well supplied thus the high price over historical norms and it means KSA can voluntarily or not be assured of high prices going forward because ....
The world has peaked.
This argument makes sense and it does not try to figure out if KSA's cut are voluntary because of depletion or a mixture
it does indicate that whatever spare capacity existed outside of KSA prior to 2007 seems to be gone and furthermore it does not seem like production can be increased any where outside of OPEC so far to take advantage of the recent run up in prices.
Kinda sorta, but remember the long history of cartels and swing producers. Rockafeller / the Standard Oil Trust, the Texas Railroad Commission, the KSA / OPEC.
I will beg to differ.
World oil supply is not as tight as you claim prior to OPEC cuts. Refinery input utilization has been steady and no shortages of crude oil has been seen. If the world is short on oil, Refinery input should be dropping and oil prices should go up. What we see instead is refinery operations holding steady and storage increasing while prices go up and Saudi production going down in Q2 throught Q3 of 2006. The picture changes in Q4 2006 when OPEC instituted production cuts.
If its not tight then how can a fairly small cut of 1.7 mbd have a big effect on oil prices ? It should have had no effect. Last time they cut for price reasons 5 or more mbd had to be taken off the market to really move the price. We have seen production changes greater than 1.7mbpd in the past without large swings in the price. +/- 1mbd is not abnormal.
On the other hand if supply is tight then small tweaks can cause large price swings.
The tightness of the oil supply was reflected in the price of oil at the time. That is the way it always is, it cannot possibly be otherwise. Unless there is rationing of course. The price was in the fhs sixties. End of story.
I haven't a clue as to what world refinery input is. I know that the world price for oil is about four dollars higher than in the US. Refineries bid for the oil they want and if they bid high enough they will get the oil they need.
Again, in the absence of rationing or other government price controls, the scarcity of oil is reflected in the price of oil. That is the way it is for any and all goods and services. (Economics 101.)
Ron Patterson
I agree with you. The term over supplied and well supplied is a misnomer oil prices are much higher that historical norms.
The market is not well supplied.
KSA may well be playing games on purpose or not to get the oil prices at certain price points but this is only because the market is not well supplied and has not been well supplied for some time.
At that point if they are the only game in town why 60 why not 70 80 100 ???
If they are going for price then as long as the increase makes up for lowered production on their part they can keep on cutting.
Are you not forgetting that several countries, including Uganda, South Africa, Ghana, Nepal, Bangladesh, Nigeria [yes, Nigeria], etc., are experiencing extreme shortages of oiL>
James Gervais
In general these countries are basically priced out. Don't forget the Philippines either they seem to be pretty unhappy.
I guess their demand is not wanted.
Looked at this:
http://freeoil.1111mb.com/spe/spe93439.pdf
Found this, which is about all that made any sense to me:
and I have probably misinterpreted, but does that mean they have to do this because that is as low as they can go before striking water. Meaning not much oil left?
Has anyone a copy of Oil Drilling for Dummys? (as everyone seems to be having a good time slinging mud about thought nobody would mind a question here?)
I have wished Stuart refute the point about lack of demand.
It is very clear from 2006 oil data that no one wanted more oil from Saudi Arabia.
The evidence points to Saudi Aramco reducing oil production to balance supply and demand.
Evidence:
1. IEA survey data show World oil refinery input/output stay constant
throughout the period Saudi Aramco cut production in 2006. No
shortages of oil. If Saudi Aramco did not cut output, there will be
more supply than demand. Lack of refineries to utilize the oil.
Link: http://www.iea.org/Textbase/stats/surveys/OIL_WEB.XLS
If you look at T7, you will see total output is steady with minor
fluctuations in 2006.
If you look at T9, you will see total stock levels of all products
were rising in 2006.
2. US EIA survey data show confirms IEA world oil survey data. US
refineries operated to similar capacity in 2006 compare to 2005. US
stock in 2006 did not show decline as expected if oil shortage. Saudi
cutbacks are acting as a swing producer balancing supply with demand
as any increase in supply will increase the stock build.
Link: http://tonto.eia.doe.gov/dnav/pet/hist/mgirius2m.htm
Monthly oil refinery input
Link: http://tonto.eia.doe.gov/dnav/pet/hist/mttstus1m.htm
Monthly crude oil and petroleum product stocks
3. EIA world supply and demand statistics:
http://www.eia.doe.gov/emeu/steo/pub/3tab.html
2006
Q2 demand: 83.5
Q3 demand: 84.7
Q4 demand: 86.9
Supply:
Q2 84.2
Q3 85.2
Q4 84.7
Both Q2 and Q3 have more supply than demand according to EIA link above. Q4 is when oil prices drop and OPEC instituted cuts. In Q4, we got stock draws, but not in Q2 and Q3 where stocks increase. Also, Q4 stock draws did not support prices at all as prices decrease.
Those are statistics supporting the lack of demand.
Here is Saudi officials talking about this situation in 2006 when they
started cutting production.
Wall Street Journal:
http://online.wsj.com/PA2VJBNA4R/article/SB114947042044271151-search.htm...
If you don't have access to WSJ, here is a public one:
http://www.postcarbon.org/node/3811/view
Actually I think the whole demand argument is probably false.
See my above post. Since industrial use can accept a huge amount of oil or NG for production. I don't think their is any real limit on demand. Only in the case of very low NG prices and very low oil prices are you going to get a situation where demand is saturated and of course you have to ignore growth.
Add in growth and its probably impossible for us to pump oil faster than demand can use it.
Demand is a function of price.
If Saudi Arabia continue to flood the market despite refineries operating at maximum levels, they will trigger a price collapse. They started throttling back production when they started seeing a large build. They had come out and said if buyers are willing to pay a high price, they will let them stock them in storage. Buyers stopped buying and started demanding lower prices, despite NYMEX posting record prices. I don't have proof of this, but only interviews. You can see that supplies are above demand due to increase stocks and refineries were operating near peak. You will also see prices start dropping and despite Saudi cutbacks, prices continue to fall. You also hear that Saudi Arabia is charging too much for their lower grade oil throughout Q3 and Q4.
The main point of my original post is not so much demand, but that Saudi Arabia claims to be a swing producer, so when they are reducing supply, then we need to see if there are new supplies from others filling in. If not, then that means they are not supplying demand, but are no longer swing producer. Since supplies are plentiful, this means they are acting as swing producer.
But from historical data thats never happened. Even when oil hit 10bbl. The whole argument is suspect. Oil went to 10bbl and we kept using it. At 10 they finally got unhappy not that the market could not take any more oil. I see no proof that the markets have ever been oversupplied once in history much less at todays prices.
Show me one case where the world oil market simply rejected oil because it was over supplied.
What are you talking about?
There are several instances in history where people refused to buy oil because it was too expensive.
They could get it for cheaper else where.
That is the problem Saudi have ran into. They are selling oil above the market price. They had no problems doing this in 2004 and 2005. They were able to institute a program of decreasing the crack spread between heavy, mid and light grade. The spread increased again in 2006.
If Stuart is going to use price as part of his argument, he needs to understand what is the demand picture. His argument is fill with holes as far as Saudi should have produce more oil during June of 2006.
You don't see it, do you? KSA didn't produce more in June 2006 because they could not. Think about that.
Ghawar Is Dying
The greatest shortcoming of the human race is our inability to understand the exponential function. - Dr. Albert Bartlett
GreyZone,
I can bet you $1000 that Saudi Arabia could produce more.
The point is not whether they can produce more, but whether they can sustain their production. They can easily boost oil production at the cost of future production and extra water to handle.
Well maybe.
I'm just saying the concept of the market ever being oversupplied with oil makes not sense its never been oversupplied. At times the glut of oil on the market dropped the price down to $10 a barrel but every drop of oil pumped was bought even at that price point.
Demand exists for oil at any price point. If the price drops more willing buyers exist. At no point in history have we ever had the case that no one was willing to buy oil.
Real "oversupply" would have resulted in a much more dramatic drop in price down to say $30 as it simply takes time to purchase all the oil supply and demand are not in perfect balance and it takes time for demand to rebound.
At best you could say that $60+ caused enough demand destruction that you got a temporary mini-glut leading to lower prices which allowed formerly shut out buyers to buy oil.
I would say that $60+ oil simply hurt the world economy more that KSA had anticipated. At best it was a very temporary imbalance in the market that would have worked out quickly as buyers re-entered the market. A decline down to $30 or lower would have indicated that the price was low enough to increase demand from willing buyers.
The problem is oil demand is for all practical purposes infinite but the supply/demand is not in perfect balance esp at high prices where real demand destruction i.e people leave the market since they cannot afford to buy oil is happening.
To use another example in the US housing prices got so high that everyone was "priced out" of the market and demand collapsed and prices collapsed. The recent mini-glut is simply a symptom of a collapsing market because the prices are too high not that the market is oversupplied.
We will see the same or worse variation in prices post peak and it has nothing to do with supply and everything to do with collapsing demand or demand destruction.
So the KSA response of oops we accidentally cause a minor collapse in the market lets cut supplies does not make sense. In a expensive market with demand destruction the price will rise and collapse.
memmel,
You are using supply and demand to mean something totally different than how it is being used. Balancing supply and demand means you are providing supplies at a given price where all your supplies are sold to buyers at the highest possible price.
If you got more demand, then you raise the price or increase the supply.
Saudi Arabia is very clear on how they balance supply and demand. They set a price and they will deliver as much supply as there is demand. That is their role as swing producers. They often adjust this price based on their own models that I do not know.
What I do know is that Saudi Arabia made sure there were more oil on the market than refineries were able to process. Allowing speculators to buy oil and hold in storage. The amount of oil held in storage increase in Q2 and Q3 2006. This is the same time that Saudi production started declining. Saudi officials spoke in June 2006 saying they are having problems finding more buyers, so they are reducing production. We see production drop and increase in price. Stuart and many of you here are harping on this phenomenon to say that Saudi Arabia could sell more oil, which is not the case at all. Refineries were already operating near max. New oil production supplies were being shipped to refiners and storage facilities during this time. Saudi Arabia had to cut back and lose market share or else they will need to sell their oil at a lower price.
I have shown evidence of world oil production exceeding refinery input for Q2 and Q3 2006. I have also shown evidence of increase oil supply in the market despite Saudi cuts in Q2 and Q3. This means Saudi Arabia is reducing supplies as other oil producers are increasing production. They have not cut production and force refiners to go to storage, until prices start dropping a lot.
I have shown evidence of world oil production exceeding refinery input for Q2 and Q3 2006.
You've claimed alot of things, you haven't SHOWN anything. Give us links. Give us some data. Show us who said what where. That's how this works.
Then what happened to this additional supply ?
They were cutting and the markets continued to be well supplied and storage was full and prices were dropping.
And cutting slowly I might add instead of taking a large amount off line like they did in the past as they acted as a swing producer. Then at some point Q4 after a small additional cut all of a sudden supply is inadequate and prices go up.
The cut in Q4 from reading the graph the cut was 500 kb a day we lose this much routinely from Nigeria and thats high quality oil. Not to mention it was gradual.
Your argument is the market were well supplied prices where going down and everyone was happy so KSA started cutting and for some reason decided to do it very gradually and suddenly in one quarter after a small cut the market went from well supplied to under supplied and prices started increasing and
no one can make up for this 500kbd cut ?
This means at best our well supplied market had between 500kbd-1mpd of excess ?
I agree Memmel.
10 guys standing around wanting to buy oil, Three only have $30 bucks in their pockets(Africa, etc), others have much more.
Oil goes to $40 a barrel, three say "I'm out", the other 7 say, I'll take mine and I'll take one of their's too (who ain't buying anymore)...
The buying of the barrels who would have gone to the ones priced out allows for the big money guys to continue to have increase in demand(being supplied by those who cannot buy at each price band). Until, it don't work no more.
The up and down of supply buffer(shocks) is like the slack in a freight train between cars. If the train touches the brakes a series of times, Cars will take up the slack(bump into one another), Engineer lets off the brakes, the slack is taken back up. Jerky motion. A lot of noise as cars slam into one another and then get yanked again.
A freight train is elastic only to the level of the slack between each individual cars. After you stretch it out (or compress it tight), there is no more elasticity.
If you are on one of the cars all you know is that you are slammed one direction and then the other. Within a speed band(ie price band).
My low tech way of explaining it.
With the price thing you also have alot of games being played like Goldman did with their gasolene index back last fall. A ton of futures contracts dropped on the market all at once as everyone realigned with the Goldman index percents.
If you have a few billions dollars to play with(those amounts are just noise in our budget), you probably could make the market do some crazy things in the short term.
The train is slowing down alright. Alot of people have dropped out(priced out) of the market at these levels. Fewer and fewer countries will be able to keep ante'ing up for each pot. At some point we will get a state change/Phase Shift all at once when the current model(mode of operendi) collapses to a new/different stable
organizational structure.
John
But demand is not equivalent to the level of supplies.
Even if the world was well-supplied with oil in the Summer of 2006, the price was rising, which means that demand for oil was increasing at a greater pace than supply. It may have been speculative demand or fear-based demand, but it was demand nonetheless.
If SA (as the swing producer) had wanted to defend a lower price range, then they would have produced more. Then as it became clear that the world was now over-supplied, the price would have dropped.
But that's not what happened. According to the work done on TOD, their production started falling before the price collapsed. There are only two conclusions that can be drawn. Either (a) they lost interest in defending the lower price band, or (b) they could not maintain production. Unfortunately we can't say for certain which it was at this point.
You are assuming Saudi Arabia is willing to sell oil below market price. On the contrary, since 2004, they have instituted pricing scheme, so that their oil are priced above market price.
If you take that into consideration, Saudi Arabia became supplier of last resort. You only buy from them if you cannot buy from else where. In 2004 and 2005, Saudi officials claim they have maxed out production for grades of oil requested by buyers. In 2006, they stated they ran into a situation where buyers are bargaining for a lower price. They refused to lower price, so we see them produce less.
We don't have to look at just price. We can look at refineries. Their oil input has maintain the same, even when Saudi Arabia cut production. This means they are still getting their oil. The buyers have no reason to go to Saudi Arabia if others are selling it for less.
This is what happen in June 2006.
That is the evidence that I show. No one here has shown contrary evidence.
I want to add that the stock draws did not happen until Q4.
In Q2 and Q3, when Saudi started cutting production, refiners did not have to go to storage. They were able to get oil from else where. Only after OPEC cuts began, did we see significant stock draws. By then, the reductions did nothing to control prices. Prices were simply not indicative of supply and demand, but speculators.
Using anecdotal evidence, in 2006, Alaska oil was cut off for a period. Oil dealers were lining up to sell their oil to any buyer. These speculators have oil tankers filled with oil with no specific destination. This is further evidence that there are more oil than refineries can handle.
This is not correct:
Prices are always indicative of supply and demand. Speculative demand IS demand.
Nope, it is not indicative of demand due to Saudi buyers have to take real oil. They are often refiners.
My argument hinges on refinery operations and not prices.
You are so full of it. You haven't a clue and have provided NO ZERO ZIP supporting evidence for any of your outragous pronouncments.
If oil dealers were lining up to sell their oil to any buyer, why wasn't the stuff $10/barrel or less?
I believe your argument hinges on this:
It seems you are saying that the "effective" price for SA's oil fell before the index prices did, thereby indicating that they did indeed cut in response to a price drop.
Unfortunately I don't have the expertise to evaluate this claim. Is there anyone else who can respond?
That is not my point.
My main point is that Saudi Arabia claims to be swing producers, so they must forfeit market share when new oil supplies from other producers are brought online as the world do not need more oil based on world's oil refineries were operating near full.
If there were oil refineries who wanted more oil and could not get more oil, then Saudi Arabia could not claim they are cutting production due to lack of demand. In Q2 2006, we saw no such evidence. All evidence points to oil refineries had too much oil and oil storage facilities kept reporting increase oil stock. This is true for US oil refineries and oil storage and also for IEA world survey. I linked to IEA world refinery survey and also EIA surveys.
If there is evidence that there are buyers or oil refineries who wanted more oil from any source while Saudi is cutting production during April through July, then it is definite that Saudi claims of no buyers are wrong. I have seen no evidence of that. The more I investigate the more clear it is that Saudi claims are being verified.
nth - I've not read all your comments but is seems that the general gist of what you are saying is broadly aligned with my view - which of course is the correct view - there is little certainty and there are different ways to interpret the extant data.
Especially since everyone is currently filling their SPR and building more storage tanks as fast as they can. Sounds to me like everyone is aware it is running out and trying to grab as much as they can. We may be limited by transport, but that does not mean it's not almost gone.
There is no oil tanker shortage at the moment.
There is no shipyard shortage either.
There is oil shortage at the moment as OPEC is claiming we don't need that much oil. To me, OPEC just wants a higher price. They already have stated that they don't have spare capacity in 2005, which makes sense why OPEC does not want to sell oil for less money than high $60's.
Then why is the price not $20-30 a barrel if their is plenty of oil. 50+ is a high price for oil above historical norms.
How can you have both a well supplied market and high prices.
And if their is plenty of oil how can OPEC fairly small cut have a big influence on prices since plenty of supply exists and no one is buying oil. The price should have continued to fall until it was back at least into historical range.
Does not compute.
What does make sense is that the market is very very tight and a relatively small supply/demand imbalance resulted in a fairly small drop from recent highs and KSA knows that can command any price they want because no one else can supply the oil. It does not matter if they are dropping on purpose or not we don't have enough oil. Price variations over a few months are not indicative of a overall well supplied market.
I have a post on this line of argument in the works.
I wish you had answered my email. Then, I would not have to post this here and discuss it now.
I will wait for your post to continue this discussion.
I don't want to sound like Dave, but I also have talked to experts. Are you guys claiming you can figure out the URR of North Ain Dar by those SPE papers?
They find those papers lacking in information that one would use to really evaluate production numbers or URR. I am no expert, but it seems like you need to know more information than what have been provided by those SPE papers to jump to your conclusions.
Are you simply guessing and forecasting based on available data or are you stating you got enough evidence to claim your conclusions are true? If it is the former, then my experts have no comments, but if it is latter, they want to know what numbers are you projecting for production or URR based on those public info. They are wondering if you have stumbled upon something that everyone missed.
Again, you are arguing "my unnamed experts say". You must refute the argument directly or your statements are meaningless.
Cid, maybe you need to re-read his post. He claimed that he conferred with experts, and that both he and they are unclear on the position held by you and some others. He then proceeded to ask questions.
Which statements that he made were meaningless and why? it seems as though you are claiming that simply b/c he wrote the word "experts" you have decided that you now deem everything he types meaningless until he directly refutes your arguments.
I am not sure how a reasoned debate can proceed if you are unwilling to answer questions or clarify positions until he has directly refuted your position to your satisfaction.
-Patrick
He is trying to divert the argument by claiming that other people's positions are not clear. In fact, the position of SS, FF, et all is painfully clear: based upon some inferences from these papers, the oil field in question should be toast or at least very close to it. They are not saying anything about URR. In fact, I think nth is the first poster to mention it.
And he is invoking authority with nothing to back it up.
International Petroleum Monthly, with January 2007 data, from EIA Washington has now been released, sometime after 12:00 Noon EDT today.
Front Page: http://www.eia.doe.gov/ipm/
Tables: http://www.eia.doe.gov/ipm/supply.html
Gregor
Hello TODers,
Great discussion! But I suggest everyone remain calm and composed. Because the data does not have the 'audited transparency' as suggested by Matthew Simmons: we are now reduced to speculation within a narrow error bar range. This data imprecision has now reached the point whereby the pro & con PO arguments are similar to mathematicians contending whether 2 x 6, or 3 x 4, is the better method to reach 12.
I would assume that equally contentious factions within CERA, DOE, IEA, EIA, USGS, XOM, BP, etc, are debating much of the same material as we do here on TOD. Hopefully, reservoir engineers and production specialists from these entities will chime in on TOD. CIA/NSA, MI-6, KGB, etc, may have the true scoop on OPEC & KSA production history-- we won't know unless someone from these Orgs speaks up here on TOD--I hope they will do so in whatever method they can.
Full credit to the TODer [I forgot whom], who a few months ago, suggested that maybe the best use of our time was to organize protests outside OPEC HQ and the KSA Embassies to get them to have full and transparent audits. Otherwise, absent new and revealing data: is 2 x 6 better than 3 x 4? Or vice versa?
Can TOD get press credentials so we could send a TopTODer to ask the really necessary technical questions of OPEC & KSA officials at their press conferences? Or could we get a journalist with these press privileges up to speed to ask the required probing questions?
In the interim period: Please continue the debate.... I am fascinated by the postings of the SS & F_F faction, and I hope the Euan & Dave Cohen faction can find more data and bring in more experts to technically argue reservoir watercuts and depletion too. IMO, TOD just keeps getting better and better.....
Bob Shaw in Phx,Az Are Humans Smarter than Yeast?
Good post-
My only objectives are to
1. Use my knowledge to aid in the interpretation of the published data and
2. Most importantly, get more data published.
Fractional_Flow,
If the field is water out, then Saudi should be expanding their GOSPs like crazy and optimizing them to handle higher water cuts. Why are they still configured to treat water cuts in the 30-40% level and not calling for bids to expand water handling capabilities?
Are you telling me you expect these fields to have low water cuts or else they need to be shut?
From their anecdotal evidence, this is not the case. They are seeing wells with high water cut and stay high for awhile. It is not just low water cut or no production.
There is circumstantial evidence this is changing. First, there was an article by a company that specializes in water separation over a year ago that they had done extensive work for KSA. Then recently here on TOD someone asked about a particular professor who just left a newly tenured post to go to KSA. He is an expert on that topic.
You are looking at old historical data and trying to infer that things have not changed. They are changing right now which is why finding the trend in the data is hard - there is not much data out there. But what data there is suggests that KSA may be in terminal decline.
Ghawar Is Dying
The greatest shortcoming of the human race is our inability to understand the exponential function. - Dr. Albert Bartlett
They are a little slow then.
I am looking at their projects. When they have a new project, they will call for bids. The lack of bids is my main concern.
As for the configurations or analyzing the problem, then you are correct that my info will be dated.
On a side note, I don't know why there is no "w" in GOSP. Water is a big problem, especially water emulsion.
My understanding is that the Khurais project includes additional water injection for Ghawar also (though I can't find where I read that just at the moment).
This is not my area of expertise, but I just finished a paper on how water will be the limiting factor on many of the energy technologies presumed to replace oil and gas (primarily bio-energy from electricity and biodiesel).
Is there potentially a water limitation in Saudi Arabia, even if its seawater - if they expand dramatically can the system handle that much water on all sorts of wells at once?
I have no idea, (which of course is why Im asking)
.
Wel I really disagree with that. This single punctuation mark post implies supreme knowledge and that the discussion is ended.
The only appropiate single punctaution mark posts should either be a:
,
implying that the converstaion may be continued or the:
?
implying that no one has a clue what they are talking about - well almost no one.
I'm not sure if you are joking or not.
The period is there cause he redacted his post. The forum won't let you post an empty post so people usually just put a . in the box.
Dang, I just changed my mind about making a comment. Who would have though a lone period could say so much.
Its moving baby, its dancing, its floating on.
Things are rolling.
I lllllike it.
Why does everyone gloss over what the people who know are telling us?
KSA- our mature fields are dropping at 12% ( Most all they have are mature fields)
Baktiari- By 2020 world prodution will be 55MMBPD
FF- KSA, when they do peak, will fall off a cliff
West Texas Export Land Model- 50%drop in 5 yrs.
This alone should scare the bejesus outta everyone here.
Instead of arguing whether we are declining today we should step back and look at 5 yrs from now and see how we will cope. I daresay that we won't since no one in power is taking any action on this. We truly will hit a brick wall at full speed.
Yes, but we are seeing the brick wall a lot closer than we thought it was. There is no one arguing about whether it is declining. The argument is whether it's gone. Read the comments in the Ain Dar post yesterday.
There is a way to get a credential,.. perhaps. One directly as a reporter for the Oil drum. perhaps, All credentials are "accepted" or rejected. A credential does not guarantee entry to anything. Depends on the city and state regs also. A person can ask probing questions all day long, and will not be directly answered unless its positive. All negative required responses will be parsed in a variety of ways, as to not reveal the negative response.
AS for alphabet help, don't count on it. remember someone called "P lame" Worked under the sheets for an energy firm. Two things rumored to be the concept. Weapons, and oil numbers of what you asked above. See what happened. and timing is everything. network caputski.
Quid Clarius Astris
Ubi Bene ibi patria
Nice post, Bob :) Having someone ask Qs officially would be extremely interesting... assuming they got some answers.
"You can never solve a problem on the level on which it was created."
Albert Einstein
Indy
Thank you Stuart and Fractional Flow for an excellent post.
I should like to remind one and all that only 2 people
correctly predicted the 2000-2002 recession. Campbell and
Laherre in their 97 Scientific American paper. An economist \
at Argonne National Labs likewise predicted it, but in 99.
His work was quickly suppressed.
The giants are 60 years old. Gawahr, Kashagan, Cantarell. All in decline....
North Sea, North America, Middle East, China, Oceania, South A
America... all in decline.
Still those in denial persist.
I would like to mention that denial is the first phase of dealing with a crisis. Unfortunately, here, it keeps decision makers from doing rational things.
Let's consider North America for instance. A country there has spent 2 trillion USD in the past 6 years, which is enough money to build 6 x 10`11 watts of PV. Given ~ 75X10`6 households, that is 8 x 10`4 watts or 80Kw of PV on every house. But this country has spent this money stealing oil from other countries, and abrogating its citizen's constitutional rights.
Here in Africa, leaders have been seduced by the likes of CERA... into doing NOTHING.... when they must do something..
Namibia exports 8% of the world's uranium. That costs a PJ
of electricity to process. Up to now, NAMpower has been selling power to this mine for 25% of its cost. When I showed this to the PM he said so? I replied... Can you tell me why a country with 40% unemployment is subsidizing the wealthiest nations on earth? "We are?" he replied... Yes.. to the tune of N$75 x 10 8 dollars or 1,000,000,000 USD
That is what CERA does... BAU... steal from the poor and give to the rich...
But friends... the poor have had it... Nigeria is a tinderbox. My Nigerian colleagues are adamant that things must and will change there.
So, my admonition to one and all is "Be Prepared for you live in interesting times" And if any one has billions of oil to sell from an aging field using advanced technology, I'll trade it for a certain bridge in Brooklyn, I just happen to own...
Cheers!
Indy
Minor quibble - there were hundreds of people (at least) in positions of credibility that predicted the recession of 2000-2002 (I ran a hedge fund then and remember it vividly)
Of course, economists have predicted 7 of the last 5 recessions.
This is a repost from yesterday night to get more eyeballs:
Though I have been reading this website for few months now this is my first post. Hats off to everybody for valuable discussions and specifically to Stuart Staniford for the posts with profound clarity and depth.
Today in financialsense website there is this article about the US oil situation in general.
http://www.financialsense.com/Market/wrapup.htm
This totally surprised with various charts showing profound decline in recent US oil imports.
Any thoughts...?
The above link is now broken.
Here is the permanant link
http://www.financialsense.com/Market/cpuplava/2007/0404.html
If they were pumping Iraqi Oil through the IPSA pipeline and laundering it through Saudi Arabia, maybe our cut was being delivered on the sly as well. Although I don't know why Bush and Co. wouldn't take their cut in cash after sales through SA. After all, if they stole it, they could just pocket it.
FRACTIONAL FLOW IN NORTH AIN DAR
Rather than try to respond to a number of individual posts up the thread I am now going to post a few charts and comments and invite response from The Oil Drum experts.
This series of cartoons is from SPE 93439, Figures 7 and 8. There follows a description of what I believe these cartoons mean based on consultation with a real expert, which as Dave points outs seems to be a pretty sensible thing to do.
A3, A4 and A5 are wells in N 'Ain Dar. Blue = water and green = oil. Four different time series are shown and these time series vary from well to well.
The cartoons are constructed from data that measure the proportion of oil and water flowing at various points in vertical wells. The cartoon at the top (Figure 7) shows how to recognise the position of the mobile oil water contact (OWC) or flood front.
Lest just look at well A5.
In 1992 the well was producing just dry oil.
By 1994, the flood front had reached the base of the well which started to produce water.
In 1998, the mobile OWC was moving up the well section - note how the the zone below the mobile OWC produces just water. Above the mobile OWC dry oil is produced and the water cut stays constant. The amount of oil increases because as you go up through the well more and more oil producing perforations come into play.
By 2004 the well is almost watered out as the flood front has passed through.
So from this is seems that we have a very well defined mobile OWC - 100% water is produced below it and dry oil is produced above it. This is consistant with the excellent reservoir quality of North 'Ain Dar. The oil essentaiily floats "on top of the water".
All the water management stratgey described in this paper is aimed at reducing the volume of water produced in these old vertical wells as they water out - as the GOSPs have limited water handiling capacity, producing too much water reduces the capacity to produce oil.
I know that I said the oil floats on the water, but what everyone needs to get their head around here is that the watering out process is in fact dominated by lateral flow of water through a very thin reservoir spread over a vast area.
I've not been following what FF has been saying in recent weeks, but would be interested in his views on this appraisal of these cartoons.
Euan-
You have enlightened me to a problem I cannot reconcile.
I assumed that the 4.6 ft/day front velocity in that paper was perpendicular to the structural axis. If so, it is easy to calculate the advance of water up the structure at that velocity using the dip. It is about 80 feet per year at the most.
However, this does not agree with the rate of upward water front velocity I see in the above. The rate of upward movement above is much lower on the order of 30-40 feet per year at a maximum.
The front velocity according to Aramco has been relatively constant since 1992. I am trying to theorize if this has some dependence on well location but I really don't believe so. This wells could be in an area of extremely low dip (nose) and perhaps that would explain it. But upward movement is upward movement and we are averaging everything.
Could that 4.6 ft/day be a North South advance velocity??
You're really giving me some meat to chew on and I thank you.
Hello F_F, & Euan,
I hope this just released abstract helps your calcs: two key sentences in quotes directly below:
"The realistic petrophysical characterization of these kinds of reservoirs is not an easy task and must include the study of directional variations of permeability. Such variation can be incorporated into engineering calculations as the square root of the ratio of horizontal to vertical permeability, a parameter known as the anisotropy ratio."
http://www.blackwell-synergy.com/doi/abs/10.1111/j.1747-5457.2007.00147.x
--------------------------
Journal of Petroleum Geology
Volume 30 Issue 2 Page 147 - April 2007
To cite this article: A. Sahin, A. Z. Ali, S. Saner, H. Menouar (2007)
PERMEABILITY ANISOTROPY DISTRIBUTIONS IN AN UPPER JURASSIC CARBONATE RESERVOIR, EASTERN SAUDI ARABIA
Journal of Petroleum Geology 30 (2), 147–158.
doi:10.1111/j.1747-5457.2007.00147.x
Most classical reservoir engineering concepts are based on homogeneous reservoirs despite the fact that homogeneous reservoirs are the exception rather than the rule. This is especially true of carbonate reservoirs in the Middle East which are known to be highly heterogeneous. The realistic petrophysical characterization of these kinds of reservoirs is not an easy task and must include the study of directional variations of permeability. Such variation can be incorporated into engineering calculations as the square root of the ratio of horizontal to vertical permeability, a parameter known as the anisotropy ratio.
This paper addresses the distribution of anisotropy ratio values in an Upper Jurassic carbonate reservoir in the Eastern Province of Saudi Arabia. Based on whole core data from a number of vertical wells, statistical distributions of horizontal and vertical permeability measurements as well as anisotropy ratios were determined. The distributions of both permeability measurements and anisotropy ratios have similar patterns characterized by considerable positive skewness. The coefficients of variation for these distributions are relatively high, indicating their very heterogeneous nature.
Comparison of plots of anisotropy ratios against depth for the wells and the corresponding core permeability values indicate that reservoir intervals with lower vertical permeability yield consistently higher ratios with considerable fluctuations. These intervals are represented by lower porosity mud-rich and/or mud-rich/granular facies. Granular facies, on the other hand, yielded considerably lower ratios without significant fluctuations.
-------------------------------------------------
Also, I found an ARAMCO Ghawar oil saturation plot[see figure 3 3-dimensional map]:
http://www.appro.com/company/0706_Appro_Eprint_A.pdf
[EDIT-My untrained read: Ghawar is watering out from North to South, High permability/porosity to low permability/porosity, with possibly bypassed, isolated pockets in the deeper, lower areas that have low permeability/porosity.]
----------------------------------------------
In the case of managing the world’s largest asset, the Ghawar Oil Field, Saudi Aramco runs its POWERS simulator on a massively parallel HPC. As of 2004, this 128-node Pentium IV®-based machine had run full field simulations with between 10 million and 100 million cells and more than 4,000 wells, with larger runs pending.
These simulations are run with multicomponent hydrocarbon
models, waterflooding with varying brine chemistries, and
dual-perm response to match fracture-flow history. Some runs
include CO2 floods.
This capability not only allows Saudi Aramco to run fairly
large models with minimal or no scale up, but also to execute history matches extremely rapidly (in some cases, in hours to days). Saudi Aramco has used this capability for infill drilling, water cut management, breakthrough prediction and other basic reservoir engineering choices (Figure 3).
-----------------------------------
Hope this helps.
Bob Shaw in Phx,Az Are Humans Smarter than Yeast?
Hello TODers,
Please see the Ghawar Oil Saturation Graph linked above--I don't know how to post a visual. Since it is a PDF file, you can use the zoom magnifying glass to expand AinDar, Shegdum, and the other fields of Ghawar! Do these areas match the slice charts that TODers SS, F_F, Euan, and others have been discussing? Does it appear as F_F suggests that the waterfront is not only rising into the ever smaller crest areas, but is flooding in a southern direction too--the intrafield pressure communication means pumping water into North Aindar/Shegdum affects fields far south? I hope the experts can use this chart.
Note to SuperGoose: yesterday afternoon and evening, it took forever to download TOD--lots of visitors, or was the server choking on something else? Anybody else have problems?
Off to bed!
Bob Shaw in Phx,Az Are Humans Smarter than Yeast?
Bob, I tried to cross compare, but the plot give has no data on depth of dry oil, just what appears to be the top surface. Thus you can't really tell if there is only a thin shell of oil associated with the blue area or not.
I also found this paper on modelling of Ghawar, and in particular the northern part of Uthmaniyah. Look to fig 5 in particular. This is change in Sw, 1953 to 2032. Its a much more complex picture, but fig 6 at 2003-4 suggests quite a volume of dry oil left at Uthmaniyah.
Hello Garyp,
Thxs for responding. I couldn't sleep! If you pop windows back and forth from my chart to your chart, which SS has now moved to the threadtop:
1. Looks like Fazran is basically kaput.
2. Abqaiq's dry oil crest is very small and thin.
3. Uthmaniyah's crest looks watered over, but still oil in the middle of the field downcrest. Higer water cut?
4. South Ain Dar and Shegdum, if we could find waterfront slices similar to the North Ain Dar slices, are probably just as dry oil thin crested as North Ain Dar.
If this oil saturation chart is a true representation of Ghawar in 2004--> what would it look like now [3 years later], how many more billions of barrels have been pumped from which fields to make an updated oil saturation chart?
I will leave that up to the experts. My head hurts.
Bob Shaw in Phx,Az Are Humans Smarter than Yeast?
The more I dig into this, the more I think its the difference between "Ghawar reserves are xx% depleted" and "Ghawar's good stuff reserves are yy% depleted".
I think that if you take Uthmaniyah and south - the reserves hold up to high numbers, but with big problems about the rate you can get them out of the ground, the water cut and water you have to pump in (eg Haradh III), and the general heavy and sourness of them.
If you focus on the northern fields you get a very different picture. The remaining reserves are small, and the fields are sustaining on a thin sliver of dry oil.
Thus SA can state "we have xxGb of oil in Ghawar", but not mention the variation in depletion across the entire field. Upshot is, Ghawar production CAN drop off a cliff as Ain Dar, Shedgum, etc. water out, with a plateau at a lower production level as the southern fields continue to produce. Since Ain Dar and Shedgum together account for about 2Mbpd - that's the amount that could disappear relatively quickly. Plus, of course, this is the good stuff!
If Uthmaniyah North is anywhere near the same situation, you could make that 4Mbpd disappearing. Excepting that simulation, I can't really find much good info on this area.
One thing is for certain, the next few years will tell the truth of it.
Hello GaryP,
Your Quote: "Upshot is, Ghawar production CAN drop off a cliff as Ain Dar, Shedgum, etc. water out, with a plateau at a lower production level as the southern fields continue to produce. Since Ain Dar and Shedgum together account for about 2Mbpd - that's the amount that could disappear relatively quickly. Plus, of course, this is the good stuff!"
Heinberg's insider and ASPO's Nemesis said long ago that 2Mbpd of Ghawar's extraction was already toast.
EDIT: what was the capacity of the Iraq to KSA IPSA-1 pipeline again?
Bob Shaw in Phx,Az Are Humans Smarter than Yeast?
1.65 Mbpd... Provocatively convenient, eh?
totoneila...you speak of "Heinberg's insider"...I started thinking ever since F_F showed up if he could have been his "Deep Throat".
Food for thought.
Try the Shell Website:
Load the film.
Cool , funky dutch geologist saves the world, after getting an idea from his cynical teenage son.
But he does say this to his very good looking Actress / Model / Whatever / fast track graduate while in the helicopter over a tropical delta: He looks deep in to her beautiful eyes and says:
'' The easy oil is over...''.
At this stage I was hoping he would say ''Im Dutch , weird niet? I love Gooold... ''
Was also out an advert on the telly tonight.
All these adverts from Total, BP and now Shell.
All saying the easy oil is over.
You would think they are trying to say something?
http://www.shell.com/home/Framework?siteId=home
Looks like we are ok though. Cool funky Dutch Geologist sorts it out for us.
'Cept the technology has been around for a few years now. (yawn)
Thanks to all of the very high quality contributions on this post. I now know more about Ain Dar than I ever really wanted to.
Still think its becoming an argument about Angels and pin heads though.
Wherever you put the X- sections, it looks pretty grim and 40 more years of Yerginomics looks like wishfull thinking.
F_F,
Are you implicitly assuming that the vertical well fully penetrates the resevoir rock? If it was a partially penetrating vertical well, then the vertical advance rate you see on the figures above could be reconciled with your 80 ft/year vertical advance. I'm not clear on why one would install a partially-penetrating well, however, unless it was to reduce initial coning.
Sorry Euan but I don't think this is correct. Blue = water to oil ratio greater than 50%. Green = water to oil ratio less than 50%. Or at least that's the way I understood it.
The water-oil contact is just not that sharp. There is mixing as the color profiles clearly show.
Ron Patterson
Ron, I don't think so. What is says is blue = water cumulative contribution and green = oil cumulative contribution.
The horizontal axis agrees with Ron.
Well I'm sure Ron will be fair chuffed that something agrees with him.
Please explain in detail what well A5 1998 shows following Ron's metrics - Ron you should have a go at this too!
You gotta remember this is a 700 mD, mixed wetability (probably tending oil wet) reservoir system.
Nah, I'm going to bed.
Ron
to be honest, is dont know what they show. my assumption is that they are showing an IDEALIZED flow profile.
in each case the oil contribution below the interpreted o/w contact is zero. that seems a little suspect but i grant it is possible .
except for possibly the very right hand profile for a5 there is zero water contribution above the interpreted o/w contact. that seems more than a little suspect (from my experience) , in fact i flat dont believe it and i conclude these diagrams are idealized.
Euan, some notes:
1. The right legend indicates that the light blue is 0.600 (or 60%?) or greater water saturation. All of the blues are higher than that.
2. The greens, reds, and yellows are all variable values, color coded as well.
4. The purples are nearly pure oil, in the 4% to 8% water cut range.
5. The label at the top seems to indicate that this is a 2004 snapshot.
6. What are the units of the X axis and Y axis? Feet no longer makes sense since I quickly posted last night. What units make sense here?
This is a fascinating snapshot and seems to support your contention that the others are from the flanks. But I suppose the key question then becomes what is the speed of the advance of the waterfront? If the flood front advances fast enough, several feet per day, then what happens? Yibal style collapse? Given that Ghawar has been pumping for over half a century, that makes sense. But it also appears to indicate that a Yibal style collapse is going to be the fate? They've done an excellent job of extracting as much oil as possible from this field but if the water front advances at a near constant rate then isn't a cliff-like collapse likely?
Ghawar Is Dying
The greatest shortcoming of the human race is our inability to understand the exponential function. - Dr. Albert Bartlett
This chart is from Shedgum, published in IPTC 10395, in Nov 2005 - so the data are possibly 2004 vintage or before.
The key points:
Green / blue = water flooded. Red / purple = dry oil.
No prizes for working out where the mobile oil water contact (OWC) / flood front is located. Note the yellow / orange colours in the vicinity of the mobile OWC - this I believe is the zone of intermediate saturation where fractional flow comes into play but to all purposes this can be viewed as a line in the reservoir model.
What we don't know is how far the zone of dry oil (red and purple) extends off the edge of the diagram. It could be a few / several kms!
Recalling the satuartion charts for N 'Ain Dar, they were showing a segment analagous to the right half of this chart - where the reservoir is water swept. What we don't know on 'Ain Dar is how many kilometers (lateral) of unswept resrvoir lie up dip from the 'Ain Dar sections.
I can only imagine that like 'Ain Dar, Shedgum will produce dry oil above the mobile OWC and 100% water below it.
When horizontal wells on the three crests of North 'Ain dar, South 'Ain Dar and Shedgum water out production will likely go out like a light - doomers start salivating.
However, as far as can be gathered form these papers, these horizontal wells in crestal positions have not yet been drilled. Further more, the crests will likely water out one at a time - no crash, but progressive decline.
GHAWAR IS DYING - and the death process started around 1950.
Euan-
Thanks for that.
Those series of dots in the NW corner are how my simulator displays a horizontal well.
In complete fairness we do not know how far it goes East Either.
I do not see an injection well in that top block far east (I see a producer halfway between the right edge and what I feel is a horizontal). If there is an injector there it is not completed in the top layer.
The structure appears to be rolling over to the west, yes or no?? But that crest is wide.
Keep it comin.
If FF get's Euan on the bandwagon you know TSHHTF. I cannot say how pleased I am to see Euan working with FF. Whatever comes of this it will represent RESOLUTION. Either FF will declare we have time left or Euan will say time is short. If there remains disagreement, the point of disagreement will be DEFINED.
I would have to agree with you on this point. I used to say that when Robert Rapier admitted peak was now, I would be 100% convinced. He is gone, but Euan is a more geologically knowledgable replacement of my most conservative "error bar" in when to pin the peak time frame. WT is the most liberal (we are past peak group).
If Stuart, FF, and Euan all come to an agreement here, it will be a historic event, worthy of trumpets held up high (you listening Tom Whipple???)
Stuart is doing a lot of work here. Thanks to all three of you. I also want this debate to continue to a data filled conclusion.
First Euan, Congratulations !
My perception of risk of substantial sections of Ghawar watering out/crashing in the very near or near future are substantially altered. (Although I do not like the way the cap rock curves in the upper left, looks too much like it could be a crest). And rarely does that happen in a day from a single set of facts :-)
As someone that knew Darcy's Law, has taken two Petroleum Engineering courses @ UT and little else before joining TOD, I do have a question.
The limiting factor (as I understand it) in responsible oil production is the speed of the advance of the water front (varies somewhat within reserviors as well as dramatically between reserviors).
As the cross-section of dry oil shrinks, the area of water/oil contact shrinks (as I read the picture). If the rate of advance is constant, and the area is shrinking, this would imply reduced maximum production to me.
Also, the large yellow area is mixed oil/water, and maximum recovery dictates slow sweeping of this area AFAIK.
Yours, or anyones, thoughts ?
Alan
The scale on the right seems to indicate that red is not dry, but rather a 20% water cut.
TJ - since you like to comment on these issues, can you explain to everyone what the original water saturation was / is and how this impacts upon the interpretation of this data.
A good starting point is here:
http://www.gregcroft.com/ghawar.ivnu
Euan-
Does the text or presentation accompanying this graphic happen to say anything about illustrating the suppression of water coning with a horizontal well.
Because if you compare the area beneath the vertical and horizontal that is clearly what it is illustrating.
FF - I'm afraid I haven't a clue what you are talking about and given it is 3 am here, I'm off to bed.
What graphic? What vertical? What horizontal?
Without the actual simulation run, I can only guess. You can have my thoughts FWIW:
1. According to your link the reservoir starts at 11% water. The breakthru front is around 40%.
2. If that 460 is a scale and not a well number, then each simulation cell is 460cm. This would make the slice depth around 300ft, which seems reasonable. This tells me two things: the thin oil layer on the right is unrecoverable (it's just two small) and when the horizontal front reaches the well it will die within days. Using what I think is a conservative .3 ft/day movement, that gives that particular well shown about 1000 days left.
3. The well shown would be only about 170 ft long, which seems really short to me. But in this case maybe short is better.
4. Resting the well and getting any improvement would require shutting off the water injection upstream of the well completely and waiting for gravity to collapse the vertical front into a level interface. I have no idea how long that would take.
Back to Stuart's original posting and chart, seems that there's a bit of an "elephant in the room" here in the sense of an obvious point that no one is commenting on. That is that Saudi Arabia has frequently greatly exceeded its quota! What is the point of a "quota" if the country doesn't have to obey it?
We see it in 1996-97, then to the most extreme degree in early 2003, then again in 2004 trailing off into 2005 when the quota is increased, making the differential much less.
Now at least in the 2003 case we can point to the beginning of the Iraq war as a time when international markets were stressed and SA may have been pumping extra in order to keep things stable. I've also heard suggestions that the 2004 boost was an effort to help the Bush administration's re-election campaign by making sure that oil markets were relatively well behaved leading up to the election. That is obviously quite speculative, not to mention conspiratorial.
I don't know what happens to SA when they exceed their quota. Maybe they get a call from the Secretary of OPEC giving them a stern talking-to. Or maybe there are some financial penalties. But assuming that they do have at least some motivation to get back to quota after going over, for whatever reason, then that could explain why they started decreasing their production in mid 2005, since at that time they had been substantially over quota for a year and a half.
Nothing happens. The quota system is a wink-and-nod game intended to convey the image of control of prices to external observers. The quota system only really comes into play when oil prices drop so low that all OPEC players become concerned. You can see that in the production numbers over and over again.
Note that this observation also puts to the test nth's assertion that KSA tries to only sell as the seller of last resort. He makes this assertion even as KSA was the world's largest oil exporter, which is absurd if they are trying to be the seller of last resort unless the supply situation is so constrained that people must go to KSA. And it they must go to KSA at 9.6 mbpd, then they must go to KSA at 8.5 mbpd.
Ghawar Is Dying
The greatest shortcoming of the human race is our inability to understand the exponential function. - Dr. Albert Bartlett
Elephant in the Room?

I don't see an elephant:
(Look again)
((This just won't stand.))
Dude, that Elephant is about to sit on my Economy. Somebody git me ma ray gun! Only kidding.
"...an effort to help the Bush administration's re-election campaign by making sure that oil markets were relatively well behaved leading up to the election. That is obviously quite speculative, not to mention conspiratorial."
Please read my full reply above to Oilaholic - all I'm trying to do is get folks to consider that it MIGHT NOT be all about geology or price-driven swing-role activity. KSA has in the past engaged in pure political production surges or contractions and I've seen nothing so conclusive in the technical comments to convince me that the excessive production surge in '04 was not political, nor that the '06 contraction was not political. I'm just advising caution.
And btw... we can talk about about folks stealing 1.63 mbd of iraqi oil via KSA pipes, yet not consider that KSA might find US political continuity in '04 to be in their interests?
_______________
When Rex Tillerson speaks, bananas listen, unless they're green...
Stuart, an idea for analysis.
Can you analyze KSA and Other Opec's divergence to quotas? This might prove interesting. It might show wether or not the current drop in KSA production vs quotas is extreme or has happened before.
Good idea. Does anyone remember when VP Bush went to KSA in 1986 to jawbone the oil price UP? Seems the Saudis, rabid anti-commies that they were, over-produced so much it wrecked the oil patch... This is a tad over-simplified, but KSA has at times spent billions (in terms of lost oil revenues) for political objectives. Not too hard to imagine they've done it recently.
Stuart, Euan, Leanan, Fractional Flow et al
The discussion has been great on this important topic. Speaking for myself, I have learnt a great deal about oil production, without it ever being boring. A mere accountant, I have been way out of my depth some times but so what? The level of discussion and the rigorous (spirited?) review has added high quality to the process.
Well done all, thanks for all the very hard work.
Here is a simple question. Saudi declined 800k+ bpd in 2006. If it declines by 500-800k bpd again this year will the story (KSA in permanent decline) be definitive, whatever they say?
Also, Canterell declined by 20% Jan 2006 to Jan 2007. Simmons mentioned this could be 25% in 2007. Has it ever been this high before in other fields? Was the WSJ justified in panning Pemex?
Matt Simmons mentions the discussion about Ghawar that is taking place here in the hourlong interview Oil Drum in this latest Financial news hour audio. In fact this is the only website he mentions specifically in the interview .
The other alarming thing he says is Canterell could deplete completely in five years.
http://www.netcastdaily.com/fsnewshour.htm
Hats off to Stuart Staniford for the wonderfully persistant, deep commitment and acumen in pursuing and sharing his thoughts and analysis.
Matt Simmons said in the broadcast, "2025? I don't think we have til 2010."
On another PO site, there is a resevoir engineer (Rockdoc) that posts often about info coming out of Saudi Arabia. He sees no problem with the info. I specifically asked him to address some of Fractional Flows posts (though none on this latest forum). Here are some of Rockdoc's posts, I hope I can "block" quote them right. If not, I apologize.
Here's one response:
This is another one of those "My Expert who shall remain anonymous with unverifiable credentials who by the way is not actually commenting on this topic or any of the recent posts says FF is full of shit. So there, now you have to believe and by the way Al Gore and Matt Simmons both suck" kind of posts. If I didn't know better(which I don't) I would guess this is Dave posting under a new Alias.
cull
It's not Dave. Seahorse has been posting here a long time, and has a completely different style than Dave Cohen.
As for Rock Doc...he is a regular at PeakOil.com. He says he's a petroleum geologist (hence the moniker), and I believe him.
However...many at PO.com believe Rock Doc has an agenda. To be blunt, they consider him a corporate troll. Perhaps this is unfair (like the way Robert Rapier is mistrusted because he works for Big Oil). But those comments are pretty much what I would expect from Rock Doc.
One thing I did find curious...a few weeks ago, Rock Doc said we might be at or past peak. Definitely not what I expected from him. That was a real turnaround for him.
What matters for economic growth, stability, etc is if we are at or past net liquids available to non-energy society ( i could extend this to non-energy non-military society).
I have a strong suspicion that we are - the test will be once we go into recession how far oil prices fall - if they fall alot - we are plateau at worst- if they fall a little we are near peak - if they continue to go up, Katie bar the door. I expect new highs to $90 in next 4-6 months followed by nast recession dropping us back down to $60.
Here is the link where this discussion with Rockdoc is taking place:
http://www.peakoil.com/fortopic10918-0-asc-675.html
Rockdoc has been posting on PO.com for almost two years and seems very knowledgeable.
That last part is completely uncalled for.
Upon reflection, I see a lot of dust being thrown in the air by Rockdoc.
The points he is making may raise the tail end of the curve some, or delay the crash by months (I question even years) but they make no fundamental difference.
Nit picking on the details (important to an engineer, the boss would NOT be pleased with a six month error in the crash date) does not invalidate the sweeping conclusion; the northern and most productive end of Ghawar was within a few years of crashing in 2004. An event with profound impact for the world.
Best Hopes for Reality Based Planning,
Alan
I will not respond to this in full. But if you build a table that matches Saleri's 68.4 Bbbl OOIP for Ain Dar Shedgum and the 21% residual oil saturation that Aramco spent the time and money to collect a sponge core for in the SPE paper performing sensitive analysis on connate water saturations from 10 to 20% it would look like this
OOIP= 68.4
cont res 17.1
SWc PV Sor
21%
0.1 101.84 15.96
0.11 102.9842697 16.13932584
0.12 104.1545455 16.32272727
0.13 105.3517241 16.51034483
0.14 106.5767442 16.70232558
0.15 107.8305882 16.89882353
0.16 109.1142857 17.1
0.17 110.4289157 17.3060241
0.18 111.7756098 17.51707317
0.19 113.1555556 17.73333333
0.2 114.57 17.955
I apologize for the quality but there is one point- 16% original oil saturation and 21% residual oil saturation where it works to 17.1 Bbbl for residual oil volume completely. It will work at higher connate water saturations but that doesn't improve anything... plus Greg Croft showed 11% and if you look at the simulation cross sections closely it is hard to even see a value of 15%.
I am not the one claiming outlandish sweep efficiencies for this field- and that is why we are here I guess.
What the above really means is that Rocdoc stepped from one side of this debate to the other and didn't even realize it.
I see what you are saying. Hmm, Ill have a look and think hard and take a decision, myself, what is the best argument and logic.
So, Ive turned into the jerk at the dinner table ;)
I'm getting weary of saying this but for all the great miracle technology Schlumberger and Halliburton developed and the Kingdom pays for -
SPE 93439 clearly shows the water cut versus cumulative oil trend in the wet area of North Ain Dar accelerated and didnt decelerate. And the purpose of the paper was to tout the "water management in North Ain Dar".
Total Water Cut= Wet Area WC * Wet Area % + Dry area WC===0
So
Total WC= Wet Area WC * Wet Area %
and the wet area percent dropped from 90 to 65 over the 5 years...
So the water management involved opening the choke on the dry area.
Rocdoc can quote all the SPE paper results and "Saleri says" - but this is what the paper shows.
I post these comments not to be personal, only to provide more analysis and allow others to review for comment. Here are a few others from "Rockdoc."
This last part about Gore kind of marks him as an idealogue.
Just give us the true picture of how fast this decline is gonna be, at that point we can adjust our panic level accordingly.
Seahorse, thanks for these posts which are very strongly aligned to my own views.
I agree entirely with this - I know folks who work at Aramco, one who used to be a business partner of mine and the many oil industry folks I know who have had contact with Aramco all say the same thing - extremely competetent organisation.
If you would like to send me an email maybe we can talk.
It seems the Saudis may have lowered or slowed the onset of high water cuts in North Ghawar with MRC/horizontal (bottle brush) wells tapping into the top dry oil layer above the rising water-oil contact, drilling more wells and injecting more water would not have slowed the rising water-oil contact. Once the dry oil will be gone, they will be pumping a lot of water to get less oil. As they pump water through, occasionally the friction or pressure dislodges another drop of oil. It might be a marginal producer for years after its collapse.
According to Simmons the reservoir quality in southern Ghawar was much poorer. With an alleged profile of less porousity and permiability there were fewer places to dislodge oil from.
Am not sure of the rate of depletion from these TOD snapshots, but the largest of all oil fields is shrinking noticeably.
For what its worth, Rockdoc quoted above has previously said about 2014 would be his best guess for a world oil production peak (fairly pessimistic if compared to groups like CERA). He says with ongoing project delays, the peak could easily move forward, even be now, but that would be "good" in the sense it would mean a longer plateau.
Hello TODers,
I bet the ARAMCO reservoir engineers felt sick once this software finally showed that the waterfront had topped Uthmaniyah's topcrest [see Ghawar oilsat chart and garyp's slices]. Doesn't that mean that they are now locked into a high watercut to get the downdip middle portion out? Rephrased, the oil wants to flow upstream to the crest while the injected water is trying to go downstream--lots of mixing? Can any expert add more technical input to my WAG?
Bob Shaw in Phx,Az Are Humans Smarter than Yeast?
Stuart, is there any way that you can publish all the graphics off on a different link or reference page so that it is easier for the pages to load?
This thread got so incredibly image rich that it is taking quite some time bring it all up.
Also, it would be nice to have all those images archived for quick and easy reference in the future. You could just put a direct link off the sidebar and then reference to the page in comments...folks could link off to get a direct view of the graphic.
Just a suggestion for the "next round" of the World's Most Interesting Debate....still waiting for Euan to give in...he's holding tight his guns.
With so much recent focus on KSA here at TOD, it's intriguing to recall what Naimi was saying about their reserves in Q4 2005. Based on the data that's unfolded since then, it was a "timely" quarter to be putting out the following.
Saudi Arabia, the world's largest oil producer, will ``soon'' almost double its proven reserve base, said Oil Minister Ali al- Naimi. That will add 200 billion barrels to the current estimate of 264 billion, he said. Exxon Mobil President Rex Tillerson said the world may still have more than 3 trillion barrels from conventional oil fields, oil sands deposits and other sources.
http://quote.bloomberg.com/apps/news?pid=10000006&sid=afVg.BEwF2Jw&refer...
Gregor
The debate between Dave, Euan and Stuart is quite interesting. I gather within a few years...it won't really matter. Just like debating Abiotic and Peak Oil, those on the wrong side, will look foolish.
Denial seems to be a great debating tool...now-a-days. A Matt Simmons quote, "They will be debating Peak Oil right up to the time we fall off the cliff", seems appropriate here. Watching this debate is similar to watching CNBC concerning the Subprime mortgage meltdown. Of course you will have CEO's and top Financial Minds reasuring the public...this is but a small problem. Like Peak Oil...we will see.
There is so much coming down against our society...the end of cheap oil is just one more nail in the coffin.
steve
I know, the following info has already been posted, but anyway, READ IT AGAIN:
Riyadh: Economic growth in Saudi Arabia, the largest Gulf Arab economy, could accelerate this year on the back of a projected rise in government spending, Riyadh Bank said in a research report.
The kingdom's fifth largest bank by market value expects gross domestic product to grow 4.3 per cent in 2007 compared to 4.2 per cent in 2006.
...Saudi oil production is expected to fall from an average 9.12 million barrels per day in 2006 to 8.44 million bpd in 2007. "For 2007 ... we forecast oil prices to rise/fall by $3 per barrel," it said.
8.44m: Projected oil output in 2007 (in bpd)
(1 April 2007)
Contributor Jeffrey J. Brown writes:
One of Saudi Arabia’s top banks apparently does not expect any increase in oil production in 2007. They are predicting an average production rate of 8.44 mbpd for 2007, versus a 9.12 mbpd production rate in 2006, and 9.55 mbpd for 2005. This is a 7.5% year over year decline rate in average annual production, which if continued, suggests a 50% decline in average annual production in 10 years. However, net oil exports are falling much faster.
Note that the year over year decline in Saudi crude oil production from 2005 to 2006, was only 4.2%.
To summarize, one of the largest Saudi banks is predicting that the year over year decline in average annual Saudi crude oil production will increase from 4.2% in 2006 to 7.5% in 2007. Note that year over year declines, on a month to onth basis, are usually larger than year over year declines in average annual production.
Also note the continued negative effect on net oil exports of a continued rapid increase in GDP--as oil prices remain high, or go higher, even as oil production falls.