| Escape from Suburbia: Beyond the American Dream | The Oil Drum: Europe | UK Government: "energy security and climate change" |
Saudi Arabia and that $1000 bet
Posted by Euan Mearns on March 7, 2007 - 11:00am in The Oil Drum: Europe
First of all congratulations to Stuart for busting some records with his post "Saudi Arabian oil declines 8% in 2006" published on 2nd March. I was unavailable to comment that day but feel there are several cautionary observations that need to be made before jumping to any conclusion about the end of the oil age. If Stuart is right, and he may be, then the consequences may be dire.
In the last decade, monthly Saudi Arabian oil production has undergone cyclic decline on 4 occasions - 1998, 2001, 2003 and 2006. So how can anyone be sure that the present production decline signals a terminal slide in Saudi production?
Monthly oil production for Saudi Arabia reported by the International Energy Agency (eia) believed to be crude oil+condensate (C+C).
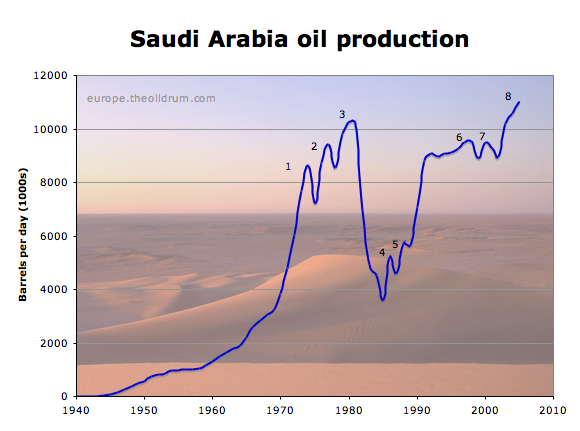
Annual oil production for Saudi Arabia C+C+NGL. From 1965 the data are from the BP statistical review.
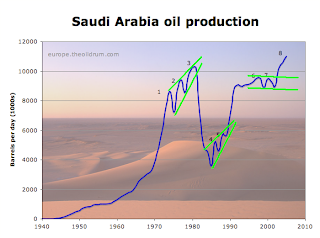
The annual average production data from BP show that since 1970 there have been 8 peaks in Saudi oil production followed by decline. (note that BP quote crude + condensate + natural gas liquids (C+C+NGL) while the eia data are C+C). There is no disputing that the declines following peaks 1 to 7 were caused by voluntary restraint, Saudi Arabia playing the roll of swing producer. The big question is whether recent declines from peak number 8 are voluntary or not?
Stuart is arguing that at the beginning of 2005, Saudi Arabia switched from swing producer to a supply constrained producer and the main lines of his argument are:
"They have never had declining production in the face of high and rising prices before. And they have never had supply side events show through in the production profile before" (from email correspondence)
So lets examine these two cornerstones of Stuart's argument.
Oil Price
According to the Energy Information Agency (eia), the decline in Saudi production began in April 2006. The oil price was indeed still rising at this time and did not peak until June 2006. But since June 2006 both oil price and Saudi production have been falling. The June 2006 oil price peak was the final spurt of a speculative boom fuelled by rising demand for oil, a narrowing of spare productive capacity and international tension over Iran, Iraq, North Korea to name but a few tense areas.

High oil prices worked their magic, dampened demand growth and stimulated a global exploration and production effort with the oil industry working flat out, everywhere. There is no shortage of oil throughout the OECD. US and European inventories remain high.
Faced with this scenario, it seems plausible to me that Saudi Arabia and other OPEC countries have cut production in order to support prices at the $60 level which does not seem to present any problem to the developed world economies. That is what the Saudis say they have done and I can see no evidence or reason to doubt it.
Supply Side Events
So what about Stuart's assertion that commissioning of the Haradh gas oil separation plant (GOSP) is recognisable as a 300 kbpd blip on the decline curve. Whilst I am not entirely convinced by this chart, produced by averaging three of four data sources, I am happy to accept the possibility that it may be a valid observation and offer an alternative explanation.

Falling Saudi Arabian oil production, monthly averages from three sources - the US EIA, the OECD iea and JODI. From Staniford "Saudi Arabian oil declines 8% in 2006"
The Saudis have to run their oil production on different planning time scales. The planning and construction of the Haradh 3 GOSP probably took several years and of course, once complete it was immediately commissioned. At the same time the Saudis claimed they were cutting production in response to flat world demand for oil. They have done this many times before and it seems likely that inefficient production from wells with high water cut and from low permeability reservoirs would be shut down (see below). There is no conflict between the Saudis cutting production from inefficient wells simultaneous with new, dry oil production being brought on stream. The 300 kbpd blip, if valid, may therefore reflect new production coming on at a time of voluntary restraint. Mothballed wells add to the Saudi's reserve capacity.
The Smoking Gun
There has been much debate about the increase in the number of oil drilling rigs operating in Saudi Arabia which are up from around 17 in 2004 to over 50 in 2006. The fact that oil production has actually fallen whilst the number of rigs has increased in seen by many as a sign of crisis.
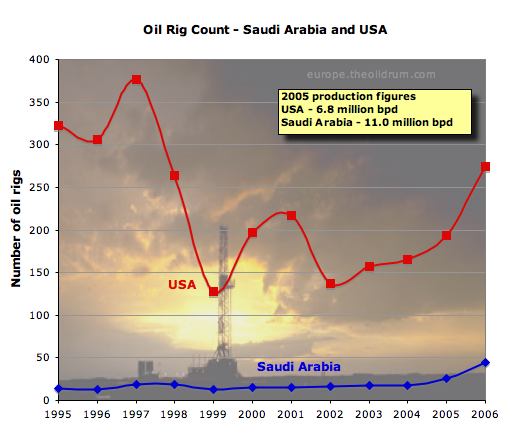
Saudi oil rig count compared with variations in the US rig count, believed to be onshore and offshore rigs. Whilst the relative growth in Saudi rigs is high (approximate 3 fold increase) this is starting from a very low baseline and the absolute rise of around 40 rigs over two years is trivial compared to the production volumes. International rig count and US rig count from Baker Hughes.
Another way of looking at this however, is that Saudi Arabia maintained oil production capacity of over 9 million bpd for many years with only 17 drilling rigs. The recent increase is very modest in absolute terms. The additional rigs may be drilling new developments such as Khurais, reported to be using 23 rigs, which are not yet on stream. But even when these new developments come on, Saudi production may not necessarily rise - because the market is currently satiated.
The Quality of Saudi Reservoirs
Most of the oil reservoirs in the Middle East are limestone and the quality of those reservoirs is highly variable. Without going into detail, Saudi reservoirs have two significant problems which are both related to permeability (the ease with which fluids may fow through the rock).
Low permeability reservoirs - not surprisingly, the Saudis developed their best (high permeability) reservoirs first and are now having to fall back upon the second tier, lower permeability assets. The problem is amply demonstrated in Ghawar where the north end of the field has fabulous reservoir quality, average permeability over 500 mD, whilst the south end of the field (which still contains a lot of oil) has poor reservoir quality with average permeability under 70 mD (see below). The low permeability reservoirs produce more slowly and require a larger number of wells (hence the increase in drilling rigs?). Saudi reservoir engineers will welcome the opportunity to rest the low permeability reservoirs to allow pressure to rebound as described by Matthew Simmons on p171 of Twilight in the Dessert.
High permeability streaks - also known as super-K horizons. These lead to injected water flooding producers prematurely and unpredictably giving rise to the much-publicised problems associated with water flooding and reservoir management. Again, reservoir and petroleum engineers would welcome any opportunity to trade wells with high water cut for new dry oil production.
Wells mothballed on grounds of high water cut or low reservoir pressure will benefit from the rest and when production is resumed, as needs require, they will for a short while perform much better than prior to shutdown.
| average porosity | average permeability | |
|---|---|---|
| Ain Dar | 19% | 617mD |
| Shedgum | 19% | 639mD |
| Uthmaniyah | 18% | 220mD |
| Hawiyah | 17% | 68mD |
| Haradh | 14% | 52mD |
A balanced perspective
I am trying to bring some balance to the debate on Saudi oil production. On the one hand, Saudi Aramco and the eia are forecasting "forever rising" production whilst Matthew Simmons now joined by Stuart are forecasting rapid and terminal decline in Saudi oil production. As is often the case, reality probably lies somewhere between these two extremes.- There is little doubt that Saudi oil production has fallen steadily since April 2006. The fact that this can be measured in four different ways means very little. It would be surprising if the different agencies were not in general agreement with each other.
- In my opinion, there is no hard evidence to support that this fall in production is involuntary.
- Similarly, there is no hard evidence to prove it is voluntary. But given the long history of Saudi Arabia acting as global swing producer, in my opinion, hard evidence would be required to prove that this had ceased to be the case. Such evidence may include: 1) falling global oil production 2) escalating oil prices and 3) falling OECD inventories. Right now, none of these tests are satisfied.
- Saudi petroleum engineers would welcome the opportunity to rest wells with low reservoir pressure or high water cuts and their is no conflict is substituting this type of inefficient production for dry oil production from new projects.
- I am in total agreement that Saudi oil production is entering a new era. In the past, over 9 million barrels per day could be achieved with relative ease. Their best assets are mature and may be in decline. In the future, much greater effort will probably be required to sustain production over 9 million barrels per day.
That $1000 bet
I'll bet $1000 with the first person who cares to take me up on it that the international oil agencies will never report sustained Saudi production of crude+condensate of 10.7 million barrels or more. Stuart Staniford, 2nd March 2007
High stakes and long odds! If Stuart was so confident that Saudi production was heading south for good then he would not have set the bar so high.
Personnel
Editors
Contributors
Peak Oil Primers
Archives
- November 2010 (3)
- October 2010 (6)
- September 2010 (4)
- August 2010 (7)
- July 2010 (6)
- June 2010 (7)
- May 2010 (2)
- April 2010 (8)
- March 2010 (4)
- February 2010 (6)
- January 2010 (3)
- December 2009 (5)
- November 2009 (8)
- October 2009 (12)
- September 2009 (6)
- August 2009 (5)
- July 2009 (11)
- June 2009 (8)
- May 2009 (16)
- April 2009 (10)
- March 2009 (7)
- February 2009 (10)
- January 2009 (15)
- December 2008 (9)
- November 2008 (9)
- October 2008 (9)
- September 2008 (13)
- August 2008 (10)
- July 2008 (14)
- June 2008 (23)
- May 2008 (16)
- April 2008 (12)
- March 2008 (16)
- February 2008 (9)
- January 2008 (13)
- December 2007 (13)
- November 2007 (16)
- October 2007 (22)
- September 2007 (8)
- August 2007 (9)
- July 2007 (16)
- June 2007 (8)
- May 2007 (7)
- April 2007 (7)
- March 2007 (10)
- February 2007 (10)
- January 2007 (12)
- December 2006 (9)
- November 2006 (15)
- October 2006 (4)
- September 2006 (5)
- August 2006 (5)
- July 2006 (9)
- June 2006 (5)
- May 2006 (10)
- April 2006 (9)
- March 2006 (13)
Vital Trivia
License

This work is licensed under a Creative Commons Attribution-Share Alike 3.0 United States License.
Forget ye not the reddits and the diggs, nor the link farms. This is a debate that needs to get as many eyes as possible...let's help Euan get readers!
Can someone please disprove this one? Show me the pipeline is officially in use or really isn't in use so I can relax.
The Saudi-Iraq pipeline
This says it was repaired and ready to go in 2002.
http://www.menewsline.com/stories/2002/june/06_18_3.html
Something is not right here. The above article says it was repaired and ready to go in 2002. Yet in 2003 there appears to have been a media campaign to state that the pipeline was unusable as it had not been touched since since 1990 when it was closed and had massive corrosion.
http://www.gasandoil.com/goc/news/ntm34663.htm
Is this one of those things you don't want to touch or you'll die like in "Syriana"?
Is it possible that stolen Iraqi Oil is being pumped to and laundered through Saudi Arabia?
My personal bet is that Kuwait is Iraq's laundry. Both based on some interesting photo interpretation from a retired Air Force colonel, and the fact that Kuwait and Iraq 'share' an oil region.
This doesn't mean that Kuwait has to have a monopoly, of course - supporting the invisible hand that runs our affairs is part of what makes the Bush League tick.
Would be very ironic. First, provoke an invasion..
Only one complaint with this theory, though: Why would Kuwait be dropping their reserves numbers, either officially or unofficially?
Reserves are one thing, oil/cash flow another.
Here is how my theory goes -
1. Kuwait is on par with Saudi Arabia in terms of its American connection - without KSA's Mecca hole card
2. After Iraq's invasion. Kuwait's infrastructure was rebuilt - and the people doing the rebuilding certainly had a longer term perspective than just the next quarterly report (remember, Bush I was in charge - and just by coincidence, a second Bush is now in charge, courtesy of several Bush I Supreme Court appointees).
3. According to international law, you just can't invade and steal a nation's resources - not that Bush II cares that much about laws, as we've seen, but there are still some constraints - notice the unsuccessful Chavez regime change.
4. After having overbuilt Kuwait's exporting infrastructure while no one was really paying attention, pointing out that the Iraqis are to blame for a drop in their exports is simple, as it certainly contains an element of truth.
5. Everybody except the Iraqis splits the cash, and drives off into the sunset. The invisible hand at work.
Actually, this is the sort of theory which could be proven to a degree - there are enough physical elements which can be checked. For example, if Kuwait had facilities to load 4 tankers a day before the Iraqi invasion, and they were rebuilt with the capacity to load 8 afterwards - or if the tanker loads from Kuwait increased measurably after the U.S. invasion. Or rig activity on the border between the two countries.
This also leads to a certain amount of speculation about reserves - perhaps the Kuwaitis were also counting on an oil bonanza to allow them to keep up the pretense that their reserves were still large, with production to match. But then, the amount of Iraqi oil to plunder was less than planned on - reality seems to be a real weak point in much of the Bush League's planning, in my opinion (ah, roses - the smell of victory). This information would be much harder to confirm, obviously.
"This information would be much harder to confirm, obviously"
I found rig count data back to 1998.
Don't see any obvious anomolies - unless, of course, the rigs have been moved to the iraqi border.
Or it was directly after GWI - anyone with better/longer data?
One of the things to keep in mind is that the Saudi King was replaced in August 2005. The policies in place before August 2005 are not indicative of the policies in place post August 2005. Specifically, the concept of what is the fair price for a barrel of oil. In August 2005 the Saudi's view of the fair price of oil moved from $25 to $60.
The same man was in charge after August 2005 as was before August 2005. Crown prince Abdullah took over when King Fahd became incapacitated by a stroke in 1995. When the King died in 2005, Crown Prince Abdullah simply took the title as king. But he had been in power already for ten years.
No power changed hands in August 1995. Power remained in the same hands as it was before the king died.
Ron Patterson
Beng the guy who has the most influence while the king is incapacitated is not the same as being "The King".
Ever notice that people don’t trot out their articles when the data contradict their prediction? But since the data support the prediction, here it is again.
http://www.energybulletin.net/16459.html
Published on 24 May 2006 by GraphOilogy. Archived on 25 May 2006.
Texas and US Lower 48 oil production as a model for Saudi Arabia and the world
by Jeffrey J. Brown & "Khebab"
Texas, like Saudi Arabia, produced at less than capacity for long periods of time, thus the following plot, based on the assumption that Saudi Arabia was likely to start declining at the same stage of depletion at which Texas started declining.
Texas, in 1972, relative to Saudi Arabia, in 2005:
http://static.flickr.com/55/145186318_27a012448e_o.png
In regard to oil prices, the average monthly Brent spot crude price was $38 in the 20 months prior to 5/05, versus $62 in the 20 months after 5/05 (within a range of $54 to $74). And of course, 5/05 was the highest crude + condensate production so far (EIA). The cumulative shortfall in what we would have produced at the 5/05 rate and what we actually produced is on the order of 366 million barrels of crude + condensate (through 12/06). BTW, I would put the most recent Saudi peak at 9.6 mbpd, in 9/05.
In my opinion, we have seen some reduced demand, primarily in poorer regions like Africa, because of a physical inability to buy energy. I think that $62 has been sufficient, so far, to balance reduced demand against lower supply. But I suspect that we are about to start a new round of bidding for declining production--and especially declining exports.
In regard to the HL model, to expect to see sustained rising production from the 60% of Qt mark, which is where Saudi Arabia currently is, is to expect to see that which we have never seen, insofar as I know, in any large producing province (60 Gb or more).
In fact, Saudi Arabia is right between the 50% mark at which the North Sea peaked, and the 70% mark, where the North Sea is currently. No one (outside CERA at least) questions the reality of the North Sea decline, so why is the Saudi decline so shocking?
While it is true that the Texas HL plot was quite noisy prior to the peak, we can get an accurate HL plot for Texas now, and the Saudi HL plot has been quite consistent. The infamous “dogleg” in the last three or four years of Saudi data was also seen right before the Texas peak.
Also, on an annual basis, the 2005 to 2006 decline in Saudi production of 4.3% (C+C) is quite close to the long term Texas decline rate of about 4%.
One thing that puzzles me is why were Iraq, Russia and “Other” able to find buyers for a total increase of about 900,00 bpd (12/05 to 12/06, C+C), but Saudi Arabia had to cut their production by about 700,000 bpd?
WT: I added this comment late to the exchange you had with RR, in response to RR, on the orginal Staniford thread:
http://www.theoildrum.com/comment/reply/2325/165766
Gregor
There are many ways to make an analysis.
I prefer charts.
If Saudi oil production were a stock, we could easily find a "rising wedge", which is very bearish for production.
Top beginning Jan. '98
Bottom beginning Jan. '02
If I knew how to upload the pic...
Graphs of the market measure human reactions in group situations. A chart of production is about geology, not human reactions (though there may be some recession/geopolitics embedded in the graph). If geology follows a graph, it would be something like a hubbert graph - not a 'rising wedge'.
Technical analysis in the market doesnt work anyways. Most people that look at charts dont make money doing so but recognize a certain pattern that worked in the past or they read about in some technical analysis book. They remember the times it worked and selectively forget about the times it didnt.
Any market chart pattern can turn into any other chart pattern and usually does.
Well, I think Geology determines where 50% is - the point at which the absolute top is reached. Not HOW we get there. Not HOW we leave there.
If you look at the oil production graph of the WORLD, you will notice that it followed a bell shape until 1974. And then?
It formed a left shoulder:-)
And did it then return to the bell curve?
No.
Why? Price restrictions, political restrictions, infrastructure restrictions. This has NOTHING to do with geology. This is what you call "human reaction" (hate to mention it, but it would concur to CERA's above ground factors).
I happen to see all this on a chart, just like I called September 2003 as the start of the oil bull market. Why? Because of the price chart (in combination wiht the fundamentals of PO and Chinese demand and especially because of the sustained price pressure after GWII was quickly "won"). My father, an old oil man, didn't believe me.
I am not going to defend chart techniques, which is more of an art than a science or whatever.
BUT I would refuse right now to BET on Stuart's conclusion that SA has maxed out because I need a confirmation from the chart - a rising wedge can break in both directions, and it has not broken yet. It is approaching its lower support line.
For what it's worth..
"They remember the times it worked.."
The problem with a lot of chart technic is that it is best seen in the rear view mirror. Sound familiar?
Besides, let's just test the hypothesis. Here's the chart:
As a trader, I would not bet on SA's fall until the line at the bottom is broken. I have a fundamental idea (call me Stuart, convinced that production has peaked) but wait for a market "signal" to make the trade..
Now, how about historical information in a field that is very humanly driven (factor "human reaction")? I'm using a much greater time frame, basically comparing apples with oranges in the two charts:
Like I said, for what it's worth..
Westtexas, I suppose many of us are quite familiar with your HL analyses, which seem to me helpful and informative. I have a few problems relying on HL analyses for SA.
1) We don't have sufficient data to say SA's Qt is what you say it is.
2) HL is not perfectly predictive. I recall one HL analysis where the predicted Qt was quite short of actual because the line trended up at a point.
In order of importance, 1) is more important that 2), and 2) injects sufficient uncertainty, for me, to prevent saying anything definitive about future Saudi capacity.
HL error is non-linear post peak its pratically nill +/- 5% at most and this is from intrinsic production issues. Leading up to the peak I'm guessing its less than 10% if your within 5% of the peak. Once more I remind Mr Rapier he promised a post on HL error.
Multi peak scenarios have their own peak issues leading to a systematic error when depending on how you convolve the peaks.
Probably a simple retreat to taking the area under the curve and constructing a total simple area is the easiest and close enough.
One thing thats not been brought out but should is the production decreases we see are generally short lived and don't actually effect the final date of peak production all that much within the error of HL analysis. The shift in a production period spanning decades is on the order of years well withing the +-5% that I think HL has.
Right now we are in the pivotal point that is either a few years post peak or a few years pre-peak so lots of room for discussion.
I have noticed that recently as peak has become a stronger possibility that we have lost sight of the fact that these few years really don't effect the final result all that much. Its a matter of peak now or before 2015 in the big picture it does not matter. Even if production increases base demand if oil was cheap is already greater than supply so the era of cheap oil is already in the rear view mirror.
We are now concerned when real shortages will develop.
Then of course the EROI peak which I think will be far worse.
Once more I remind Mr Rapier he promised a post on HL error.
As you might guess, I have had a lot going on, an inconsistent Internet connection, and frankly this has been of low priority for me. I also haven't decided the best way to approach the problem. I could start in 2000 and generate a year by year HL of Saudi (or Texas in 1960) and show how they change over time. Do you think this would suffice? It would give a series of data points that have bounced around, giving us a standard deviation for a particular time period.
Suggestions are welcome, but I can't say when I will get around to it. I have several other things I am working on, but I do agree that this would be an interesting analysis to present.
I'd say you need to show when error is bad say 20%
and work back from their I don't know what year that is
or the time scale but thats enough for some cool results.
Once you show error drops under 20% and the error bars on the years of peak drop thats enough.
I think we can safely determine when we are 20% post peak for texas. I think that everyone here figures we are less than this now for the world.
I just don't know what the resulting error spread in years is.
But running Texas/ lower 48 through this analysis will give us a excellent handle on how well we understand peak oil and we have the North Sea as a test.
In any case I think if you do this you can be 100% confident in predicting peak oil for the world within this range.
You push that we must know the right answer my response is we have enough data to be confident about the world peak within a error range. Yes it means the public will need to understand error but we have almost 100% confidence in the numbers.
In any case backing off to a 20% error range for a known case makes good sense. Initially maybe go higher but you get the drift early on HL has like 500% error bars.
memmel, you are exactly right that the position of Saudi/world production
Memmel, I believe that you are exactly right that the timing of the determination of the peak is impossible to determine with the data we have available and the important thing to notice is that the era of inexpensive crude is over. Its the unanswerable arguement for the Cornucopians.
Let them keep redefining the definition of crude to include kerogen (oil shales) and bitumen (tar sands) so that their reserve figures are preposterous, and include ethanol and buidiesel in the oil production figures. The public could care less about the number of barrels per day, but they damn sure notice a nickle bobble in price at the pump.
Hi m,
re: "Then of course the EROI peak which I think will be far worse."
Is there any way to get an analytical handle on this? Has anyone applied the methods that exist to looking at the situation we face?
I assume that you are referring to the UK plot, which showed an initial P/Q intercept of 30%. The problem with this is that there is no example of a large producing region showing anything remotely close to a long term 30% P/Q intercept. Most of them are between 5% and 10%. The only two outliers that I know about are the UK and Iran, which are around 13%.
The "Early Peak" UK HL plot is just an example of doing the HL plot too early in the data set.
The overall North Sea peaked at the same stage of depletion as the Lower 48, Mexico and apparently the world. Russia also hit a plateau at 50% of Qt.
I'd like to see a longer term chart comparing Texas and SA oil production. Did Texas have the kinds of ups and downs that SA shows when we go back to the 1960s as in the charts in the main post? Your chart overlaying SA and Texas production only takes SA back to the 1990s, where there are no peaks visible. If you're going to claim the two are comparable, let's see more data.
Euan - Dumb questions, from your post...
average porosity
19(%) vrs 14(%)
19 is 135% more than 14
average permeability
617 vs 52
617 is 1,186% more than 52
These two figures are extreemly different, and I assume permeability must be the most important one for rapid extraction. hence which field gets developed first is because of this. Is this correct?
Never mind the words should make this obvious.
If you were to compare KSA with Texas are the #'s similiar? Can the decline rates be similiar?
Does this even matter in regards to HL?
Like I said dumb questions...
Never mind (reread and think!) self answering questions.
:) I think I will go outside now. thanks
D
The distinction is that the reservoir rock in the "good" sectors offers essentially zero resistance to fluid flow. To put it in handwaving terms, there don't exist any rigs capable of drilling wells with an internal diameter big enough to take everything that the reservoir could throw at them. Whereas the hydraulic resistance of the reservoir in the "poor" areas is appreciable, i.e. you'd need to take it into account to figure a precise estimate of well flowrate. It's still a pretty damn good reservoir.
Looking at the table that Euan cited, the reservoir quality in even the "poor" areas should be enough to allow flowrates of over 10,000 barrels per day per well - possibly MUCH higher. That would be a regular cased and perforated well, or maybe even a barefoot completion in this competent limestone; nothing especially fancy, certainly not a bottle-brush.
Any "normal" oil company would gladly give its gonads for a clear run at something like Haradh.
In Ag there are terms relating to water content in soil. Between 100% dry soil(oven dried) and 100% wet soil(field capacity) there are other important conditions. Microscopically held water can exist, > oven dried, but is not available to the plants as it is held to tightly by the soil particles. Between field capacity with 0% air and microscopically held is "available water" for plants. (Generally most plants need some air around thier roots but that is besides the point).
Can I assume that oil is similiar in that there will be a film of oil left on these rocks when "available oil" is removed?
This "steaming" process, can or do they incorporate some sort of "detergent" to cut the oil loose?
If you check the link to Greg Croft you''l see that water satuartion levels of around 11% are quoted. That means that 11% of the pore volume is filled with water and the remaining 89% with oil.
Limestone reservoirs are often viewed as oil wet, i.e. it is oil that wets the carbonate matrix. During production you hope to recover 30 to 50% of the oil in place, the produced oil gets replaced with aquifer or injected water.
A lot of the oil gets left behind and incraesing the recovery of that residual oil has been the focus of much research over the years. The problem is that with water saturation over 50%, the oil gets discontinuous in the reservoir and cannot flow.
Thank you both for answering.
Obviously oil is like alot of other things - part education, part art, and luck never hurts.
Euan, Thanks for the additional educated perspective.
RE inventories: It has been mentioned, on occasion, how crude inventories can be a contra-indicator of crude scarcity. If a refiner has spare tankage and anticipates higher prices in the future (contango) he would tend to fill the tanks to the max, whereas in a market that anticipates lower prices (higher supply at the oil field) he would be relaxed about leaving a few tanks empty. Do you think this may play a part in how we read these tea leaves?
Ah, I see Gregor's post above which addresses these issues. Thanks Gregor.
Great data in this story by Stuart:
http://www.theoildrum.com/story/2006/1/28/01820/6609
He describes a slowing North American economy:
Oil consumption tends to decline along with GDP. I'm sure that KSA observed the same economic trends as Stuart and made a decision to remove production from the market and seek to maintain pricing.
As for the bet, we need Stuart to clarify what period of time is represented by "sustained" Saudi production. Euan, if you were to take Stuart up on his bet, I'll take a quarter tranche from you. Maybe RR will take another quarter tranche and then we just need a final fourth party. Note that the bet stipulates an infinite future so we can wait forever for KSA to report that 10.7 million barrels.
Of course this also means we wait forever to collect from Stuart :-)
Cheers!
Mr. account:
You have forgotten one caveat in the current state of energy consumption/production in today's "global" economy; that would be China. Their economy has grown such that they now are the second largest oil importer behind the US at about 4 million barrels per day. Their oil consumption has been growing by 10 to 15% per year for several years. Even if the world economy slows, they will still import huge amounts of oil for their economic engine that the government is controlling.
Even if its exports fall, China's GDP may not fall as fast as the US or EU because of that $1.1 trillion in cash that the banks of China can use to help keep that engine running at near full throttle.
Mr Train:
My conjecture would be as follows -
1) KSA observed possible economic decline in OECD and made decision to reduce production to protect price.
2) OECD decline was not as weak as expected plus there was additional take up from the Chinese economy as you have stated.
3) Both of the above factors resulted in rising prices in the face of pre-planned declining KSA production.
4) Price rise was exacerbated by speculators entering market. This diverted production to inventory, created problems for non-speculative buyers and triggered a speculative bubble which is now in the process of unwinding.
In addition to not having factual data on KSA fundamentals, we also lack factual data on fundamentals of Chinese economy. We also need to take into account the relatively long lag times between action and result in a fairly complex global production system.
Cheers!
Maybe RR will take another quarter tranche and then we just need a final fourth party. Note that the bet stipulates an infinite future so we can wait forever for KSA to report that 10.7 million barrels.
There are several factors at play here. No doubt there are existing fields that are depleting. So that is a major factor. They also have fields that they are developing. My guess is that they are trying to forecast demand and develop fields as demand warrants it. But, the longer it takes demand to pick up, the more depletion they have had to contend with. So, it is not just a matter of "Can they do it?" If they believed 10 years ago that demand right now from them would require 10.7 million barrels a day, they could have accelerated their existing projects and they could have done it.
As it is, I am in agreement that Ghawar is close to peaking, and when it does they will have a struggle pushing production up. Bottom line: Could they have done it in 2007 if they had started planning 10 years ago? Yes, I think so. Given the situation now, will they be able to do it in the next 5 years? I wouldn't take that bet.
What I do say though is that if the country is in terminal decline they shouldn't be able to increase their production from here. My prediction is that they will. I think that's what is meant by setting the bar high. Stuart is suggesting that they have peaked, but wants them to demonstrate something far above today's production levels. If they really have peaked, 9 million bpd should suffice to win the bet.
>As it is, I am in agreement that Ghawar is close to peaking, and when it does they will have a struggle pushing production up
Ghawar Peaked in 1981. Production is now leaving its multi-decade plateu and is very likely entering terminal decline. There is a big difference between "peaking" and "terminal decline".
Hypothetically, even if KSA was able to magically increase production it doesn't matter. All of the existing supergiants (except for one) are either in the high single digit or low double digit declines and it takes an awful lot of small field production just to offset those declines.
We have a situation where advanced technology has enabled us to maintance high production rates at the expense of much steeper declines in the future. Global there is very little effort focused on mitigation projects to prepare our infrastructure for a world with less oil and more expensive oil. We will soon be facing a severe economic recession (probably in the the next 12 to 18 months) which will will never crawl out of during my our your lifetime. Some of this will be related to energy, some do to economy imbalances that have been ongoing for decades.
That was precisely the bet I offered for precisely that reason. Then someone piped in effectively saying "well why don't you bet 10 for a *real* bet," entirely missing the point.
new account and Robert - I had considered wagering that we do see a monthly average 9.3 million bpd C+C (eia accounting) from Saudi Arabia before 2012 and would be happy to go $1000/4 on that basis.
Stuart - are you up for that?
Euan:
I'm in.
Robert's busy so we may not hear from him for a bit. And we still need someone to pick up the fourth tranche. Any fellow TODders willing to make life more interesting than it already is?
I expect we'll see "9.3 million bpd C+C (eia accounting) from Saudi Arabia before 2012", I expect they could burst up to that for a few months from storage if there was the market for it (Iran off-line?). But I doubt Stuart would go for it - that's a long way short of his 10.7 mbpd.
There is no hard evidence to support that this fall in production is involuntary
There is no hard evidence to prove it is voluntary
There is no "hard" evidence.
There is endless nonsense, however, and since I love that stuff, keep it up!
Bring it on!
Good article Euan, and it goes to show that with similar data a different conclusion can be reached - ergo it is not possible at this moment in time to make a declaration one way or another.
I am glad you brought up the rigs issue - the increase in SA in the past few years (often accompanied with the assertion that they are engaged in a drilling frenzy) is in my view wrongly used as a clinching piece of evidence. A quick examination of the Baker Hughes data shows that even such low level producers as India and Argentina still have more rigs in country than SA, and the former has shown a not dissimilar increase in rig utilisation. The comment is made 'ah yes but they are producing less with more rigs' - but as you point out, there need be no absolute correlation between the two anyway if the decision has been made to cut production to husband older resources, and ready newer fields to share the production burden.
Thus to my mind the rig issue in SA is:
a) Not as anywhere dramatic as some believe - absolute numbers are still tiny, compared to the US, or even some small producers
b) Another interpretation of the increase in rig numbers (response to higher prices, need to bring on back up fields) is just as valid as the one traditionally made
As I have stated previously, none of this makes any difference to me and where I am in my PO preparations, but it could make a deal of difference in terms of how TOD is viewed in the future.
Euan, calling the peak in KSA is really irrelevant here. My question to you is, are you worried about it? Is it a remote possibility? If so, do you think it prudent to start thinking about the future...planning for the inevitable?
Dragonfly - wrt to global peak, I've pinned my colours to 2012±3 years based on khebabs loglets / HL - so yes I think folks should be worrried. In calling Saudi decline, Staurt is more or less calling peak now. I see recent flat production and falling Saudi production as a reflection of demand and believe that when demand picks up (and or production continues to slide else where) that Saudi production will rise again - how high I don't know, but I would bet on over 9.3 million C+C for a short spurt.
I beleive (and this is only conjecture) that the Saudis will have a large number of wells shut in and that these may be brought on as required.
So, here we have two expert analysts saying that KSA peak is probably somewhere between now and 6 years from now. This precision can be debated by experts for awhile longer, but for those reading these posts that are not experts, it really indicates that it is time to do something...prepare on a personal-level, contact local/federal politicians, look at the world in a much different fashion.
Thanks Euan and Stuart for all the hard work, but it is looking more and more that CERA is wrong and there will be a more near term peak than a later term peak.
I know this is tiresome, but there is one area where we know we most definitely have not peaked, and that is with respect to the emissions of greeenhouse gases. Regardless of who is right about peak oil, this debate will continue for the next several years regardless of the true peak. And then there will be serveral more years of arguments about what caused the peak and whether we could have delayed the peak with even more aggressive drilling in every area of the world that has heretofore been considered "sensitive". Why, I am sure there are people, including in congress, who will argue that we can even return to the glory days of supply in the U.S.A.
There is one area where it is clear that we have to do something and that something is to reduce the burning of fossil fuels. Otherwise, we are just arguing with the addict about whether there is sufficient heroin to keep him from the horrors of withrawal.
Given the overwhelming and immediate need to cut the consumption of oil and all other fossil fuels, could it be that the debate about peak oil is counterproductive? If one engages in the debate with the likes of CERA, for example, the mind becomes focused on the idea that this debate is really important. Some would argue that it is important because we must convince people to compare for the deluge or, as it were, the absence of of the deluge, the abundance of oil and the continuation of Happy Motoring. But either way, you can't win. If there is peak oil, we are assured that oil sands, tar sands, ethanol, and coal liquids will save us. If there is not peak oil, we can continue our lifestyle for decases without a worry.
Given what the Chinese, the U.S. and others are doing to reduce their dependence upon oil, I almost wish the peak oil denialists had truly won the day. The Chinese, for example, don't worry their pretty little heads about the exact date or even decade when peak oil will arrive. They know their appetite is voracious and will be even more so; therefore, they pursue everything, every last btu they can extract out of anything to the ends of the earth. Meanwhile, the U.S. digs its own graves in the Middle East.
Coal production has really taken off this past 5 years and that is a worrying trend that I suspect will just get worse.
In Aberdeen our politicians are still dead keen on building more roads and extending the local airport. Its tough to get through to politicians. When you suggest there may not be enough fuel to put in the planes their eyes just glaze over.
Right on the mark, Dave. A further implication from the current state of evidence is this: a person who says SA's current decline is involuntary (not to mention irreversible) cannot even be proven to have been right---except in having guessed correctly (but then who cares)---if in fact the decline turns out to be such.
Alright, Dave has gone Postal now. I'm glad you don't know where I live. He only took his ball and went home to get his gun.
That's it in a nut shell - and I believe we need hard evidence before calling the terminal decline of Saudi Arabia as an oil producer.
Though I understand, and often support, the academic stance of requiring "hard evidence" for critical claims, I'm not sure that such a position is a good one in the case of world peak-oil. Factor in risk assessment. What are the potential outcomes for people world-wide post-peak? Perhaps waiting for concrete evidence in this case is an unwise decision. Sometimes survival depends on interpreting the best information available and then acting, even if there is significant uncertainty. I think that's what people like Staniford, West Texas, and Simmons are doing.
Close to my own personal opinion, what difference does it make really—peak oil in 2005, 2008 or 2013? Acting now to deal with this major problem is in our best interest. I like the idea of exploring the error bars in HL, discussed above, and coming up with an interval of years for peak that has a high degree of confidence. I hope to see something like that soon.
-best,
Wolf Read
I think your right that we ought not to get too hung up on certain details. And it does seem that Staurt's position and mine are not to distant in the grander scheme.
The precautionary principal is difficult to apply to pending disasters. A smoking volcano that may errupt in 5 days or 5 years - when do you evacuate?
WRT errors and HL - Khebab may be a better bet than Robert - he was talking about boot strapping the other week - so I'll make sure he gets the message.
WRT errors and HL - Khebab may be a better bet than Robert
I would say that he is probably in a better position short term to get this done. I won't be able to tackle it for a bit.
Hello grey
re: "...coming up with an interval of years for peak that has a high degree of confidence. I hope to see something like that soon."
Yes. Saying "we don't know" or "evidence inconclusive" is less than optimal, if "we" (or some of us, anyway) have the ability to make explicit a specified error range, and can specify any other qualifications (confidence level, assumptions or whatever.) Further, to specify multiple approaches (and any qualifications attached to them) would be the icing on the argument.
Even to agree on a form for this would be nice. I noticed, for example, Robert the other day said peak "could be" in 2013. So, is the best presentation in terms of dates? Or, something else?
It seems important...not only because it would encompass both Robert's and Jeffrey's concerns, but also in view of a human tendency to give the easiest (less stressful, perhaps) interpretation to a phrase like "inconclusive data".
(Re-stating, perhaps, the obvious.)
I don't see any "hard" evidence that we will ever get "hard" evidence.
Is it just me or did that post seem a little weird...
Hi Steve001,
Re: "just me". I have the impression Dave's been upset for a while. (At least, he seemed upset back when HO posted his "energy conference summary"). I don't think he means it the way it might come across if one hadn't been reading. (But you could ask him. Of course.) As best I can tell, it means kind of like..."we/you all are wasting your time and we'd better get to work."
The Staniford Post on KSR has now reached mention in the Wall Street Journal, in today's WSJ Energy Blog.
March 6, 2007, 5:06 pm
Blog Roll — Pondering Saudi Arabia’s Falling Production
Writing on his blog, The Cost of Energy, Lou Grinzo ponders the reasons for Saudi Arabia’s falling oil production last year, according to OPEC data (discussed at length in this Oil Drum post on Friday). “Clearly Saudi Arabian oil production is lower. The magic question is: Why?” he asks. “Have they hit peak production on enough of their fields that they’re…at their all-time peak? Or are they ‘merely’ at a local peak that can be overcome via enhanced oil recovery techniques…? Or is it simply that they really are telling the truth, and they’ve voluntarily cut production for one or more reasons?” He warns against jumping to conclusions about the development, which he sees many doing. “No self-congratulatory doomerism here,” he writes. “I’d rather stick with militant agnosticism, even if it’s more than a bit frustrating at times.”
Blogging
Blogs We’re Reading:
* The Cost of Energy
* The Energy Blog
* DeSmogBlog
* Rigzone
* Joel Makower
– Mark Gongloff
Comments (2) | Permalink | Trackbacks
Save & Share: Share on Facebook | Del.icio.us | Digg this | Email This
http://blogs.wsj.com/energy/
Gregor
A couple of things.
First off, remember that the WSJ blog is relatively new. We get more traffic from po.com and other outlets then from there (for now)--but, of course, Mark's blog has the potential to be influential. I look forward to seeing how Mark handles the controversial issues and integrating readerships.
I wish him much success. He could be a great ally in facilitating the discussion of our energy future.
Stuart has here what is known as a 'sucker bet'.
1. If the Saudis get their oil production over ten million barrels a day, he wins.
2. If the Saudis don't get their oil production over ten million barrels a day, he pays you off with a post hyperinflation aluminum alloy 1,000 dollar coin he got back in change at Starbucks.
Huh?
That's not how I read it...just the opposite.
If they get it over 10.7mbpd, Stuart loses and pays $1000.
Anything under 10.7mbpd, Stuart wins $1000.
It's a "buddy" bet. With no closing date "....by 2015" you will never have to pay, ever, even if he is right. He feels comfortable that he is correct, for he is the only one at risk.
Euan, great post.
According to EIA crude oil had so far nominal high endings in early August 2006.
………
Brent spot ended at $79,26 on August 09. 2006
WTI spot ended at $77,05 on August 07. 2006
……….
According to EIA STEO Mar 2007 the OECD Commercial Oil Stocks were building towards a high in early July 2006.
Looks like OECD was buying oil for storing while prices were high, and drawing them as prices cooled down.
……..
Further, EIA IPM March 2007 reported SA (C+C) at 9,300 Mb/d for Jul and Aug 2006 and down to 8,750 Mb/d in Dec 2006.
From Aug 2006 to Dec 2006 the remaining OPEC members reduced their production with 0,495 Mb/d.
SA having approx 30 % of OPEC production took 50 % of these cuts.
EIA STEO March 2007 lists SA production at 8,600 Mb/d for Feb 2007, down 0,700 Mb/d in six months. The same STEO indicates SA cuts of 0,158 Mb/d of the February 2007 OPEC cuts (0,500 Mb/d) which is close to the fraction of their production.
From May 2004 to Jun 2004 SA (C+C) jumped from 8,500 Mb/d to 9,500 Mb/d, which just temporarily helped cool down oil prices that then ran indecently high at $35 - $40/b.
For the same months all reported OPEC production increased 1,189 Mb/d, in other words SA alone stood for more than 80 % of the reported increased OPEC production.
The future SA production numbers will obviously become very interesting, but I got a feeling that SA production numbers also should be seen in relation to total OPEC production.
NGM2
High oil prices worked their magic, dampened demand growth and stimulated a global exploration and production effort with the oil industry working flat out, everywhere. There is no shortage of oil throughout the OECD. US and European inventories remain high.
How are you measuring Inventories? On an absolute, or days supply basis? Also, what do you mean by shortages? You use the word "shortage" as though that were relevant to a bull market in oil. Shortages means that some buyers cannot buy oil, that there's none available. The use of the word shortage, in the context you are using it, presents a false dilemma.
Also, how are you measuring the oil price? Front month contracts? You are rebutting the large question of KSR declines, and using front month oil price, to do so?
My response to a series of RR comments on the previous thread, regarding these issues of Price, Inventories, and the Futures Curve is here:
http://www.theoildrum.com/comment/reply/2325/165766
I must say, I am seeing a real dearth of mention of the crude oil futures curve, out to 2012, here at TOD. More than germane, it is central to any discussion of Peak Oil. Topical too given that the CFTC recently did a major study of participation, in the long end of the curve.
Gregor
If its possible to determine how many delivery contracts KSA needs to meet this summer ? This may mean that KSA is probably in a tight position to meet contracts for deliveries this summer. If we could find out or prove this is true it again points to KSA husbanding their resources to sell during the summer surge. It would be more evidence that KSA is doing everything they can to make it through this summer without having to admit to peaking.
I very much agree with your perspective. Can you give a link to the CFTC report - do you mean this one from 2005? Also, I would like to get data to make the graph of some index of the degree of backwardation vs contango over the last five years, but can't find this data publicly available - any suggestions?
Hi Stuart,
Below are links to the much anticipated CFTC report on changes in market participation in the long end, the out-years, of the Crude Oil Futures Curve. This was released on 06 FEB 2007. Both NYMEX and ICE have contracts now available out to DEC 2012. 2013s are due to be available soon, probably this month.
Also, I would like to get data to make the graph of some index of the degree of backwardation vs contango over the last five years, but can't find this data publicly available - any suggestions?
Don't I wish it, too. To be able to see over-time changes in the Term Structure of the crude oil futures curve generally entails a hefty payment to some data provider. I know for example that Bloomberg Terminal users have access to most historical data like this. NYMEX no doubt franchises this data out to resellers, like Bloomberg. I must say NYMEX has been very savvy and early to realize the value in all their data. But that's another story.
My personal view is that the steep backwardation that existed in the curve until, say, 2003, represented the confidence in Saudi Supply. As the back end of the curve has risen, obviously it's been a multi-factorial phenomenon. From investment flows, to addition of length--out to more distant years. In a way, CFTC conclusions are rather obvious: more participants equals more reliable pricing. But I am glad the study was done nevertheless.
PS: I recall that some investors in 2004, when Front Month was say at 40.00, were buying the long end for around 25.00. (these were probably the 2010's, at that time). Well, that free lunch is long gone, now. DEC 2012 NYMEX WTI is indicated at 65.87, and ICE Brent 2012 indicated at 64.50.
The action in the 2012's over the last year has been fascinating, to say the least. They rose in sympathetic volatility to last Summer's spike in front month, But throughout the Autumn, and notably during January 2007's smackdown, they showed much, much more resistance to falling. I know some heavy holders of the 2012 Brents, who have noticed all this and are of course quite pleased.
Best,
Gregor
CFTC Site:
http://www.cftc.gov/cftc/cftchome.htm
Press Release:
http://www.cftc.gov/opa/press07/opa5287-07.htm
Report:
http://www.cftc.gov/files/opa/press07/opamarketreportenergyfutures.pdf
Gregor,
You make an excellent point. Michele Markey, at Apache, had this to say in August 2006:
http://www.apachecorp.com/Explore/Explore_Features/20060828/Topic_Report...
"The market has placed a premium on future crude deliveries, which has encouraged storage builds as a hedge against higher prices and supply disruptions. It is important to consider that the U.S. has only 21 days of supply in commercial inventories."
Noting that Saudi Arabia needs from 0.5 to 1 MMBpd in new capacity each year just to offset the decline in existing fields and that world surplus production capacity has dropped significantly in recent years, she observed:
"Since the market can no longer rely on increased production from large producers when there is a supply disruption, the alternative is to build inventories. Larger inventories act as a form of insurance against disruptions. Also, during a rising price trend, it is cheaper to buy more crude now rather than later."
Perhaps Saudi Arabia is scrambling to build an insurance capacity by resting some high water wells until the market is screaming for supply. Isn't it just as likely that they are acting to avoid a catastrophic increase in the decline rate by 'voluntarily' taking a greater upfront hit? I defer to the experts.
In light of Robert Rapier's emphasis on arguing from the facts, I wondered the other day about his assertion that inventory levels were driving Saudi Arabia's production decisions. Since the OECD only accounted for 24% of the increased demand for oil from 2000 through 2005, it occured to me that if Robert's assertion was valid then the Saudis, being intelligent and experienced traders, must have some knowledge of stock levels in the non-OECD countries. Afterall these countries accounted for 76% of the growth in demand from 2000 to 2005, raising their share of world demand to 41% from 37.5% during those five years.
But it turns out that there is no data on world stocks.
It was while looking for this data that I came upon Ms. Markey's analysis. She had some comments about our knowledge of inventories:
"the greatest issue for crude oil inventories is the wide range of crude oil quality. Sudden drops in the supply of certain types of crude can reduce refinery inputs even though it would appear that ample supplies of crude exist. This is possibly the case with inventory levels today. There currently is no way to quantify what types of crude are in commercial U.S. storage. We do know that the U.S. Strategic Petroleum Reserve (SPR) contains 273.6 million barrels (MMBbls) of sweet crude and 414.3 MMBbls of sour crude. Another difficult issue is quantifying the maximum global or U.S. storage capacity. No information regarding individual storage facilities is publicly available. Also, secondary terminal storage and floating storage is highly variable. Information such as the recent storage constraints at Louisiana Offshore Oil Port (LOOP) for Mars production is usually anecdotal at best."
All in all, given the incompleteness and poor quality of information about inventories, it seems unlikely that the Saudi's would use it as the basis of their production decisions.
Since the OECD only accounted for 24% of the increased demand for oil from 2000 through 2005, it occured to me that if Robert's assertion was valid then the Saudis, being intelligent and experienced traders, must have some knowledge of stock levels in the non-OECD countries.
In fact they do. In defending their decision to reduce production, they have frequently cited very high inventories across SE Asia. What I have yet to see is anything but speculation that any country's inventories were ever in trouble - and we do know that over the vast majority of the time the Saudi's were making cuts that the price was falling.
So, if people are going to assert that perhaps other countries without readily available information had inventory issues, then they need to understand that this is just speculation. What I have provided is verifiable evidence. Having said that, I have no doubt that some poor countries were priced out of the market, but that also has the effect of reducing demand, which leads to the need to reduce supply.
My recollection is that futures have nearly always been lower, changing to higher shortly after I became interested in energy late 04/early 05. IMO this epochal change is why refiners now have a strong incentive to hold higher stocks than in the past, tho this is interpeted by many to mean the market is well supplied.
I have daily crude oil contracts data going back to 1983. It's in a binary format, and it would not be legal for me to give you a copy of it, but I could write a simple program if the specifications aren't too onerous.
I have actually looked at contango/backwardization in my past research. And as I recall, "near contract" periods of contango existed going way back. Some of these may be associated with ME conflict, etc.
I didn't see the comments before. I am at work now, so will keep my comments brief as I have a couple of others to answer as well. You wrote:
That said, the repetitious citation of Inventories on an Absolute, rather than a Days Supply basis, is something we see most often from people who don't understand the market. Robert Kaufmann's longer-term studies in this area, for example, are telling. Days Supply is the proper way to measure Inventories, not Absolute Supply.
Here is what I am saying, that I think is being missed. When the Saudi production cuts began, inventories were rising. When inventories are rising, it does not matter whether you have 1 days supply or 100 days supply on hand. That is an irrelevant metric. What is relevant is that the tanks you have physically on hand are increasing in volume, which means you are purchasing more than you need, and that if demand doesn't pick up that you will have to reduce your purchases.
That is a major reason that I think they were telling the truth when they said they didn't have buyers. I have worked in a refinery, and I know what happens when your inventories are rising. You don't say "Ah, but we have fewer days supply on hand."
But other countries seemed to be able to find buyers.
There was room in the tanks for their oil.
Why did full inventories only effect SA oil?
But other countries seemed to be able to find buyers.
I have addressed this before. It is not true. I have shown that Canada, for instance, was not producing all out as inventories were rising. But because KSA produces so much oil, an X% cut in KSA will be larger than an X% cut in other countries. So, it isn't that Saudi was the only country affected; it is just that the effects are more noticable with them.
Your position is just silly. The world produced a record amount of oil jul/aug, just as prices maxed out. Nobody disputes this... Only sa was cutting production; every other producer on the planet brought every barrel they could squeeze out of their fields in pursuit of the record high prices, and it was this high production that naturally led to high storage. And now, with prices at 60, a level apparently satisfactory to opec, sa is heroically cutting more, as other members welsh on their cuts.
Your position is just silly.
Let's see about that.
The world produced a record amount of oil jul/aug, just as prices maxed out. Nobody disputes this...
They don't? July/August were not records. Or do you mean the highest production from a July/August?. Anyway, if you bother to look at the country by country data, you will see that a lot of producers cut production over the same time as Saudi. The reason July/August were up over the previous years was that Russia and Iraq cranked it up. Nobody else.
Only sa was cutting production; every other producer on the planet brought every barrel they could squeeze out of their fields in pursuit of the record high prices, and it was this high production that naturally led to high storage.
Demand fell due to high prices. And it is not my "opinion" that not all producers were producing full out. I know that to be fact. If you think that's a silly position, well knock yourself out. But you better go back and recheck your "facts."
OPEC had been producing flat out for an extended time, were already producing every barrel they could during the period of peak prices. IMO, everybody except sa produced every barrel they could. As far as I can tell from what you have said, you think sa did not do what everybody else did, even as they said, and said repeatedly, that a) prices were too high, and b) there were no buyers for their oil... I see no basis for your position, but you are of course entitled to hold it.
IMO, everybody except sa produced every barrel they could.
Again, as I stated, my information is not an opinion. If you bothered to look up the country by country data, then you wouldn't be forced to venture this opinion either as the data contradict it.
I see no basis for your position...
Again, because you apparently can't be bothered to look at the country by country data. I have stated numerous times that Canada was not producing every barrel they could; serengeti reiterates that below. I don't know what else to tell you. The data define the basis of my position.
Hmm, Robert,
So why dont you link to the data, or display a graph...?
Hmm...
The OECD Inventories graph is at the site that Memmel mentioned on the weekend.
"Every"? You're guessing, and you're wrong. We cut production 15% in certain of our producing fields in Western Cda because pipelines were full. We were forced to truck production east to tap a pipeline carrying product to Chicago.
Sufficiently "every" that peak monthly production was set in jul, and nearly matched in aug, and not since... It is not surprising that infrastructure, including pipelines, were full during this singular event. I said every barrel they could produce, and this limit is not in all cases what the fields can produce but sometimes what their local infrastructure limits are.
I said every barrel they could produce, and this limit is not in all cases what the fields can produce but sometimes what their local infrastructure limits are.
Yet you insist on ignoring the fact that KSA has their own unique limits. They don't sell on the spot market; they have customers. If customer purchases were slowing down - and inventory data suggest that this was inevitable - then their production is going to slow down. Of course they have also stated that customer orders were slowing down.
The point is that in a contango market the richest will be oversupplied vs the losers. So I think your reading too much into the fact that the wealthiest countries are in contango.
We need to look at markets that are under supplied at a price point but this is harder to info to find.
Thus my push for asphalt markets in wealthy countries as a true indicator.
I'm hoping you may get a chance in your new role to meet some oil workers returning from SA and get some ground-level information directly that you can share with us. I keep hoping for someone currently working there or recently returned to participate in the discussion to the extent they can.
Gregor - your comments are noted. High spot prices, lead to high gasoline prices which IMO probably led many folks around the world to use less gas. Your average driver is not considering contango.
The slide in spot prices since June last year IMO most likely reflects a widening of capacity - caused by new production coming on (e.g. the huge Azeri - Chirag field in Azerbaijan) and / or a softening of demand - caused by aforementioned high prices - what other way is there of looking at this?
WRT futures in contango - I agree entirely that future supplies will get ever tighter and less secure. The main point I am making in this post is that I beleive Saudi production will rise again with rising demand.
To me the sum of your argument rests on the assumption that KSA has reduced production by shutting in wells that have high water content.
I agree with the concept that they probably pump from regions and fields with lower water cut esp new fields brought online in preference to watered out regions.
But I don't see how this argument means ghawar or at least the northern half is in decline. One piece of evidence that could clarify maybe is quality ratio of the oil they have shipped last year. If its tending toward grades that are not produced from ghawar the then their is a good chance ghawar is declining.
So the bottom line is that its a safe bet that wells were shut in that have high water cut. By resting these wells they can offer a brief surge this summer bringing them back online. Also I suspect they are filling or have filled all the tank storage they have in preparation for a summer surge. My opinion was that any additional production would come from tanks this summer. But I'm fine with the concept that some wells that had a high water cut can be rested and produce at a higher rate for a short period of time this is a known solution.
All this points out is that KSA is preparing for a mini surge to head off high oil prices this summer or probably more realistic to take advantage of higher prices this summer.
Thus since I believe they are declining and they have chosen a fairly reasonable way to manage their dwindling resources.
They cut back production rest wells and fill tank storage while demand is relatively low as demand picks up in the summer they surge the rested wells and empty the tanks at the highest yearly price. As they decline the floor price rises higher but they get the best returns with this model.
This of course means KSA believes that the world has peaked thus they are safe in following this course.
Next year of course we will see the same pattern but with a more constrained oil supply and lower surge peaks.
The important point is that if KSA thinks it can get away with managing its production to sell oil at the highest price each year this means they believe the world has reached peak production.
I agree that their production cuts may have not been 100% because of decline but if its 80% and they can increase production for a short time in the summer they stand to make a lot more money. Only if they believe that the rest of the world cannot undercut them and is decline.
If this is the case we will see that after the summer surge if we have the peak prices in the fall I've predicted KSA will not be able to increase production. Nor will they be able to increase next winter but they will have to husband their resource to surge once a year in summer. And with that I can't see them maintaining a higher production rate for more than 90 days since draw downs from their tank farms would be a big part of the supposed production increase.
If my hypothesis is correct then their is a good chance that KSA will increase its tank storage capacity. This can be used to level production shortfalls.
They are in fact doing this for china
http://www.tmcnet.com/usubmit/2006/01/23/1308516.htm
I can find no information on if more farms are being built inside KSA. But even the work with china points out that they may feel they cannot meet peak demand anymore and must use large tank farms too try and bridge production/demand gaps.
Also its not clear that the storage is needed depending on their true capacity. So a negative does may not mean much but I can't see any reason for them to increase storage internally since they are probably restricted by the export terminals.
In short I do not see that the argument presented here proves anything in fact it furthers the case that KSA is probably declining and has changed to the model that makes the most sense which is to husband their production so they can surge it at the periods of highest prices. It does say that the surge will not just be from tank farm draws but also from temporary increases from some well that are still producing but shut in. This makes sense. How does it prove they are not in decline and also again more telling that they are safe playing this game since they believe the world is in decline ?
But I contend that they can only do this now once a year and each year the surge will be lower and the base production rate will be lower. And more telling they will not be able to handle increased fall or winter demand with increased production. This trick will work this summer but 2008 is iffy and I doubt that its worthwhile by 2009. It basically a one shot strategy for the first and maybe second year post peak. Notice that the decision to increase the SPR and china 's tank storage will help later as full production for the entire year is needed to meet demand. After that ...
There seems to be quite a fixation here on looking at the raw production numbers in bbl's, be they of "C+C", "All Liquids", etc. which, beyond a certain point does not seem too helpful.
I say this because it seems to me that what is really of "real world" significance is not how many barrels of flamable liquid are being produced, but how much net chemical potential energy is being made available.
By tracking only the barrels of output, and not subtracting the barrels of fuel invested in the whole petroleum industry [treating them as an "externality", and thus ignoring them] it seems to me that with every month that passes these graphs, accurate though they may be in one sense are giving a more and more optimistically distorted picture;
Drilling in exotic locations uses more fuel, recovery measures from old wells uses more fuel, extracting upgrading the greasy sand of Canada, shipping a greater fraction of the total around the world in tankers as more countries become importers, feeding the increasingly bloated "financialization tail" of the industry i.e. the oil speculators and associatied camp followers, "Stabalizing" the oil producing regions via military and other interventions, yada yada, yada, all these things are getting more energy expensive by leaps and bounds.
Anyone got any idea what a graph of "net liquid fossil fuel energy extracted" would look like? I'd be amazed if such a graph did not show a clear peak some decades ago...
It is a factor. And it is important for deep offshore drilling oil sand and ethanol. Which is what is supposed to save us in the future. But right now most production is coming from wells and fields developed using cheap oil. The bigger factor right now is increased consumption in producing countries WT export land model. Your concerns will rise and become dominate later down the peak oil curve post peak. I think they are valid just the effects will not be important till we are well past peak oil.
Obviously they show that post peak we will have a second crash that might be even stronger in total energy or EROI. In fact their is a good chance that this EROI peak will be harder and have bigger effects than the absolute peak in Oil.
Just we are not at that point yet but yes peak EROI follows with a vengeance after peak oil. But peak EROI will give us something to talk about once peak oil is obvious.
Just we are not at that point yet but yes peak EROI follows with a vengeance after peak oil. But peak EROI will give us something to talk about once peak oil is obvious.
I like the way you think.
The points been oft-made, especially in the context of the global production curve, and I don't think anyone disagrees. But we don't have any data with which to construct a "net liquid fuels" measure.
And to repeat its importance is post peak since we will be using the results of equipment and infrastructure developed with cheap oil until well after peak oil is obvious.
I think peak EROI will be harder on us than peak oil but its not a issue just yet.
When we start growing corn with tractors created using a majority of inputs based on corn ethanol thats when real problems develop. Peak EROI is a nasty feedback loop.
"When we start growing corn with tractors created using a majority of inputs based on corn ethanol..."
The point you describe, Memmel, is way, way down the eroi slope. We have obviously passed peak eroi in the liquid fuel trade. Just the increasing presence of tar pit extracts, subsidized crop derivatives, and ultra deep water oil in the all liquids barrel pays testimony to this reality.
I need to collect my thoughts on peak EROI I just grokked it in this discussion. Right now I'm scared shitless on the concept. But I have realized that high tech civilization is a energy junkie and we have to admit to it.
Let me think but peak EROI is a strange attractor for sure.
http://en.wikipedia.org/wiki/Strange_attractor#Strange_attractor
To explain a bit more beyond peak EROI we have the next peak which is peak quality even with recycling the stores of high grade raw materials decrease. So its nested set of strange attractors. Fore example if we choose coal the uranium the input of ore virgin ore decreases and creating a new EROI drop.
Their is no way out of this except fusion and moving beyond earth but this just increases the period of the before the next attractor cycle.
High tech is eventually doomed as of right now.
This means we are intrinsically screwed as long as wealth is material regardless of the technological level.
This means that duh
http://en.wikipedia.org/wiki/Kurt_G%C3%B6del
Godel ensures that high tech civilizations must collapse since they operate on a inverted Godel plane.
Complexity tends towards a inverted Godel plane since a species cannot have zero members at zero it goes extinct.
Only inflation from increased energy usage delays this final collapse.
Thus complexity results in black hole of zero, a species cannot escape. I might add that evolution offers a mini escape but the inverted Godel plane rules all.
Inverted Godel Darwinisim is born :)
I'm a smart bastard but I don't know how we can escape this.
Maybe just knowing the problem results in a solution that un-inverts the Godel N dimensional plane say one of the inverted inverted infinities expand. I.e. big bang.
Thus the trick answer is if you figure out the question it results in the answer.
Anyway I'll be long dead before we have to solve this.
memmel,
Usually I understand you but maybe you shouldn't have taken that hit of acid before the last post.
No kidding. Now, if he'd shared it, the rest of us might have a clue.
Memmel:
Wittgenstein argues against the existence of a "private language." Your post proves the accuracy of his assertion.
Can you rephrase or explain "inverted Godel Darwinisim?"
[chuckle] see cid yama above.
Two things to note:
If you'd mind restating yourself in a form that makes sense, memmel, perhaps we could get somewhere.
Via Google Search
In 1931, the Czech-born mathematician Kurt Gödel demonstrated that within any given branch of mathematics, there would always be some propositions that couldn't be proven either true or false using the rules and axioms ... of that mathematical branch itself. You might be able to prove every conceivable statement about numbers within a system by going outside the system in order to come up with new rules and axioms, but by doing so you'll only create a larger system with its own unprovable statements. The implication is that all logical system of any complexity are, by definition, incomplete; each of them contains, at any given time, more true statements than it can possibly prove according to its own defining set of rules.
Gödel's Theorem has been used to argue that a computer can never be as smart as a human being because the extent of its knowledge is limited by a fixed set of axioms, whereas people can discover unexpected truths ... It plays a part in modern linguistic theories, which emphasize the power of language to come up with new ways to express ideas. And it has been taken to imply that you'll never entirely understand yourself, since your mind, like any other closed system, can only be sure of what it knows about itself by relying on what it knows about itself.
Does this mean that Memmel is another genius like that professor fellow played by Gladiator in the movies?
I suppose you mean actor Russel Crowe? http://imdb.com/name/nm0000128/
And the movie you were referring to is "A beautiful mind"?
J. Dähn
Yes, I'm familiar with Godel's incompleteness theorems. None of which have anything to do with planes, inverted or otherwise.
Godel focuses on the fact that mathematical truth is possible outside of any set of theorems. Other stuff can exist outside also I call them impossibilities. These are statements for which a theorem makes no sense since you can't create axioms.
For example assume you have a square in a 2 dimensional world
prove the square will never become a box.
This makes no sense its impossible the restriction to a 2D world means that the concept itself is impossible. But how would you prove it ? What I just said is not a proof. Lots of stuff actually falls into the class of impossible world peace a impossibility as in a sense truth other concepts such as the end of poverty.
By Godel plane I mean all everything that exists and has structure but lies outside of theorems I call them impossibilities and they are not mathematical truths.
They have their own faux proof like concepts idealism for example extends from the individual to groups etc.
The most primitive group is basically noise.
This is what I'm calling the Godel plane by plane I mean groups of concepts that exist outside of mathematics. The impossibilities are ones that you cannot even construct reasonable mathematical statements for.
In a sense they are nonsense which it seems categorizes my posts on the subject :)
By inverted Godel plane I mean its a group of impossibilities or idealisms and unprovable concepts required to support some sort of idealism but the required support has a negative feed back that ensures its destruction.
For example our modern monetery systems are based at the end of the day on endless growth this is impossible thus the basis of the system leads to its destruction.
In general a modern society is simply and extension of this and the impossible assertions and beliefs needed to keep it going are also responsible for its demise once the impossible "truth" no longer holds.
Back to the 2D square becoming a box. I could show you a picture and ask you to prove its a picture of a box or a sqaure. Say its a perfectly white box or square on a perfectly black background or surface. Given this single perspective their is no way to construct a proof. Thus its a impossible or is it ?
Lets say that a society depends on this impossibility the inability to ever determine if its a square or a box.
The boxers and the squarer's fight wars and build new weapons based on their beliefs. Now lets say someone introduces a new impossibility the circle vs the sphere.
Suddenly the whole system collapses.
Thats what I mean by inverted Godel plane. These nonsense concepts or idealisms exist or extend beyond Godels work creating what I call a plane. The reason I call it a plane is the axis are the unprovable truths and the impossibilities. Inverted simply means that the set of assumed impossibilities and unprovable truths that are known are articulated and used result in the destruction of the faux system based on them. Note that the faux belief in a impossibility leads to a real physical effect in my case a ware between the boxers and squarers thus they are real in a sense.
For a modern society the core impossibility is infinite growth.
Information theory kinda has this concept in the sense that its impossible to build a computer in our universe that can calculate past a certain point since it collapses into a black hole.
http://en.wikipedia.org/wiki/Entropy_in_thermodynamics_and_information_t...
This Godel plane is in a sense a unification of information theory and Godel's theorems. Inverted Godel planes assert that the belief system both provable and unprovable in the Godel sense plus the impossible constructed to cause a system to behave in a certain way requires the destruction of the said system when the unprovable beliefs become obviously false or when a set of theorems is constructed that result in a proof of a truth that was unknown and we made the wrong assumptions.
Encryption is a example of this.
I know its hand waving but you can see the two are related.
And this is why I don't do mathematics.
Here is a paper on the subject.
http://www.cs.auckland.ac.nz/CDMTCS/chaitin/georgia.html
I got tired of proving stuff just to find out someone did it 1000 years ago.
In other words you are talking about a mathematical system based on a priori assumptions that are false making it impossible to formulate a proof that is true or rather to prove a fomulation that is false. Oh sh*t, I think I'm actually grasping what he is saying. Wouldn't it be easier to say(if you weren't a mathematician) that a person with certain basic beliefs can only come to conclusions that are consistent with those basic beliefs even if those basic beliefs are false and cannot see a truth outside that system of belief without it destroying his philosophical system.
What you are describing is known as cognitive dissonance. This is a key aspect of most theories of learning.
It may also be used to explain societal collapse. People belive the "Big Man" has a direct connection to the GODS and will protect them. Then comes hailstorms and famine and the Big Man is clearly unable to stabilize the situtation at which point the society questions all of its associated beliefs. Questioning fundamental beliefs undermines an ability to cope and the eventual outcome is the loss of any cohesive social structure. Any survivors then get a chance to start over.
Agree with Pitt that Memmel would be better off framing his statements in straight forward language. If it is possible to think then it is possible to think clearly. And if it is possible to think clearly then it is possible to communicate those thoughts.
EDIT: Changed "Plucky" to "Pitt"
It's best to use straightforward descriptions, rather than making up your own terminology.
Especially when your terminology uses the same words as the terminology of the area you're talking about, but completely different meanings. "Plane", "group", "proof", and even "theorem" and "construct" have very particular meanings within a mathematical context, and using those words to mean something else will just get you dismissed as a crank. (Trust me, my friend doing his PhD in math has seen his share of those.)
Boy, I think I would have been better off with the hit of acid.
Hi m,
I'm a fan of (at least contemplating) Godel and of your contributions here, in general, so at first glance, this is interesting. Also, I like the idea of thinking about "Peak EROI" (diminishing EROI) as it effects the economy and future, and seeing if there's a way to get a handle on this, analytically. (And I hope you'll devote some time to this at some point.)
However...re: "By inverted Godel plane I mean its a group of impossibilities or idealisms and unprovable concepts required to support some sort of idealism but the required support has a negative feed back that ensures its destruction.
For example our modern monetery systems are based at the end of the day on endless growth this is impossible thus the basis of the system leads to its destruction."
I'm wondering if you don't use the word "impossible" in a couple of different ways. You first define it as "a group of ...unprovable concepts". (If I may pick and choose from your list.)
Then, you use the word "impossible" to describe "endless growth".
In the first use of the word, "unprovable" (AKA "impossible") really means it lies outside the realm of one's chosen analytical basis, (wouldn't you say?)
Your next use of "impossible" is actually fairly straightforward, and a more common usage.
Yes, "endless growth" is impossible (meaning endless physical growth that has as a requirement energy input from the physical world can't be true). (?)*
It just seems to me this is a rather "ordinary" concept and provable in a normal sense. (Though not perhaps in the sense of mathematical proof, but then it's not a mathematical statement to begin with.)
A lot of people holding in common an idea ("endless growth"), that's not really well thought out...yes.
Well, that seems to be more or less a feature of our ordinary human condition.
On the other hand, it may be that the concept qua concept is not really so important. People in a certain time frame and location (say USA over some decades) actually do live out and experience the growth. It may as well be endless (until it ends), so perhaps they adopt the idea ("growth Is a basis for economics") more as a rationalization, than as an idea arrived at via long, hard thinking.
My dos.
------------------
*(Let's see...organisms that only use solar energy...well, nevermind...okay, I mean, let's talk about humans and our world as it exists. As you were speaking about economics.)
Again... thank you for piling on the data and asking the right questions.
This is what I love about The Oil Drum (it seemed to be lacking over the past few months... not sure why... just did).
Every time someone posts from a particular point of view... the call should go out...
"PROVE THE ABOVE WRONG" and hopefully there are plenty out there to take up the call on all sides.
Euan Mearns wrote:
What the hard evidence requires depends on how much is at stake for you and yours. And you act accordingly.
This is really not an academic discussion because there may be substantial risks -- beyond one's career -- associated with being wrong for all involved. One assesses the risks and one jumps (or not).
Stuart, where are thou?Asebius - one risk lies in Saudi production rising to 9.5 million bpd later this year and sceptics pointing out that those folks at The Oil Drum said that Saudi production was in terminal decline.
Do you remember the poster called Cry Wolf?
I will respond in detail to Euan's contentions in a post-in-preparation.
I just wanted to make one point here - the bet is serving its purpose of flushing out what people think, and what it reveals here is that Euan and I do not disagree very much. He considers it "long odds" that Saudi oil production would go to 10.7mbpd for any length of time. But that is what they stated is their sustainable capacity today. So he, like me, doesn't really believe them.
My guess is Euan and I could not bet because our views of the relevant probability distributions overlap substantially. Maybe my estimate of the 5 year off Saudi production is 7 ± 1.5 (1 sigma error bar). Maybe Euan's is 8 ± 2.5. So our distributions overlap greatly, and there is no bet on which the opposite sides are going to look attractive to both of us.
But there are people who believe, or at least publicly claim to believe, that the answer for 2012 Saudi production is 12.5mbpd. And I want some representative member of that faction to put his/her money where his/her mouth is.
I will have more to say - much, much, more - on Thursday morning (US).
He makes a very valid point that some production is probably shut in to rest depleted wells to allow short surge. I agree but in my long posts I don't see how that changes to overall situation.
Just to add to my own post. They don't have to produce at capacity year around to meet demand at a certain base price point.
I bet you 500 dollars that KSA will state this year they feel that 70 is a comfortable floor for oil prices.
Well, I wouldn't totally discount that we see an annual average that beats 2005, some time before 2012.
KSA are either producing flat out at capacity (all wells they have flowing oil) or they are not. If you accept that they may have some reserve capacity then all of Stuart's arguments fall away - because we just don't know how much reserve capacity they might have.
Even if there the KSA has some spare capacity, another question would be if it's a decent enough quality that they can sell it. I remember a while back, that Chine lowered the amount of oil they were requesting from SA, as the refineries needed to process it longer due to high sulfur contents. I'm not sure that it matters if KSA has 2.5Mbpd in excess capacity, if the capacity is such that no one will buy it. If no one will buy it, SA won't pump it out of the ground too long.
Well, unless somehow they're desperate enough to do it just to get Stuart's $1k ;) I don't see that happening though.
Hi Euan,
re: "...because we just don't know how much reserve capacity they might have."
Could you (please) possibly describe specifically what information would be required in order to know this?
Aniya - on a short time scale (say 3 months), resereved capacity will be determined by the increase in flow that can be achieved by bringing back on retired wells, opening the chokes on producing wells and importantly the capacity of your processing and export infrastructure - no good bumping production by 2 million bpd if you do not have the pipeline and loading facilities to deal with this. Ability to handle vast volumes of produced water may also be a limiting factor.
Kyle posted some fascinating data on well retirements further down this thread. What I understand is that they have a large inventory of wells that are shut down - owing to poor performance (relative) and which may be switched back on if needs be - but this is conjecture.
So to answer your question, we would need a list of wells that are producing and those not producing together with estimates of their flow potential together with an estimate of their process and export capacity. What Stuart is implying is that they have no such reserve capacity and are producing flat out form every well they can muster.
I agree. So many people say they think Saudi will produce all this oil but no one is willing to place a bet themselves. If I had the funds, and if I were a bit younger, I would bet that Saudi never again repeats its feat of 2005. That is produce, for six month running, 9.6 mb/d. But at my age I don't even buy green bananas.
We are all waiting with abated breath.
Ron Patterson
Who is "they"??
Ron, over the past year I can remember a hundred posts of members saying KSA *cannot* get to 12.5 mb/d or 15. But I can't remember but one that was ok with that figure.
That was David Smith of EnergyFiles.
Stuart is alluding to a *faction* that does not exist at TOD and never has. Sure, we can throw in (out?) EIA, IEA, CERA maybe & a few IOC's, but I am at a loss to recount this pro-KSA sentiment among our midst.
Nobody will take that bet.
F, plenty people read the oil drum, apparently including wsj and, imo likely, cera. What bette way for cera to show their confidence than to take a well-known po'er to the cleaners, and show how silly the movement is? IMO, this is a bet they are not interested in taking, and one that will not do their position any good.
And therein lies the answer to Stuart's bet. CERA could and should take the other side. If Stuart is right he gets x years free subscription, if he is wrong he has to pay to subscribe.
Still the problem lies in the fact that Stuart can never be right. There will alwasy be a (theoretical) chance that KSA could ramp to 10.7 for a "sustained" period (what is that, btw? 3 months, 6 months, 1 year...?) This possibility will exist even if KSA production has dropped to sub 5 mm bpd for several years in a row.
Thus Stuart should amend the terms such that he gets paid out if KSA production drops below a certain number for the same defined "sustained period".
So, if 10.7 mm bpd is the high side, what is the low side?
jk, it was 27 today and I prefer that to his minus 27, y'know!
Anyway, a few weeks ago, a five-year workup was done by several TOD posters showing us that KSA would be at 11 mb/d supply by December 2011 (11 + 2.55 SC = 13.55 MSC).
Why would anyone at TOD bet against our own due diligence?
Why would anyone *not* at TOD bet against the schedule of Obaid, Saudi Arabia's main security officer that it was based on?
KSA will only exceed 10.7 in the next five years if they surge. A surge will not meet the terms of the $2,000 bet.
Does anyone here really believe that that there is a dummy out there that neither reads TOD nor CSIS or Saudi Aramco press releases yet is bait for a fool bet?
Stuart, you live in a simpler world than at least some of those persons. The following is quite obvious to me:
• demand has in recent years increased faster than supply, causing prices to increase;
• supply may never feed the full extent of rising demand given the time required to bring new production on line;
• peak oil will happen.
The rest is guessing. Saying Saudi can and will produce whatever is just a guess. Nobody except those intimately involved in producing oil from SA have appropriate evidence to say what SA's future capability is.
Or maybe not. The SA oil industry is a huge organisation. Aggregating data and expert opinion to the level in the hierarchiy where public statements are being made is very likely to result in overly optimistic results, particularly in organizations which don't encourage open discourse or which even tend to shoot the messenger (it might be a prejudice that Saudi Aramco works that way, though).
It could actually be the case that no one really knows what's going on.
Cheers,
Davidyson
Yeah. Who in KSA will be the first to say "Daddy, daddy, look! The emperor has no oil!!" (or for you picky ones "The emperor has no spare capacity!!" ...just doesn't have as nice a ring to it).
Stuart - re: comment :
''But there are people who believe, or at least publicly claim to believe, that the answer for 2012 Saudi production is 12.5mbpd. And I want some representative member of that faction to put his/her money where his/her mouth is''.
Unfortunately I dont think many of the people you describe are avid readers of TOD. And those that were, and might have taken you up, are no longer here.........
But hey, with links from the Wall Street Journal to his posts, Stuart is sure to find a taker!
The smart money will gladly take a bet with a fool and his money... (this can be read either way of course)
I await with interest!
Over on EnergyResources, I mentioned Stuart's bet, and Mike Lynch says: I should take up that bet, but I already have one with Matt Simmons.
(I don't know why that would preclude Mike from joining another bet on the same topic).
- Dick Lawrence
ASPO-USA
A contributor on Gristmill, Jason Scorse, wants to bet :
I told him about Stuart's and Memmel's bets, he says he'll check them out...
does "during any year" mean yearly average price ? how 'bout during any day, hour, minute, second ??? (
Upcoming 2007Q4 Oil Price Shocks and Saudi Arabia's "Surplus" Capacity
Thanks, Euan for the post - it's important to have discussion representing both sides of Saudi Arabia's potential production capacity.
EIA has just released the Mar 2007 Short Term Energy Outlook.
http://www.eia.doe.gov/emeu/steo/pub/contents.html
According to the EIA, Saudi Arabia's C&C production for Feb 2007 was 8.6 Mb/d with surplus C&C capacity of 1.9-2.4 Mb/d. (Jan 2007 was 8.75 Mb/d C&C.)
http://www.eia.doe.gov/emeu/steo/pub/3atab.xls
No other country claims to possess surplus capacity close to Saudi's surplus capacity.
This EIA slide shows that world spare capacity is about 2 Mb/d for both 2007 and 2008.
http://www.eia.doe.gov/emeu/steo/pub/gifs/Slide13.gif
The EIA's forecast total liquids supply and demand:
http://www.eia.doe.gov/emeu/steo/pub/3tab.xls
For 2007Q2 EIA forecast world demand has dropped to 84.8 Mb/d. EIA’s 2007Q2 supply is 84.9 Mb/d and my forecast supply is 85.5 Mb/d. So there should be enough oil to meet demand in 2007Q2 – no price shocks. 2007Q3 should also have no price shocks.
2007Q4 becomes interesting. EIA forecasts demand at 88.6 Mb/d and supply at 87.2 Mb/d for a gap of 1.4 Mb/d. Thus this gap of 1.4 Mb/d would have to be met by stock draws or demand destruction. (EIA assumes that Saudi Arabia is drawing on its “surplus capacity” as EIA forecasts OPEC-11 production to increase from 33.1 Mb/d in 2007Q1 to an optimistic 34.9 Mb/d in 2007Q4.) Note also the increase in EIA forecast demand from Q2 to Q4 - a whopping 3.8 Mb/d!!
My forecasts for 2007Q4: World demand is 87.0 Mb/d and supply is 85.4 Mb/d for a similar gap of 1.6 Mb/d which would be met by stock draws or demand destruction.
The worst 2007Q4 scenario is using EIA forecast demand of 88.6 Mb/d and my forecast supply of 85.4 Mb/d. This gives a massive gap of 3.2 Mb/d! (This assumes that Saudi Arabia has no surplus production capacity of about 2 Mb/d).
If Saudi Arabia has surplus capacity of about 2 Mb/d and uses it in 2007Q4, the world will have an unfavourable supply demand gap of 1.4 Mb/d at best and if no surplus Saudi capacity exists then the gap becomes worse at 3.2 Mb/d.
If it is assumed that Saudi Arabia has say 1 Mb/d true surplus capacity, then the gap drops to 2.2 Mb/d in 2007Q4. This will still result in 2007Q4 oil price shocks.
Conclusion
Even if there are no supply disruptions through to the end of 2007Q3, severe oil price shocks over $US70/barrel could easily occur in 2007Q4. I guess that the probability of prices exceeding $US70 in 2007Q4 is at least 80% because it is assumed that Saudi Arabia has maybe 1 Mb/d "surplus" capacity.
Also given that the world focuses on demand of total liquids rather than C&C demand, I don’t think that there will be a serious response to peak oil reality until these price shocks occur.
Right on !!
Thanks for the numbers. My contention is that peak oil will manifest itself as a new fall peak that never existed before.
Your putting real numbers to this contention. Further more if this summers KSA surge is the sham I contend it is consisting of tank draw downs and over producing fields and as mentioned in this post short term higher production from rested wells. KSA will not increase production when this peak happens.
If we get slammed by a hurricane all the worst but the fundamentals are there for a large peak caused spike in the fall.
You have made a very important post.
Ace - thanks for all this input - so we will find out Q4 if KSA can respond or not.
I think the first test is likely to be Q2 when US stocks are built up ahead of the hurricane season. Weather forecasts susggest a more active season than last year, so I imagine the desire to build stocks will be strong (similar to last year).
Q4 will be a test only if hurricanes arrive and damage production or refining infrastructure in the Gulf of Mexcio or on the Gulf Coast (or if there are sercious production outages due to multiple demanning of platforms).
If there si no real damage from hurricanes, then Q4 will likely be a damp squib as stock levels will be more than sufficient to meet increasing demand (just like 2006).
Time will tell.....
Euan fantastic post by the way !
This is why the OilDrum is how to say it for real.
Robert promised a post on the error in HL analysis.
And I wish all the number crunchers on peak oil will try to take a stab at error analysis.
In this post you have not estimated the number of producing but high water wells that may have been idled for example.
If you had thought about error some maybe you could have made at least a reasonable guess. I'm not detracting from the post its great but I will start trying to harp on people
at least guessing error's percentages etc. We have to deal with very high error terms here and the lack of discussion about errors leads to erroneous discussions :)
The point is your article has a error range of wells shut in because they were not worth producing and ones shut in to rest the wells. We can guess to some extent since we know from Texas how many wells benefit form pulsing production.
Since you did not give a reasonable estimate its hard to determine how much production loss can be attributed to shutin wells that are being rested and producing wells that are shutin and won't benefit and wells simply watered out.
Robert Rapier of course is the prime target for my error bar campaign :) But everyone needs to try to discuss error please. I will of course continue to make seat of the pants wild ass guesses so that approach is covered :)
Difficult to asign errors when you have no data. Does anyone know how many oil wells there are in Saudi Arabia?
So high? There seem to be quite a few people here who appear to take Saudi Aramco at their word. They said they would increase capacity to 12.5 mbpd by 2012 (hope I got those numbers right), and then further later. 10.7 mbpd will be enough below target capacity for them to likely produce at least that, in a sustained fashion, particularly as the rest of the world production declines.
If anyone accepts what the Saudis say, they should be very confident of taking this bet; it's not a high bar at all. Why don't they?
Tony
Well how about my bet now open to all. That KSA announces they are comfortable with a base price of 70 this year. I'll throw the money in the pot to cover half of Stuarts bet.
Anyone ?
hey euan,
great stuff, even if i'm more inclined to sit on the other side of the fence. it doesn't seem like we'll need to wait very long for the world to really want some extra Saudi production. then we'll know (almost) for sure.
i'm definitely interested in more info on the rig counts. I acknowledge that rig numbers have been low until recently, but I'm not sure how valid the comparison of Saudi to the US is. The US oil producing region is probably that same multiple larger than Saudi Arabia (I read something about that recently). There may also be a bunch of rigs digging away in Saudi that don't fall under the Baker Hughes count?
it's obviously true that the first seven Saudi peaks were voluntary, but that observation won't help us anticipate the first one that isn't. i have to admit that i find the HL plot for Saudi pretty powerful in this regard. are you saying you don't believe the HL plot has any predictive capacity? even what the US companies knew about Saudi geology before they got booted out supports the HL reserves estimate to some extent. we're still producing from mainly the same fields that they had discovered back then?
how about the fact that they didn't expand production after US hurricanes? and why was their production broadly flat for well over twelve months while prices continued to set new records?
then of course there is matt simmons and others saying the saudi fields are struggling. nobody said that before the other seven peaks? the pattern of vertical wells, which worked for decades, being replaced on an enormous scale with MRC wells is also suggestive of trouble?
in short, i don't think it's true that there is no (hard) evidence to say this time they're not in control. given the level of secrecy, i think we've got all the evidence we are ever going to get.
keep it up!
cheers!
phil.
by the way, if BP is for after 1965 production, where did you get the figures before that? i want to do my own HL plots :-)
cheers
phil.
Phil, send me an email and I'll send you the data.
I've posted this many times before. My favoured interpretation is the red line drawn through 1991 and 1995 - which were 2 years Saudi was pumping at capacity - and this does suggest that Saudi are around the 50% Qt mark.
The wild card is the fact that this only samples the developed reserves and undeveloped reserves could stretch out QT over the long term. However, this is unlikely to influence the timing of a production peak.
Imagine KSA with 500 drilling rigs.
Been there. Done that.
Literally every available rig was put to work in Texas in the Seventies. We succeeded--the number of producing wells increased 14% from 1972 to 1982, as production fell by 29%.
Okay, Texas is not Saudi Arabia.
But the Lower 48 is not the North Sea either, and the Lower 48 and the North Sea peaked right at 50% of Qt.
So, why shouldn't one region, that served as the swing producer for 35 years serve as the model for the successor swing producer?
In any case, the common connection between Texas, Lower 48, North Sea and Saudi Arabia is that we find the big fields first. The smaller fields that we subsequently find cannot make up for the declines of the older, larger fields.
(Note that we saw the same "dogleg up" on the Texas HL plot just prior to the Texas peak, that we saw in the Saudi HL plot just prior to the Saudi peak.)
As I have stated many times, IMO, this whole debate over whether Saudi Arabia and thus the world has peaked is akin to a debate over how fast the Titanic will sink.
A reminder: even if production stays constant worldwide, net oil exports would fall because of rising domestic consumption in the exporting countries. So, from the point of view of importing countries, flat world oil production = Post Peak Oil. But production is not flat, production is down, and production in the top exporting countries is falling even faster.
IMO, absent the Bird Flu and/or an immediate recession/depression, we are going to see continued--and probably rapid--increases in food and energy prices, with strong deflationary trends in the auto/home/finance sector.
Take your pick: the Titanic sinks in two hours or four hours. In any case, do you know which lifeboat you will be in?
Saudi Arabia as the Pet Shop from Monty Python: That parrot's not dead, it's just resting!
Jeffrey, I've read this many times in your comments. I am currently ploughing my way through The Prize and am mid way through the sections on pro-rationing etc. It seems that this began in 1930 with the discovery of the East Texas field which flooded the market. Pro rationing was then applied to all producing states - not just Texas. So where does the notion that Texas was the swing producer come from? According to Sir Daniel, all US states withheld production.
As I say I'm not through yet. But when you say Texas was swing producer for 35 years - this implies until 1965. Surely the US produced flat out during WWII? Have you got any more background information on this?
Euan,
The RRC didn't start regulating production until later in the decade. There were several legal challenges, which went back and forth to the Supreme Court. So, I was dating it from about 1935 to about 1970, and of course everyone produced at 100% of allowable during the Second World War.
Other states regulated production, but I am not aware of any other states that restricted production to the extent that Texas did.
At peak production, Texas = more than one-third of production, while the other 49 states = two-thirds of production. Of course the Trans-Alaskan pipeline wasn't finished in 1972.
In the post-war period, as far as I know, up until 1972 Texas went to a 100% allowable twice--during the 1956 and 1967 Arab/Israeli Wars, in response to threatened Arab oil embargoes.
Guys, a couple of good books that discuss oil in the last century, including the role of Texas, are "Iraq and the International Oil System" by Pelletiere (former CIA analyst for Iran) and "A Century of War" by Engdahl. I found them both quite enlightening.
I have seen the plot before and the read line seems to use only 1991 and the last point. I think that it is a lot better to use for example least squares method to fit the line.
500 rigs are hard to imagine. As it is, sa is driving rig rates thru the roof. Their announced claim was to have go to 80, now they want 130... but it will take years to get them, and the hundreds of crews... as you might guess, nobody wants to work there. So, imo the rigs will come too late to affect peak.
Hi Euan,
Thanks for an excellent additional analysis of Stuart's work.
The top chart in your article is interesting for a number of reasons, but one has not been mentioned at all, that is, the change in volatility of the oil supply.
Until the plateau in supply in mid 2004, SA supply stayed above 8.5 for only brief periods, but for the past 18 months SA has had to provide continuously at or around 9.0.
It seems the slope downward is now SA supply is reverting to the mean from exhaustion, which would necessitate a serious fall to well under 8.0 for quite some time (18 months?) to balance out the long period of high flows. This doesn't necessarily have to do with whether it has peaked, but everything to do with sustainability.
Do you see this as significant?
Ian
Some interesting, coincidental I'm sure, periods of similarity however the main point is the difference between the swing producer that Saudi has been (still is?) and Russia's smooth unimpeded production.
Wonderful graph!
One of the reasons why I have to take the perma-pessimists and optimists, such as Westexas and CERA, with a grain of salt is that they never advance evidence that counters their position.
If one were to ask Westexas to give a detailed presentation on the defects of his position, I think he'd be powerless.
Is it a cultural thing?
ie. Do Americans believe you can't pursue truth apart from highly adverserial tactics?
Remember: nobody trusts lawyers, not even other lawyers.
This isn't just a criticism of peak oilers. Applies equally to Yergin and the CERA squad.
The comedy continues until people learn to acquire such familiarity with their opponents arguments that when they state them their enemies are forced to say, "Yes, you've got me right."
The problem is that it is a null set. Insofar as I know, there are no examples of large producing regions showing sustained increases in production past the 60% of Qt mark (provided the P/Q intercept is consistent with other large producing regions).
Note that Russian production collapsed and then rebounded to a level that is still below their peak in the Eighties, with the post-50% of Qt cumulative production being consistent with the HL model. IMO, Russian production will start falling, probably this year, but no later than next year.
So, is it possible that Saudi Arabia will increase production beyond the 9.55 mbpd (C+C) that they averaged in 2005? Yes.
Are there any examples of large producing regions showing sustained production increases beyond the 60% mark? No (insofar as I know anyway).
The difference between my predictions (based on work by Simmons/Deffeyes/Khebab) and CERA is that my predictions have so far been accurate.
As I have said several times, this is not rocket science. Among other reasons is the near certainty that 14 out of 14 fields that are, or were, producing one mbpd or more are in decline or crashing.
I am sorry that everyone is having to confront a simple truth, but reality sucks: a physical world has physical limits, or more bluntly for the Cornucopian set, "What part of the impossibility of an infinite growth rate against a finite resource base do you people not understand?"
Q.E.D.
Part of it is the difference between scientific thought, and belief. The philosophy of science establishes that if you have have actual data/observations that goes against your theory, you attempt to revise your theory to match shared observed reality (whie increasing the predictive power of the theory). Meanwhile with belief, you pick something, and stick with it.
If Westexas had data going against his theory, he would have incorporated it. It seems like you're saying that he's not trustworthy for stating that there are no natural unicorns because he hasn't found any. As for his testing his theory, sadly because of the situation, all of his tests involve simply waiting for more stats.
Meanwhile, CERA is saying that they have a unicorn, and they will unveil it in 2010 ... or maybe 2012. Oh, and CERA expects you to ignore the fact that they claimed to have a fire breathing dragon (increasing production of NA natural gas) back in 2001 that they claimed that they'd reveal it in 2003-2005, but never did.
Does anyone know of a CERA statement regarding their reasons for how they were dead wrong on the picture of natural gas. Because until they state the reasons of how they were quite wrong, and explain how those reasons don't apply to the crude oil situation, they should rightly have 0 credibility.
That's not how it seems to me.
It seems to me that Asebius is raising questions about the extent of WT's objectivity or the depth of his understanding. He appears to be saying that either
or
If the former, then WT's objectivity is immediately suspect. Believing that a model - especially one based on simple, abstract mathematics rather than the political, economic, and geological realities of the situation - is flawless represents quite a leap of faith. A strong belief like that can make one an unreliable information source - one will tend to give the same answer regardless of the data.
If the latter, then WT's understanding of the model and the data is being called into question. A necessary part of using a model is knowing when that model does or does not apply, and what its limits are. Without knowing that, there is a strong risk of the model being applied where it is not appropriate and cannot be expected to give sensible results. The net effect is, again, becoming an unreliable information source.
Asebius has, in my opinion, a very valid concern - that too much is being accepted without scrutiny. Fortunately, there seems to be a substantial trend in the comments to this article and Stuart's recent one asking for precisely that scrutiny - multiple posters have commented that claims from either "side" should be examined carefully and critically.
And that's great. It'll raise the level of discussion and information available, and help everyone understand the realities of the oil production better.
But that does mean you're going to have to take stock and figure out the weaknesses of your model, WT. Hubbert Linearization is not a magic talisman of correctness, and there are quantifiable flaws in some of its results, and even some of the ones you talk about frequently (e.g., the "Russia is 85% depleted" discussion we had a while back, where I numerically demonstrated that Russia would immediately have to enter terminal 30% annual decline for you to be right).
Finding flaws doesn't make a model weaker; the flaws are already there, and ignoring them won't help. Instead, being upfront about those flaws makes the whole package much stronger, much more honest, and much more useful to others. If it's good enough for scientific papers, it's probably good enough for TOD.
Oh, as I also meant to mention, with no hard evidence, yes, both get some salt. However, CERA seems deserving of a few handfuls, rather than a grain.
Asebius,
I think that I have suggested several times that instead of sitting at your computer and asking people to provide you with more data, better interpretations, etc.--for free--you are welcome to do your own research.
I have an idea. If you think that there are counterarguments to be made based on real world data, why don't you do some work?
Why don't you provide us with a list of countries showing sustained, uninterrupted year over year increases in production, when all of their largest oil fields are in decline?
Get back to me when you find your unicorn.
Unlike you, Westexas, I know my limits. But within my limits is the capacity to judge your limits. And your limits, sir, are rather severe.
But you have learned one interesting trick. You can outlast people simply by piling on verbiage day after day, week after week, month after month. A one man constant drumbeat and quite possibly a form of personal therapy.
Oh well, keep at it. Beyond a certain point, you aren't enlightening, but you do little harm.
and so the ad hominem attacks begin...you get a "moooo" from now on. I thought this crap had stopped on TOD. Guess not. Back to lurking....
I think he earned an immediate ban before things get out of hand again.
Hint: look up definition of "null set."
On the other hand, I could be wrong, thus my serious suggestion that you do some research, rather than offering up criticism from the sidelines.
Asebius,
If you have something of value to add, lets see.
I read both sides of the discussion.
I have my limits too. I have the ability to weigh the arguments, and make up my own mind. But I do so without attacking contributors. I seek clarity with questions.
Your attack is doing absolutely nothing to contribute.
Good Day.
I think we should cut Asebius some slack. After all, certain posters can be a bit tiresome at times. You know who they are: the ones where if you've read one of their posts you know exactly where they stand. Reading them post the same things over, and over, and over again (often multiple times on the same thread) can wear on a person, I imagine.
I think that there is clearly something wrong with your interpretation of the HL for Russia. You have said that they are more depleted than the US with a similar projected URR but then how are they able to produce almost 10 million barrels a day today? Is it even conceivable that the US could now produce 10 million barrels a day? I do not buy the “making up for past missed production”. The URR must be higher than your analysis suggests. Their technology cannot be so much better than ours that they can produce at that rate if they are really at that level of depletion.
http://www.cdi.org/russia/johnson/8236-12.cfm
85% of peak at 90% depleted? And growing?
Your citation shows how it has been possible to grow production sustantially past the mid point and is compelling. But is it really possible that Russia is 90% depleted with that level of production and amount of growth? What will that decline curve have to look like for the remaining 10%?
You really should read the whole article. It paints a not so rosy picture of Russian oil production in the future.
But is it really possible that Russia is 90% depleted with that level of production and amount of growth?
That's the impression I get from the article.
I can't really comment on the decline curve, perhaps a knowledgeable poster can fill in there.
The numbers in the article say that Russia is not 90% depleted. What they do say is that lack of investment may be setting Russia up for short-term production difficulties.
Mathematically, Russia at 85% of peak at 90% depletion requires a 22% year-on-year decline rate starting yesterday. Not only is that 50% worse than Cantarell's "crashing" decline rate, it would need to apply to all wells in an area three times the size of the USA.
That alone should indicate Russia is not 90% depleted.
I think the distiction is between all fields and mature fields.
WT has said that mature fields are between 85 and 90% depleted.
The article seems to imply the same (correct me if I'm mistaken). Russia has not been investing in exploration and development of new fields that would compensate for the decline of the mature fields. Those mature fields were mistreated in the 80's, ignored in the 90's and heavily reworked in the 00's. Those mature fields are now poised for a signifigant decline, or as you put it short term production difficulties..
But like I said I don't know enough to comment on decline rates specificaly. 22% is pretty scary though. Surely it must be offset by new fields comming online?
WT said that the entire province, Russia, is about 90% depleted. That's old fields and new fields. Yet they are still growing production at almost 10 million BPD and have been for years. That's incredible.
The HL assumes that the province has produced as quickly as the market demands. Maybe the incompetent Soviet Union distorted that production curve? Who knows? But it looks like there is still quite a bit more oil remaining than only 10%.
When you see a hockey stick forecast (the trend in the last few years has been steadily growing but right now it is going to turn dramatically down) you need to be skeptical.
The other thing is that the Russian production curve is other worldly smooth (scroll up a few dozen posts). Could it really be barely monotonically upward for these last several years? I think we need to check those data sources. As the largest producer now we need to give Russia more of the scrutiny that we have recently been giving KSA.
22% is what must happen immediately for Russia to be overall 90% depleted.
22% would be utterly unprecedented, especially for such a large region as Russia. Even individual fields very rarely decline permanently at that rate.
So it ain't gonna happen.
So Russia ain't 90% depleted.
As for whether Russia's "mature fields" are 90% depleted, that's tough to say. It depends on what one means by "mature fields", the importance of that depends on what fraction of oil production in Russia one is defining as from those "mature fields", and - unless Russia's oil companies are much more transparent than I've been led to believe - I'm not sure anyone outside of Russia has enough information to say something significant in that regard.
To put a bit of fuel into the fire, I'd like to make three comments.
1. HL cannot be very accurate using Russia's data. The slope is not steep enough. A very slight change in the interpretation of the graph changes the URR immensely:
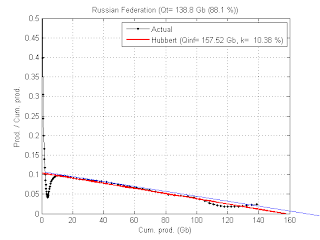
2. HL assumes that past data represents a generally free-producing region. What if this was not the case for Russia durch the Soviet era? Call it, say, political restrictions over a period of decades. And then the crash on top of it... Just imagine what they could do if they suddenly allowed free drilling to the highest bidder?!
3. Because Russia is partially situated in hard-to-reach areas (Siberia), it is difficult to define a "region". This may cause difficulties for future analysis. This is like analysing the US-production without sticking to the Lower 48 - and extending to offshore, and then extending to Pacific or Artic Basin (international waters) then extending to Titan.. :-)
Chris, your graph dramatically illustrates two long term strategies in play by these two nations. KSA is the swing producer and surges its supply when necessary. It is a role that it has taken more seriously since making amends with its OPEC partners in 1999. With oil falling to a yearly avg of $12.40 in '98, al Naimi was convinced by Mexico to sort things out on reallocating quota to soften the abuses.
This led to the $22-$26 price band and peace in OPEC, but it came at a price of reducing their cumulative production by 3-mbd.
It was Russia that took up the slack. For Russia has had its own agenda. They wanted to pay off its huge IMF loan ASAP and oil revenues gave them that opportunity. Secondly, as OPEC raised its price band in 2003, Russia's oil minister, Igor Yusufov, stated that Russia felt the higher band was Recessionary and it would increase its own production to attempt a $20 to $25 band.
In recent weeks, we are witnessing a new Russia initiative that seems to fly in the face of this (on the natural gas front). Saudi Arabia has stepped forward with its displeasure of a high $50's price band and may be closer in harmony with original Russian intentions.
The purpose of the SA, Iran, Mexico, Norway, Venezuela detente in 1999 was the realization that steady oil prices were better for the global economy and OPEC than the $10 to $40 fluctuation. I expect this reasoning to prevail although some countries need the oil revenue. The decline in some countries now allows OPEC the ability to reallocate to the nations in need of greater quota. The next two meetings could have some interesting disclosures in that respect.
Kunstler's recent article references Stuart Saniford's post.
http://www.theoildrum.com/node/2325
http://www.atlanticfreepress.com/content/view/1101/81/
Excerpts:
"Evidence now conclusively shows that Saudi Arabia's oil production was down 8 percent in 2006 over 2005, even while the number of oil rigs went up substantially — indicating that the Kingdom is drilling as fast as it can and still losing ground."
"No amount of corn is going save the Happy Motoring utopia, and that's really all our economy is now based on."
His article is good for a laugh - even of some of his predictions become true.
You find this funny do you, people starving because other forms of energy cannot replace oil and natural gas in the production of fertilizer or fuel for the farm machinery?
Hi Cid,
If the world follows the trend of previous catastrophes - such as World War II - then PO will lead to some of the wryest humour the planet has seen.
If you don't know what funny means to people in distress, get hold of Spike Milligan's wartime memoirs such as:
http://www.amazon.com/Adolf-Hitler-Part-his-Downfall/dp/0140035206/sr=8-...
You'll wet yourself laughing at the horrors that Spike experienced.
Or try Heller's Catch 22 for more recent humour on war.
There'll be so many PO jokes TOD will be renamed TODJ - The Oil Drum Joke site.
Get loose, funny may be all the millions of starving will have to live for.
Ian,
I think your right on that one....even when I think Kunstler is full of shiit, I read his stuff just to get some of his barbed and dark sense of humor. :-)
I sometimes wish he had left the big surburban collapse alone and just wrote satire, that is his gift! But if the attack on suburbia brings out his humor, by all means bring it on...:-)
RC
Remember we are only one cubic mile from freedom
Euan, you state:
Yet the truth is that global production of C&C is down since May 2005 and that OECD inventories are down since July 2006.
So, since July 2006 we have at least 2 of your criteria met. Further, we've all discussed here ad nauseum the sometimes slow response time of the market to actual supply and demand so I suspect that you are wishing for too much if you expect prices to instantly head back up (although they are, of course, headed back up even now anyway).
In short, I don't think you reviewed the data. Two of your criteria are already met.
Ghawar Is Dying
The greatest shortcoming of the human race is our inability to understand the exponential function. - Dr. Albert Bartlett
An interesting chart. Looks like rising tops and bottoms to me based around seasonal fluctuations.
What's really intersting though is the eia forecast - I always thought the eia were optimists!
Are you deliberately ignoring the point? The graph, from the EIA itself, demonstrates conclusively that OECD inventories have been falling since their July 2006 peak. That was precisely one of your criteria that you claim has not been met, yet in truth it has been met. Further, world C&C production peaked in May 2005 and has been trending downwards since that point. So two of your criteria are met while earlier you claimed that none of these criteria had been met.
It looks to me like you need to either reassess your conclusion or change your criteria (move the goalposts). If you still insist KSA is not in decline given that 2/3 of your own criteria are already being met and the third is occurring as we watch, then I find your logic extremely weak.
Ghawar Is Dying
The greatest shortcoming of the human race is our inability to understand the exponential function. - Dr. Albert Bartlett
GreyZone - I'm not ignorng the point but merely observing that this chart shows annual cyclic variation that needs to be taken into account. To draw a conclusion about falling inventories I'd want to see the red line way below the blue band - otherwise we end up disagreeing over details.
I will concede, however, that the whole issue of invenories may prove to be a bit of a red herring. On reading Gregors posts up the thread, high inventories may infact be a symptom of shortage and as this parameter can be interpretted differnt ways it is probably best left out of the mix.
Analysts often talk about oil price being high because of a fear factor. The only way a fear factor can be expressed is by refiners and governments to hold high stocks because of a fear of supply disruption, and this temporary higher demand might then translate into a temporary higher price. {However, this is confounded by higher futures, which provide an economic incentive for refiners to hold high stocks (as opposed to the past, when lower futures provided an incentive for low stocks.)}
A similar situation occurred during the 70's embargoes... individuals turned a mild crisis into a major one by keeping their gas tanks fuller, and this increased demand, even though tem porary, caused commercial stocks to crash.
IMO, markets are fairly fearless right now, as OECD days of supply continue to erode.
What is interesting about the future projection in the eia graph is that they are honestly comparing near term supply vs. near term demand, and concluding that the curren draw down of stocks will continue for an extended period... which, of course, may be wrong if, as would be logical, price rises and demand cools.
Ok, you are changing your criteria to not just falling OECD inventories but inventories that have fallen outside normal ranges. I'll accept that refinement but it's important to state or include such assumptions up front when you list such criteria. Given your revised criteria list, we're back to 1 out of 3 being true so far (world production of oil is down since May 2005).
Ghawar Is Dying
The greatest shortcoming of the human race is our inability to understand the exponential function. - Dr. Albert Bartlett
So?
The oil consumers of the world don't care about C+C; they care about "fuel", aka "all liquids".
And that's been going up.
So what we have is increasing amounts of C+C being replaced by other liquids. Is that because there's no more C+C production capacity? Maybe. Is that because producers of those other liquids are pricing marginal C+C capacity out of the market? Maybe.
Fact is, you don't know which of those is true. All you know is production of liquid fuels has been growing.
As RR noted:
The OECD isn't the whole world, and is actually a fairly small component of oil consumption growth.
Of course, it's also worth noting that the politics of oil-producing regions has been more sedate in the months since Oct than in the months before (Iran, Israel/Lebanon), and Oct represented the effective end of a pleasantly-surprising hurricane season.
The convenient explanation is often not the only explanation.
Such evidence may include: 1) falling global oil production 2) escalating oil prices and 3) falling OECD inventories. Right now, none of these tests are satisfied.
1. Global production did fall, 06/05, 200k/d.
2. Prices are now rising, from under 50/b.
3. OECD inventories have fallen steadily, around 700kb/d, from mid-oct.
BOth you and robert say prices and sa production declined together. The graph above shows sa production began declining 3/06, went down steadily as prices climbed over 70 in june and stayed above 70 to mid july. So, for 4-5 months sa chose, or were forced, to turn away sales (no buyers) while prices surged, goosing the rest of opec to sell every barrel they could squeeze out of their fields... to the point that, in jul/aug, production surged higher than ever, even as sa production continued to slide. And, this was months before stocks rose to the md-oct peak and opec began to worry about falling prices.
As an aside, the administration was begging their sa friends for more oil to help bush in the election. No oil was forthcoming.
BOth you and robert say prices and sa production declined together. The graph above shows sa production began declining 3/06, went down steadily as prices climbed over 70 in june and stayed above 70 to mid july.
What were inventories doing from 3/06 to mid July? Steadily rising. See for yourself:
http://www.eia.doe.gov/emeu/ipsr/t15.xls
So, despite the fact that the price was going up, inventories were also going up indicating that the market was oversupplied. And despite the Saudi cuts, inventories continued to rise. So, what does that say about whether the Saudi cuts were justified? I have said before, and I will probably say again, even if price is going up, steadily climbing inventories mean that cuts are coming. It doesn't matter if oil is $1000 a barrel if the tanks are filling up.
One thing I have noticed about many in this debate, is that when price goes up, it is meaningful. When price goes down, they don't seem to think that is meaningful. Yet price has been on a downward trend since the Saudis started making their cuts, despite times of rising price.
As an aside, the administration was begging their sa friends for more oil to help bush in the election. No oil was forthcoming.
Reference?
Prices have been rising for about six weeks.
You, among others, about the time oil was bottoming, kept saying, even when given direct quotes from the IEA stating that OECD inventories would fall 200 million barrels or more from their peak, inventories would not fall that far.
It's seems quite possible that also many other market participants misunderstood the supply and demand factors, and mispriced oil a few months back.
You, among others, about the time oil was bottoming, kept saying, even when given direct quotes from the IEA stating that OECD inventories would fall 200 million barrels or more from their peak, inventories would not fall that far.
That is incorrect. I have specifically stated, regarding OECD inventories, that they were so far above normal that they could fall for a long ways before there would be a concern. I documented this once before, and don't recall off the top of my head the number, but they were far above normal inventories right now. They may have been 200 million barrels above normal for the time of year I was looking, but I would have to go back and look.
I dont buy it. The increase OECD invents. was March to Aug
2004 3.5%
2005 3.2%
2006 3.6%
So not much of a change there, neither in absolute amounts(do they really care whether its 3.1 or 3.3%? is the data that exact), nor in variation year on year?
If inventories were a reason 2004 should have been cut like 2006 and 2005 should have been pumped at max. No, I dont buy that inventories is a reliable indicator. a part but not all, as you keep implying..
Very well done Euan, that’s an equilibrated analysis.
What do you think of the hypothesis of this just being an intermission period where heavy oil production isn’t yet filling the gap left by a crash in light oil production, like Dave pointed?
THIS ONE IS A KEEPER
Of all the TOD strings I have read and commented on, only a small number have been put into my favorites file, so that I can go back and refer to them, because they capture the problem of predicting and basing action on the timing of peak oil so well. This string will be one of them. What are the gems that make this string of posts stand out, the complicated chess gaming that keeps the ball in the air and the game in motion? To whit:
1. The second chart from the top, with the blue line, and the numbers 1 through 8 on it.....see it? Please, take a hard look at that chart. I am interested first in one set of numbers, one place on the chart, between 3 and 4. Look at it. Even today it is AWE INSPIRING. From over 10 mbd to barely over 3 in barely 3 years! Oil production in 1984 that barely matched 1970 production! This is the world I grew up in. WE HAVE SEEN PEAK. Any thinking person was sure at the time that Saudi Arabia may regain some production, but they would NEVER see the old 10 mbd peak, NEVER.
22 years on, they were only back oat the 1978 levels! Does this seem suspicious to anyone? My interest now moves to the second, and as much fascinating place on the chart, between just before number 4, right at the bottom, to number 6, pretty recent history really, in about 1997 or so, not too long before the recent "weirdness" hit. Between 3 and 6, a cliff down, and
a wall up, all without benefit of geology or "geological peak", just like turning a tap.....turn the oil off, turn the oil on....at will. Does this bother anybody but me? This little piddly shiit drop and rise we see today wouldn't even be a pizz in the sea compared to what we have already seen, LASTING A DECADE AND A HALF AT A TIME. Who would think they could possibly prove a catastrophic end time peak with a few months or a year, or even two or three year drop? Does this not defy all criteria of "proof" given what we have already seen. What would you folks say today if you were looking at a chart in say 1982, more than 60% percent off of peak production, down for 5 years! Can you imagine the hysteria, the complete meltdown of confidence in the "age of oil"? Can you imagine the repurcussions to the world economy, the loss of faith in the world economic future. Well, those of us of a certain age don't have to imagine it. We lived it.
It just astounds me how easily so many have forgotten it. It is a cautionary tale indeed. BE VERY CAREFUL in how you plan for "peak" as you percieve it, and think before you sell the retirement plan, the nice suburban home, and hike into the wilderness.
2. Did anyone bother to go and check out the link provided on Khurais:
http://www.hydrocarbons-technology.com/projects/khurais/
Man, this one bothers me. Light sweet crude, pilot drilled in 1963. And then, not developed....(??!) Simmons says in "Twilight" that it was because the oil quality was inconsistant, and it just wasn't there in volume.....(??), he and others say it is a bluff, and can't deliver.
But the Saudi's are now spending 3.5 billion dollars on a bluff (??!)
If, and this is a big IF for sure, Khurais can deliver what the Saudi's promise, some 1.2 million barrels per day, of "of high-quality Arabian light crude", it instantly becomes one of the worlds super giants, and makes up for all the hysteria concerning Mexico's Canterall, and much of the North Sea drop. And it begs a greater question: Are there anymore surprises out there in the Saudi outback, or off the Saudi shore? Who can really know? No Western power has been privy to Saudi exploration work since truly modern methods have been developed. Remember, that the U.S. bowed out of Aramco at the time people still had Commadore 64 computers storing recipes, and the storage media was a cassette tape player.
Matthew Simmons often talks about the volume of water injection telling something about the volume of oil expected...." does "4.5 million bpd of treated water" tell us anything? Do the water cut math yourself, either they are expecting to move a great deal of oil, or they know they are spending 3.5 billion dollars, and runnning pipeline all over the desert to retrieve "oily brine". Would they do that? (??!)
Westexas may be right, the game may be up. Staniford may be right, the game may be up. I am troubled because I have read so much of their writing, and find so much they have to say convincing and compelling. It was Westexas that first showed me the exact nature of true "geological peak" as it applied to the lower 48, and caused me to accept in an even deeper way than I had before the need to CHANGE NOW. I still believe that we must change, now more than ever.
But Saudi Arabia worries me. Not they will peak, I have been worried about that since 1978, I am used to that.
I worry about something else. That they have a few big cards up their sleeve, and they will not play them until it will do us the most complete and disabling damage. If they can, I think they will choose their time carefully, and then end the U.S. attempt at conservation, deep offshore exploration, and alternative energy, and put those industries back in the shape they were in 1983. Complete collapse.
American arrogance and elitism is once again a great danger, clouding our view: We persist in believing that the Saudi's and OPEC are ignorant, despite the fact that they have beaten us again and again at this game. (this was the Saudi's great compliant against Simmons' book, "Twilight In The Desert". I heard one Saudi official on public TV when asked why he would not reply to Simmons contentions, say, "why should we? He essentially calls us liars and ignorant at the same time.")
Yes, this is a string I will keep. It may have great historical significance someday. :-)
RC
Remember, we are only one cubic mile from freedom
$ 3.5 billion dollars amounts to about 60 million barrels, (about 17 hrs of worldwide consumption). i am assuming the saudi's evaluated the economics of investing that amount of money and decided it was worthwhile.
as the water cut in a field increases, displacing oil with water becomes less and less effective.
Excellent thought provoking comments - thank you.
Roger,
I think you are spot on. They may have a card or too up their sleeve... We don't know. The HL for Saudi Arabia that Euan posted definitly seems to show the "throttled" back production. Maybe the last few plots are just an anomaly. We'll find out in the next few years.
I know people say it doesn't matter whether we peak this year or 5 years from now - but speaking personally - I could really use the extra 5 years of preperation time!
Garth
A couple of comments:
1.) Political risk aside, if the end result of the 3.5 billion dollar investment is even 100,000 bbls per day, of long lived, flowing light crude production, I would happily sign up for whatever share I could buy in the project. [Calculates out at $35,000 per bbl which is not far from a market price for some high cost ,low production, old nasty U.S. onshore properties -- and it this looks even better when compared to the Canadian tar sands cap ex numbers!] My point being that although 100,000 bbls per day would hardly impact the peak, whether this field has the potential for 1.2 million or a order of magnitude less or something in between, the KSA would still invest the $3.5 billion if it was looking to ramp up production based on know prospects.
2.) The water injection numbers seem a little strange to me. I have not been involved in water flooding, but I have been involved [as a non operator] in producing "oil stained brines" from structures with massive water drives. After the oil is separated out, the water has to go back down the hole [either into a structurally lower part of the producing formation or into another zone.] In a waterflood, to maintain pressures, more water needs to be injected than the volume of oil extracted, but by how much? 4.5 million bbls per day, does seem like a lot unless they intend to create a massive water drive in what is for the most part a gas solution drive reservior. Thoughts / comments on what the reservoir dynamics of this problem field are like? I could not tell much from the link other than that the comment that the reservoir quality was not consistent.
R W Reactionary,
Beginning on page 211 of Matthew Simmons "Twilight In The Desert" and continuing on through page 214 is a very involved and relatively technical examination of Khurais. This is the first place I came in contact with information about this field.
I will not here attempt to duplicate all four pages of the book (and everyone should have a copy of their own to refer to anyway, it is an invaluable guide to Saudi oil production!), but the high points:
-Khurais was discovered in 1957 through surface gravity mapping. Production began in 1959 at minimal levels, and the field has been produced intermittently since that time under primary depletion.
-The Khurais complex consist of four fields, Abu Jifan, Khurais, Qirdi, and Mazalij, located approx. 70 miles west of Ghawar. It is the second largest onshore oil bearing structure ever discovered in Saudi Arabia. The size does not indicate, however, the oil in place
Khurais has three known oil bearing reservoirs: Arab D., Hanifa, Lower Fadhili. The latter has never been produced.
-There are four GOSP's (gas/oil seperation plants), minimal facilities of single stage separator and a test trap.
The production history is all over the place. It would be fun to see an HL Linearization on this field! :-)
-From 1959 through 1961, the Khurais field enjoyed a small burst of early production. Production then ceased (!) {exclamation points will all be mine!)
-in the early 1970's, Khurais was brought back onstream and produced between 20,000 and 40,000 barrels per day for the rest of the decade. It is not clear whether this production came from the Khurais field only or the entire complex.
-In 1980, Khurais produced 68,000 barrels a day.
-In 1981, when Saudi Arabia's oil production reached an all time peak, Khurais produced a record 144,000 barrels a day.
Now, Simmons is, to put it mildly, very doubtful of Khurais' prospects, saying that the 144,000 barrels per day "was likely Khurais' all-time peak output."
(Note that we get an increase from 68,000 to 144,000 in one year, and then....like a gate slamming shut, back to nearly nothing....(????) Does that make sense....?)
But the mystery abounds, even Simmons seems somewhat fascinated..."It must have been terribly frustrating for Khurais' production managers and engineers to realiz that the second largest onshore structure in Saudi Arabia, lying just 70 miles west of Ghaware, gave no indication of output potential comparable to its size."
Simmons then goes on to describe Saudi "attempts to increase production". He refers to 50 extra wells being drilled in Khurais and another 22 at Abu Jifa and Mizalij, troublesome wells, using "oversized gas choke valves, "a constant struggle". Simmons says, apparently quoting Society of Petroleum Engineers documents, " Maximum flow efficiency" rates were never completely "explored". (?)
Simmons refers to lack of consistancy in the reservior rock interfering with the gas ability to move the oil, and lack of "uniformity", sayng the injection program ranged from a low of one percent production improvement to a high of 200 percent (!)
In closing the section, circa 2005, Simmons reports what we all hear today, that Aramco is still touting the field as capable of some 800,000 barrels per day to a high of 1.2 million barrels. Simmons pretty much dismisses this possibility, based on what he considers the failed attempts to this date to raise Khurais production (and he seems to know or to assume that these attempts were valiant and real). But Simmons closes with the same argument I made:
" It is puzzling to consider that Saudi Aramco would entertain spending 3 to 4 billion dollars on Khurais, thinking that the field could produce as much as 800,000 per day. The oods of reaching that production goal must be relatively long. The fact that Aramco announced that this project was almost ready to proceed, only to reverse itself and question whether a major expansion would actually go ahead, seems to signal the serious nature of the difficulties and challenges the Khurais expansion faces. But then:
"Khurais bubbled to the surface again as a likely project for 2008. The latest rumors in early 2005 say that Aramco is now thinking about fast-tracking this rehab project."
(end of quotes from "Twilight In The Desert")
----------
Of course, despite all this so called "trying", there is no indication that Aramco has to this point spent much money on making Khurais succeed in producing at a high level. There has been some wells drilled, yes, but the Gas/oil seperators have not been to this date enhanced, and there is no indication that the modest ones there could even hope to handle 800,000 bpd, much less 1.2 million.
It is of further interest that Khurais produced it's greatest amount of oil just before the oil price collapsed. Just as the price collapsed, Khurais conveniently collapsed (by the way, this happens often in the OPEC countries (wink, wink).
So we are back where we were, except....oil prices are now back up....and contracts have been let for $3.5 billion dollars. I know a lot of folks here seem to think that is chump change, but where I grew up, it is pretty good money....:-)
And despite the fact that Khurais has not yet shown the production it's size would indicate possible (and how often does an extremely large oil bearing structure, in a known oil producing region, disappoint to that degree?), the Saudi's have never abandoned.....and always kept "one toe in the water".
Only they would have any chance of knowing what Khurais can do, and they could be wrong....oil is always a risky business. But if they hit and hit big, and Saudi offshore production delivers....??? I still say, don't count them out, they could have one final burst of glory, and make the "peakers" look foolish just long enough to end their influence....and put alternative energy research on hybrids, plug hybrids, solar, wind, bio-butanol, hydrogen from solar, deep ocean drilling and difficult arctic drilling back in the dumpster, and leave Sauid Arabia as the lynchpin of world energy. It may well not happen, but count it into your scenarios while your planning for the coming convoluted age....think back to the future.....1982.
"He who sells last make the most".....
Roger Conner Jr.
Remember, we are only one cubic mile from freedom
This is, frankly, tiresome. All we can do is wait (and prepare, if you've got half a brain).
It occurs to me that we're arguing over the fate of a single country because the fate of the world's oil supply hinges on the fate of a single country.
Reason enough to panic.
Know what you mean, but
I think most everyone here is in agreement that within a not very forgiving range, the game is pretty much up, but discussing it is fun, and useful too. There's not enough discussion, not too much:) I hope everyone is taking the action they can though
Hello TODers,
If we take the word of Heinberg's inside source that Ghawar was under 3 million barrels/day, then add the now online 300,000 b/d of Haradh III: Can the other KSU oilfields make up the difference? Could this be a another method to help predict the possibility and error bars of KSU being postPeak?
http://energybulletin.net/18904.html
-----------------------------------------
[4 AUG '06] What happens next? It depends on the real condition of Ghawar. Perhaps a heroic drilling campaign could result in a temporary bloom in production, lasting perhaps three years, followed by a swift, terminal collapse. On the other hand, it is possible that the field has been so thoroughly exploited already that we are seeing the irreversible, rapid decline. At the ASPO conference a well-connected industry insider who wishes not to be directly quoted told me that his own sources inside Saudi Arabia insist that production from Ghawar is now down to less than three million barrels per day, and that the Saudis are maintaining total production at only slowly dwindling levels by producing other fields at maximum rates. This, if true, would be a bombshell: most estimates give production from Ghawar at 5.5 Mb/d.
-----------------------------------------
If one looks at SS's graph [green background with the two hand-drawn lines above]: this bombshell of info was right when Haradh III was turned on. So, is this a valid equation?--> 9.2 - 3.3 for Ghawar = 5.9 mmbpd for the other KSU oilfields. Is this even possible for the queens, princes, and barons: Berri, Abqaiq, Zuluf, Marjan,etc?
So if Ghawar is dying, but the other oilfields last Aug had the capability to be only temporarily ramped up to cover this decline-- does that help explain all the unsold heavy crude and the further decline since last Aug?
Bob Shaw in Phx,Az Are Humans Smarter than Yeast?
Has no one noticed that, according to EIA - International Petroleum Monthly,
(1) the world without Saudi Arabia had an absolutely flat production curve between Feb 2006 and June 2006 (around 63,950 mb/d)
(2) Saudi and therefore total world production was declining by around 400 kb/d
(3) the oil price was increasing up to $70 a barrel in this very period
Month.....World.....Saudi Arabia......World without SA
2/2006....73,496.......9,500............63,996
3/2006....73,285.......9,350............63,935
4/2006....73,333.......9,350............63,983
5/2006....73,113.......9,200............63,913
6/2006....73,052.......9,100............63,952
Then, in 7/2006 - when the price of oil dropped - there were some one-off production increases totalling 900 kb/d in various countries including Saudi Arabia out of which 550 kb/d have since evaporated, leading to a reversal of downward oil prices.
So we already got a foretaste of what it means when the rest of the world is flat: we slide down together with Saudi Arabia, just as Matthew Simmons described it and the prices go up. Some tension in the Middle East gives it an additional push.
My message2
My message2
First off, kudos to Euan and Stuart for excellent articles...
An old saw from my grad student days was "If you torture the data, it will confess", my take is that the data as presented is still not fessin' up.
What is missing is a breakdown of Saudi production by heavy vs. light. (yes, I am aware, state secrets etc...) Based on evidence, the data suggests that the Saudi's likely have spare sour heavy capacity which is currently unmarketable and that their lighter sweeter grades have probabaly peaked, at the very least, logistically. This conclusion is based on their recent "cancellation" of Asian delivery contracts. There is also the statement that "no buyers existed for their heavier crude at $70 back when spot WTI was $78. It is also fairly clear that the Saudis are willing to use the $60 floor to justify easing up production in a bid to buy time.
Looking at the Manifa project, I interpret that the Saudis will try to replace domestic consumption with heavier unexportable grades in an attempt to free up premium light grades for export. The key question is whether the Saudi projects in the "pipeline" will allow them to maintain lighter exportable grades.
Unfortunately, I don't have my table of viscosity and sourness of the Saudi fields at hand to correlate the new projects to determine if the above hypothesis stands up to scrutiny. It definately does appear that the Saudi's are making an effort to increase the value-added component of their oil resources.
It would be very instructive to find out world refinery capacity as a function of viscosity and the breakdown of the SPR stockpile.
No matter how you slice the data, it is clear there is a transistion underway in the kingdom.
As I understand it, the water flood gpm would settle the matter one way or another. If the water pumping rate is still up, then KSA is declining. If it's backed down over the last few months, then the Saudis may indeed be resting wells.
Seawater Project Largest of Its Kind
Source: www.gulfoilandgas.com 1/31/2007, Location: Middle East
Crude Oil
The Qurayyah Sea Water Plant (QSWP) Expansion Project is forging ahead with a team of Saudi Aramco engineers working closely with contractor personnel in Italy. The project will support increasing oil production and improve field recovery by adding 4.5 millions barrels per day (bpd) of treated seawater to the revamped Qurayyah plant, about 40 kilometers east of Abqaiq.
http://www.oilsaudi.com/webpro1/MAIN/Mainnews.asp?id=4081
Dave Cohen posted this data on Saudi crude assays on Stuart's article the other day:
http://www.theoildrum.com/node/2325#comment-164865
One thing that strikes me is there is not a huge difference between the various grades - the heavy ain't that heavy and the light is not that light. I'd normally be thinking api less than 25 for heavy and higher than 35 for light.
The Saudis, joint with Total, are to build a new refinery to deal with heavy crude. And I also recall reading that world wide refineries are gearing up with crackers to handle more heavy crude. I also read in The Prize that cracking heavy crude actually yields a % of the valuable C8 to C16 chains, so its not all bad news. Perhaps RR would care to comment on this.
And I also recall reading that world wide refineries are gearing up with crackers to handle more heavy crude. I also read in The Prize that cracking heavy crude actually yields a % of the valuable C8 to C16 chains, so its not all bad news. Perhaps RR would care to comment on this.
Heavy oil has a very high energy content, and with so many cokers and hydrocrackers going in, the whole light/heavy debate is not all that important in my opinion. Sure, if the price was the same you would prefer to have light oil because the yields are slightly higher with less energy input, but it isn't like heavy oil is chopped liver.
Given the price differentials, refiners equipped to handle heavy oil are going to buy heavy oil. As I documented in my Assay Essay, you can make a lot more money on the heavy oil.
See my comment below on Valero regarding making money...If I am not mistaken, VLO has the largest heavy refining capacity for any of the western integrated majors (in an absolute and relative sense if I am not mistaken).
No one is accusing the heavy stuff of being chopped liver, but the refined output 1 mmb of light sweet is equivalent to say 1.1 mmb/d of heavy after complete cracking and coking neglecting the additional energy input. In other words, even if the Saudis did push up production to 10 mmb/d, it could be very well be the equivalent of 9 mmb/d of the current production mix.
Euan,
thanks for the pointer to the table. The TOTAL project, is that for Manifa? Rooting around I found RR's excellent intro on refining assays. Comparing sweet 34.8 API and sour 22.0 API, the relative yield is about 60% for the "straight run".
Somehow I missed Dave's ealier missive on this heavy vs light hypothesis to explain the Saudi situation. I think the Saudi's are getting smarter because they have to, the easy money is over. If I controled a NOC, I would aim to keep my powder dry as long as I could maximizing long term revenue. I would aim for revenue growth consistent with national budgetary constraints, moreover, in anticipation of long term global production, I would be heavily investing in the value added industries, i.e. exporting refined products.
Like the classic case of the blind men and the elephant, the ongoing debate between RR, WT, DC, SS and yourself everyone is simultaneously right and wrong. What I draw from this is that by 2012 the Saudi's may maintain production of lighter grades (but likely won't), however, they will likely increase production from ramping heavier production. The overall volume will be flattish wrt to 2006. Oh, yes, the infrastructure that will exists would be able to handle 12.5 mbb/d if only the geology would cooperate.
The kicker in all is that equivalent in usuable petroleum products will be sigificantly less if I understand RR's refinary assay essay.
For those financial types out there, check out the action on Valero (VLO on the NYSE) today...Valero, IMNSHO, will be ultimate widow and orphan stock of the 21st century..
Which is why I bought some...thanks, TOD.
(don’t grasp where this comment will show up, it is general.)
HL is good for massive data; for an individual field (for ex.), forget it, though useful tools are always ..conceptually vital. Obvious point, from Statistics I. Still, where is the line between inspiration, pondering, hypotheses, discussion, and validity?
Not dismissive, just it IS a tough call. An impossible one.
The secrecy that surrounds ‘oil reserves / production’ shows that oil is a card in the sleeve. Information about it hidden and manipulated, as it represents a source of power. *DUH!*
The present ‘wars’ in the ME, and elsewhere, are oil wars, or more generally wars for the control of resources, which includes agri, land, water, transport and pipeline routes, and policing (not to say decimating..) the ppl on the ground, at the strategic spots.
Saudi is hanging on by the skin of its teeth. Its long relationship with the powerful protector, helping it to maintain a ‘Royal’ class of potentates - hypocritical, repressive, domineering, self-serving in the name of a religion which provides excuses for endless sins, wasteful, rapacious - has now become difficult. They either have to keep it up, perform, deliver, or concede some kind of inadequacy or ‘defeat’, a loss of control. As they have nowhere to retrench to, they have to keep on with the same strategy.
Their lack of confidence, their hapless moves to conform (Saudi banished slavery in 1962, to reach back in time...), their spending of petro dollars or arms and grandiose projects, etc. signal the end of an era for them. Their moves against ‘terrorism’ and towards ‘democracy’ signal hypocritical capitulation towards the super power, simulacrums tossed out to please temporarily, moves to make nice and look good, pending. More could be said along that line but it would raise very controversial topics. (9/11 for ex...)
Pending!
(Of course the US does not give a fig for democracy in Saudi, this is all part of the game, pressure etc.)
They are at ‘peak’ or after it or close to it.
Prince Bandar knows. (I guess.)
One other piece of the puzzle: the Saudi stock market crash.
The Venezuelan stock market boomed at the same time (until Hugo started nationalizing companies).
Euan's post helps point out why The Oil Drum is such a valuable site. He intelligently and professionally posted a contrary interpretation of the data that Stuart wrote about. I thrive to hear contrary views as long as they are done in a respectful and thoroughly thought out manner.
The problems TOD has had with trolls in the past has hurt the site’s credibility - IMO. But it is nice to see that a contrary view can not only be submitted but be given top billing as a lead story. After reading Euan's post you can see that there are many ways to look at the same data and different conclusions can be constructed from the same data set.
It is too bad that the data transparency of SA isn't better so that we could begin to formulate a more accurate picture of the overall production situation. Until SA shares their data, and no one is holding their breath waiting for that to happen, we will continue to make educated guesses as to the state of world oil production. That is the true value of TOD. Too bad this topic is so important to modern human civilization that we have to keep making guesses.
Even if SA released all their data into the public domain, would anyone believe it?
Even with the best data, all the major bodies of the world misread the implications of what was happening with the North Sea as it approached and passed peak. Having the data is only part of the story.
I agree with Euan's conclusions about Stuart being a bit premature with calling the demise of KSA's oil production.
For me, the major problem rests with the ultimate recoverable reserves ("URR") of KSA and the ratio of annual production to URR. If we take 8.5mm bpd as the average production for a year, then the annual production will be 3.1 billion barrels. Even the lowest estimates of the KSA's remaining recoverable reserves claim it is more than 100 billion barrels. Since most Hubbert Linearization people here believe that the world's URR is around 2.1 Trillion barrels. If we are at the peak, that means that 1.05 Trillion barrels are still left. It stands to reason that KSA has at least 10% of that, which equates to about 105 Billion barrels.
Now we get to the problem. With 105 Billion barrels of recoverable oil left, the ratio of reserves to annual production for KSA is about 34 years.
The problem with this figure is that anyone who covers the oil and gas industry knows that companies with a ratio of reserves to annual production above 20 can easily raise their production levels by 5-10% annually for at least 5 years, maybe more. It's when companies have reserves to annual production ratios of less than 10 that the depletion causes problems so that increasing production becomes very hard, and decreases become common. (Note that by saying "able to raise production", I am saying that there are no physical or capacity constraints on increasing production.)
With KSA having AT LEAST 34 years, it stands to reason that their recent production cuts WERE VOLUNTARY, and that they could increase output by 5-10% per year for the next 5 years pretty easily.
Why would they cut voluntary? Simple. In a world where the KSA figured out that there is no other swing producer, why produce 10mm bpd @ $50, when you can produce 8.5mm bpd @ $60 and make more money, while saving your precious resource for the future (where prices will likely be higher).
Maybe KSA just got smarter.
IMO, the R/P ratio is calculated using 1P reserves. You are using the URR (i.e. somewhat equivalent to 1P+2P reserves) so the ratio value is probably too optimistic. For instance the R/P ratio for the US has been nearly constant for decades around 10 years. But using the URR/P ratio you would have get something around 20 years or more.
re: With 105 Billion barrels of recoverable oil left, the ratio of reserves to annual production for KSA is about 34 years.
KSA has a cumulative production of nearly 110 Gb in 2005, half of that coming from Ghawar in production since the 50s. It's very improbable that this future 105 Gb of production will come 50% from Ghawar. So KSA is probably at a turning point where new production will have to come from smaller and more difficult fields. Does it imply lower production levels? well, nobody knows!
Nobody knows, I guess, but most will guess:
Ghawar has been the world's best producer not just because it has so much oil but also because of the truly exceptional permeability. Their other fields have both less oil and less permeability, and this includes south ghawar. So, it does not seem credible that workovers of other old fields can possibly match ghawar's production... usefully, however, the smaller fields might last a long time as production slows to a relative trickle.
Now that the dust has settled, discussion of the recent posts "Saudi Arabian oil declines 8% in 2006" and "Saudi Arabia and that $1000 bet" seems to have resulted in the agreement that there are multiple hypotheses (decline versus witholding capacity) that equally well can explain the results. The issue, of course, then becomes how long we must wait before one of these hypotheses emerges as the more likely explanation. If, as Robert Rapier claims, the issue is inventories, the evolving "crash" back to the 5-year average range in total US commercial inventories might force Saudi Arabia to increase production if it is able to do so.
However, even if that scenario does not arise, it may be possible to detemine whether Saudi Arabia is manipulating their production or if the declines are involuntary. Looking over well and production data on the Opec web site, it becomes apparent that the Saudis have historically manipulated their production not so much by changing the number of wells they drilled, but by how many wells they retire each year. The figure below shows that in years where they want to keep production flat, they tend to retire about 130 wells per year. However, when they need to increase production, they either don't retire wells as fast, or even bring wells out of retirement, most notably in 2004 when they brought 37 wells out of retirement.
Remarkably, the slope of a line jammed through this data suggests the average well they retire is still capable of 4000 bbl/day or so!
Once the 2006 data on producing well counts and new wells is in, it may well be possible to discern whether the decline was voluntary or not. If the Saudis retired on the order of 200 wells, this would suggest the decline was voluntary, as this number would be consistent with past behavior of restraining production. However, if the number of wells retired is below 100 (or god help us, negative!), that would indicate that they are throwing everything they have into the fire to maintain production. Either way, I eagerly await the 2006 OPEC report...
Interesting observation.
When does the report come out?
Yes fascinating - please keep us updated - can you put a line through your second graph with a correlation coefficient so we can see how firm the relationship is?
If, as Robert Rapier claims, the issue is inventories, the evolving "crash" back to the 5-year average range in total US commercial inventories might force Saudi Arabia to increase production if it is able to do so.
It isn't total inventories you need to keep an eye on. It is crude inventories. Crude sales slow down when crude inventories are high and rising. It doesn't matter what is going on with product inventories as long as the crude inventories are rising. Now, if the product inventories are falling that poses its own set of problems, but falling product inventories and rising crude inventories would still force curtailment of crude purchases.
Kyle - I didn't realise this kind of data was available - fascinating stuff. Do they also provide information on new wells drilled etc? Can you provide a link that goes straight to the data?
Euan,
The basic source is the OPEC statistical bulletin, which is at
http://www.opec.org/library/Annual%20Statistical%20Bulletin/interactive/...
What I looked at was wells completed in Saudi Arabia, producing wells, and production data. Saudi conveniently doesn't break out their wells into various categories (oil, gas, dry, injection, etc.) for all years. However, the years they have show roughly 2/3 of wells drilled are oil wells, so for the years not explicitly broken out I took new oil wells as 2/3 of the total wells drilled. To get the wells retired, take the number of new wells minus the change in producing wells year over year. This number can be negative if they are pulling wells that have been mothballed into production.
Hope this helps!
I am not a numbers expert, so I would like to ask to those that are inclined to check this presentation (A dynamic approach of oil production) (pdf) from the ASPO 2004 Workshop in Berlin. Is from Olivier Rech, from the Institute Francais du Petrole.
I'm not quite sure what you're trying to accomplish with this cut and paste job of an analysis that probably everybody on this board read 100 times. Look at your own chart. 1990-2006 was the longest sustained production in their history.
Why would saudi production fall? Because they produced 55 billion barrels since 1990. The rig count increase should perk your ears. ALMOST NONE OF THE NEW RIGS ARE WORK OVERS! The original wells in Ghawar were drilled on the top of the anticline. Ghawar produced in the open hole. The field is well known for it's super permeability zone at the top.
When I worked Ghawar in the 80's we could produce 12mm bpd.... for about three days. After that, you cleaned up the mess.
Another note. harad was fully drilled and produced, then shut in by 1985. That INCLUDES a multibilliuon dollar water injection system built by McDermott. If they redrilled it it was because it was FUBAR. In fact, kit was FUBAR when it was new.
Wow, you worked at Ghawar? You have info the rest of us don't. If you can shed any more light on this, please do.
'Sounds like you've great insights if I could figure what your saying ;)
Sorry for my slow up-take..
What is the significance of:
"..ALMOST NONE OF THE NEW RIGS ARE WORK OVERS! "
And what does this mean:
"Ghawar produced in the open hole."
well flow rates are reduced over time due to parafin wax build up, usually they have to blow a chemical down hole (reverse flush), then once completed, flow rates are back to normal, how much flow reduction(in %) wax build up is? depends on various regions and even well to well.
oilcan
Someone up above questioned the HL numbers for Russia. They never made any sense to me either. So I decided to look into it a little more closely.
Here's the chart from Khebab's website. (Thank you)
http://static.flickr.com/27/89720525_ff6da62e84_o.png
I just can't see how the HL for Russia works. The explanation I've seen given is that the current increase above the red line is making up for poor maintenance and technology during the fall of the USSR.
Anyways, Qinf is 157.52 and Qt is currently 138.8.
That leaves 18.72 GB remaining in the ground. (Supposedly)
Production is 9.2 million barrels per day. 3.3 GB per year.
18.72 / 3.3 is 5.6 years of oil left at current production rates. Obviously they aren't gonna pump at this rate right up to the last drop...
So I did a little math, and in order for that HL Qinf to be right, Russia needs to start declining at 18% a year! Now maybe I'm wrong, but oil producing regions just don't decline that fast. At least I've never heard of any. Not to mention Russia is expecting a 100,000 bpd gain next year!
Now maybe the production numbers for Russia are skewed with NGL or some other unconventional crude sources. I don't know. Maybe someone can explain it to me.
I'm not a mathmatician, and I'm certainly not in the oil patch, but it sure as hell looks like they are tapping into new found reserves to me, or recovering at a much higher rate then before...
Either way, if the HL for Russia can't be trusted, then I wouldn't be too confident hanging my hat on the HL numbers for Saudi Arabia.
Debunk away.
Thanks!!
Garth
Nothing in current production looks to me like imminent collapse, or even that peak is necessarily near or here. Even if it is, hard to believe that all their fields are going to collapse together.
How about a graph of which countries import what percent of oil imports to the US.? Since SA is only part of the world wide equation will its decline have the impact that a decline in Canadian oil would have?
Yes. Oil is (mostly) traded on the open market, so a decline from one producer largely means that consumers shift their demand to another producer.
While there are complexities (e.g., the majority of Canadian oil flows via pipeline into the US, different countries have different abilities to refine different types of crude, etc.), there's enough flexibility in the markets that producers are interchangeable to a substantial extent.
Check out this link from 1999 on when peak would be. Very scary on how close he was.
http://members.aol.com/vrex/oil/price_forecast.htm
This guy was optomistic on price however...
This is the chart that was meant:

Colin Campbell's position is that decline in Saudi Arabia commences in 2025. He has increased his URR Estimate by 50-Gb. This moves his Peak Date to 2011 in agreement with the Skrebowski change in December.
This will paste big grins on the editorial team at the New York Times!
Freddy, is that you?
Sure sounds like you. :)
If you have any source to back that up and I would be very happy.
But maybe I should just go and have a look at TrendLines? ;)
Thank you for the compliment. I think? The link is https://aspo-ireland.org/newsletter/en/pdf/newsletter75_200703.pdf and ASPO has a new graph for the ME showing KSA plateauing until 2025. The preamble table shows that URR has been raised to 2550 from last month's 2500. The column on right shows 2011 Peak Date now and is explained in the text under *Depletion Model*
Actually, it shows the total Middle East increasing slightly and then all countries peaking at the same time, in 2025. I guess that is a way of saying "we don't really know how much there is there, but we think it's a lot, and we don't think Saudia Arabia or anyone else is collapsing as we speak".
Though the text does not agree with the graph:
"Production in the Region as a whole stands at 20 Mb/d, and is here forecast to rise only slightly before starting its terminal decline at just under 3% a year in 2020."
But maybe the text is about conventional oil while the graph is all liquids, or something like that.
Last: If this is Campbell's position, it hinges upon steady real dollar price increases for crude. IMO, there is zero evidence that the Saudis intend to give their product away for a song ever again. If one looks at the price increases they have demanded over the last few years, it appears that a global economic downturn will result in far less Saudi crude for sale. Geologic peak, geopolitical/financial peak, peak is peak (2005).