This Week in Petroleum +
Posted by nate hagens on June 27, 2007 - 8:04pm
This weeks TWIP report, API and DOE crude and crude product reports came out this morning. After being down in the premarket, gasoline traded up 2.5 cents, crude was up over $1 (WTI) and heating oil (distillate) was up 4 cents. TWIP, graphs and analysis below the fold. Also in case the swelling queue doesnt permit, Jerome a Paris wrote an article about comments made by chief IEA economist Fatih Birol stating that without Iraqi oil we are in "big trouble by 2015".
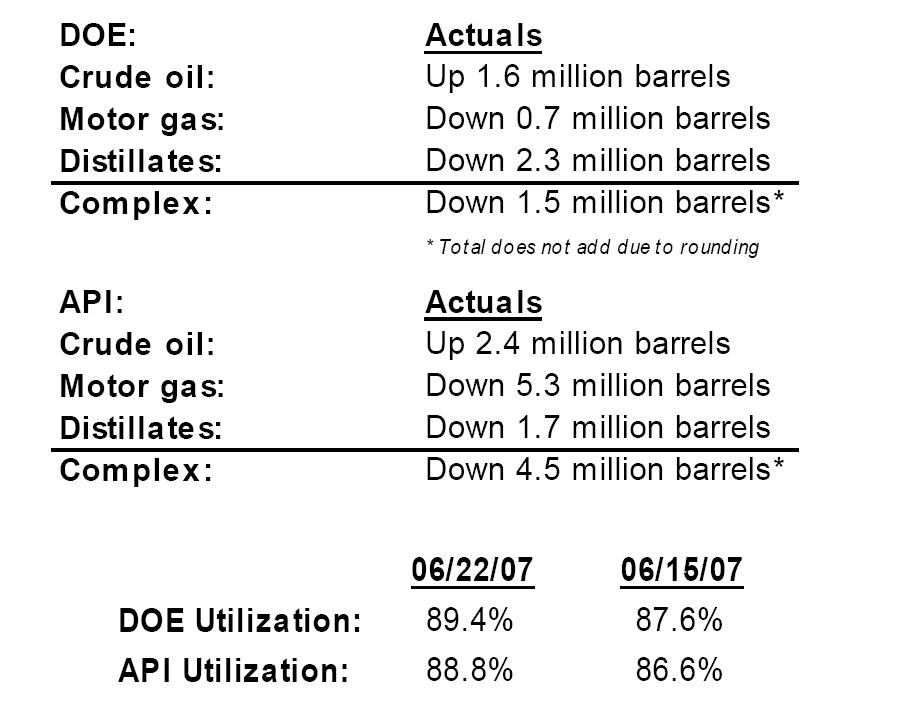
Each week we get the API and DOE crude complex numbers. I tend to rely at the DOE numbers more because the API numbers (seem to?) have a higher variance. In any case, Bloomberg analysts surveyed expected crude oil to have a 1.5 million barrel build, gasoline and distillate to have a 1 million and .5 million barrel build respectively. Here were the actual numbers:
And here is the text, This Week in Petroleum
Magic?
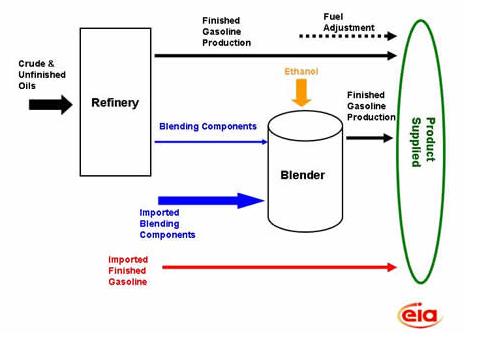
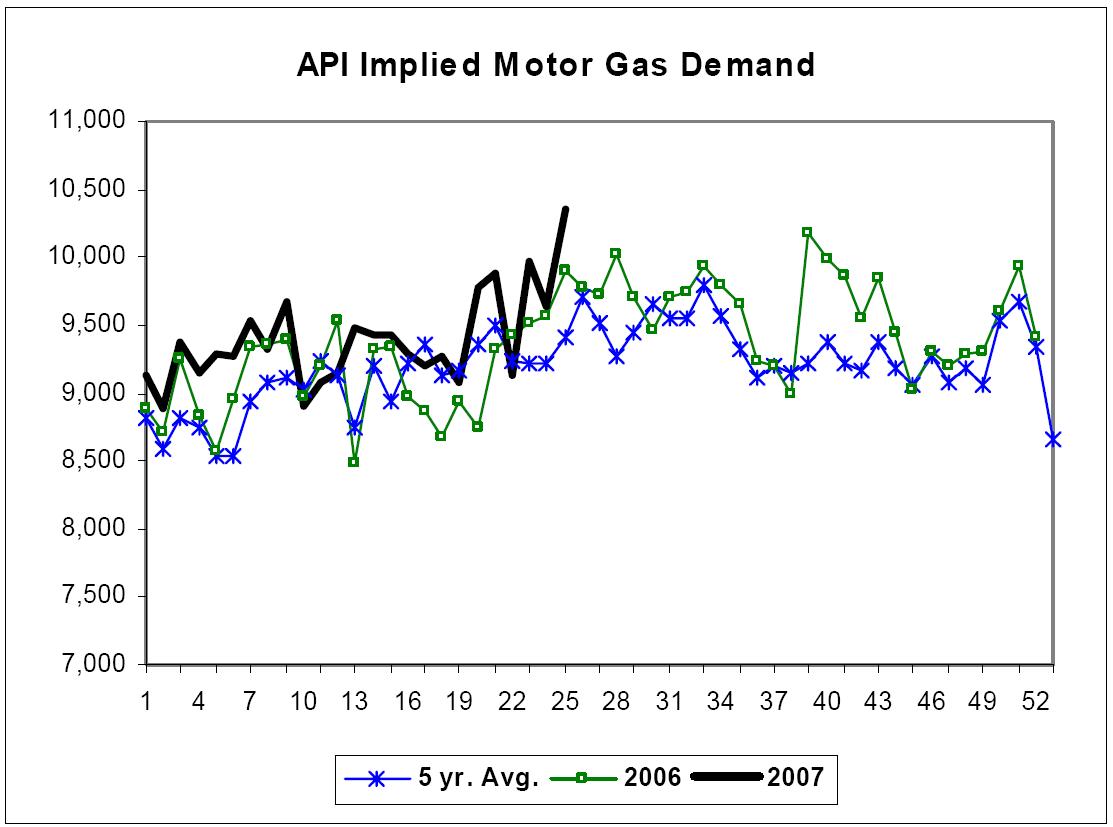
From Houdini to David Copperfield to David Blaine, magicians have always fascinated the public by making the seemingly impossible appear before our eyes. Whether it is making things disappear or floating in the air, magicians test the limits of what we think we understand. In U.S. oil markets, some analysts are wondering if magic might be the explanation for the near-record production of gasoline, even as refinery utilization dropped to the lowest percentage since at least 1991 for this time of year during the week ending June 15. Then, even as refinery utilization increased nearly 2 percentage points for the week ending June 22, gasoline production remained relatively flat compared to the earlier week. Unlike magic, however, no tricks are required to understand how gasoline production can appear disconnected from crude oil refinery throughputs.As the graph below illustrates, there are ways to increase U.S. finished motor gasoline supplies other than the processing of crude oil through U.S. refineries, and with current prices, there is certainly economic incentive to produce significant volumes of gasoline. First, consider gasoline production from U.S. refineries. Even if crude oil inputs stay flat, the yield of gasoline from a barrel of crude oil can be changed slightly as the result of operational changes or changes in the type of crude oil used in refineries. But recently, concerns have focused on crude throughput declines as a result of crude oil distillation towers being under repair or maintenance. In these cases, refiners can produce more gasoline by increasing their use of unfinished oils to use as feedstocks to units downstream of the crude tower, such as the fluid catalytic cracking unit or the coking unit. These unfinished oils may come from other U.S. refiners or from imports. One indicator that this may be occurring is that inventories of unfinished oils have dropped 6.4 million barrels in the six weeks between May 11 and June 22, a rate of about 150,000 barrels per day.
Second, consider blending activity at terminals that results in finished gasoline production. Blenders combine materials such as alkylate, RBOB, ethanol and other gasoline blending components into finished gasoline, which is included in U.S. gasoline production. Net inputs of blending components to refineries and blenders have averaged nearly 500,000 barrels per day over the last 8 weeks, significantly higher than the same period last year. While some of the gasoline blending components come from U.S. refineries, much of the blending component volumes come from foreign refineries as imports.
Some analysts have speculated that once refinery utilization did increase back to more typical percentages for this time of year, we would see a substantial increase in the already high gasoline production volumes. Yet, data for the week ending June 22, which showed crude oil inputs to refineries increasing by over 400,000 barrels per day, show hardly any increase in total gasoline production. It is certainly plausible that as refineries return to operation after maintenance, that gasoline production from unfinished oils may decline. Regardless of how gasoline is produced, the gasoline market remains tight with inventories remaining below the average range. Because of this, many analysts will continue to focus on gasoline production volumes the rest of this summer.
Gasoline Prices Lower, Diesel Gains 3 Cents
For the fifth straight week, the U.S. average retail price for regular gasoline was lower, declining 2.7 cents to 298.2 cents per gallon as of June 25, 2007. Prices are 11.3 cents per gallon higher than this time last year. All regions reported price decreases. East Coast prices dropped 3.0 cents to 294.6 cents per gallon. In the Midwest, prices fell 1.7 cents to 296.7 cents per gallon, while prices for the Gulf Coast decreased 2.3 cents to 288.0 cents per gallon. Rocky Mountain prices fell 4.3 cents to 313.8 cents per gallon but remain 30.7 cents per gallon above last year's price. West Coast prices were also down 4.3 cents to 314.5 cents per gallon. The average price for regular grade in California was down 4.4 cents to 319.2 cents per gallon.Retail diesel prices rose this week, climbing 3.0 cents to 283.5 cents per gallon. Prices are 3.2 cents per gallon lower than at this time last year. All regions reported price increases. East Coast prices were up 3.2 cents to 283.2 cents per gallon. In the Midwest, prices increased 3.2 cents to 280.6 cents per gallon, while the Gulf Coast saw a rise of 2.7 cents to 278.0 cents per gallon. The Rocky Mountain region climbed 2.9 cents to 293.6 cents per gallon. The West Coast price rose 2.7 cents to 298.5 cents per gallon. California prices grew 4.0 cents to 307.3 cents per gallon, but remain 6.7 cents per gallon lower than at this time last year.
Propane Inventories Push Higher
Propane inventories were pushed higher by a weekly build of 2.3 million barrels last week that put the nation’s primary supply of propane at an estimated 42.0 million barrels as of June 22, 2007. Although inventory gains have shown some strength in recent weeks, total propane inventories continue to track slightly below the lower boundary of the average range for this time of year. Regional gains were higher in all areas with the Midwest reporting the largest, measuring 1.2 million barrels. Elsewhere, Gulf Coast inventories rose by 0.8 million barrels last week, while inventories in the East Coast reported a gain of 0.2 million barrels. The combined Rocky Mountain/West Coast region remained relatively unchanged last week. Propylene non-fuel use inventories slipped lower by 0.1 million barrels and accounted for a smaller 6.2 percent share of total propane/propylene inventories, down from 6.7 percent from the prior week.
Here is the data in pictures, from Lehman Brothers energy analyst Paul Cheng:
And here is a different graphics perspective of the released data from energy analyst Daniel Burke of Johnson, Rice and Co.:
And what about demand?:
Im out the door for a canadian fishing trip so no time for analysis, but the story here is large drop in distillate, new 5 years highs in crude stocks, yet we are flirting with $70 oil. Please discuss and have the answers to this puzzle and our energy crisis by the time I get back next week...;)
Contact
- Content: editors at theoildrum dot com
- Tech support: support at theoildrum dot com
License

This work is licensed under a Creative Commons Attribution-Share Alike 3.0 United States License.
If you read Fatih Birol's comments, what he's saying sounds more like with or without Iraqi oil we are in "big trouble by 2015".
WTI < Brent < Tapis. So, marginally higher gas demand in the U.S. relative to refining capacity coupled with Asia scrambling to meet the dual challenges of local demand growth and America yowling for gas imports while despite high oil prices we're incentivized to stockpile crude ahead of even higher prices?
And despite all this, the National Hurricane Center stubbornly continues to report that "there are no tropical cyclones at this time in the Atlantic, Caribbean Sea or Gulf of Mexico?"
I don't get it.
Er, what should they be reporting?
Apparently, since they predicted an over-active hurricane season, there should always be one there no matter what. DAMN YOU WEATHER CHANNEL!! DAMN YOUR MISREPORTING!!
NOAA predicted the hurricane season, not the Weather Channel.
Maybe they should be reporting that Total Crude and Product stocks are near the top of the five year range as charted above, proving definitively that Peak Oil has arrived!
I'm no expert, but I suspect the three main factors in declining gasoline inventories are:
1)Robust demand
2)Low refinery utilization rates
3)Lower imports
With the start of hurricane season and Nigeria in the background I suspect we easily have $80 crude potential by August/September. Although I wonder in theory if Iran's new gasoline rations resulted in less imports, if they could be diverted to the other markets (i.e. U.S.)? Speculation.
So is the answer at least partly that we are in an international market for oil?
Are China and Europe and India increasing demand for oil while Nigeria and Mexico (and who else?) reduce or barely maintain exports?
Is the Export Land model coming into play here as well?
The USa is no longer the center of the oil universe, so even as we cannot refine all the oil available to us to meet our own rising demand, the rest of the planet is more than making up for our inability to drive the price of oil higher....?
I think for now the U.S. is still the center of the oil universe, with its position slowly eroding relative to Asia. U.S. demand for gas imports and its refining capacity limits suppress the price of WTI on the one hand, and help inflate the price of Tapis on the other.
So the answer is partly that we're a regional market for oil. I'm probably the only one who's surprised when oil turns out not to be that perfectly fungible global commodity the rest of you never thought it was to begin with.
So is the answer at least partly that we are in an international market for oil?
At least partly an international market for gasoline too.
The top three sources of gasoline imports to the US in the last six months: the UK, Virgin Islands, and France. The Virgin Islands is an interesting source, with most of the crude coming from Venezuela.
why do you find it interesting? that huge refinery has been there for decades feeding gasoline into the Hess system. Hess sold a big interest in it to PDVSA to ensure crude supply and to take out some cash (I suspect).
Venz has been a source of gasoline to the USA for ages on top of all the crude they sell us.
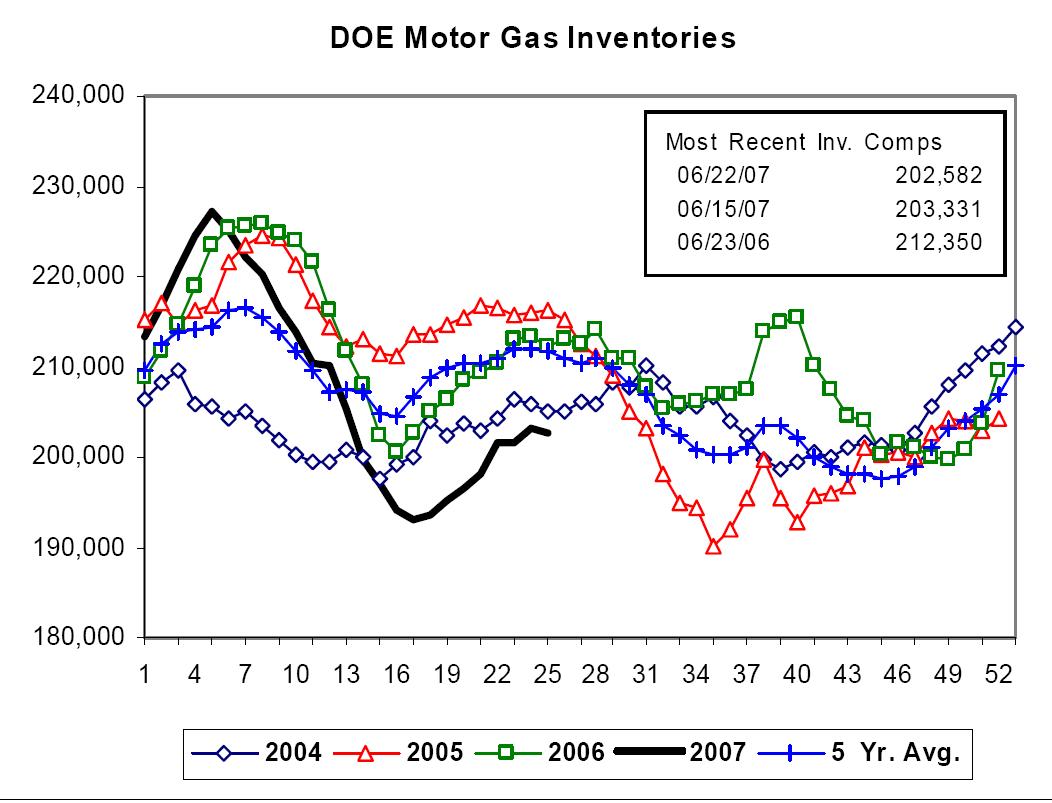
I haven't followed API inventory numbers, but couldn't help noticing the motor gas number was Down 5.3, while the corresponding EIA number was Down 0.7. For other values, the two seem to be at least somewhat close.
Has anyone been following API numbers? Should we be reading anything into the Down 5.3 for motor gas - perhaps a caution on the EIA Down 0.7?
These two never agree. Usually not even close. Which reminds me of an older MSM tactic of reporting only the most favorable reading from week to week. I haven't seen this slight-of-hand recently. Usually corresponds to the changing of the guard at the CNBC oil pit.
That said, the rolling average correlation over time is 4 nines.
looking at the weeklys in isolation is for mugs. Rolling 4 week averages have a lot more useful info.
Does anyone know how the SPR fits into this picture?
The last I heard was Bodman saying they were suspending their purchases until price came down.
Would their absence be partly the reason crude inventories are so high?
This paragraph on capacity in IEA's 12 June 2007 Oil Market Report, page 15, explains some of Fatih Birol's concerns
http://omrpublic.iea.org/currentissues/full.pdf
In other words, this IEA paragraph says that the world has only 0.35 mb/d spare capacity of light sweet crude because the spare capacities of 2.20 mb/d from Saudi Arabia and 0.30 mb/d from Kuwait are all heavy sour crudes.
It really does seem that world crude oil & lease condensate production peaked in 2005...
Your second sentence is wrong. There was not a draw in the complex. In fact, the build was 562,000 for the week and the 9th straight week of increases.
Total Crude Oil and Petroleum Products (Excl. SPR)
1,001,804 1,003,542 1,007,212 1,007,879 1,017,761 1,018,323 (You'll have to click the history url below to see all nine(Same 562000 with SPR btw)).
http://tonto.eia.doe.gov/dnav/pet/hist/wtestus1w.htm
Unless of course, your complex is different than my complex But then, what would be the point of slicing and dicing the data?
U.S. Stocks of Crude Oil and Petroleum Products, December 2005 to Present
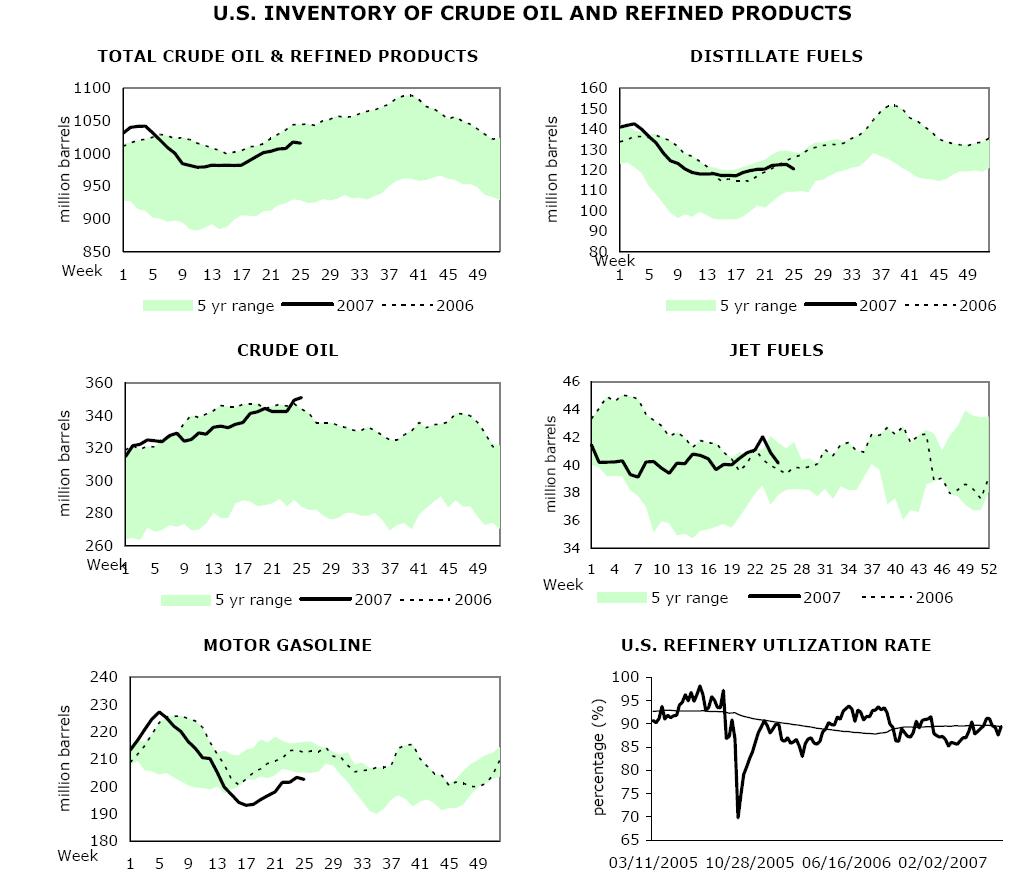
The sum of crude and products inventories was close to the five year average.
See Figure 2, the lower chart:
http://www.eia.doe.gov/pub/oil_gas/petroleum/data_publications/weekly_pe...
As part of his tour of Australia, Christof Ruhl, BP Group Deputy Chief Economist, gave a presentation today in Perth on the 2007 BP World Energy Report. He highlighted how, with oil and gas, production has moved away from the major consuming nations (OECD etc) to nations with large geo-political issues (Angola, Nigeria, FSU). He also highlighted the major role of coal consumption over the past 5 years, and how some UK gas consumption had been replaced in 2006 by coal, hence higher CO2 emissions.
He denied world oil production had peaked, quoting figures for 'crude + NGL', rather than the 'crude+ condesate' that the EIA uses. HOWEVER, he did admit in answer to my question on peak oil, that world oil reserve figures in the 2007 report, which now include Canadian tar sands, DIDN'T mean the reserves were either accessible or economically recoverable. So they're in the diagrams but we may never get to use them! Thanks very much, economist sir.
It's interesting that Ruhl quoted crude + NGLs because the most recent report out of OPEC seems also to point toward the expectation that NGLs will play an even larger role in the future (with a note that NGLs and condensates do not count toward the OPEC quota values) to increase production levels.
Outside my office I keep an updated set of production charts on my wall for the US and global values. It's very clear how important NGLs (and other liquids) have become and how, for the moment they 'hide' the decline in the production of C+C. In the US, NGLs monthly production is about the same level as the GOM and Alaska combined. In terms of total production since the 1920's, NGL production has been twice as large as the total prodcution from Alaska and the GOM combined.
While NGLs are important contributing liquids, they are not "crude oil" or C+C.
Glad you got one question answered, though.
Perhaps the reason we are seeing an inventory build of crude oil vs an inventory draw on products is a function of the high refinery crack values. In other words, crude is less expensive to buy than the finished oil products. While the refinery industry enjoys high refinery cracks they would be motivated to buy crude instead of finished oil products. There is tremendous international price competition for the mogas and distillates where as there is not as much competition for the crude...realtively speaking. So under current market conditions where there is a healthy carry charge built into the crude price and where the crack spreads are also very profitable, why not store/build crude inventories for future refining. To simply buy the finished product would be to then be paying the equivalent high price refinery crack which has already been biult into the price of the finished oil product...good idea to store oil for the future when we have a peak oil sceanario and massive crack spreads. Make any sense anyone???
I believe it is simpler than that. The futures market is in contango and further out oil is more expensive that front month oil. Thus it makes clear and simple sense to stock up close to max capacity on crude now and keep it there rather than paying the future anticipated price when we reach that particular month.
The futures market has been in contango now for a long time, sending a clear signal that prices are expected to only get worse. In such a market, you buy low (now) and sell high (later).
Ghawar Is Dying
The greatest shortcoming of the human race is our inability to understand the exponential function. - Dr. Albert Bartlett
When I checked the PEMEX site for what crude type was declining the fastest it was light marine crude.
Check this chart on page seven of the IEA PDF presentation.
http://www7.nationalacademies.org/bees/Nicola_Pochettino_Oil_demand.pdf
The quality of world petroleum is dropping and in a long term decline. The API average is dropping. A light crude will be 41 API. A low quality heavy oil will be about 8 API. The grade of crude is dropping. There are not enough cokers in place to handle the heavy stuff. You might fill a cavern with it, but if you do not have the equipment to refine it ... out of luck. There were sulphur problems that have become very expensive for the refineries to solve. Sulfur is acidic and combined with moisture it rots pipes that leads to corrosion and refinery fires. It must be removed from the oil to protect the public from the acid rain that is damaging China and India.