Finding Needles in a Haystack
Posted by Sam Foucher on June 27, 2007 - 11:38am
This is a guest post by WebHubbleTelescope.
In school, we used to do horrendously difficult mathematical "word" problems routinely. I remember occasionally getting one right, but more often ended up punting on the problem, and then waiting for the teacher to explain the solution in all its elegant simplicity. Of course, just about every real-world problem contains inherent ambiguities and incomplete information. So we rarely get to see the elegant solution in our day-to-day work life. Sometimes we get lucky and nail a problem, but in the majority of cases, we eventually resort to creating a limited model of the problem domain and deal with that.The problem that I have recently wrestled with has to do with predicting future oil discoveries based on historical dynamics. Ideally, I want to reduce it to a solution that has the elegance of a word problem, and not have to deal with messy economic and geologic factors that would quickly turn it into a rat's nest of complexity. Call me an optimist in this regard, but my intuition tells me that the solution remains as simple as ... finding needles in a haystack.
So I present a starter word problem:
Given a large number of needles dispersed in a random spatial manner throughout a good-sized haystack, at what point in time would we find the maximum number of needles? As a nod to technology we get to monotonically increase our search efficiency as we dig through the stack, and we can add human helpers as we progress.
Answer:
 Obvious,
and we don't have to even lift a pen. On average, the maximum discovery of
needles occurs as we sift through the last of the volume, and once finished,
the discovery rate drops to nil. So the instantaneous "discovery" rate looks
similar to the curve at the right. The acceleration upward in the curve occurs
as we get more proficient over time and can attract some help. Note that if we
mixed larger nails and smaller pins with the needles and instead measured
total weight or volume instead of quantity, we would have the same curve (this
has implications for the oil discovery problem).
Obvious,
and we don't have to even lift a pen. On average, the maximum discovery of
needles occurs as we sift through the last of the volume, and once finished,
the discovery rate drops to nil. So the instantaneous "discovery" rate looks
similar to the curve at the right. The acceleration upward in the curve occurs
as we get more proficient over time and can attract some help. Note that if we
mixed larger nails and smaller pins with the needles and instead measured
total weight or volume instead of quantity, we would have the same curve (this
has implications for the oil discovery problem).
Next, let's make the word problem a bit more sophisticated. Say that instead of dispersing the needles randomly through the entire haystack, we only do it to a certain depth, and to top it off, we do not reveal to the needle and pin searchers this depth. They basically have to oversample the haystack to find all the needles. If you look at the following figure, we separate out the "easy" part of the search from the "difficult" part (i.e. difficult as in not finding much even though we expend the effort). The boxes represent monotonically increasing sampling volumes, which we use to sweep out the volume of the haystack.
Hand-Wavy Answer:
 Suffice to say, if we search top to bottom, we will similiarly reach a peak,
but the peak will also contain a gradual backside. Intuitively, we can sense
that the sharpness of the peak reduces as the sampling volume overlaps the
region that contains the needles with the region absent of needles. And then
as the sampling volume drifts even deeper, the amount discovered drops closer
and closer to zero.
Suffice to say, if we search top to bottom, we will similiarly reach a peak,
but the peak will also contain a gradual backside. Intuitively, we can sense
that the sharpness of the peak reduces as the sampling volume overlaps the
region that contains the needles with the region absent of needles. And then
as the sampling volume drifts even deeper, the amount discovered drops closer
and closer to zero.
For us to draw the peak as a smooth curve, we need to add stochastic behavior to the search process. This can occur, for example, if the individual searchers have varying skills.
a stochastic variable is neither completely determined nor completely random; in other words, it contains an element of probability. A system containing one or more stochastic variables is probabilistically determined.
 What really makes the haystack problem different than the global oil discovery
doesn't lie in the basic word problem but rather in the application of
randomness or dispersion to the problem. We have much greater uncertainties in
the stochastic variables in the oil discovery problem, ranging from the
uncertainty in the spread of search volumes to the spread in the amount of
people/corporations involved in the search itself. We don't just deal with a
single haystack, but multiple haystacks all over the world. So the sharply
defined geometric discovery profile shown to the right gets washed out as a
result of the statistical mechanics of the oil industry ant-people hard at
work.
What really makes the haystack problem different than the global oil discovery
doesn't lie in the basic word problem but rather in the application of
randomness or dispersion to the problem. We have much greater uncertainties in
the stochastic variables in the oil discovery problem, ranging from the
uncertainty in the spread of search volumes to the spread in the amount of
people/corporations involved in the search itself. We don't just deal with a
single haystack, but multiple haystacks all over the world. So the sharply
defined geometric discovery profile shown to the right gets washed out as a
result of the statistical mechanics of the oil industry ant-people hard at
work.
Final Exam Answer: Let's jump from haystacks to oil discovery. We solve the problem by making the generally useful assumption that the current swept volume search has an estimated mean, and a variance equal to the square of the mean. In other words, in the absence of having any knowledge in the distribution of instantaneous swept volumes, we assume a maximum entropy estimator and set the standard deviation to the mean. A damped exponential probability density function follows this constraint with the least amount of bias, maximum uncertainty, and a finite bound (the latter factor would rule out something like a log-normal distribution). The following curve demonstrates how the spread in values gets expressed in terms of error bars.

In a nutshell, we want to solve the discovery success rate of a swept volume
realizing that part of the volume straddles empty space. In other words, to
account for the effects of the dispersion of oversampled volume, we have to
integrate the exponential probability density function (PDF) of volume over
all of space, and determine the expected value of the cross-section. To solve
the problem by baby-steps, we first take a look at the one-dimensional version
of the problem, then extend it to three-dimensions, and finally add the time
variation.
I originally used the following single-dimension equation derivation to solve the reserve growth "enigma" of a single reservoir.
In the three-dimensional case, the stochastic variable lambda
represents current mean swept volume, the term x integrates over all
volumes, and L0 represents the finite container volume
Vd. The outcome L-bar represents a kind of pro-rated
proportion of discoveries made for the dispersed swept volume at a particular
point in time.
By itself, the function corresponding to L-bar doesn't look like
anything special, and indeed looks a lot like the cumulative of the
exponential PDF. However, the fact that lambda monotonically increases
with time, together with L-bar appearing in the denominator, gives it
interesting temporal dynamics, of which I contend follows the empirical
observations of cumulative oil discovery and that of reserve growth as well.
From first principles, we would expect that swept volume growth approaches a power-law, and likely a higher-order law. For example, considering the "gold-rush" attraction of prospecting resources alone, we would expect that linear growths in (a) oil exploration companies, (b) employees per company, and (c) technological improvements would likely contribute at least a quadratic law.[1] In terms of the bottom-line, multiplying two linear growth rates generates a quadratic growth[2], and multiplying more linear rates leads to higher order growth laws. As an example, you can see this power-law increase play out as evidenced by the historical increase in average oil well depth over the years (see [3] for data point references).
But of course, this only accounts for one dimension in the sampling volume. So if we make the assumption that the effective horizontal radius of the probe also increases with a quadratic law, we end up with a power-law order of n=2*3=6, where the 3 refers to number of dimensions in a volume. Because we actually use cumulative volume in the stochastic derivation, the order becomes 6 in the result shown below. When we make an assumption that the parameter k denotes a fraction of the swept volume that results in a cumulative discovery D(t), we can replace Vd with Dd, where Dd is essentially equivalent to a URR for discoveries.
D(t) = kt6*(1-exp(-Dd/kt6))and the derivative of this for instantaneous discoveries (e.g. yearly discoveries) results in:
dD(t)/dt = 6kt5*(1-exp(-Dd/kt6)*(1+Dd/kt6))For a family of power-law growth functions, the trend looks like the following set of curves. The salient point to note relates to how we trend toward an asymptotic limit at the volume Vd as the power-law index gets larger.
To briefly summarize how dispersion of prospecting effort affects the discovery process, consider the curve below. Initially, as the sampling probe stays well within the Vd limit, the dispersed mean comes out as expected since we do not oversample the volume. However, as the standard deviation excursions of the cumulative volume starts to bleed past Vd, the two curves start to diverge and a rounded discovery peak results.
Scores of depletion analysts, including Laherrere, have pointed out the similarity of yearly discovery curves to the classic Hubbert curve itself. For the following discovery curve from Shell Oil (courtesy of a TOD post from Rembrandt) one can see the same general trend, albeit buried in the noisy fluctuations of yearly discoveries.
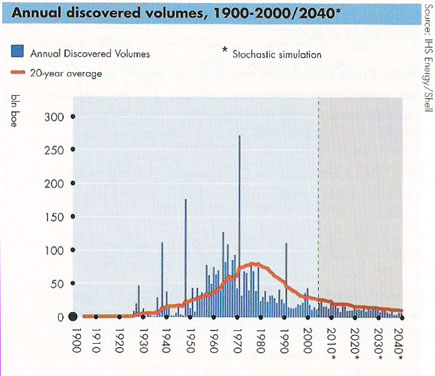
To remove the noise, we can generate a cumulative discovery curve. Apart from missing out on the cumulative data from the years post-1858 to the initial year of collected data, we can generate a good fit to the curve with an n=6 power-law dispersive growth function. (Note that the curve has a constraint to start in 1858, i.e. t=0, the "official" date which signalled the beginning of serious oil exploration)
Applying this modelled discovery curve to the Oil Shock production model (see the m o b j blog and a review by Khebab here at TOD), we come up with the following production extrapolation
The oil shock parameters include a fallow latency of 6 years, a construction latency of 8 years, and a maturation latency of 10 years. It also includes the following extraction rate shock profile
Interesting that this gives a production peak around the year 2010, even
though the effective URR from the Shell discovery data amounts to 3.5 trillion
barrels -- much higher than the lowball 2+ trillion estimate commonly bandied
about by pessimistic peak oil analysts (note that the shell estimates uses the
somewhat ambiguous "barrels of oil equivalent").
We can further substantiate the discovery fit by applying it to the USA data subset. For instance, let's consider what would happen if we used the same parameters from the global data to estimate U.S. discoveries. Note that the same constants (i.e. k and n=6) are used, but we change the Dd to reflect a fractional area of the US in comparison to the world.
World Land Area = 150,000,000.0 km2So to first-order, the Dd for USA is 1/15th that of the world's Dd (Roland Watson posted a similar sanity check recently on TOD with reference to USA and world URR). The following figure lays the cubic-quadratic discovery curve on top of Laherrere's data.
USA Land Area = 10,000,000.0 km2
Within an order-of-magnitude, the fit doesn't look out-of-place. In the context of swept volume, it means that the USA reached its limit of easily discovered oil quicker than the rest of the world, which makes sense as serious oil exploration started in the USA.
After the equations have been solved, the result can be translated back into the ordinary language.
As for as other criticisms, I suppose one could question the actual relevance of a power-law growth as a driving function. In fact the formulation described here supports other growth laws, including monotonically increasing exponential growth. Furthermore, one could question whether we can sustain a power-law growth in the future, which together with extraction rate extrapolations, will have a significant impact on how future production will conceivably pan out. And to account for any further reserve growth, the fact that much of the fit curve occurs before the peak happens means that past discovery estimates have had a chance to mature and we have more confidence in the discovery decline profile. In my opinion, this makes it a fairly conservative estimator -- to substantiate this take a look at the huge effective URR for the Shell discovery data, which in all likelihood includes reserve growth, and note how it only impacts the peak date a few years from my previous shock model prediction of 2004 (which had no extrapolated future discovery data and used solely Laherrere's discovery data which had a much lower effective URR of around 2000 GBls).
Or, one could question the impact of super-giant discoveries on the smoothened discovery plot. Statistically, super-giants get treated like anything else in this model and they populate the volume with the same randomness. Predictably, one could also question the absence of deep geologic or economic considerations in the model. The canned response to that line of questioning is second nature to a seasoned statistical mechanic: physicists and other scientists apply such stochastic approximations all the time without a lot of fundamental problems. Why should this stochastic model become an exception to the rule?
I also have not opened up the future possibility of a levelling out or even general decline in discovery search effort. I gave this some serious effort in past blog postings, but realized that this would give too pessimistic a prediction and perhaps too much of an artificial constraint.
Finally, one could question why no one else in the oil industry thinks in terms of this kind of discovery model, in other words, why hasn't someone else found this proverbial needle in a haystack? Don't ask me; for all I know, an analyst in some energy corporation's back room has come up with the same idea and it has transformed into filing-cabinet intellectual property with no hope of seeing the light of day (i.e. what good would it do them financially?). Or perhaps, a similar idea remains buried in some academic journal, for which I lack the resources to discover on my own. But if my approach indeed has some originality and correctness to it, I can rationalize this with a more mundane explanation that comes from, in part, my experiences in solving problems in the research and software world. Occam says to rely on the simplest explanation to a problem; but what happens when two sufficiently separate but equally fundamental explanations contribute to a greater understanding? In these cases, we have to overcome the inertia of conventional wisdom.
To explain this rather philosophical point, I consider an oil depletion model as a two-stage word problem. The first part of the word problem relates to production (illustrated by the Oil Shock model) and the second part provides a model of the discovery input used to feed production (i.e. the basis of the Cubic-Quadratic discovery model desribed in this post). The relationship of two interacting models has some similarity to an aspect of software debugging instanced by the occasional defect that takes enormous resources to resolve. Or resembles in some ways to the laboratory anomaly that no one can pin down precisely by experiment. Invariably, the most difficult bugs to resolve result from two or more interacting defects. In my opinion, these remain the most elusive problems to solve simply because you don't normally think that more than one fundamental issue contributes to the cause of a root problem. And there you have an example of a real-world word problem. While everyone and their cousin wants to figure out oil depletion with a single freakin' logistic curve (excepting R2), as though that contains THE key to the kingdom, we realize that oil depletion may have two underlying forces at work -- namely, the discovery process followed by the extraction process. And so we rely on the wisdom of a divide-and-conquer strategy -- figure out the extraction/production problem all the while knowing that the discovery problem lays in waiting, or vice-versa. Now think back to the original "needle in the haystack" problem; notice that in that case, discovery and extraction occur at the same time. Once you find the needle you can extract it. But not so with oil, as discovery only starts the process that culminates in extraction and production. In my opinion, when we can understand the two problems individually, we can then solve the penultimate word problem of our times.
[1] Note that parabolic growth is not the same as quadratic growth. Due to some historic conventions inherited from Silicon Valley, parabolic growth actually follows a fractional power-law growth, more precisely a square-root of time dependence.
[2] See growth in wiki words for another real-world example of quadratic growth that occurs as we speak.
[3] I gathered the max depth well chart from these sources: 1, 2, 3, 4, 5, 6, 7, 8, 9, 10
Contact
- Content: editors at theoildrum dot com
- Tech support: support at theoildrum dot com
License

This work is licensed under a Creative Commons Attribution-Share Alike 3.0 United States License.
Khebab,
As usual, A+ on your article.
I think I could find needles in a haystack more easily than I could find much new oil--because with a powerful magnet I could get through that stack in a day or three.
Your assumptions are clear, your logic is valid, and I think your conclusions are compelling.
This masterpiece is actually from WebHubbleTelescope, not me. I'm just a mere messenger.
Whoops! I see the A+ should have gone to webhubbletelescope. But Khebab still retains his grade, because all his articles (in my estimation) are in the top tenth of the top one percent of quality of postings found on TOD. Indeed the quality of postings this past month has been extraordinarily high. Could it be that the most excellent Oildrum is getting even better?
Or maybe its Peak Oildrum excellence....lol. Seriously though, it will take several passes and some college algebra review for me to fully understand. So far, excellent work Webhubbletelescope!
I have been interested in the following method, since I read about it in "Ship of Gold in the Deep Blue Sea"
http://en.wikipedia.org/wiki/Bayesian_statistics
I am working to flatten the Lower 48 HL plot, by looking for small overlooked oil fields. While small, the fields can be quite valuable. For example, with the right reservoir, a 500 acre area could produce 5 mb of oil. If Simmons is right about oil prices, this 500 acre area could generate a gross cash flow to the working interest owners and royalty owners of a billion dollars, in constant 2005 dollars. Which of course is fine, until the rioters appear at the gates of the mansions of the energy producers.
Private security is one of the most rapidly growing industries in the U.S. Globally, I wonder how many private security men are employed in the oil industry? My suspicion is that the number is quite large and growing in double digits each year. This factor is getting to be a significant cost of doing business.
Bayes rocks.
I know a decent amount of it, but not enough to express competence. I've done a couple of conference papers using Bayesian models, but that's because a buddy is much harder core Bayes than myself.
The frequentist world is a lot easier (central limit theorem, yadda, yadda), but Bayes makes a lot more intuitive sense. The math, however, is a lot harder.
I recommend Jeff Gill's Bayes book, if you're interested:
http://www.amazon.com/Bayesian-Methods-Behavioral-Sciences-Approach/dp/1...
(the estimation of priors, on the other hand, by this crowd, would be pretty good. *laugh*)
I'll probably get the book.
If you haven't read about the SS Central America, here is the link: http://www.amazon.com/Ship-Gold-Deep-Blue-Sea/dp/0349110999/ref=pd_bbs_s...
It's a remarkable story, from the sinking of the ship, and the rescue of some of the passengers, to the search for the wreck.
Prof. Goose,
IMO, the best introduction to Bayesian statistics is still the classic by Leonard J. Savage, "Foundations of Statistics." After sixty years, that text has stood the test of time. I remember struggling with the book back when I was fifteen years old and smarter than I am now, but after a few rereadings and working of problems I finally got it. (I may not be exceptionally bright, but I am exceptionally persistant.)
I find the combination of Bayes, diffuse priors, and the Kalman Filter to be very appealing & a useful linear model.
Neat stuff.
The basic idea behind the Kalman filter, IMO at least, is to have a good model for the uncertainty in the data. In other application areas, this uncertainty can be related to noise or other fluctuations which is then used to for example extract a signal from noise. In the model presented here the uncertainty about the mean is really meant to represent fluctuations in the volume sampled, or also in terms of what we think the volume that we sampled. So in this regard we can try to extract the growth in discoveries from the underlying dispersion.
The latter uncertainty is also very critical as input to extraction models, because our estimation of, e.g., how much reserve we have, is crucial input to the amount of effort we expend on getting the stuff out.
Can you use a substitute model for comparison? Such as the number of dry holes per successful hole, with a slope adjusted for increasing data confidence due to better imaging and drill guidance?
"Dig your heels firm unto dirt; and where is the dirt going..?" -Frank Herbert, "The Jesus Incident"
Web -
To add to your KF description, I learned the KF (long ago) via recasting the standard OLS problem in the KF framework. I liked being able to 'see' the impact on the parameter estimates as data points were added to the time series: I found the explicit signal-noise decomposition the KF provides to be 'illuminating'.
Wow, that was brilliant! It is exciting to read something that makes total sense and is also surprisingly novel.
I suspected that the key to understanding oil production lay in the discovery part. It now makes sense that oil production and fishing show similar curves, as they both involve searching for a resource. I wonder where this leaves the logistic. Models of infective agents also involve searching for an uninfected host, for example.
It makes some weird sense since King Hubbert was known to be a fanatic fisherman, and he made several friendships with other sports fisherman who also wrote about peak oil.
Craig Bond Hatfield : http://www.theoildrum.com/node/2364/0
George Pazik : http://mobjectivist.blogspot.com/2005/05/our-petroleum-predicament.html
I think that these guys spent a lot of time thinking on the water what the future held for a finite resource. I can't think of anything that a fisherman hates worse than a "fished-out" body of water.
Of course, we still have to deal with an issue of some complexity (as if we needed more!). that being: Suppose you are lookin for needles in a haystack that has certain sections of the haystack off limits?
The issue with oil is exactly that, in that some areas are pretty much forbidden to be drilled in for environmental reasons or cannot be correctly explored due to geo-political reasons. Who is going to spend money looking for oil in areas that they will not be allowed to produce in anyway?
I am asking this question for a reason. Recent remarks from the oil industry both worldwide and domestic U.S. seem to indicate that this is the argument the industry intends to make, i.e., the issue is not lack of oil out there to be drilled, it's an issue of "access" to that oil.
Christophe de Margerie has been adament on this, with his "120 million barrels a day, never", remarks. Some people took this as an endorsement of Peak Oil, but it was NOT an endorsement of conventional (Hubbert) peak, but instead an argument that the politics and geopolitics are the limiting factor.
In his nationwide road show, the President of Shell Hofmeister has been making the same argument.
The access argument is the only one that can rationalize the problem that while the oil industry continues to assert there is enough oil so that we "never run out, never" (Mr. Hofmeister of Shell), or that there is no danger of peak until sometime after 2050 if ever (API chief), or that the oil is out there, we just cannot get it out of the ground fast enough due to logistical/political constraints.(Christophe de Margerie of Total) Who looks for oil in areas that they will not be allowed to produce in anyway? How long would the shareholders put up with that?
Christophe de Margerie of Total, Mr. Hofmeister of Shell, and the American API all seem to be lining up on this. One assumes that the other oil companies will soon follow, or that I simply have not heard thier speeches, and they are already lined up on this position.
Either way, for the consuming nations, the whole debate may not matter. A "logistical peak" can be just as destructive as a "geological peak" (i.e. Hubbert peak) for the buyers, driving prices higher and finally resulting in real shortages. My guess has always been that we will be forced to alternatives long before we ever have to worry about a Hubbert geological peak, and that at least half or more of the worlds oil will be recovered at a very slow rate compared to history, mainly as an industrial/chemical raw material and not as fuel to be burned (always a waste of crude oil and natural gas anyway), but will be thusly very expensive compared to historical standards.
On that assumption, we can conclude that more oil has already been discovered than we (the consuming nations) will be allowed to drill, at least for some time. That would make future discovery a moot point. Why would an oil company search for oil it cannot drill when it already knows the location of more oil than it is allowed to drill, or can logistically support the drilling of due to lack of labor, capital or machinery?
Roger Conner Jr.
Remember, we are only one cubic mile from freedom
The amount of "off limits" area is statistically tiny compared to the overall surface. Further, much of this so-called off limits area has been explored but not developed, either because of restrictions or because the area was devoid of oil producing rock. It would seem that you are more worried about the speck in your brother's eye than the log in your own.
Ghawar Is Dying
The greatest shortcoming of the human race is our inability to understand the exponential function. - Dr. Albert Bartlett
GreyZone:
The entire eastern half of the Gulf of Mexico, The entire Atlantic Coast of the US, and Offshore Pacific Coast areas have been off limits since the Santa Barbara Blowout of Chevron's in 1978, as I remember. Since then the frontiers in the drillable part of the Gulf has expanded from about 500 ft. water depth to the current limit of 7,000 ft.subsea. In addition the drilling methods have changed radicially with huge advances in directional drilling, and exploration has changed because of 3-d seismic to an economic success ratio of about 2/3rds on wildcats. There's a map in the pocket of the second edition of Halbouty's Saltdomes Gulf Region of United States and Mexico that shows dozens of these prospects.
Don't misinterpret this to mean that we can drill our way out of 21 million barrels of daily consumption in the by opening these areas up, but there is probably huge amounts of oil and natural gas in these areas. In addition there are the very difficult areas of the Artic Ocean, Greenland and the Antartic which have never been explored. Russia has claim to about 2/3rds of the Artic Ocean, the US and Canada and Denmark much of the rest.
These aren't "statistically tiny" areas
From what I've read, the estimates that have been done so far on oil in Antarctica suggest that optimistically it wouldn't be economical at anything less than $100/barrel, even though there may well be super-giant fields there.
No drilling has actually been done though.
The problem with such figures is that they are based implicitly on the ceteris paribus assumption. If oil was $100 and all the other prices stayed the same then maybe this activity would be economical. The problem is that if oil is $100 then the rest of the price structure in the economy adjusts and the a higher price is needed to justify the activity. It's not quite Zeno's paradox but the same rosy predictions for the tar sands were made that they would be very profitable with $50 oil. This has been brought up on this board several times before.
+ the fact that we have a continuum between the ideal locations for exploration and the most inhospitable, and we have not filled that in with any major discoveries suggests that we know the trend. In other words, the model does not have a clean break between the Texas's of the world and the Anatarctica's. The world is continuous and the model does not show discontinuities, and likely neither will the data (apart from fluctuations).
WebHubbleTelescope
That would be true only if we had a sampling of the inhospitable areas equal to that of the easy to drill areas, and the factors for oil and gas formation were known to be equivalent.
The current thinking is that much of the oil source rock is organic rich shales deposited in cold 500 meter deep range waters in anaerobic conditions, which strikes me as a good description of the Artic-Antartic regions. But this is an hypothesis, a little more proven than dinosaur farts, but still no where near an established consensus.
The point made above about economics is valid. No way drilling in 7,000 ft of water on the outer continental shelf or in the high latitudes is going to be the substitute for oil produced at $5/bbl lifting costs, and the transportation is going to be exhorbitant too. I don't think we can ever overcome the cornucopians arguements by answering every pie in the sky scheme individually. But we can answer them that the Peak is here in economicly produced crude.
The current thinking is that much of the oil source rock is organic rich shales deposited in cold 500 meter deep range waters in anaerobic conditions, which strikes me as a good description of the Artic-Antartic regions.
In general the climate and location of the oil we are extracting today was quite different from that when the source rock was formed and the later heating event is very important.
I suspect most of the dry holes people talk about are more no useful quantities of oil or gas but almost any sedimentary basin probably has at least trace quantities of oil and gas.
Its commercially exploitable reserves that are rare.
I'm from Arkansas but we hit methane drilling water wells through the buried shell layer often. These are shallow wells but they often produce problematic amounts of methane
coming from natural fractures.
As far as wild theories about oil production my theory is the oil shale is laid down and buried during global warming events. The scenario is as follows.
The glob warms drying the land leading to huge dust storms that fertilize the ocean this leads to blooms and anoxic conditions leading to a high rate of shale formation.
Next these same condition cause peirodic and devastating super storms hurricanes are very strong monsoon events that strike the land masses and since they are mainly desert you get extensive erosion from these events. This sediment is spread over a large area by the outflow of water after the storm passes burying the mud under a deep layer and also filling in nearby areas with future sandstone. This continues until the CO2 levels drop but we now have conditions primed to start oil formation.
A bit further out but reasonable is that as the climate goes from cold to hot conditions the melting ice and warming seas
cause increased forces in the basin areas and rising land where the ice is melting this speeds up plate tectonics by creating and relieving stresses over a pretty short period of time. Not sure the end effect of this but you would expect a increase in volcanic activity with in a reasonable amount of time of going from cold to warm environment and vice versa.
Crackpot theories over :)
Roger,
If were to read the following speech by Exxon's Tillerson You will see that he is saying more or less the same thing. He did mention OPEC directly but it can be inferred from the context.
The speech was made last week, in London, at the Royal Institute for International Affairs.
off limits
There are three significant advantages to the off limits argument:
money - It opens up the US market to places currently off-limits (national parks, wilderness areas, etc). The US is one of the most generous nations in the world regarding oil and gas leases. Even if the total volume is modest - the ROI is quite attractive and the risks are low.
imperialism - it supports an aggressive investment in policies and strategies designed to open up markets via extreme measures.
CYA - we can always shift the blame to Saudis, Chavez, Putin, et al rather than examine how our own policies, investments and decisions may have contributed to the current challenge.
Thank you, WHT! As for your discovery graph, I believe it includes natural gas as well (just as Shell now includes all the Omani natural gas to offset their "reserves" loss due to the collapse of Yibal's crude production). This is relevant because the natural gas is being burned at the same time as the crude oil so if you are going to model production (and consumption) along similar lines you would have to merge the natural gas and petroleum production and consumption data to get a full picture.
Ghawar Is Dying
The greatest shortcoming of the human race is our inability to understand the exponential function. - Dr. Albert Bartlett
Yes, the boe - "barrels of oil equivalent" - metric. I know it can't include all the NG discoveries or it would really bloat the curve. See the following USGS estimates of boe:
http://www.usgs.gov/newsroom/article.asp?ID=636
So they in fact tend to cherry pick the sources. Makes a lot of sense, particularly when we realize that Shell Oil came up with the graph.
As far as the logistic model goes or HL its greatest weakness is it effectively assumes discovery is finished well before significant extraction starts and is focused on exploiting a known resource. This is why the shock model is a much better model for real world oil extraction. However since peak oil happens well after the discovery curve had dampened down the effect or echo of discovery times should decrease as the system approaches peak and passes peak oil. So increases in production because of new discoveries becomes less and less of a factor.
As far as mapping this to a disease model I'd guess the closest would be the spread of a epidemic. Once the rate of infection drops below a certain level the epidemic dies out.
Its interesting to note that the worst epidemics generally only kill less than 50% of the hosts before the rate of infection drops to zero.
http://en.wikipedia.org/wiki/Black_Death
In the case of the black death the rate was 70%.
So simply assuming infection is similar to finding oil.
We will extract anywhere from 30-70% of the oil before stopping.
So at least with this model questioning how much of the oil we will extract post peak makes sense.
Yes, many of these predator-prey and birth-death models show an approximately 90 degree phase shift between the effects. In some ways these mirror a form of non-linear trigonometry and comes about for essentially the same reason why a cosine wave is shifted by 90 degrees from a sine wave.
I still can't explain how it has a valid relationship to oil though.
So hopefully we can eliminate the need for it. I do not like the logistic for oil production. But its not something that can be trivially dismissed.
Your on the right track to either removing it or finding a physical basis that causes logistic behavior. But any reasonable physical model is far better than empirical logistic fitting that happens to work and the models will obviously be close in the cases where the logistic works.
Web, I rejoice in finally having a post from you on TOD. You’ve been around longer than I, and you surely had an important role in making TOD what it is today.
I don’t think that everyone’s relying on a single Logistic like you imply, any modeler should at least look at discovery trends before endorsing blindly the results of HL. For me it’s the fact that several essentially different techniques point to a close result, that make me think that this problem is quite well understood. And if HL is not the key, at least looks like a very simple candidate to that (thinking of Occam).
I’ll not pretend that I’m savvy enough in mathematics to criticize your conclusions, but I can’t help to ask you what the ultimate word problem of our times is.
Last question first: the ultimate word problem is "What is the meaning of life?"
::
I basically have said what you recommend in comments to a recent post by WestTexas -- that HL and the Logistic model should be used as a supplement to other techniques. That it should not be used isolation, which is why adding in discovery and bottom's up techniques is so important.
The mathematical problem with the Logistic/sigmoid equation is that it is non-decomposable. If you accept the premise that total production is some convolution of the driving stimulus of discoveries along with the dynamics of extraction, then you need separately derived functions that work together. I assert that you cannot find me two functions when convolved will give a sigmoid function or its derivatives. In fact, the derivation of the Logistic comes about from a very simple nonlinear differential equation which by itself does not decompose very nicely (because it is in fact so simple).
Now, it may be that discoveries themselves could be represented by a Logistic model, but for me its a head-scratcher to set up as a word problem that does not somehow involve population dynamics. I believe that I may be too tainted by looking at birth-death and predator-prey models to think outside the box or to crowbar the Logistic model into a different application area.
WestHubbleTelescope,
Thanks for a very interesting post. I will have to think it through to understand the statistics, which will be very useful to me!
In regard to the simple sigmoid's, I like them because they are so simple. IF Q = fraction of total extracted, dQ/dt = Q*(1-Q) nicely sums up growth in a finite system. It's a good first-order approximation that shows as the fraction of a resource consumed gets near substantial fraction of the total, the rate of consumption will decrease.
In the case of Oil, we're having arguments about whether URR is 2 or 3 trillion barrels and no one disputes we've consumed 1 trillion. So any way you look at it, Q =0.5 or 0.3 and peak production rate "is some time soon".
Having said that, having corroborating evidence from the bottom-uppers and now this great work on the discovery model lends credence to this "back of the envolope" HL linearization.
BTW If you do a HL on gold, silver, copper and many other high-demand extractable resources, you get a flat line. ie We're not close to Q = 0.1 for them, which can also be verified with a back-of-the-envolope calculation of the total crustal amounts the materials compared to how much have been extracted, It's typically less than 10^-6.
Very interesting aside in the BTW regarding precious metals.
Indeed it is possible that we know where all the fairly accessible metal discoveries have been made, but the rate of extraction is so slow compared to oil that it broadens out the production profile in time.
By the same token, gold when very easily accessible (i.e. Yukon, California, and other gold-rush towns) gets extracted really quickly and you get a sharp drop off after a geometric rise in prospectors + discoveries.
The other one is a species like passenger pigeons, of which discovery/production shot up really quickly and then plummeted as the birds went extinct. Interesting that up to just a few years before disappearing, bird harvest rates were at their highest. Technogical innovations such as huge nets and dynamite did a number on the birds and they could not sustain their population.
Some other materials like helium and molybdenum are dependent on coexisting materials (NG and copper, respectively) so this has another kind of dynamic.
So the big question remains for oil: which direction is the extraction rate headed?
I'm going to test my OilDrum skillz here by posting a few HL graphs of copper, gold, silver and tin production.
Sorry for the low quality graphs. I haven't put time into pretting them up. The data are for the period 1900 - 2004 from the USGS.
The hard part was obtaining the production prior to 1900, for which I pent a fair bit of time web surfing. I'm pretty confident of gold, copper and silver. But for tin I just scaled the copper production prior to 1900 by the production rate post 1900.
I suspect it has more to do with the central limit theorem. The most likely abundance of any mineral is it's average crustal abundance. However various geological processes serve to enrich some rocks in one mineral or another. Mining companies compete with one another to find the largest resources at the highest grade.
But as the average decreases with time as the rich resources are mined out, the total size of the resources developed increase since there is more of a mineral at grades closer to the average crustal abundance.
So it's kind of like the Uranium content in seawater. We have a relative abundance of U in H2O, but to extract it all from a uniform medium like water is not interesting in its dynamics.
I looked at the precious metals markets and they are warped.
If anything reminded me of gangsters and drugs vs a traditional market.
A key post by someone that understands this market would be cool.
Puzzled. Great model and very simple. I think this does a good job on the discovery side. Biological foraging models are similar but more complex. I'm trying to understand the next step between discovery and production. First their seems to be and obvious feedback loop if your making large discoveries quickly faster then you can exploit them you would think discovery would slow since its not cost effective to continue to look while having large reserves. Next in general since a lot of luck is involved in oil discovery a single discovery causes more intense searches nearby. And of course as a resource is consumed more energy is again devoted to discovery. At a higher level the population of resource consumers feeds back into discovery.
This gets into traditional supply and demand.
On the other side of the coin model of growth are common give a resource thats not a problem.
The problem is the interaction between discovery and resource usage. I don't understand this interaction.
Does anyone have a simple and concise explanation of the interaction between discovering a resource and using the resource ?
I've so far been unable to find anything that focus on how this interaction plays out. It seems to me that the coupling is strong but I don't how it works. Or since I don't understand maybe its weak but this does not seem to be true.
Instead it seems to me that supply and demand drive discovery which drives supply which leads to cycles of relative plenty and scarcity until the model proposed in the paper results in eventual scarcity regardless of demand for a non-renewable or exploited resource. So is their a simple model for this relationship ?
So ignoring extraction for a moment or if needed assuming a very simple model for extraction what form would/should the interaction between discovery and extraction take ?
I'd argue a fairly strong coupling term.
Or a weak coupling term on further thought :)
Weak because more discoveries provide more of the resource at a cheaper price leading to more demand if the resource has multiple uses leading to more depletion leading to more discoveries. Next above a certain threshold the rate of discovery would be only loosely bound to the number of searchers. Consider the California gold rush. Once gold was found prospectors swarmed the region looking for more gold but beyond a certain level the region is well explored and even a low level of searching simply slightly delays the timing of a discovery. Consider the Canadian diamond minds.
So as long as any searching the discoveries will draw more intense searching nearby leading to a natural discovery rate independent of demand ?
Puzzled part two.
WHT can correct me but I don't think he is trying to explicitly capture any particular resource discovery to usage interaction. It would seem to simply be implied in his fallow and productive periods which he derives from real world observations. Rather than answer why (which may or may not be an interesting question in itself), WHT simply seems to note that there is a reasonably constant relationship between discovery and production and then inserts that relationship as a constant.
Ghawar Is Dying
The greatest shortcoming of the human race is our inability to understand the exponential function. - Dr. Albert Bartlett
This constant is between the amount discovered and the rate of production in general once a resource is discovered its produced there is and obvious time lag between initial discovery and full production caused by the need to mobilize the resources needed to take advantage of the discovery. This mirroring of discovery into production is a key aspect of the shock model. See my other comments this has more to do with economic ties and feedbacks between the two where high prices spur more searchers to act.
I think your right now and if its a constant then their is no strong coupling which is what the shock model is telling us.
Look at the rest of the posts this goes against the dogma of economics which claims high prices spur renewed discovery which causes more products to be discovered lowering prices.
WHT may have accidentally made a interesting and controversial claim with a very solid case.
This is a good interpretation.
As I said in a comment above, it is a strong coupling in terms of the math: discovery is the stimulus and the shock model is the response function. You can't have a response without a stimulus. However, you could say the dependence is weak because the coupling is memoryless, and all that matters is current estimated reserves based on discovery.
I think Khebab did a good analysis of this here:
http://www.theoildrum.com/node/2376
Look at the rest of the posts this goes against the dogma of economics which claims high prices spur renewed discovery which causes more products to be discovered lowering prices.
I suppose that the production response could be fed back into discovery stimulus as a feedback loop. However, I don't think that this has been a strong incentive in the past where things basically ran on open-loop greed. But I could imagine that real feedback may start occurring as we enter into a plateau. Instead of just a strong open-loop greed term, it will turn into a margin-based growth. Costs will prevent people from growing at too fast a rate and we will just sustain.
But by definition post world peak searching won't accomplish much just like the strong feedback loop in the US when it peaked had only a minor effect on production. Next considering the economics of a global peak the resources to poor massive amounts of men and materials into searching for oil probably will not be their on economic grounds. And considering most of the resources are controlled by National Oil companies the political will will not be their. Indeed the exact opposite of this seems to be taking place with all player reducing exploration and development thus accelerating the decline.
With a global peak the winning situation favors artificially reducing the amount of oil available beyond even that caused by depletion since you know no one can "take" the money your leaving on the table. And you need to consider export land.
This is why I said when searching finally become economically driven it seemed to have no effect and your model and this post indicate we need not worry to much about a strong coupling from economic consideration. To me this is
surprising but obvious given your model. This is a big argument against cornucopiies already. And its self evident that when discoveries don't provide replacement production will decline regardless of the model.
The argument is sound as it stands. HL bottom up etc etc are more to zero in on the date of peak the but I consider the current argument is capable as standing on it own as a powerful reason to take peak seriously. And refuting it will be very hard.
Actually for high demand metals like gold, silver and copper, this dogma appears to work very well.
You can do a HL of the production rate for them and you get a flat line, which implies exponential growth in production.
The difference is that for minerals, Q, the fraction of the total resource extracted, is less than 10^-6 compared to Oil, where it's between 0.3 and 0.5.
(See my post above)
I think a lot of economists have been confused by this fundamental difference.
The "natural" (I hate that word.) rate of discovery will be linked directly to price and hence indirectly to demand.
Despite their serious limitations, fundamental economic models do have a lot of predictive and explanatory power.
The puzzlement comes, I think, because rates of increase in supply are variable, and also rates of increase in demand are variable. Variable plus variable leads to a lot of uncertainty.
See my post below yours. I'm questioning this natural assertion. Also consider platinum demand is effectively infinite and equal to production. Anyone that does prospecting probably keeps and eye out for the mother load of platinum.
I know this relation is asserted in economics but has it been proved ? Consider lest say copper for example does prospecting for copper move with price ?
Instead I'd say that discovery is driven more by the amount of undiscovered regions left to explore as long as large unexplored regions exist that may contain a valuable resource they will be searched regardless of the market.
Market condition would then only effect well explored regions where the cost of exploration vs the chance of a large discovery need to be weighed.
Consider another example once Europeans had the means to explore the world in relatively decent ships they explored aggressively regardless of the amount of preceeding discovery until the chance of new discoveries became small.
And before them consider the Vikings who did behaved in a similar manner. So again is the common perception that the market for discoverable resources and discovery strongly linked outside the minds of economist or not ?
Since your average economist cannot conceive of the concept of a scarce resource that the market cannot correct by replacement or more discovery this link may actually be a myth. The market may pay for more searches but as long as a baseline level of searchers are active it has no real effect on the rate of discovery. At least thats my conclusion from the needle and haystack model.
The demand for platinum is not infinite; if it were the price would also be infinite. Q.E.D.
Within well-recognized limitations, Econ 101 works.
Economics is all about scarce resources; it was invented to deal with scarcity.
The problem is not so much with economics as with economists--who are often woefully ignorant of anything outside the graduate-level seminars they took years or decades ago.
BTW, psychologists are also woefully ignorant outside their itty bitty fields of specialization.
Only oil people can see the big picture;-)
Not infinite but their are a lot of uses for platinum which are prohibited by its cost. I'm a chemist and to me its the wonder metal. Need to make any reaction work just add platinum :)
Thanks for your responses I've always viewed the platinum market is completely warped since the players are constrained but it seems this is a perfect market according to economics.
I'll have to think about it some since this is the type of market that I think would become common post peak.
A key post by someone that really groks this stuff and understands peak oil would be welcome. Thinking about how markets might work post peak and even the end of fiat money ?
Anyone know an economist with a good understanding of peak oil that would be willing to do a key post on economics and post peak economics ? hint hint :)
I think what you are asking for would require about three separate long posts. Will I volunteer for this? No, because I'm just now beginning a new series of novels, and starting in July you won't see much of me on TOD.
After one has taught introductory and principles of economics more than two hundred times at the college level, it becomes pretty easy to understand and explain concepts. Find somebody with thirty years experience in teaching the subject . . . who has been studying Peak Oil for years.
Instead I'd say that discovery is driven more by the amount of undiscovered regions left to explore as long as large unexplored regions exist that may contain a valuable resource they will be searched regardless of the market.
I know that this is a large part of the basis for the Logistic model. But I think it might favor proportionality of volume at the expense of human effort. It basically boils down to what you believe is the suppresive term: suppression due to decreasing volume gives you something akin to the Logistic model, while suppression due to progressively more diffuse discovery cross-section gives you this model.
Does it boil down to whether we believe that people will start giving up looking (Logistic) or that we continue to put more dispersive effort to achieve diminishing returns (this model)?
I don't think they are distinct. People still look for gold and silver and mine it in Nevada and Colorado but the effort or dispersive model cannot give returns thus the result is the same as the logistic model i.e finding nothing is the same as giving up.
So in effect your model could also be done with a logistic simply because the minimal return for the effort is effectively the same as giving up. This goes back to what I'm saying that adding a lot of extra searches doe not change the outcome as the search winds down nor does giving up or even constant searching. The curves for all cases are similar and close around the peak.
Furthermore the point of interest where we use a parabolic assumption to model in HL is the place where the exact place where most of the curves become similar all providing a good fit. In fact the logistic fit at the peak is poor. I think quadratic's fit better I'd have to find the post where they explored other curves.
So no need to assert logistic behavior or even no logistic since the curves are self similar at this point its basically a angels dancing on pins type argument. Esp if you and in any real data with error. A lot of curves give a good fit around the peak with the logistic actually being a poorer choice.
In any case I think worrying about logistic behavior can be put on the side burner I don't see that its needed yet in the model your presenting. And maybe never. The logistic is a simple approximation and powerful but given we are interested in fitting the region where a parabolic fits other curves should work its more a matter of building a case for them. Simple models that did not include discovery etc did not do better than logistic from past reading.
But a composition approach as your suggesting should give a good fit and I bet the resulting curve and the logistic will be close at points that matter to us esp considering the quality of the data set. This is getting interesting since it means that problems commonly modeled as logistic might also be modeled using your composition approach which is probably a more powerful model and the logistic would then be shown to be a good approximation for this model.
This is the game thats played to connect the disparate worlds of classical and quantum physics in the limit.
Maybe not more important than peak oil but its a bigger result and impacts a lot of fields.
Aside from the curve fitting aspects, which have their use, nothing in the Logistic model aids us in a greater understanding of oil depletion fundamentals. Not of the geology, statistics, nor of the econonmics. Nothing. Of course it explains how oil molecules can be born and die, if they happened to mate according to the size of their populations. How absurd does that sound?
Ever tried to explain something that you yourself don't understand?
That's a rhetorical question of course.
It's one I have fought for a long time.
I think Khebab has a bit of a handle on it but it has to be cast in terms of the Hybrid Shock Model for it to make any sense -- to me at least.
http://www.theoildrum.com/node/2430
And the HSM is very close in this regard to another Khebab favorite, loglets. Loglets are essentially a convolution of many small logistic functions over a "discovery"-like profile.
http://www.theoildrum.com/story/2006/9/3/113719/7594
Trust me I don't disagree with you. I just want to see HL replaced correctly with a real model.
I've thought of a simple way to modify the search algorithm to take into account large discoveries and other factors.
Cover the area to be searched with two grids that differ by a power of ten. The basic needle in a haystack method is used to search the smaller grid. But if oil is found in a region then the whole large grid is searched intensely and the big block effectively removed immediately from the search area and of course nearby blocks get similar treatment. So a single discovery acts as a new epicenter focusing the search.
The distribution of oil is such that over 50% of the reserves can occur in one field and in general over 75% are n the same basin and thus "cousins".
The double grid seems to be a simple way to capture this.
I think you have just explained single reservoir reserve growth ala Arrington (see Khebab's discussion comments way at the end).
This is also a dispersive growth which categorically depends on whether you look at it from a microscopic (single reservoir) or macroscopic (global) scale.
One more comment.
The basic assumption people make is that high prices limit demand but studies show that demand is sticky and strong price increases are needed to decrease demand.
On the flip side of the coin the simple argument is made that if demand for a resource that has to be discovered increases and it becomes scarce and expensive then discovery will increase leading to more supply and thus lowering prices.
Given the current model and some thought its not clear that their is a strong link between prices and discovery if you assume a reasonable amount of base exploration fairly independent of price. The needle and haystack nature of the model just in my opinion needs enough searchers to reasonably cover an area and this is a fairly small number.
As and example the discovery of oil deep offshore took place well before their was strong demand.
http://www.total.com/en/press/press_releases/pr_1999/990323_Discovery_in...
This says to me that deep offshore was being explored sometime in the early 1990's at the latest while oil prices where quite low.
High prices do not limit demand at all. What high prices do is to limit quantity demanded--an entirely different and much narrower concept.
Econ 101 strikes again . . . .
Fair enough :)
Can you define limit the quantity demanded ?
Since your answering some more thoughts.
Hmm would you not have to make the distinction between a needed base commodity and a luxury item. Its easy to see that high prices limit the demand for luxury items but lets consider water I need X amount of water a day to live therefore regardless of price I either get enough water or my demand becomes limited because I'm dead. I'd say the economics of critical resources are better described as limited demand not limited quantity of the resource in the sense that the source of the demand is what becomes limited as in demand destructed by in this case death.
Obviously at first I might be using water in non essential ways so conservation is possible for these use cases but the core demand for water is very inelastic and next if conservation has a impact on lifestyle the consumer may have a much higher sense of the absolute requirement or level of inelastic demand.
So to say high prices limit quantity seems strange for base commodities such as food water and SUV's :)
Seriously though this is why a inelastic demand coupled with
a decreasing resource results in shortages which is what actually limits the quantity at least for commodities that have inelastic demand ?
Or am I full of it ?
I don't think you are full of it, but I do think you should sue the prof from which you took Econ 101 for malpractice.
The best econonomics textbook I know is ECONOMICS: MAKING GOOD CHOICES, by Don Millman. You can buy a used copy cheap from amazon or one of its competitors.
Yeah, I did write the book. And I used gasoline to illustrate inelasticity of both supply and demand. This was back in 1995 that I wrote the book . . . .
jbunt
Well, if we want to say that "demand" is not limited by price, only the "quantity" is limited by price, then the "demand" for anything that humans want is always "infinite." Such as money, cars, sex, good food, vacation homes, etc. Not a very useful way of defining demand is it??
The way economists define "demand" and "quantity demanded" is very usefull indeed. Demand is influenced by income, population numbers and migration, expectations, tastes, sometimes the weather, and a whole bunch of other things.
By way of contrast, "quantity demanded" holds all of these factors that influence demand the same ("ceteris paribus") and looks at the influence of price--and only the influence of price--on sales or consumption (which are both the same thing as "quantity demanded.")
Recall the distinction between a shift in the demand curve (a change in demand) and movement along a single demand curve? That is what I'm talking about.
jbunt
Okay, but in every day language, it is not very practical to think of demand in that way. I mean, oil, as a commodity, is fungeable with money. Would I rather have a trillion dollars or a trillion barrels of oil? To conceptually separate "quantity demanded" from "demand" using price may be good theoretically, but as long as I can exchange a "quantity" of anything for money, I want as much as I can get. Only when the extraction (or manufacturing) costs + distribution costs + sales costs exceed the market value of the quantity of "whatever" item that I have do I have enough. If I were a counterfieter, only when it cost more to make the bills than I could get by spending them would I have enough.
Thanks I ordered the book. I guess I'm so used to the lying sack of... Economist and Central Bankers that spout nonsense that I've tried to convert their lies to a real model. Subprime is contained yea right. Most of the economist that the public hear from are highly paid snake oil salesmen.
You know their lying so you have to guess at the truth.
On the other side of the coin Econ 101 does not in general map well to the real world we see probably because most markets are far from free I don't know. Finding information on economics applied to the real world free of political motivation is rare these days.
Sorry for stumbling around but I freely admit that I don't know anything or probably worse dangerously small amounts about non-propaganda economics.
I might give the book a try as well. Last weekend I ran across a book in storage called "Statistical Methods of Econmetrics" by Malinvaud from 1966. This is an impressive book with some impressive straightforward math. He said with some candor that the aim of econometrics to be “the empirical determination of economic laws”.
Input prices do affect the supply curve however, and if oil (an input into the supply curve) changes price, so too does the supply curve (in a probably non-linear fashion).
Demand curve factors (quantity at price)
-Increasing technology more quantity at the same price
-Increasing # of purchasers, those who see more relative worth in a good will pay more for it, if the distribution of people valuing a good is normally distributed then more people will again contribute in a non linear fashion to the curve.
-Increasing income causes increase in demand for normal goods, and decreasing demand for inferior goods. (This is actually a good argument for decreasing real income of Americans, why buy CHEAP CHINA CRAP? WHY? Economics says otherwise, AND IS CORRECT, ergo real wages are falling.)
Supply curve factors
-Input prices.
-Number of suppliers and how much they demand for oil. (this is why the "Biofuels will ruin us" OPEC scream is blatantly false, if Biofuels are already capable of being produced more cheaply than new oilfields OPEC is in shit-land.
-Technology greater supply at the same price.
-supply of a good
damn economics! i'm about halfway through micro101, doing alright.
I would just say that our virtual volume of search has continuously increased. There is no stopping technological growth in the form of scientific visualizaton.
I think there have been studies of innovation successes made during times of recession and depression and there wasn't a large correlation.
In regard to innovation, one of the shrewdest and least intuitive observations was made by the late great economist, Joseph Schumpeter. He noted that innovations tend to come in "swarms" separated by periods of roughly sixty years.
The phenomenon is real, several plausible explanations have been offered, but nobody really knows why at some points in history you get a whole swarm of (somewhat related) innovations, while at other times the rate of innovation is much lower.
There was a swarm of innovations during and right after the Second World War: We may be due for another swarm right about now. Let us hope so.
What good is it going to do? From everything I read, we have the technological ability to pretty much solve all our energy problems right now. It's the political will to implement them and the lopsided way our economy is structured that makes them insufficiently financially attractive that is the problem. It's true there are still improvements to be made (e.g. battery density, PV inefficiencies), but no major break-throughs required (although Fusion would be nice).
Unless you're expecting some sort of 'magic' innovation that would enable us to, say, pulverise household waste into gasoline at the cost of $1/gallon...
The underlying problem is overpopulation and lifestyle choices. We probably had a better combination of technology and knowledge back in the 1900's for sustainable development.
But with the coal age forward we chose to use or knowledge to drive a consumption centered lifestyle. Assuming that we can maintain or recreate the knowledge base we have today I expect that eventually we will simply out of necessity move to a lifestyle not geared towards conspicuous consumption. If the population level is reduced this need not be a cramped lifestyle. With good design a 1000sft of space can be less cramped and provide better living than 2000sft of poorly designed space.
Making it through the next twenty years will probably be tough but the longer term outcome looks a lot better than our current lifestyle even if we were not running out of oil. I know that in southern California the consumption life style has reached the point that its imploding on itself as the quality of life deteriorates. Southern Cal at least is becoming unlivable. A lot of people have rejected suburbia at least the hell version we have here and are either moving into town or leaving. The nice weather is not worth it. And to be honest perfect day after perfect day sucks.
I'd love to hear thunder and see rain again and enjoy both good and bad days.
Not too sure that anyone "chose" a consumption-centered lifestyle - it's just one that naturally feeds off some of our basic desires.
In principle a consumption-based economy could be far far more sustainable if a) we collectively learned to appreciate higher *quality* things over higher quantities of poor-quality things and b) the short-lasting consumables that were needed were close to 100% recyclable.
As Curly said in the City Slickers movie, "You got to figure out what your one thing is."
In intermediate algebra class, you were taught to understand that some problems have no solutions. But then the teacher quickly pulled those away from you and said, "Don't worry, I won't challenge you anymore with problems that have no solution."
If you advanced into differential equations, you were probably thrilled to learn that some problems have multiple solutions and you don't get an A unless you find a sufficient number of them.
Accessing energy is not a math problem. It is not fully a physics problem. It is mostly an economics problem.
The "economic" problems of our civilization are not necessarily ones for which there exists a solution, let alone multiple solutions. It could be that the "economical" aspects pose an intractable problem. Economical behavior is based on short term thinking. People generally don't invest in ventures where the payoff is more than 2-5 years away, let alone 10 or more years away.
So if there is no short term quicky solution, it may be that the answer to our problem is simply that we are FuBAR.
(** F'd Beyond All Repair)
You are right that the solution to the problem being worked on here doesn't really solve anything in terms of changing our future. Only the effect of economic activity can effect our direction.
About all it adds to is our understanding. Related to the fact that the ultimate quandry of our time is "what is the meaning of life?" This also has a minimal impact if solved, as people will still enjoy their ocean cruises, cocktails, and luxury independent of whether we have the answer.
FUBAR: "Fouled" up beyond all recognition. Replaced SNAFU, Situation normal, all "fouled" up.
The latest one I like is BOHICA, "Bend Over, Here It Comes Again."
The military is most excellent at creating new acronyms.
"Generally"...yes...but there are examples in the past where investors have committed to projects that they knew they'd probably never see profits from (they just wanted to leave a legacy), and even today, as I understand it, large operations like aluminium smelters can take well over 10 years before they start generating profit - and they are still built by private companies.
But usually for projects with such long pay-off times, it makes sense for government money to be involved. For there to be sufficient government money available, there has to be sufficient levels of taxation. I'm curious then how some one like Roscoe Bartlett can state as one of his principles the need for lower taxes, but on the other hand recognise that a huge government-subsidised effort is needed to get us to a post-oil future quickly enough (and it's easy to say that an intelligent and efficient government would receive more than enough tax-payer dollars right now to be able to fund such projects, but where's the evidence we're ever going to get such a government?).
In the Bible.
Joseph goes down (is dragged down) to Egypt land.
Proves his ability to foresee the future.
Correctly forecasts the 7 feast and 7 famine years.
Pharoh (gov't) believes in Joseph's peak of grains curve and builds a strategic grains reserve. Egypt is saved. Civilization goes on (until Charlton Heston shows up disguised as Moses :-)
I have always admired the patience of the tree farmer who grows from seedlings.
There were large numbers of breakthroughs right before the second world war, particularly in physics with quantum theory. It sort of makes sense that a significant amount of innovation therefore came about sometime thereafter though I can see no clear reason for the 60 year cycle.
We have, however, been seeing breakthroughs in climatology, biological sciences, and even still in physics particularly over the last 20 years. Perhaps that portends another period of technical innovation. If so, you can probably correlate the relationship between the technical innovations and the underlying breakthroughs in theory. Of course that would then put you in the boat of asking why there are roughly 60 year cycles on the theoretical side. ;)
Ghawar Is Dying
The greatest shortcoming of the human race is our inability to understand the exponential function. - Dr. Albert Bartlett
Don,
I know this is slightly off-topic for this discussion at large, but I can't let this pass.
To me theory needs to be testable and falsifiable among other things.
I've always wondered this about all the socio-economic and financing "wave theories" (Kondratiev, Elliot, etc.)
What is the _scientific_ basis of these theories? Do they have any?
Or is it just a (statistically not validated) observation combined with an assumption that an assumed historic pattern will repeat itself in the future?
Is there real scientific research into this? Scientific as in testable, falsifiable, having predictive power into the future, not being a compilation of ad hoc exceptions, etc.
What you said.
But such waves are quite often VERY statistically validated observations based on stockastic phenomena. Only one caveat:
Historic patterns will NOT necessarily repeat themselves in the future. We only have empiric evidence that such exists - there is no imho a priori reason that it should always be the case.
Kondratiev, for instance, is only based on the fact that *interest rates* (the costs of capital) tend to have long-lasting trends, a sine-cycle which takes somewhere around two human generations to complete.
We are (were?) in the down side of the cycle:
 as Jerome pointed out.
Economic implications have been discussed by other economists such as Schumpeter and others. Michael Alexander went looking for the scientific backround, to see if the cycle is "provable", which, he concludes, it is.
Cheers, Dom
Jerome just had a post up referring to this graph at Euro-TOD.
http://europe.theoildrum.com/node/2714#more
To me theory needs to be testable and falsifiable among other things.
I've always wondered this about all the socio-economic and financing "wave theories" (Kondratiev, Elliot, etc.)
Econometrics is the branch of economics where they use math and statistics to study economic phenomen. One of the classic books on the subject says that it is narrowly defined as the empirical determination of economic laws.
That is pretty telling as no other discipline of science defines their approach that narrowly, and I would dare say haphazardly. When you are doing things based on heuristics and empiricism without good fundamental theories, then you are open to a lot of criticism. So the idea of testability falls by the wayside, in exchange for whether people like an eyeball fit. Pretty amazing, IMO.
Yep. Economics is not science. Show me the application of basic scientific method in economics. In the vast majority of cases above Econ 101 it is not there, instead replaced by philosophy. Or, as I like to call it, theology, because advanced economics bears more relationship to theology than to science.
Ghawar Is Dying
The greatest shortcoming of the human race is our inability to understand the exponential function. - Dr. Albert Bartlett
... then you can exploit them you would think discovery would slow since its not cost effective to continue to look while having large reserves.
Good point but you have to remember that during the early days of exploration, you could not rest on your laurels. The minute you stopped looking, someone else would step in and take up the slack. It's possible now that with consolidation that some of this has happened, but my feeling is that virtual exploration has taken up this slack.
Does anyone have a simple and concise explanation of the interaction between discovering a resource and using the resource ?
I think this is very simple to explain which GreyZone has a good take on below. But ignoring the time taken to decide to decide to drill and to build the rigs, the first-order approximation is that we will extract a fraction of the total remaining discovered reserves per year and this fraction does not change much from year-to-year, apart from oil shocks (which gives rise to the oil shock model). Whether the discovered reserves are real or are just an accountant's estimate does not really matter, since taken as an aggregate, all the oil companies will settle on a mean extraction which is based on that number. I would classify it as a greedy algorithm, insofar as we will extract as much as we can, being greedy capitalists (and consumers).
I'd argue a fairly strong coupling term.
It is in fact a strong coupling but it is memoryless, indicative of a Markov model.
jbunt
Extraction is driven by demand. It does not matter how much sand I discover. Demand (which varies by location) will determine extraction. Which is why the Texas Railroad Commission restricted oil extraction for so many years - which influenced discovery, etc., because extraction (and demand) restrictions affects price.
Not really. Consider the case of the poorest nation in the world that happens across a huge easily accessible find. Would they have any second thoughts on flooding the market getting whatever price they could, no matter how low?
(Assuming that some imperialist country does not invade and occupy for years on end, on the presumption of fighting a war on terror)
But back to the Texas case. It still had an average extraction rate that competed with all the other sources. This contributes a variance to the mean which is what we are interested in from an aggregate global perspective.
jbunt
Well, as you imply, the entire amount discovered will be demanded, and would likely be provided, until the extraction cost exceeds the price received. The Texas RR commission stepped in and prevented sales at prices that were above variable extraction costs, but which were below total costs, which included the fixed costs that had already been incurred. They did this by restricting production, thereby increasing prices. Ironically, this made it economical to find more "uneconomic oil," because you were allowed to produce some of it and sell it for an artificial profit.
I guess that in layman's terms, the long-term rate of extraction (inclusive of discovery) is dependent upon long-term profitable demand. [And, profitable demand is subject to being unprofitable in a myriad of short term circumstances]
The model could be made more real-world like by adding the following additional constraints:
1. Needles come in assorted lengths.
2. Searchers are charged a growing search fee based on how deep they dig into the hay stack.
3. Searchers are rewarded based on the length of needle they find. Small needle equals small payoff. Big needle (i.e. Gahwar) equals big payoff.
4. Number of needles in a length class is inversely proportional to needle length.
5. If they are not making a sufficient $ROI, searchers have other endeavors to sink their time, money and efforts into; for example, selling small bottles of ethanol in a bar filled with drunkards.
This is a way to express a quality metric and yes I agree the big piece thats missing is some sort of quality or rating system in the big picture the easy oil is exploited first.
The quality metric seems irrelevant to me in regards to the search itself. You don't know when you go looking if you will find a small field or a giant. You are not even sure afterwards for some time as to the real size of the discovery.
Furthermore, as history demonstrates, the number of searchers does not vary dramatically until a significant shift in the nature of the area being searched changes. In other words, for every wildcatter on land in the US who left the business another entered. But once we shifted to offshore exploration, the change in nature of the area being searched led to a change in the number of searchers which again appears to remain roughly constant, with new searchers replacing those who leave the business.
So while step back's suggestion is interesting, I am not really certain that it adds much to the real underlying search question other than to make the model more complex than it needs to be.
Or is there a reason we would care about the rewards individual searchers amass? Given that we are simply trying to model the search and not the entire real world economic cycle around oil, I am not seeing the necessity but perhaps one of you can explain your thinking to me on this matter?
Ghawar Is Dying
The greatest shortcoming of the human race is our inability to understand the exponential function. - Dr. Albert Bartlett
I posted the concept in another post but I think the way to include it is pretty simple. Once a discovery is made intense interest is generated and the search effort is increased in a region. Thus given a single discovery if a region around the discovery contains more oil then the probability of finding it is far higher than a random search. If a second test well hits oil the probability doubles since searching will be intensified.
So a random search is the base model but overlaid on this is this gold rush sort of searching. Word of a discovery results in a concentration of the search effort. And with oil you tend to be rewarded with this search model since the basins that contain oil tend to contain a decent amount.
To repeat my other post consider that searching is done on two grids that differ by 10 or power of 2. A find in the smaller grid quickly flips all the smaller tiles in the larger regions as its searched exhaustively.
Another part is that large regions of the grid can be discounted with minimal effort using relatively quick surveys. So at yet another level the big grid is used for random searching and the small grid is only used on areas that show promise.
And finally to bring HL back into the picture it assumes all the oil is discovered before extraction begins this does not fit with reality but the above models brings reality and this unreasonable assertion into better correspondence.
A simple two grid model with the grids differing by say power of ten or power of 2 seems to fit with real world searching and does not add a lot of complexity.
With the two grid model the bulk of the oil is found quickly and extrapolating this success to imply similar successes in the future is doubtful. Thus the probability of significant finds now is probably a lot lower then most people expect instead almost all the oil has been found.
And the HL assumption turns out to not be all that unreasonable as it seems at first glance.
So you are not really interested in the quality of the found item (needle, oil field, whatever) but instead you are suggesting that finds come in clusters thus searching in a given area increases due to any prior finds in that same area up to some practical limit? Since we know that oil fields do tend to come in clusters, this would be interesting to see worked into the model.
Ghawar Is Dying
The greatest shortcoming of the human race is our inability to understand the exponential function. - Dr. Albert Bartlett
I'm working through the concept. See my later post on it triggering a yes/no decision either you develop are you don't.
This brings up the initial reserve estimates made at discovery time before development is started. The only constraint is that they are reasonable and preferably less than the real reserve. Assuming that this initial estimate is consistently made by most players then the mapping of the initial estimate to production at some later date is simply a artifact of the science/art of oil prospecting it has no intrinsic value.
Later repeated reserve growth figures point to this being the case. Thus the mapping of initial estimates to later production although true does not seem to have a clear meaning. And the fixups to incorporate reserve growth are just that fixups.
So assuming all this I'm stuck at the decision to develop not develop. It seems past this point discovery provides no real information esp not decent reserve estimates since they are understated decent guesses but just that guesses.
The question is can the shock model correctly reject the OPEC reserve additions as false data. HL seems to be able to reject them but I'm not seeing this ability in the shock model so far. Thats the acid test. My approach dead ends and needs to revert back to HL since I'm saying ignore all reserve estimates as input data. For HL we only need the yes/no decision but outside of maybe being a better model for predicting when a region will be developed after the first discovery I'm not sure its that useful. I think with work my approach can be shown to better answer that question then a simple search.
I don't think anyone cares about answering that question its not that important. The other part of questioning future discovery is not important since we already know discovery has tapered off and any discoveries now will not be developed until well after peak oil (doubtful then) so who cares about that. Other methods show that it does not look good.
Nothing wrong with Shock as long as you have good reserve estimates but it seems to be more a formalization of the bottom up methods and heavily dependent on knowing URR not predicting URR. It will/should predict peak production pretty well which is the far more important prediction since you can use other methods to reject the OPEC reserve additions.
So I'm stuck lets see what the experts come up with. The magic bullet model that detects spurious reserve addition remains HL or better common sense as far as I can tell.
Regarding the SA/OPEC reserve additions, the dispersive growth model would reject them because it disallows the kind of severe discontinuities reported. You essentially use the rest of the world to fill in the gaps caused by faulty SA reporting.
Right you can easily reject them using other methods and they did not and probably wont result in real increases in production since they are virtual barrel anyway.
Might as well reply hear I came up with a birth death model for oil extraction.
Consider that a oil well is like a conveyor belt and the reservoir(worker) is placing newly manufactured boxes of oil on the conveyor belt. This is considered a birth.
Every now and then a box of water is shipped this is considered a death.
The whole system contains equal quantities of births and deaths distributed in a semi-overlapped manner.
And you can make new conveyor belts. Every now and then you get full of water and a death takes place.
So at first death = life and growth is by adding new conveyor belts the more belts the more boxes. In time some of the conveyor belts start adding more boxes of water so the number of life created drops and deaths increase since a box is death not what is in the box. Over time you see deaths exceeding life even if the well is no longer pumped its assumed to continue creating deaths at a constant rate the fact your not removing the dead boxes does not matter until the total number of dead boxes equal the number of oil boxes created.
When all the wells have pumped a equal amount of dead boxes or water boxes the field is dead. The total volume is twice the amount of oil in the reservoir and conceptually it start off half dead and half alive.
A perfect example would be you first remove all the live boxes then remove all the dead ones.
So basically you double the volume of the reservoir and consider it to contain half live oil barrels and half dead oil barrels. With the population of dead and live boxes split and semi mixed.
B is birth rate, D is death rate, P is population. Anything with a numeric subscript is a constant.
B = B0 - B1*P
D = D0 + D1*P
The next step involves writing the equation for population dynamics as a function of time.
dP/dt = (B-D)*P
dP/dt = (B0-B1*P-D0-D1*P)*P = (B0-D0)*P - (B1+D1)*P2
which matches the classic Logistic equation formulation:
dP/dt = rP*(1-P/Pinfinity)
So what values represent B, D, and P in your scenario?
Okay got it !
The trick is the same you consider both water extraction and oil. Or pressure drop /nitrogen etc the key is you consider the total content extracted out of a well not just the oil and assume a simple non-linear mixing.
Here is the way to look at the problem.
Assume you have a box and its filled with blue and black marbles. (water and oil ) At the start and the blue and black balls are distributed on some gradient. It could be linear but a more generic assumption is they are distributed over some gradient dependent on the total population. A Gaussian blur.
http://www.websupergoo.com/helpie/source/2-effects/gaussianblur.htm
Or any sort of parabolic like distribution.
Then as you extract the mix assuming its pure black on the left and pure blue right the production rate of black is dependent only on the distribution.
So you don't need a logistic just a reasonably weighted distribution bell curve etc.
The extraction rate depends of course on the number of wells used to extract but the production profile is determined by
the above assumption and the total production goes to a constant once no more wells are added just the mix changes with time.
So by considering total liquids extracted and assuming that they where originally present and mixed you get a really simple model for oil extraction thats robust against the exact shape of the mixing or gradient I think even a linear gradient gives good results if its started late.
This is close to liquid chromatography which is a refined version of oil extraction. But we assume no separation and we are simply pumping out a sample thats been premixed.
A linear gradient gives a triangle production curve and other parabolic like mixing gives a Gaussian/normal distribution.
In this case a logistic would be simply one choice for the gradient.
Now if you consider your container to be a rectangle with say the extraction face as a rows of stones so that all the stones are on a grid. I.e it looks like a blurred image of two colors and you can only drill a well at the head of each queue.
So well one starts extraction then well two etc.
Well one waters out first then two etc and your adding new wells. You can visualize your pretty smooth gradient getting bit strange looking as one queue moves faster than another.
In any case by expanding the problem to include all liquids and making the assumption that they are mixed via a simple non linear gradient you end up with a pretty simple model.
This gradient is not quite the real oil/water mixing its a 2D simplified model. But if you lump all the complex factors effecting oil extraction into this normal distribution you end with a really simple model.
And I know its not logistic but I've surmised that the model should not be too sensitive to how the curve is defined and this model fits the criteria.
New discoveries can be handled by adding new boxes you can play with the rate the queues are extracted i.e well drilling program infield drilling etc.
More the logistic is coming into play at the level of the wells Birth is drilling a well and death is closing in a well.
So the logistic has nothing to do with oil it has to do with how you drill the wells and the lifetimes of the wells.
So there is a logistic at the well level in general and the oil itself is modeled as a normal distribution with a liquid that not oil and the wells pump the total. When a well is pumping mainly not oil its dead.
So your right the logistic has nothing to do with oil itself but it easy to map it one to one to wells.
So the production rate is a convolution of a time dependent logistic well distribution with a normal distribution of oil/notoil to give the final production rate.
Last one :)
And the Gaussian is closely related to the fractional flow.
Assuming a gaussian mix of two liquids where your remove the mixed liquids is effectively in my opinion a static model for fractional flow. So given fractional flow and a container you can simulate it with the same container with two liquids with a non-linear gradient.
The minute you say that one aspect is due to a Logistic and another aspect takes a different form, the result can't be a Logistic because the Logistic does not decompose into any primitive components (particularly not another Logistic).
Which means that you are arguing in circles with no clear goal in mind as to what you are trying to demonstrate.
In grad school, we always referred to "group theory" arguments when we saw somebody going down this route so we did not have to waste any more time on it. So unless you have a clear goal of what you are trying to articulate, I will keep on arguing against your original premise/belief in the Logistic function trying to model "somethng".
I've never claimed the result is logistic. But their seems to be some logistic aspects to oil extraction and thats strange.
The equation is initially a pure logistic since it depends on the birth rate of the wells so when a field is first developed the amount of reserves do not matter its how fast you can drill the wells the oil initially is effectively infinite.
So the rate of production depends only on the birth rate of the wells. So the front side of the curve is a logistic function independent of the total reserves.
Think about it what does that reserve estimate mean ?
At the start of production nothing since your extraction rate is limited by the creation of the wells. As the creation of wells slows in time its still limited only by the wells.
What do wells in Pennsylvania have to do with wells in Texas? Do wells in Pennsylvaia give "birth" to wells in Texas? Of course not. What this is saying is that there is a linear or greater growth in exploration area and volume that is independent on the number of wells but instead tracks effort made by individual prospectors who flock to new regions lured by the potential of making money.
I don't understand your statement. Overall since oil has multiple uses the more oil becomes available the higher demand. The oil boom is closely related to the economic utility of oil. So if you take this into account oil does indeed give birth to oil. I think your being a bit unreasonable about the relating the logistic to wells drilled its a fair mapping and can be proved disproved
you just need to show the production rate is proportional
to the number of wells drilled and that the drilling pattern
is logistic. I'd have to guess that somewhere their is a database with all the wells drilled in the us and when they
where taken offline or at least for a region maybe Texas.
I've thought of a simple way to explain my main problem or misgiving.
With no knowledge of the reserve estimate or no faith in the numbers how do you differentiate between two fields on have the size of the other that have the same number of wells and flow rates ?
My opinion is you cannot until they begin to decline. The reserve estimates are of course not entirely wrong and are used to drive the number of wells developed but its not clear that you can ferret out the effects of wells from the real URR.
If the drilling campaigns effect on oil production is to make it logistic not the expected normal curve then the assertion is as long as you have a good logistic fit then the number of wells drilled is whats driving production.
The US has undertaken a massive drilling campaign over 10% of our oil is coming from stripper wells.
http://www.netl.doe.gov/technologies/oil-gas/EP_Technologies/ImprovedRec...
You figure that maybe a additional 10% is from marginal wells.
And another 10% is from reasonably profitable wells but drilled by small companies.
So in the US its not unreasonable to consider up too 30% of our current production as the result of the free market lots of capitol and the only requirement is reasonable profitability.
I don't see this as possible in countries controlled by national oil companies so we probably cannot extrapolate the decline results in the US to other countries.
Indeed Iran Libya etc etc etc have seen far steeper real world declines than the US because the NOC has no incentive to product this marginally profitable oil.
Hopefully you see the problem and my interest in where the logistic is coming from. If I'm right it its the wells then we won't see a logistic fit on the backside of peak for these countries and we know that they are not minimizing the decline rate. The assertion is logistic fits indicate maximum production rates except around the peak itself when other forces are acting. Logistic on the way down indicates the same on the way up we are limited by the number of wells we can profitably drill.
So the birth-death of wells will reach a steady state where the deaths exactly balance the births?
Sorry, this is a no-go because it says that we will have infinite oil because the number of wells will stay finite forever.
If the death rate overcomes the birth rate, then you will no longer have a Logistic curve.
Try again.
You want to put it into the equation or not?
It's not that hard. Substitute the parameters that you desire to model into the equation and you will have your Logistic sigmoid.
Otherwise, you are overanalyzing a scenario and trying to crowbar a complicated premise into a simple non-linear difference equation that won't support that kind of complexity. And that's why you probably won't attempt to do it.
Yes my initial attempts got complicated :)
No not really it looks like the modified shock model is actually close to the right equation if you remove the use of reserves and reserve growth. Its just the fact your trying to use reserve estimates and reserve growth that I don't like.
So if you assume on the front side of the curve production is limited by the birth rate of wells and around the top the Gaussian takes over because the birth rate drops to zero and it actually continues to hold since wells are "killed" because they water out so the death rate is probably not relevant only the water cut. It is however still logistic in a sense as long as infield drilling is modifying the well population.
So it is a logistic all the way to peak its after peak when drilling wells cannot help and the increasing water cut controls the situation that it reverts to Gaussian. So the right half of the peak and at least initial decline is not governed by a the logistic its the fluid mix thats important. Later as production declines its probably again limited but this time by say water handling and pump rates.
The reservoir size is going to limit the population of wells but all you need is the production data. So the estimates of reserves and thats all they are are already included in the birth rate of the wells you need not directly include them.
So yes the size and nature and amount of reserves and even the estimate is important because it impacts the number of well you can and should drill but you don't need to use these numbers as input since they are reflected in the initial pre-peak production or more exactly birth rate of the wells.
At the top or around the peak the logistic function has no effect simply because at this point drilling wells has no effect the production rate is controlled by the water cut.
And in practice we see that the logistic does not fit around the peak which is to be expected but given the logistic estimate.
As far as the actual production curve its the simple union of a guassian curve and a logistic to get the real production. The guassian is needed around the top where drilling wells is not useful. If you want to know the production curve around the top or peak of production you need to know the water cut and how its changing since this is effectively in complete control of production dynamics at peak.
So logistic as long as your pumping oil. Then as you get water break through production reverts to a guassian distribution as the water/oil mix determines the oil production I'd guess technically this continues until some other factor maybe advanced water handling or other approaches come into play.
The problem is not setting up the equations but identifying the variables the Shock model as it stands with its dependencies on reserve size prediction and the voodoo of reserve growth is nothing more than another empirical equation with a different set of inputs used to fit.
Lets start with the basics.
1.) Wells are created/destroyed and the population changes with time.
You challenged me to identify the variables that are logistic thats the answer so explain why well population is not logistic.
2.) Initially when the reserve is far large than the production rate production is controlled by the number of wells in production irregardless of the size of the reserve.
Agree or disagree with these basic assumptions ?
3.) The shock models use of reserve estimates and reserve growth as inputs is questionable.
4.) I see no easy way to model production around the peak its not really controlled by well drilling instead all kinds of other factors are at work water cut for a field or fields
etc etc. So once drilling wells does not effect production its really hard to define what governs the production.
I'll freely admit I don't know how to handle production around the peak I can say that its almost certainly not logistic.
5.) Post peak production is probably also guassian not logistic if you model it as a guassian that is only fitted from the peak through the decline region and don't fit the growth phase.
6.) This guassian or production curve should be in your shock model. So what I need to do is take your shock model or the next version since I'm guessing one will be released soon and remove the complex reserve handling and replace it with a logistic growth phase. But if you think about it by the time the reserves matter Tw which is at peak the total reserves are well known so the fall off in production and peak is the shock model.
7.) HL as its written cannot handle late large discoveries
I need to think about that. I see no easy way to handle it.
Its a new population center but the problem is more of data reporting since the new large discovery gets it's production mixed in with the old. I think a backdating game might be enough.
So to finish instead of playing games with reserve growth I'm simply suggesting that while reserves are large the production rate is dependent on the number of wells and the creation of these would in general follow a logistic curve barring some other choice. The front side or initial production is logistic.
Conclusion and I won't post on the subject again I'm now satisfied.
Pre peak the production is controlled by the drilling campaign which itself is controlled by real reserve estimates which may or may not relate to published estimates. The truth is in the production data and real reserve estimates are already included.
Post peak and especially post world peak drilling wells has far less of a influence on oil production and it becomes driven by the cost or economic factors vs price. Cost per barrel for extraction from a depleted field are very high. Considering that costs for oil production are tightly related to the price of oil since its a economic intrinsic and drives general price inflation you fighting a loosing battle on the economic side post world peak.
I think expecting the enormous investments that happened in the US and even North Sea at a world level too keep production high is mistaken.
The implication is obvious.
Or put it this way the searches know that the grid is sparsely populated in either case a simple search is not the correct one for the problem. A two level approach at the minimum is needed to optimize the search a sparse grid. And the searchers know this.
And more thoughts assume a two level grid with a sparse search next assume that the only decision that need be made is to develop or not so the decision is a binary yes/no.
The estimate of discovered reserves simply needs to be enough to make the development decision and can be very conservative. The development decision is started long before the absolute amount of oil is known with any real precision. So a discovery generates a binary yes/no or maybe later decision.
Hi guys.
I'm new to this site, this is my first comment here. (though I've been reading for weeks now and studied the archives as well).
In the following I'd like to introduce a theory. Sorry for doing it here but I've no better place to do it. OK. Here it goes.
Let's assume we reach a peak at some point in time. Let's also assume that after the peak there will be 5 million barrel a day less oil on the markets. These are my assumptions to start with.
For the world energy balance (assuming everything else remains the same) to be non-negative, we have to put in energy from newly built alternatives on a yearly basis that equals to the lost energy also on a yearly basis. What's important to understand here is that we have to install new 'alternative' equipment every year that produces energy that we lose from fossil fuels every year. Let's do the math.
5 million barrels a day = 1.825 X 10^9 barrels a year.
That is roughly 3 X 10^8 cubic meters a year.
That is roughly: 2,55 X 10^11 kilograms a year.
That is roughly: 1.12 X 10^19 J a year.
(Data I used: A cubic meter of oil is 850 kg and burning a kg of oil produces 44,000 kJ energy)
3,6 X 10^19 J equals 10,000 TWh.
Thus, if we lose 1,12 X 10^19 J a year (that1s 5 million barrels a day) we lose roughly 3,000 TWh a year. Now. One year is 8,760 hors, so that means a loss of approximately 0,34 TW output.
We have to find a way to build alternative energy production that grows more on a year to year basis than this loss of 0,34 TW. Given the fact that wind power is 75 000 MW at the moment, and that 0,34 TW is roughly 300,000 MW, and that wind energy is about to double every 3 years, we can arrive at our conclusion that in 10 years time we might be able to do that.
What do you think about all of this?
(Sorry for any spelling mistakes but I'm not about to check it for now because I'm too curious to know your answers as soon as possible.) :-)
Hi eastender,
Welcome to the site! The problem with wind generation is its variability, plus the lack of a good method for storeage. We are importing about 14 million barrels per day out of daily useage in the US of 21 mbopd. About 70% of the oil is used for transportation in gasoline and diesel engines. Wind can't replace the gasoline in current automobiles, we need plug in electric cars, and electric trains, in essence a total rebuilding of our transportation sector to switch to electricity. The most realistic projections about wind is that it can provide about 20% of our electricty. WestTexas's Export Land model suggests we will not be able to import much oil in 10 years.
Wind's great, but it competes with coal and natural gas, not oil.
This is a technical thread about discovery rates, and your question would have gotten a lot more response if it was a new thread in the Drumbeat. So if you want to discuss off-topic stuff, you'd be better off to post it there!
Thanks.
Problem is I don't yet know how to do it. But feel free to tell me or even copy my post into a new thread. I don't need the credit. :-)
My post was not as much about wind as it was more about the amount of bonus alternative energy needed to be installed yearly as soon as oil goes down 5 million barrels a day.
If my calculation is correct (as I think it is), by llosing 5 million barrles of oil a day we are losing approximately 3000 TWh a year or 0.34 TW of output. That is about 4 times as much as the toal wind energy we have today, but this issue is rather irrelevant compared to the big one, namely:
Am I correct in assuming that losing 5 million barrels of oil a day will result in losing 0,34 TW? If so, what alternative installations can we make in a year (and each and every year after that) to make up for that 0,34 TW of loss per year?
That's the real question.
Thanks for your answer anyway.
Why are you maintaining the extraction rate constant at the current level? I would expect it to return to the pre-OPEC level ~0.04 as supplies get tighter as we approach peak.
OK, we could do that and it looks like it could defer the peak by about 10 years if we tried to linearly increase the extraction rate to pre-OPEC in the next 40 years.
WestTexas and ProfGoose brought up the subject of Bayes in an earlier comment. If you believe in the oil shock model, it will be wise to look at how the extraction rate varies in the next few years because that will tell us what we are in for longer term. Bayes theory says that we should update according to new knowledge that comes in, but right now, the extraction rate is creeping up only gradually according to this model.
WestHubbleTelescope,
Thank you very much!
Can you apply the same model to the BP data on conventional crude oil discovery?
Also it appears that you could something similar for natural gas discovery and production. My guess is that this has a different set of latencies compared to oil and you may be able to extract those to determine peak natural gas production rate and volume.
While natural gas may not be the immediate problem oil is, many electricity utilities are now planning major capital expenditures and need to estimate natural gas availability 20-30 years into the future.
Anyway, thanks once again for a very interesting post.
I did an aborted attempt on the BP data, and then determined that my discovery growth law was not aggressive enough (cubic instead of cubic-quadratic) and the peak broadened out a bit (ostensibly to account for reserve growth).

This gave a discovery URR of 3300 BBls, even though the underlying discovery data was only about 2000 BBls. The two production curves shown assume different future increases in extraction rate.
from: http://mobjectivist.blogspot.com/2007/05/discoveryshock-model.html
So, even though I believe this model contains reserve growth due to the downside tails, I have been on the conservative side on how best to fit the curves to the data. The backdating of discoveries makes the fitting of data a tad subjective for my tastes at the moment.
For this TOD post modelling the Shell discovery data, I tried to aggressively fit the data as it looks much more optimistic than previous discovery curves.
If I were to go back and be just as aggressive with the data from sources such as:

then we have likely hit peak already.
From a economic standpoint we really are not interested in oil that can be extracted at 1000 dollars a barrel so past a certain threshold which could be less then our current price but certainly less than 3x our current price all the oil thats only economic at those numbers is no interest. This represents a lot if not most of the remaining reserves. So if you include the concept of easy to extract oil with high EROI and a exponential decline in EROI you end up being comfortable with fairly aggressive estimates of peak. Of the 50% of the oil remaining at least 80% if not more will never be extracted under our current economic model. And its not clear its competitive under another model which would be unwilling to make or keep the large investments made to extract oil at the rate we do today since it would be a luxury item not a commodity.
Put it this way if we continue on the trend that seems to be developing of way under investing in the oil infrastructure alternative will be easily competitive with oil but at a much higher price point or total cost to the consumer. And on the flip side where to extract the oil remaining a exponential increase in investment is needed to keep the price of oil low enough to keep the market. In general making exponentially increasing investments to keep prices low is not common.
In the past markets have transitioned fairly quickly to alternative products maybe this is part of the transition.
Don can you comment ?
Btw my wife caught me ordering your book and raised hell
since she is aware I'm not good at economics.
She found the book online for 1.99 and used a 50 gift card to purchase it so it was effectively free I think ?
I've very concerned since she seemed very interested in reading it so Don you may have just ruined my life.
You owe me one if she uses your book to veto a big boy toy purchase.
This is truly a beautiful model and I can't wait to add it to the HSM. You should seriously think about submiting an article to the next ASPO conference for instance.
If I understand correctly, you are proposing a parametric model for the discovery curve that has a built-in reserve growth contribution (i.e. a heavy tail discovery curve). The skewness of the curve being controlled by the n parameter value. Interestingly, when n tends toward infinity the discovery curve is becoming a Dirac function where the entire URR is instantaneously available which is exactly what the logistic model is assuming.
One issue with the shock model is the correct projection of the future extraction rate function:

You are using a constant extraction rate for the predictive which is maybe too conservative.
Yes, Alan brought up the same extraction rate issue in an earlier comment, which I tried to address.
Interesting that you brought up the Dirac observation which you originally noticed in the hybrid shock model derivation.
http://www.theoildrum.com/node/2430
This is very important in that this is the single case that the Logistic model is decomposable into its consituent parts of discovery and production. The fact that it decomposes into a delta discovery function (basically an identity function) plus the production Logistic must be telling us something very fundamental about its derivation.
Khebab's original observation:
And that in a nutshell is the strength and weakness of the logistic model. My assertion is since we are only concerned about peak when discovery is comfortably in the past the fact that discovery and production happened at the same time early on in production can be treated as a weighted or normalized concept of oil.
I've called this easy to extract oil since in a real sense the easy oil is found early on and thus extracted first. Thus the URR given by the Logistic model is the URR for easy oil not real oil. So its a nice model of oil we can expect to extract at a reasonable EROI. Since we are fairly confident all the easily accessible oil has indeed been discovered early.
Technical evolution over time allowing the oil to be extracted faster improves the strength of the assertion that the oil was all discovered at time zero since later discoveries are simply extracted faster with better technology lessening the effect of pushing the HL peak forward. As the fields deplete a greater and greater investment is made to keep production levels up again pushing back the effect of a later discovery.
So I think considering the URR given by HL as the URR of cheap oil or oil that can be used to maintain our current economic model is quit valid up to some point shortly past peak when economic/social factors predominate.
So its not surprising that the URR of HL is low compared to other methods its effectively measuring easy oil not total oil and overall the assumption of no late discovery becomes less important as you near peak production.
So its not surprising that the URR of HL is low compared to other methods its effectively measuring easy oil not total oil and overall the assumption of no late discovery becomes less important as you near peak production.
I think you inadvertantly hit on the crux of the problem. Since there is no way to explain why the Logistic model works when it fits the data well, there is also no way to explain why it doesn't work when it fails to fit the data. This is arguing over a phantom, and you ought to keep to your guns and just use HL as a fitting tool.
Thats the nature of empirical models when they don't work you
scratch your head and flip a coin.
Actually I think I'm on track to some extent on why it does work when it does. And if you think about what I'm saying its not surprising that offshore which represents a lot of our production can cause problems esp in the North Sea since thats not exactly easy oil. So easy oil could be defined is at least 50% of the reserves on shore or shallow water and of course with the large fields discovered early in the cycle. The definition of easy oil is loose but if you look at the graphs HL works best in the "easy oil" regime. I think with you shock model you can show it fails mainly when its big weakness i.e discovery is finished at time zero fails.
In any case I see a real need for both models for full understanding. The combination of HL and shock seems much more powerful esp if we can use shock to understand why HL fails sometimes as you say.
The key point that HL seems to provide in its empirical form
is that quality is very important for oil production. This means ease of extraction rate of extraction type of oil etc.
The shock model and the current search model have no concepts of quality yet HL is indicating that its a critical parameter. This to me says that a quality measure is important. At the largest scale its the easy oil king and queen fields that allow the oil industry to exist in the first place to even make exploiting smaller fields economic. Without the infrastructure created to support the kings and queens the lesser fields are no longer viable.
Of course this raises questions as to how the oil industry will handle a world without king and queen fields if quality is as important as it seems the implication is troubling.
So at all levels a quality metric seems important and this as I said seems to be implicit in the logistic model.
The key point that HL seems to provide in its empirical form is that quality is very important for oil production.
That's an interesting assertion considering that HL is equivalent to a linear regression.
It's like saying that the method of least-squares is able to deduce quality as well.
I am only saying this because elsewhere you say that HL is best used as a curve-fitting technique, and no one should be able to attack it from other than that perspective. But now you think it has some fundamental theoretical value as well -- in some way able to discern "quality". Well, you can't have it both ways unless you explain what the Logistic means in a fundamental way.
Sorry for the confusion one of the key constraints on HL is that we assume all discovery is finished this is does not match reality and is false yet we get a good fit. This bothers me a lot and I think bothers you. Next because HL at the end of the day is only being fitted in the parabolic region a lot of other similar curves fit so the logistic nature of the curve is not important. However the constraints used to construct HL are different and probably have some physical basis.
Looking at the search model presented here and the shock model the missing piece is quality which for oil is probably predominately the fact that the king and queen fields are found early in the search pattern once a area is known to have oil.
The search model your presenting right now and even the shoc k model does not take into account this large field effect while the way we construct hl does.
Thats what I'm saying.
Also I've stated a few times that HL probably can be "disproven" or replaced with a better model but as you know it will be done with a composition of curves based on several factors determining this is non trivial.
I'm just saying that this big field or king queen effect is important and as far as I can see is not part of the search model or shock model.
I'm all for getting rid of HL but only because we have a better more physical model. Some of the later posts talk about all the numerical models used for stock market analysis HL is like those and I dislike empirical models that give good fits intensely they are like astrology.
My only concern is that it should be put to death correctly and its killer will give similar answers obviously in the cases that HL fits production.
The composition of multiple curves is the right approach.
I am not a fan of HL in the least I don't like it I am a fan of correctly destroying it which is not trivial. And the final model may continue to contain a logistic component but it will be their for physical reasons not just because of empirical fitting or it may not thats not important.
The only reason I keep testing back against HL is its know to fit a lot of cases so looking for logistic behavior in a real model is not a bad thing to do. So it can be destroyed but until it is it cannot be lightly dismissed because it fits a lot of production data.
My simplistic take on the issue is that regardless of whether oil companies are owned by capitalists, communists or Paris Hilton worshipers, they tend to find the big fields first.
In effect, a HL plot is primarily driven by the rise and fall of the giant fields. While smaller fields are generally profitable, they generally can't offset the decline of the giant fields. And in fact, HL plots tend to flatten with time, as the plot asymptotically approaches the horizontal axis, but this occurs as production generally continues to decline. So, the "tail" can be profitable, but is it material?
Consider the regions that more or less fit the HL pattern: Lower 48; Total US; Russia; North Sea, Mexico and now the world (EIA, crude + condensate).
I have a question. As I have previously described, when Khebab constructed HL plots for the Lower 48 and Russia using only production data through 1970 and 1984 respectively, the respective post-1970 and post-1984 cumulative production for both regions has basically been what the HL models predicted it would be. Why is that and what implication does that have for conventional world crude oil production?
The huge significance of the big fields in the dispersive discovery growth model is how it affects the fluctuations from the expected value.
I happened across this figure:

which looks different from this one:

The first figure suggests that a power-law growth did occur on finding big fields, but the second suggests that big field discovery eventually declined more quickly than the smaller discoveries.
The last question: I have no problem with the prediction, I just lack the insight to understand why it oocurs. IMO, Khebab has the best take by putting a monotonically-increasing extractive rate on the current reserve (estimated by the Shock model with discoveries as input). That this extractive rate factor is proportional to total cumulative production, I do not completely comprehend. It's probably just a good first-order estimate and something that Kheba suggests will work ala the Hybrid Shock Model. Whether we can keep this extractive factor up, I don't know, but it will certainly start decellerating as cumulative production starts slowing down (also suggesting a good 1st-order estimate).
HL is sensitive to this since it has a simplistic to say the least discovery model. Shock can handle any discovery pattern. Thus my concern :)
The second graph seems to indicate that the simple hl model is good enough. Note the key problem for HL is if a big discovery happens after production is slowing so as long as new fields are added before production slows its ok so it more robust then it seems at first glance.
The key seems to be a dependency between production and cumulative production. This need not be logistic since as we discussed only the part of the curve close to parabolic is of interest.
I don't like the use of continually adjusting reserve estimates or using them at all. A super model should not depend on published reserve estimates since they are in a sense and accounting artifact.
I'm sure the producers have a very good estimate of remaining reserves but in many cases it may not be whats published so it would be cool to be independent of the reserve estimate and make it a function of production rate vs total produced so once you pass the first inflection point on the left of the curve and the production rate slows down you can feed back a reserve estimate. You can't begin to predict reserves until the increase in production rate begins to slow but I'd argue considering all the reserve estimate changes no one can. So using that approach you get a continuous variable thats minimized as production proceeds. Its really just the observation that once your second derivative goes to zero you can start parabolic approximations and it should minimize before you reach the peak. So I don't see that published reserve numbers are needed for the model. So technically all this function is is the numerical solution using a experimental first derivative and the zero of the second derivative to guess the parabolic.
So we should not need the discoveries as input but can I think use a progressive URR estimate and wait for the model to converge. This is similar to HL but done a bit more rigorously with a iterative feedback part. This is similar to approaches used to calculate complex trajectories.
http://www.efunda.com/math/num_ode/num_ode.cfm
I think this is the right concept.
I think the "right" model should not need published reserves to get the correct answer.
Also note that technology to greatly increase the extraction rate has become available over time but we seem to see no effect from this at the large scales which is interesting.
Or we maybe we are just now seeing it.
And in general I wait for Khebab then try to figure out what he figured out. The general form should however be doable by mere mortals.
Tidal Turbines - The worlds largest
This is a great initiative to develop sustainable energy. Technology buffs will be interested in how these turbines look like regular wind turbines.
With Peak Oil nearly upon us its time we all start working to develop this technology.
http://giftofireland.com/Siteblog/2007/06/29/worlds-largest-tidal-turbin...
The relationship there is that discoveries are only proved via drilling (I think that's true). So a discovery is always technically capable of being produced, because you have already drilled in that location at that depth.
So the initial discoveries made with earliest drilling technology are automatically the easiest to produce. It is only when you push the envelope - deeper, and/or offshore, inhospitable locations, that the commercial prospect reduces. E.g. drilling a discovery well in the North Sea is one thing, putting in infrastructure is another level of investment. In the extreme, like Jack 2, you can drill a discovery well, but putting in infrastructure to produce in quantity may never be economically feasible.
If you read about the Thunderhorse problems, it is pretty amazing - it is far bigger than just the listing platform. They discovered faulty welds in a lot of the sea floor pipework. They use divers to cut it up, then lift it to the surface in pieces, weld the whole lot back together, then lower it assembled back to the sea floor.
I may have missed explainining this but I think of someone keeping a notional "map of exploration" that tracks all places that have been searched so that nothing gets checked more than once. I kind of agree that provable would need to be verified by drilling but there are probably huge swaths of the earth that are excluded by nothing more than scientific analysis. And since sientific analysis gets better each year, then this exhibits the same monotonically increasing growth laws.
Thanks for the comments and good words.
If you like, add more comments, and I can address them later on today after I get through with my 9-5 day job
Thanks for accepting this guest post, this is exactly that kind of summary of your work I was looking for.
I have made some tests with your new model on the Lower 48 data.
I have the following discovery data from DOE/EIA:
The backdated reserve growth is apparent on the following chart:
There is no obvious trend in this chart that would follow the USGS modified Arrington model for reserve growth.
The question is: which dataset should I use to compute the cubic-quadratic model (1987 or 2000)?
Below are the two models I obtained (n=6, k= 2e-10, t_0= 1837), they differ because Dd (the URR) has increased by 8.3910 Gb (reserve growth + new disoveries):
It seems to me that we are still unable to capture the dynamic of reserve growth (i.e. the green curve will be larger in the future and has been smaller in the past). Backdated reserve growth is useless for the shock model because we need the instantaneous reserve addition at a particular date t coming from all the discoveries prior to this date. So we need to "debackdate" reserve growth on the discovery data. I applied the following steps:
1. for each year I divide the discovery value by the Cumulated Growth Factor (CGF) given by the modified Arrington model ((see http://www.theoildrum.com/node/2430 for details). The resulting curve is an estimation of the original disovery data without reserve growth.
2. I simulate a non-backdated reserve growth by convoluting by the reserve growth function filter derived from the Modified Arrington model (see http://www.theoildrum.com/node/2430 for details)
It gives the following result:
Note how the new discovery curve with non backdated reserve growth has a more heavy tail (in red). Then, I fitted your model using n=5.5, k=2e-10, Dd= 190 Gb and t_0= 1821:
The resulting fit is better and shows that your model is close to what can be derived from the modified Arrington model.
So I can follow your steps, let me talk this out.
Backdated fit:

(I laid your fit over the DOE data)
This includes the backdated data which essentially exaggerates previous discoveries. In other words, at the time of original discovery, an estimate of the discovery was made but this original estimate was obscured by subsequent backdating. This would tend to suppress the values of all the points on the curve, with the biggest suppression occurring on the oldest data points. The end result of "deconvoluting" the data would be to make the down-side tail heavier than it appears in the above picture.
So the next fit was on the deconvoluted data which gets convoluted to simulate Arrington reserve growth. I notice that this convolution has the effect of smoothing the data set and shifting it forward a few years which is to be expected.
I think this is an intriguing tact.
The only quibble I have is the value of t_0. As a purist and trying to limit the number of variables, I would always set this to 1858, the year of the first oil strike. But if you have some evidence that real prospecting came before this time, then I would definitely put that t_0 in the fit.
I have suggested that single reservoir Arrington reserve growth might be explainable by the application of the dispersive model in the 1D case, where the depth of confidence increases linearly with time.
http://mobjectivist.blogspot.com/2007/04/apparent-reserve-growth.html
My understanding is that the Arrington growth is purely a hueristic, and one could argue that this has not been completely verified as Attanasi & Root used some questionable censored data to "prove" the growth model.
Which is probably worthy of a related discussion.
This is a great initiative to develop sustainable energy. Technology buffs will be interested in how these turbines look like regular wind turbines.
With Peak Oil nearly upon us its time we all start working to develop this technology.
http://giftofireland.com/Siteblog/2007/06/29/worlds-largest-tidal-turbin...
I originally thought that t_0 was a parameter of the model. I assumed that t_0 was controlling the curve shift in time (which is the case for a logistic curve) and k was impacting the slope of the cumulative discovery (assuming n constant). The criterion I used to determine t_0 is that the discovery midpoint (i.e. D(t)= Dd/2) must match the observed midpoint year.
Note that I'm not using the original Arrington model but the Modified Arrington model recently proposed by Verma which is less optimistic:
M.K. Verma, Modified Arrington Method for Calculating Reserve Growth—A New Model for United States Oil and Gas Fields, U.S. Geological Survey Bulletin 2172-D
http://pubs.usgs.gov/bul/b2172-d/B2172-D.pdf
Despite being heuristic, these models have been able to correctly forecast the Lower 48 reserve growth:
Note that we are able to replicate closely Verma's forecast for the lower 48:
* Reserve growth over 30 years from 1997:
Verma: 22.90 Gb
debackdating+convolution: 25.21 Gb
Your model: 19.73 Gb
* Reserve growth over 80 years from 1997:
Verma: 31.387 Gb
debackdating+convolution: 36.35 Gb
Your model: 27 Gb
It is a parameter of the model but it differs from the families of exponential models in that discoveries at time t_0 are zero by definition. Whereas an exponential has to start at something other then zero (which means that to reach zero you have to go back to time=-infinity). So if you set t_0 before 1858, you will get finite probabilities of discoveries before discoveries were made! I suppose we can safely put t_0 before 1858, as some linear growth in exploration had to enable that first discovery in Pennsylvania.
But what's interesting about Khebab's fit to the USA data is that we can actually test it against historical oil production, which actually goes back to 1858. Just have to add the shock model or hybrid shock model (take your pick, and use a constant extraction rate over the entire range)
I have tried this fit earlier, but I used a fairly slow growth model (only quadratic as I hadn't thought about the 3D aspects of growth at that time)

As you can imagine, I do think the debackdating+convolution is a subtle yet very important technique which we is necessary to account to reconstruct incomplete information.
zerothan the initial parameter from something like exponential
Hey WebHubbleTelescope,
You might be amused to see a similar model being used by a cornucopian. Instead of "needles in a haystack" he talks about "pistachio nuts in a nut room".
From the article Arthur Foulkes: We will never run out of oil
Am I missing something or do those last statements not make sense? Seems to me that the "nut room model" shows that the oil age will end because of "a lack of oil"!
Does not make any sense because there is no idea of the persistence of not searching through areas that are empty shells.
But other than that the analogy certainly sounds less cornucopian than the author probably intended.
You are right, the example does not make sense. But the article is really about faith in substitution, rather than the nature of supply and demand.
I have no problem with the concept that declining supply leads to higher prices, producing a desire to find a cheaper source. However economic theory does not guarantee that there are cheaper sources to be found, only that the desire for them increases. High prices do not put resources in the ground, that is an accident of nature and history.
His facts are a little off, the industrial revolution started with water power. The earliest steam engines were used to pump water out of coal mines, naturally they burnt coal. The reason for mining coal was because wood had already been largely exhausted as a fuel. Steam power also enabled coal to be economically transported from the mines to the cities were it was used. Development of steam power relied on the discovery of the vacuum in about 1643 (and other scientific discoveries), coal had been known for a long time but the knowledge of how to use it was new. It is somewhat misleading to say that exhaustion of wood led to the "discovery" of coal.
The substitution theory is somewhat dubious anyway. It is easy to see that coal replaced wood. But globally we now use more coal than ever before, so oil/gas has not replaced coal, but augmented it.
The argument "we will find an alternative, we always have" is self-selecting. It's true our society has so far found alternatives, it's why we are still here. But archaeologists have found many civilizations that came up against resource limits, but found no alternatives, and subsequently collapsed.
I formulate the economic theory as "high prices will encourage the development of cheaper alternatives, if they exist". The caveat is crucial.