Does the Hubbert Linearization Ever Work?
Posted by Robert Rapier on March 22, 2007 - 11:15am
Part II: The Titanic, Oilsville, and Saudi Arabia
In Part I, we examined the evolving Hubbert Linearization (HL) of Texas oil production, and found that the predictive precision of the technique was quite poor. The error range was on the order of 3 decades. However, some have suggested that the trends just need to stabilize, and then we can be more confident in the predictions. Others offered rationalizations for why Texas behaved as it did, and suggested that the HL is still a useful predictive tool provided we somehow filter the data. Still others suggested that it is futile to attempt to linearize non-linear data. In this essay, we will push this issue further. I will examine more cases that cast grave doubts in my mind that the HL can accurately predict anything.
But first, does this debate even matter?
The Sinking of the Titanic
A number of people have latched on to the sinking of the Titanic as an appropriate analogy for the debate over the methodology and timing of peak oil forecasts. I see those analogies as missing a number of key points. If you wish to apply an appropriate analogy, try the following.
After the Titanic hit the iceberg, a debate quickly ensued on how fast it would sink. One train of thought was that it didn’t matter, because everyone was doomed anyway after the precious few lifeboats were utilized. Most of these people sat idly by biting their fingernails while others made decisions that would affect them. One train of thought suggested that based on the alignment of the stars – which had correctly forecast prior disasters - sinking in 2 hours was inevitable. These people proceeded to warn everyone to expect the ship to go down in 2 hours. They demonstrated unwavering faith in their forecast.
But another group employed a more scientific approach. First, they challenged the faith-based group to show a case in which their methodology had ever been demonstrated to work. Challenges to their arguments were met with repetitious assertions of the original claims. Yet the scientific group continued to challenge the argument – not because they didn’t think the ship was sinking – but because they saw some inherent dangers in faith-based arguments and they were not satisfied with the integrity of the conclusions. In response to their challenges, the scientific group was accused of mounting frantic, even hysterical attacks on the faith-based arguments. They were accused of having agendas and of being non-believers. The faith-based proponents were praised by their followers for maintaining faith in the face of these challenges.
However, the challenges persisted, and some in the scientific group pointed to data suggesting that the ship would actually sink in 4 hours. (To be fair, some scientifically minded investigators concluded that the ship would sink in 2 hours). But two hours after the iceberg was struck, the faith-based group began to cry “We are all doomed!” A number of people, unable to bear the tension any longer, decided to end it all before they were plunged into the icy water.
But the 2-hour mark came and went, and while it was clear that the ship was sinking, the voices of the faith-based group had been silenced. They had either jumped overboard as the 2-hour mark bore down upon them, or they were ignored because their assertions now rang hollow. They still sought influence, but their previous tactics now undermined the possibility of sounding a warning.
At the 3-hour mark, a few small rescue boats made it to the area. While there were not enough boats to save everyone, some of those who had taken a cautious approach toward the faith-based group were saved. However, there was a very large group of people who did not differentiate between the arguments of the faith-based group and those of the scientific group. They decided to discount both messages. “After all,” they argued, “these sinkers have already shown that they can’t forecast very well.” So this group called into question the credibility of the scientific group based on the missed forecast of the faith-based group. They convinced great numbers that the Titanic wouldn’t sink at all, and that they were safer taking their chances there than by climbing into a rescue boat on the open sea.
Of course we know how the story turned out. The cry of “wolf” at the 2-hour mark resulted in great loss of life when the Titanic actually did go down at the 4-hour mark. Those who survived were the ones who valued the scientific approach of cautiously evaluating and challenging the data. Many doomers were wiped out at the 2-hour mark, and many cornucopians – along with the vast majority of the passengers - were wiped out at the 4-hour mark. So the debate over the timing of the Titanic’s sinking actually had great significance for all 3 groups. And while we don’t know if any rescue boats will actually arrive or just how long we have until the ship sinks, the debate does matter to many people.
Oilsville – The Constant Production Case
Consider the case of a fictional society called Oilsville. Oilsville discovered a great oil reserve in 1955 and began full production on January 1, 1960. The size of the recoverable reserve is at least 5 trillion barrels. Oilsville’s policy makers decided that they would maintain their oil production constant at 10 billion barrels per year. It was estimated that the new find would provide for the needs of Oilsville for at least 500 years, provided they maintained their longstanding policy of keeping their population relatively constant.
Note that we have made no assumptions about how they produce their oil. We don’t know if there is a water-cut, we don’t know if they are using horizontal wells, and we don’t know how hard they are pumping their fields. All we know is that they are keeping production constant. So, let’s do a series of HLs for Oilsville to better understand the HL behaviour under these circumstances. First, fix in your mind what you think the HL for Oilsville will look like after 20 years of steady production. Form your hypothesis. So, what does the HL actually look like?
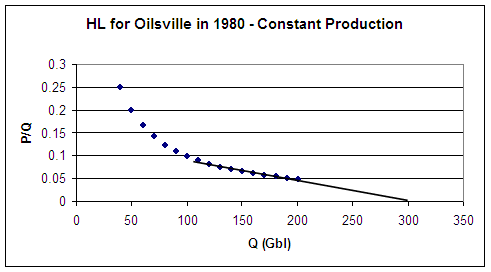
Figure 1. Hubbert Linearization of Flat Production Case after 20 Years.
At the end of 1980, they have produced 200 billion barrels, or 4% of their total URR of 5 trillion barrels. The last 10 points on the graph have stabilized such that we can make an estimate of URR based on the HL. It appears from the HL that the predicted URR is 300 billion barrels. However, this is only 6% of the actual URR. The % Qt indicated by the HL is (200/300) or 66.7%, indicating a fairly advanced stage of depletion and likely well past peak. Yet the actual depletion is 4%. Furthermore, recall that even though the production rate is constant, the slope of the line is negative. This may confuse some into thinking that production is declining.
Maybe that one was a fluke. Let’s look at 1990.
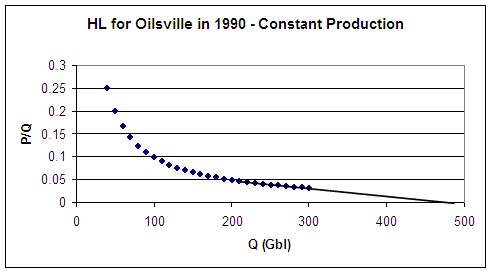
Figure 2. Hubbert Linearization of Flat Production Case after 30 Years.
Hmm. The URR according to the HL prediction has now increased to 460 billion barrels, still only 9.2% of the actual URR. The % Qt implied by the HL is now (300/460), or 65.2%, while the true % Qt is (300/5,000), or 6%. Also, by 1990 they had produced 300 billion barrels, which only 10 years earlier was predicted as the URR by the HL. These HL predictions are not remotely in the ballpark. Let’s jump to 2000.
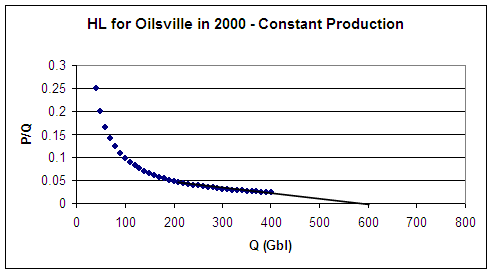
Figure 3. Hubbert Linearization of Flat Production Case after 40 Years.
It’s more of the same. The URR is trending to a higher value. The HL is now predicting that the URR is 580 billion barrels, or 11.6% of the true value. Cumulative production in 2000 is 400 billion barrels, giving an implied Qt of (400/580), or 69%. The actual % Qt at this point is (400/5000), or 8%. But let’s look at one more in 2010:
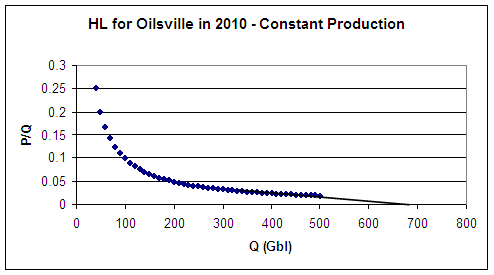
Figure 4. Hubbert Linearization of Flat Production Case after 50 Years.
Again, the pattern is the same. URR as indicated by the HL continues to grow, and now stands at 630 billion barrels, or 12.6% of the true URR. Yet cumulative production is now at 500 billion barrels, giving a predicted (500/630), or 79% of Qt. That’s right; the HL is telling us that they are 79% depleted, when they are actually only (500/5,000), or 10% depleted.
The HL has failed in this case, and furthermore it will show the same tendency for any area having relatively flat production over an extended period of time. I will leave that one for the reader to do as an exercise. But the problem is – as someone mentioned following my previous essay – linearization of non-linear data. That is why we so often see “doglegs” when we stop and plot the graphs. Often, the dogleg is a mere manifestation of the fact that we are drawing a straight line through a curve, and the points at the end don’t fit.
The Rising Production Case
Now, if that doesn’t convince you that there is a problem, perhaps this will. Instead of a constant production rate, let’s assume they increase production each year by 0.1 billion barrels per year. Let’s also say we no longer know anything about reserves. You could assume any number you want. Let’s revisit the HL from 1960 with this new assumption:
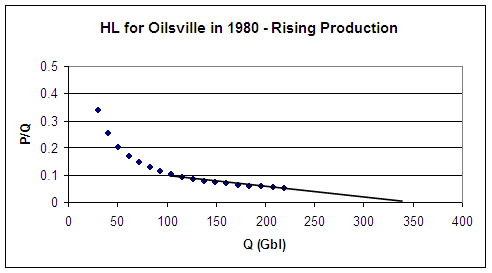
Figure 5. Hubbert Linearization of Flat Production Case after 20 Years.
At the end of 1980, they have produced 219 billion barrels. Despite the fact that production has increased each year, and despite the fact that the reserves could for all practical purposes be infinite, the HL predicts a URR of 348 billion barrels. So, 20 years into production, the HL says they are at (219/348), or 62.9% of Qt. Furthermore, the R-squared of the last 10 points is a respectable 0.969, indicating a very good fit for the trend line. To me this is indicative of a major malfunction in the HL, given that all we know is that production has increased every year.
Once again, the HL has failed badly in Oilsville. And while you may dismiss this case as an unrealistic example, consider the implications. This example suggests that it is not possible to forecast a production peak prior to the production actually turning downward. Given this, I conclude that it is highly unlikely that Hubbert actually used this sort of linearization technique in making his forecasts.
The Ideal Production Case
“No fair,” you say. “You are feeding the HL contrived and unrealistic cases. You can’t expect it to behave in these instances.” So, let’s examine an ideal case. Consider the case in Oilsville where the production rate increases by 5% each year for 20 years, and then starts to decline at 5% a year indefinitely. What we see in this case is an eventual convergence toward a URR of 861.3 Gbl. This should be an ideal case for the HL. Peak production will occur in 1980, and we will cross the 50% depletion mark in 1984. We know all of the important parameters. But can the HL predict the results? Let’s look first at the HL for 1980:
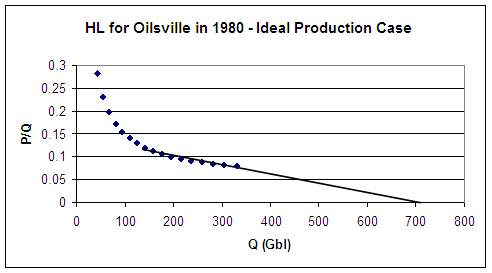
Figure 6. Hubbert Linearization of Ideal Production Case after 20 Years.
Even though production has risen each year to 1980, the HL is still under-predicting the URR. The R-squared is indicating a good fit at 0.945. The trend line is predicting a URR of 702 Gbl, an under-prediction of 159 Gbl. Cumulative production in 1980 is 330.7 Gbl, which means that they are at (330.7/702), or 47% of predicted Qt. But the actual position is (330.7/861.3), or 38% of Qt. Remember, that last point represents the year of peak production.
Let’s jump forward 10 years.
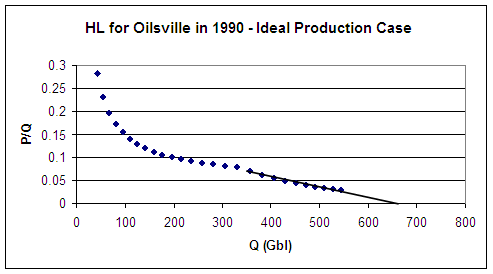
Figure 7. Hubbert Linearization of Ideal Production Case after 30 Years.
The 50% depletion mark was crossed in 1984. The HL is now predicting a Qt of 667 Gbl, which is a greater error than the previous prediction. The R-squared in this case implies a better fit than in the previous graph (0.986 now versus 0.945 for the previous case). Yet the actual URR is being under-predicted by 194 Gbl. Cumulative production in 1990 is 543.6 Gbl, putting the actual % Qt at (543.6/861.3), or 63%. The predicted % Qt is (543.6/667), or 81.5%.
The HL is lying to us even in the ideal case where we have specified all of the important parameters. In none of these cases has the HL come close to providing accurate predictions.
Saudi Arabia
If the HL is not even reliable when all the important parameters are defined, then it is pointless to use it in a case in which we are trying to predict the parameters. The HL has failed all validation tests. As someone accurately said in another thread, my motive here is that I really want to know “what the heck is going on.” Given the enormous errors in the HL predictions where URR is persistently under-predicted, I don’t have any confidence in the ability of this model to do that. We saw this in the case of Texas, where the URR grew by 50% in 20 years.
The HL has failed us in every single test case. But let’s go ahead and look at the case of Saudi Arabia. So, what does the actual HL look like for Saudi? First, we need production statistics from Saudi. After 1960, those numbers are available from the EIA. (1, 2) Prior to that, I had to cobble data together from several sources. According to Matt Simmons’ Twilight in the Desert, (3) the first major oil discovery in Saudi Arabia occurred in 1938. Simmons further indicates that production was slow during World War II, and that at the end of the war Saudi was producing 60,000 barrels per day (bpd). Figure 3.3 in Twilight shows that in 1950, Saudi was producing about 0.5 million bpd, and by 1960, production had risen to just over 1 million bpd.
To calculate cumulative production prior to 1960, I assumed an average of 30,000 bpd from 1938 through 1945, and then an average of 250,000 bpd until 1950, and finally an average of 750,000 bpd from 1950 to 1960. There may be an actual cumulative number available, but I haven’t found it. Regardless, later production rates are high enough that even if we assumed no production prior to 1950, it would have minimal effect on the results. But based on my assumptions, I calculated a total of 3.2 billion barrels produced in Saudi Arabia before 1960. Using those assumptions, the entire HL graph for Saudi Arabia looks like this:
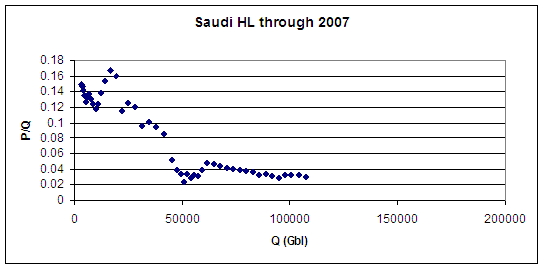
Figure 8. Hubbert Linearization of Saudi Arabia in 2007.
This curve is quite consistent with previous HLs of Saudi Arabia. The HL was very erratic until 1991, at which point the slope became relatively stable. By 2000, there were 10 points that looked to have stabilized:
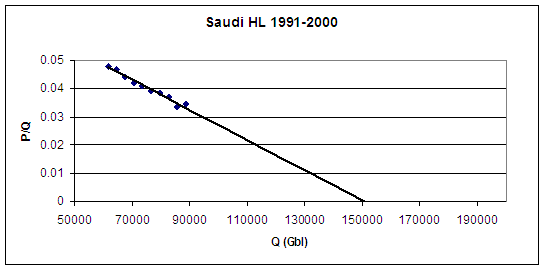
Figure 9. Hubbert Linearization of Saudi Arabia 1991-2000.
The HL performed in 2000 predicted a URR of 151 Gbl. That would put cumulative production through 2000 at (88.7/151), or 58.7% of Qt. The R-squared is 0.969. Now let’s include production numbers through 2006:
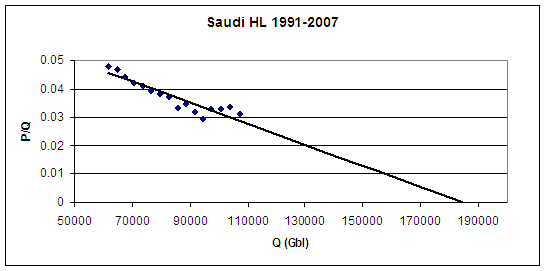
Figure 10. Hubbert Linearization of Saudi Arabia 1991-2007.
The addition of a mere 6 years of production data has shifted the URR prediction to 185 Gbl. Between 2000 and the end of 2006 Saudi Arabia produced 19 Gbl, but the URR prediction increased by 34 Gbl. Because of this, the 2006 HL is at a slightly lower % of Qt than the 2000 HL. In 2000, the graph showed that Saudi was at 58.7% of Qt, but in 2006 the graph indicates that Saudi is at (107.5/185), or 58.1% of Qt. This implies that one could have used the HL to make a stronger case for an imminent Saudi peak in 2000 than in 2007. Furthermore, the R-squared in 2006 – 0.856 - is worse than in 2000, indicating that the stability of the line has degraded. Yet this is the data that is being used by some to forecast the peak of Saudi oil production. Perhaps you can now understand my extreme scepticism that the HL has the ability to accurately make such a prediction.
Conclusion
Based on the case studies I have carried out – both hypothetical and real – I conclude that the Hubbert Linearization technique does not have the capability of predicting a production peak in real time. Furthermore, I believe it is the responsibility of those who are using this technique as a basis of their peak predictions to validate the model. Each case I have investigated showed a failure of the HL technique and an incorrect prediction. This was true for Texas, it was true for the idealized cases, and we are now seeing evolution in the HL for Saudi Arabia. But it is not my responsibility to investigate every possible variation of when the HL “might” work. I could spend the rest of my life evaluating case after case. I think it is a much more reasonable request to ask proponents to provide details on some cases in which it did work - or would have worked – to predict a peak in something resembling real time.
If we are to have any confidence in the HL model, I think it is fair to request the following of HL proponents:
1). Please validate your model. Demonstrate any case – real or hypothetical – in which the HL would have predicted a peak in real time. Details are preferred over assertions.
2). Please define the conditions and parameters of the HL (e.g., % Qt, P/Q intercept) that indicate a production peak.
3). Please identify cases in which the HL would be expected not to work.
4). Please identify any other criteria (filtering, etc.) that need to be fulfilled before the method should be used.
I know that some have a difference of opinion on whether this debate even matters. I am of the belief that it does, and that we should rigorously challenge all of our assumptions. Furthermore, I know that there are some who believe that peak is imminent, but who also agree that continually testing and evaluating conclusions is necessary. I want to make it clear that there is a big difference – especially in the ability to persuade others – in the faith-based approach and the more rigorous approaches. This is true regardless of the ultimate conclusion of the approach.
References
1. World Oil Production 1960-2005, Energy Information Administration, Accessed March 18, 2007.
2. Saudi Production 2006, Energy Information Administration, Accessed March 18, 2007.
3. Simmons, Matthew R., Twilight in the Desert, John Wiley and Sons, Inc., 2005.
Note: There were a lot of calculations involved in this one, and it is quite possible that there may be an error or two. If you spot one, I would be grateful if you would call it to my attention and I will fix it. Thanks.
Contact
- Content: editors at theoildrum dot com
- Tech support: support at theoildrum dot com
License

This work is licensed under a Creative Commons Attribution-Share Alike 3.0 United States License.
Robert,
a systematic study done well. This appears to be a fairly damning case for HL predictive ability. What happens when you look at your idealized case at a true 60%
depletion? Can the URR be approximated?
I will run that when I get a chance. My feeling is that it does converge, and the ideal production case will be a good test case.
Robert, a good article that points up some of my own misgivings about the reliance on HL. The wise words "don't use models the way a drunk uses a lamppost - use them for illumination, not support" comes back to me. The moment you rely without thinking and questioning is the moment you make that BIG mistake.
To me the whole thing is very much a case of 'the central limit theorum' - if you know nothing more then you can assume that the combination of independent distributions tends to a normal distribution (eg 'Peak Oil'). However we DO know something more - production is NOT independent and production levels/demand are significantly influenced by politics, prices, technology, social events, etc. Although to a first order it will be OK, we know the model cannot be taken beyond that because of all the influences upon it.
Does that mean peak oil is a joke (hello CERA)? No, the basics are still there. Oil is a finite resource and production will increase with increased usage, and decline with increase problems of production (smaller, harder wells). However to get to a useful prediction of reserves, dates, and most importantly, decline rates, we need a much better model - particularly since we have to make up for hidden data.
Some try to consider fields individually, summing the resultant predictions to arrive at a global production forecast, bottom up. Some also try to capture planned developments (megaprojects) to predict future production. Neither really deal with the key issues the confuse our view of production/reserves and thus forecast - the human dimension.
It seems to me the only way to try and apply a model to the data to make predictions is to 'reverse out' the effect of the human dimension on production figures - constructing an idealised production history from the raw data by removing the human perturbations (from history, which we DO know accurately). From there we can use three more pieces of information; which fields the oil is coming from, the fact that any country/company will produce its 'easiest' oil first, and the fact that companies will produce oil so as to maximise their discounted return on investment.
Putting that together, it should be possible to arrive at an alternative history of production which would then be amenable to improved mathematical modeling to determine what was under the ground. We could then take real production to yield real world predictions of future production capability.
I'd suggest that a fuzzy systems dynamics model is the first approach to performing this 'reversing out' - constructing a model that predicts out history supply record with the known history, and then reversing the effects of the elements to arrive at the inputs. It sounds as if this should work, being based on the data we do know accurately (production totals, history, driving behaviours), rather than the data we don't (URR, etc.)
Your thoughts?
Shouldn't that be "the way a dog uses a lamppost.." :)
I just used the non-dog variation on the Logistic model:
http://mobjectivist.blogspot.com/2007/03/derivation-of-logistic-growth-v...
This is the "drunk looking for his car-keys under the lamp-post" problem. Somebody asks the drunk why he chose to look under the lamp-post. "Of course, that's where the light is".
But the dog variation is actually more funny and perhaps more telling.
WHT
Perhaps you could post an article here describing your Shock Model. In particular I would appreciate your view of recent Saudi production with regard to your model, assuming that they are pumping to the capacity of refiners to accept their crude oil.
The only reason I'm not convinced the shock model is right is I'm not sure we have enough data to support it. I think it is probably a better model but on the same hand given the data a simple analytic model suffices. I think you could drop even drop the
logistic curve and simply use parabolas. It would be nice if you picked a simple model of your choosing that you did like so we could see how the shock model varied against that.
Here you basically do that.
http://mobjectivist.blogspot.com/2007/02/quardratic-linearization.html
And here you compare to a Gaussian. Isn't a Gaussian good enough for our purposes ?
http://mobjectivist.blogspot.com/2007/01/missing-link.html
Next you added in discovery for the US but KSA for example has had many fields that were discovered yet not produced because of technical problems.
Again in general your right and I agree its just hard to see
if your model has to many parameters.
I actually favor a Gaussian because it fits what I know about movement of molecules through a matrix so it scales nicely a sample of the matrix all the way up to the field.
So you don't have to change equations. Because of the noise in the data I did not see that the choice makes a lot of difference.
I'd say the best approach is a Gaussian first approximation then move to something like the shock model for more complex cases. In general the only reason to model is when your within 20% of peak on the front side as say 10% on the backside. So I'm not sure we needs a super good model.
With that said I'd love to see you model Russia.
Thats one that HL basically fails on and probably any other simple analytical model. And if you do what I said and pick a simple model this would be a good way to show when it fails.
The only reason I'm not convinced the shock model is right is I'm not sure we have enough data to support it.
Yet you latched on to the HL and continue to insist that it has value, even as case after case falls upon scrutiny. Now, scanning down the responses I can see that you have been reduced to aspersion casting. You still haven’t produced a case that works, but insist that I have demonstrated nothing. It is like someone who insists there are pink unicorns living in their house. I go from room to room, and I find no pink unicorn. But you insist that the burden of proof is on me to show that the unicorn is not there. Actually, the burden of proof is on you. Show me the unicorn.
Thats one that HL basically fails on…
Show me one that it didn’t basically fail on.
Robert its a model. In this post you already showed it works for KSA in your examples of how it does not work.
The 2000 production data gave a good fit and when you went to 2006 the fit was worse and the URR changed but the model indicated that it had more noise. The good thing about HL is its noise or error term is realistic.
So you already posted a great example of HL working if you understand modeling.
So what is the model hinting at after 2000 ? Its says that a lot of "new" production was brought online but yet KSA did not
find some large new field during this time period.
So what happened ?
They had spare capacity in 2000 by 2006 this was gone either it was rotated out or depletion is catching up since prices are still high depletion is a good possibility.
HL cannot predict when someone changes the extraction pattern abruptly but it does show in the data and the fit as noise. Its also giving us a estimate on how much spare capacity the used to have. And we have confirming statement from KSA that say they where pumping at capacity in 2005.
If you had bothered to read on the noise distribution in HL you would have realized that a increase in the noise itself
means something disrupted the model since the noise goes to zero. And your using the URR estimate without a error term
if you showed the real error in URR you would see that most of what happened through 2006 was simply to increase the error in the estimate the error terms probably still overlap.
I'm comfortable with your KSA plots and believe since KSA was a confirmed swing producer and the model shows that they have brought all their excess capacity online they have already peaked from the HL data.
This post is junk science at its worst.
Its a different metaphor. One is about using the lamp post as a tool to help, rather than trusting it to do all the work - the other is about looking to find answers only where you have the data.
Lots of lamp post metaphors.
Ahh well, looks like nobody is going to come back on the meat of the suggestion. Pity really, I think systems dynamics and working from the data we really do have is a promising approach. Maybe I'll have to do it myself one day.
Whats your rate of production in each case ?
If your assuming the same rate of production then your right
but thats a incorrect you of the model.
If you have such a large urr your production rate should be much higher then in the examples your giving.
I don't yet think you have proved anything. To be honest.
The production rate should depend on the total URR thats
the reason why it should work. The production rate is a non-linear function of remaining URR. Even your simple case of increasing by 5% per year then decreasing by 5% is wrong
although closer too reality and in this case HL is giving results inline with the real answer.
If your going to test the model this way we need the real production non-linear function. A Gaussian should be right. Or you can use a square wave as the first approximation.
So far I don't agree with your production models.
It would be easier if you also posted the production profile you assumptions are making.
I actually think this is a better analysis then what you just presented.
http://mobjectivist.blogspot.com/2005/12/hubbert-linearization.html
And more in line with what I've said.
Lets keep looking at this before we throw HL out.
I don't yet think you have proved anything. To be honest.
I have shown case after case, real and hypothetical based on rising production, flat production, rising and then falling production - and it has never worked. So do you think it would be too much to ask - given that you think the model has some merit - that I ask you to do some plotting and show me a case in which it worked, or would have worked? It's not like I went looking for cases to disprove it. It was wrong in ever case I looked at. So I ask you to show me a case in which it worked.
So far I don't agree with your production models.
Well, see the challenge at the end of my essay. Provide your own. Show a case that works. Stop saying it works if you can't show a case in which it worked.
It would be easier if you also posted the production profile you assumptions are making.
I told you exactly what my assumptions were. You could generate it in 3 minutes in Excel. Otherwise, I am going to post a hundred lines of numbers here.
Robert the function that ties production rate to URR is a unknown non-linear function. HL is a way to guess the answer without knowing this function. Thats why its empirical.
The one example you gave that was even close to reality was giving HL answers that were not too bad.
What you have just wrote says nothing about HL it's basically garbage.
If you come up with something close to right its worth arguing about. Your so hell bent on proving HL wrong your not even trying to understand it.
You can keep being unreasonable or start thinking.
I gave you a hint the shape of the function is not that critical. It can be a Gaussian or a square wave.
And I told you the reason HL works is regardless of the shape of the curve the peak time and total URR are basically constants thats why HL works. The model HL uses is the Logistic curve.
http://mobjectivist.blogspot.com/2005/12/hubbert-linearization.html
He is basically right. We just happen to know the logistic curve seems to give the best fit for a simple analysis.
It seems that these unkown non-linear functions that relate production to URR can be mapped to a logistic curve. Of course the probably map to others. I'm not convinced logistic is the best but I think the error in the data is high enough it does not matter.
So again go back and pick any non-linear function that maps production rate to URR use that to generate your production data then run HL on the results. I'd like to see the graph
of the production profile so I can visualize the function.
The 5% per year one is basically I triangle if I understood
what your saying.
Then and only then can we discuss HL.
If at this point you have some valid arguments I'm interested. I know I'm being a bit harsh but this is bogus
and its public.
One more time.
Its too early to throw out HL.
Memmel,
Robert has an interesting point though. As he accurately describes a situation (Oilsville) with a flat production rate, what happens is that the width of the upside down parabola begins to increase; i.e. the second derivative of the production profile starts shrinking.
This kicks the y-intercept further and further into the future. Which you can mathematically see in that blog post of mine that you referenced.
Actually in the case you mentioned HL still works since the
peak comes down as the curve flattens. So as long as its a parabola your ok.
Generally flat production happens on the backside when production is constrained the case I use is a well that 90% watered out and the rate of production is constrained by how much water you can handle.
HL is not a good method once your constrained by above ground factors. Remember there is still a lot of oil left behind even after a well has watered out so its being produced at a low production rate basically forever for all intents and purposes. But where it fails your way past peak production anyway so whats the point ?
You can also of course come up with a number of contrived cases where a field is not reasonably exploited and these would show a flat production at the beginning. I don't know of a real world case that fits this.
One we have is Russia which collapsed where production collapsed for several years then rebounded slowly. And this one is problematic.
I might add there is a chance here to have a good discussion on HL and it needs to be examined but lets at the minimum start the discussion with the right baseline in place.
I have not varied all the constant volume parabolas to see if you can introduce some numerical instability into the procedure but mathematically all your doing is a trick integration of the parabola so all true parabolas with the same area give the same answer.
The real important piece that gets dropped on the floor it seems like is Hubbert is assuming a parabola or Gaussian shaped distribution the area under the curve is a constant
this makes the "date" of peak a constant just the shape of the curve is changing so what really changes is the amount produced at peak but this is not so important. If you have enough points on the curve then you can get both. I don't understand the choice of the logistic function over others but as I've said a few times I don't think it matters to much given the quality of the data. HL has real issues that should be addressed. They have not so far.
In any case you have to use curves the might is well be parabolas since you taylor expand with constant volume/URR
and linearize those the get the numerical instability.
Other curves i.e Gaussian are interesting but this is secondary. What Robert has shown so far is not that interesting.
Btw I'd be happy to talk with WebHubbleTelescope on the issue.
He at least seems to understands the problem.
He rejected HL and generally I AGREE WITH HIM.
Sorry for the caps but your not listening.
Someone has already done a fantastic job of questioning HL
and he used the correct production profile.
Until you integrate his work I'm not sure what the heck your doing.
http://mobjectivist.blogspot.com/2005/12/hubbert-linearization.html
One more quote from his blog.
So a good well reasoned rebuke of HL already exists.
And I'll say one more time generally I agree with him.
But its not clear that he can come up with a better model given the data we have. Not that he can't create a better model or a better model is possible simply do we have enough
data to support a better model.
So again does HL have problems yes here is the link that points out its flaws.
My answer as to why it works is simple.
Although the function changes that describes the actual production profile HL implicitly assumes that the rate of production is related to the overall URR via the logistic curve. Since we know from theoretical plate models that the time of elution or peak is related to the interaction of the
material with environment with a given geology if you steadily pump a field the time of peak does not change.
This means you can change the shape of the curve but your not actually able to change URR or the date of peak by much
without massive changes in the way the field is pumped.
In the case of chromatography they use Guassians and derive the interaction numbers i.e theoretical plates.
Now using a model that is well understood and tested the Theoretical Plate model and applying it to a oil field its says the following. If I drill a well into a porous geologic formation and a few wells around it. And first I pump some oil down it then start pumping water. The wells in a circle around the pumped well will get the oil in a Gaussian profile. The main body of the oil has a interaction with its it surroundings thats FIXED!
In the case of a field full of oil this block of oil is moving through a system that has immobile oil as part of its
environment but the behavior is no different. As you begin to produce a field the main driving force is oil pushing oil. Later its water pushing oil but the little Gaussian regions can't move till the ones behind them move.
This is my interpretation of what Fractional_Flow says and he
is also correct its the field geology that determines the peak.
http://europe.theoildrum.com/node/2372#comment-170481
Hubbert chose the logistic and uses the rate to guess the URR. The choice of logistic is interesting and its not clear
in the least its the best and again its not clear that a better one exists given the data we have. Given that we are just doing a taylor expansion the exact shape of the curve are not important whats important or interesting is that HL works when the production is assumed to be a curve.
The examples you have given don't even behave correctly to the first taylor expansion term no wonder they blow up.
I'm only saying you need to use a production profile that can be taylor series expanded about its center point i.e it needs to look like a parabola to apply HL otherwise its junk. I don't need to do anything the work is already done and has been done for some time. You simply need to use a production profile thats reasonably close to what HL assumes.
Next since your generating data if you pick parabolas which are simple you can find one that gives a perfect match then vary the parabolas away from the perfect keeping the area under the curve or URR constant. one to see how much HL varies. Actually you can use any series of parameterized curves. The only restriction is they all have to have the same URR.
Your current work is not even close to being the right way to critique HL.
Until you integrate his work I'm not sure what the heck your doing.
What I am doing is showing case after case in which the HL failed. Do you think it might be too much to ask – given that you continue to insist that it works – for you to show me a case in which it would have worked? Thanks.
Your current work is not even close to being the right way to critique HL.
Show me the “right way.” I don’t really think that’s too much to ask. Show some cases. Plot them. Tell me the parameters that would indicate a peak to you. Don’t keep asking me to show you cases and then denigrate what you are given. Produce something yourself.
HL is reasonable if you produce max possible with regards to your URR, right?
Thats the assumption you childischly refuse to mention.
Your oilsville produces 10/5000 per year (was it?). Thats too low. Max would be 4/400 (or maybe 200 like Saudi, sounds familiar?). This is the most simple way I can put it. Change that in your spreadsheet and tell us what happens?
You sound slightly too closed to allowing other comments into your worldview at the moment. Are you always like that? Hard on debating? Do you ever yield a mm?
HL is reasonable if you produce max possible with regards to your URR, right?
Thats the assumption you childischly refuse to mention.
So, this is your response to "Show me"? You can't show me either. All of these insults and cast aspersions, and nobody can show me a case where the HL would have worked. Why is that?
Your oilsville produces 10/5000 per year (was it?). Thats too low.
How do you know what is too low? You are making unwarranted assumptions. Besides that, this wasn't the only case I modeled. What the case shows is that a flat production case - as Saudi has been for many years - will underpredict URR if production is constrained. Or do you believe that Saudi has been producing flat out for all those years?
You sound slightly too closed to allowing other comments into your worldview at the moment. Are you always like that?
Given that nobody is giving me an counter-examples to show when the HL would have worked and how you would have determined that, right now I have no reason to question my worldview. Show me a case and make me question it. I am quite open-minded, as some posters on the board who actually know me can verify.
Even though I make no claim to following the math, what I've been gleaning from this whole series of exchanges is that Hubbert noticed that the way in which oil fields were drilled and developed in an unconstrained market tended to follow a familiar pattern. He didn't know the URR, but he had enough experience to make an educated guess. That pattern has seemed to fit in other unconstrained markets.
As I see it, we don't have the info to have as good a feel for the URR of KSA, so we've seen modelers fitting the curves as if KSA is unconstrained and choosing from a fairly wide range of possible URRs.
It seems to me what Robert is doing is significantly constraining Oilsville production and then saying that because HL doesn't work in unconstrained markets, it doesn't work at all.
I have not been following this closely so forgive me if someone has already beaten this to death, but the only cases where HL should work, conceptually, are where production is only constrained by physical geology. Where the field or province operators are producing as fast as they can, or responding to smoothly rising demand (the curve shape is supposed to model the reservoir dynamics). We know this is not the case for Texas/lower 48, Saudi Arabia and Russia so I do not see why we should expect it to work there. That's why it also should not work for your thought experiments (above). If world demand rose smoothly and no one withheld production to control prices (or for whatever), we might expect it to work in the aggregate. It is not surprising that such a simple model does not work for such a complex system.
The one example you gave that was even close to reality was giving HL answers that were not too bad.
Define “not too bad.” What you will find is that once again, “not too bad” will span a huge error range.
What you have just wrote says nothing about HL it's basically garbage.
Read what WHT wrote below. He actually understood the point that I am making. Cases, hypothetical or otherwise, can show you how the HL would behave. The flat production case – hypothetical or not – shows how the HL will behave in ANY relatively flat production case (like Saudi). The rising production case shows that it can’t call peak. The rate of rise doesn’t matter. If you did some modeling yourself, you would see that. But you are still insisting that the pink unicorn is there somewhere, while saying I have do “basically garbage” in showing that it doesn’t exist.
If at this point you have some valid arguments I'm interested. I know I'm being a bit harsh but this is bogus and its public.
It’s amazing to me, then, that you won’t produce a case in which it worked. Some recognize modeling for what it is. Some know how to test a model. I do. Show me that you know how, instead of doing all the aspersion casting. Support your own argument. Look again at the last section of the essay.
RR, I think HL only works when the producer is always producing flat out. Since this never happens in real life I guess you are correct that HL can't be used to predict when peak production will occur. I think you have already proved your point.
A simluated version of world production with steady growth (exponential) of 1.5% per year since 1982:
The last 25 years looks quite close to linear. and is a close match of Khebab's HL:
This type of discourse is why I keep coming to TOD.
First, I think Flakmeister raises a good question. What happens when looking at 'true' 60% depletion for the idealized case?
Furthermore, I think a problem with both sides in this argument is that there isn't much of a debate on the larger theoretical reasons for using HL type techniques. The 'Oilsville' example above is a good way to demonstrate how under certain circumstances HL does a poor job in making predictions. The problem, as I see it, is that Oilsville is seemingly divorced from a theoretical understanding of oil field geology and production and so based on unrealistic assumptions.
What I'm getting at is that lost in this debate is 'WHY' we should be using HL or some other technique to model oil field production. Does it fit with our understanding of oil field geology? Above ground production constraints? Both? As I understand the debate as presented here, the HL model and its offspring are models that seem to be good fits with the dynamics believed to be underlying discovery and production. As I understand the scientific method, you start with a theory, derive a hypothesis, and then test the hypothesis against the data. Given what WT has repeatedly argued here, this seems to have been done and so the model, despite its faults, is a good one at present because it couples sound theory with empirical justification. From what I can tell, the only mark against the HL method is that there have been too few data to really test the model rigorously.
This suggests that critiques like the ones presented above by RR are, at best, suggesting that the HL technique needs to be further refined. We can't junk it because we have no alternative to the model that explains as much or more than the current technique.
So, for the critics, what alternative model do you suggest using? What refinements to the current method? That, I think, is the hallmark of a constructive research program. Is there common theoretical or methodological ground the two sides can agree on that can be used to build a better model?
As I understand the scientific method, you start with a theory, derive a hypothesis, and then test the hypothesis against the data. Given what WT has repeatedly argued here, this seems to have been done and so the model, despite its faults, is a good one at present because it couples sound theory with empirical justification.
"Demonstrate any case – real or hypothetical – in which the HL would have predicted a peak in real time."
Still waiting for someone to show me. A model that converges 30 years after peake is not what I have in mind, given that Saudi did not peak 30 years ago.
Robert, you posed the question early on in your post as to whether this debate really matters or not. At this point, I don’t think so. I’ve been on the Oil Drum for more than a year now, and in this time, I’ve seen the general consensus for the time of Peak Oil move closer and closer; there seem to be considerably more people who feel that Peak has either already passed or will occur within the next couple of years.
In light of the fact that any meaningful mitigation attempts will take 10-20 years to develop and show results, it doesn’t seem that it makes much difference if May of ‘05 eventually proves to be the Peak, or if there is a brief upturn in production, and the Peak date ends up sometime in 2010-12. In the context of the time-frames we are dealing with, May of ‘05 and some date in 2012 are, essentially, both NOW.
Antoinetta III 3-22-07
But what about West Texas / Lower 48? North Sea? These seem to me at least the initial validity of trying to refine the HL method.
But, again, what alternative model are you proposing? It's one thing to note another's method is imperfect, another altogether to present a better model.
I guess that's what I'm looking for. By now I think you've raised some real issues with the HL method, but to go beyond this critique something more constructive needs to be offered. Where's the better model? Where's the alternative theoretical understanding of oil field discovery and production?
But, again, what alternative model are you proposing?
It is not necessary for me to propose an alternative model. There may be no model that works.
It's one thing to note another's method is imperfect, another altogether to present a better model.
I am not so much saying that the model is imperfect. What I am saying is that it just doesn't work at all.
Winding down for the night. A few more responses, and then I will be offline until tomorrow.
Robert I think you simply need to go read this whole site.
http://mobjectivist.blogspot.com/
He is basically right I just don't see that his models are giving better results given the known noise in the data.
Gosh Robert. I wish we had thirty years to verify your theory. I guess we have no choice but to wait - either for a complete test of the theory or a new theory.
Umm....Just curious -- will we have to also wait thirty years to test any new theories?
I mean, shouldn't we afford any theory that anyone objects to the same consideration you are willing to give the HL linnearization?
Also, one more thing. Is it okay if we go ahead and start edging towards a sustainable world? Do we have to wait for you and the boys to finish this hair-splitting?
I mean, I really don't want to sully the purity of science, cause we all know how important maintaining the form is, but guys, your argument, your sad, silly, egotistical, and prolonged argument is wasting electrons.
The one thing I do know, the one thing that does not need a formula, or a even a brilliant mind, is the simple, plain, undeniable fact that WE LIVE ON A FINITE SPHERE FLOATING IN SPACE.
I'm sorry. Were my words too sarcastic? Too emotional? Did I hurt anyone's self-esteem? Mea culpa. I wish I could assume the bland face of objectivity. I wish I could peer out at you with the calm even stare of a judge ruling against the poor and claim that the law is clear. I wish I could assume the steady countenance of a Bush appointed EPA official and explain with all the gravitas of the powers that be and rule against the planet in favor of continued economic growth. BUT I CANNOT BE THAT EVIL.
I am willing to shame people, point out the crazy thinking behind sanctioned science formalism. I am willing to get emotional, to use ad hominem attacks, to be rather vicious. Unlike the people who raise hell about patriotism, religion and all the other faked up conceptual horse hockey that festers in the zeitgeist, I raise hell about the one thing we all need. THE GODDAMNED PLANET.
I'm going out to feed the chickens. At least they seem to realize that they belong to a planet, not a theory.
Even as a moderate doomer who believes we are at or past peak, I find that your diatribe seems unfair. I think WesTexas is right in that we are about to experience import crises -- likely one after another IMHO. I also think he's right about when peak oil occurred, but as a real novice in all of this I really haven't got a clue as to whether or not HL is a valid tool for modeling peak oil.
But Robert has said many times that we have a problem and need to prepare NOW. He has repeatedly said that the main reason he wants to nail this is to keep from being dismissed as a kook with another false "end of the world" prediction if he blasts "peak oil" to the world and it turns out to be a false alarm. There is probably ego involved in this too, but frankly, anytime someone invests a lot of their time and energy in a project it becomes a part of them and it's hard not to want to be right. That's being human. And all of the regular diarists on TOD have a lot invested in their peak oil analyses.
For those of us already convinced of peak oil's passing, it's unlikely that Robert's quest for HL proof will change our minds. If that is what it takes for him to feel comfortable raising the red flag, then I say "go for it." I would rather he get to the point of comfort and then speak up than to keep his mouth shut forever because he just doesn't feel sure enough about it. Since he works for an oil company, I'm pretty amazed that he is even willing to consider raising the red flag when everyone else involved in big oil and government seems more inclined to say "everything is fine...just go shopping."
Even as a moderate doomer who believes we are at or past peak, I find that your diatribe seems unfair.
There are a few posters that I can always count on for this. One is TrueKaiser. So, I started at the bottom and started working my way up. Bingo. There were TrueKaiser's shrill comments in which he merely complained and added nothing to the discussion. My expectation was that I would shortly see Cherenkov weighing in with similar shrill rhetoric. I can always count on him to 1). Say nothing; 2). Do it in a shrill manner; and 3). Misrepresent my position while doing so.
I'm sorry. Were my words too sarcastic? Too emotional? Did I hurt anyone's self-esteem? Mea culpa.
I think you take the prize for the person on TOD most puffed up with self-importance. Even as I wrote the essay, I knew that I could count on you to show up – and even though you wouldn’t address any of the math or analysis in the essay – you would feel the need to bestow upon us your words of wisdom. Did you hurt my feelings? I would have to care about your opinion before you could hurt my feelings. Given that I have never gotten any value out of your pompous mutterings, it is not possible for you to hurt my feelings.
I'm going out to feed the chickens. At least they seem to realize that they belong to a planet, not a theory.
Of course your chickens do belong to a theory. It is called the Theory of Evolution. Perhaps you heard of it. Scientific types debated it 150 years ago. And throughout the entire debate, I am sure that they endured the same kind of pompous rhetoric coming from the popcorn stands that you continue to bestow upon us.
What happens when you look at your idealized case at a true 60% depletion? Can the URR be approximated?
I just ran it. If you run to the true 60% depletion mark, which is 516.8 Gbl, the last 10 points forecast a URR of 640 Gbl. So the model is saying the depletion is 517/640, (81% depleted) when it is actually 60%. You have to go out to the true 70-80% mark before it starts to converge to the real URR number.
Interesting. How many runs/variations of the simulation have you run? Establishing a point around which HL effectively becomes a good predictor of ultimate recovery would be a very valuable contribution.
Is there anyway to parameterize the model such that an initial estimate of ultimate recovery can be taken into account?
Very good article,
Do you have any method in which you have confidence, since the HL debate is back in WT's court for the time being.
David
Do you have any method in which you have confidence, since the HL debate is back in WT's court for the time being.
There are some other models, but I haven't really looked at them. I think Stuart's work has a better chance of getting to the heart of the matter. That is, I am not sure modeling is actually going to do it. I think we will have to look at available data, see if their actions are consistent with the market (we are about to have that question answered) and try to make interpretations. It isn't easy, but if it was we would already know the answer.
Very good. That explains why the folks at CERA shake their heads and call linearization "pointless curve-fitting" or somesuch. You've now worked with HL quite a bit, so do you think it is just worthless? Do you think there might be a way it could be modified to be useful? Some method to determine a likely peak date based on production would be extremely useful if it's possible.
I can think of two obvious HL modifications. It's intended to be used on a logistic function - does it come any closer on that? Has anyone attempted to linearize the log of P/Q or come up with a rational higher order equation to model the production curve? It seems like I've seen that somewhere.
I think I'll hold onto my deckchair a little longer, while watching for a spot on a rescue boat...
You've now worked with HL quite a bit, so do you think it is just worthless?
In my opinion, it has no value whatsoever as a predictive tool. As someone else wrote, it is really a descriptive tool after the fact.
Well, that certainly explains Deffeyes' failure to predict the decline in world crude oil production, my failure to predict the decline in Saudi crude oil production, Khebab's failure to predict the decline in Mexican oil production and my failure to predict the 2006 decline in oil exports by the top three net oil exporters.
I have another prediction. In the near future, Robert will admit that Saudi Arabia's recent decline in crude oil production was involuntary, but his admission will be accompanied by the following qualification: "But by God, Jeffrey's methodology was wrong."
Ultimately, these predictions are why the model has a degree of empirical validity.
Methodologically, what is the common ground between you two? Can a better model be constructed out of this debate?
In the near future, Robert will admit that Saudi Arabia's recent decline in crude oil production was involuntary, but his admission will be accompanied by the following qualification: "But by God, Jeffrey's methodology was wrong."
Sounds like a faith-based prediction. Anyway, if you use the HL as the basis for making the prediction of a Saudi peak, yes, that is wrong. It doesn't have the precision to do that. I can tell you that. Stuart can. Khebab can. In fact, I think most people familiar with the HL will tell you that. But you have faith in the technique.
I rest my case regarding what is really going on here.
In any case, lots and lots of real world "coincidences."
I rest my case regarding what is really going on here.
What is going on here, Jeffrey? Something other than a critical look at the ability of the HL to make real-time predictions with any sort of precision?
As I predicted, Saudi oil production started declining at about same stage of depletion at which Texas started declining (based on HL data through 2005). A coincidence?
I have addressed several of these claims before. It is not clear to me why you continue to make this claim, when I showed in my previous essay that it is not remotely true. When Texas peaked it was at 73% of Qt. Not only is Saudi not there, but the 2000 prediction for KSA looked much better than the 2007 prediction. The R-squared was higher in 2000, and it was at a higher % Qt. In recent years, URR for Saudi has grown based on the HL, and % Qt is moving backwards as I documented in this essay.
But, you continue to ignore all of this and repeat the claim "Saudi oil production started declining at about same stage of depletion at which Texas started declining." It just isn't true. You may believe it, and you may have convinced yourself that it is true, but anyone here can plot that data, or look at my essay on Texas, and see that the claim is false. Ask someone else who has plotted the HLs if they believe you are correct. Ask Stuart. Ask Khebab.
That's all from me for today.
Robert,
I never claimed that the Texas data could accurately pick the Texas peak. I did--and still do--claim that the total Texas HL plot can give us an idea of what stage of depletion that Texas peaked. That was and is the basis for using Texas a model for Saudi Arabia: http://static.flickr.com/55/145186318_27a012448e_o.png
I think that we can use the total Texas HL plot as a model for Saudi Arabia.
You say we can't.
Fine.
This pissing contest has no bearing on the cold, hard reality that Saudi Arabia appears to be in terminal decline.
In regard to your "analysis" of the HL method, you have focused on the noisiest of the HL case histories and a contrived model that has no relevance to an actual case history, and you have no explanation for why a method that has "no ability to predict declines" is being successfully used to predict production declines.
Why don't you take a detailed look at the Lower 48 and world HL plots?
In regard to your "analysis" of the HL method, you have focused on the noisiest of the HL case histories and a contrived model that has no relevance to an actual case history
I am not sure why you need to wrap the analyses of the actual case histories of Texas and Saudi in scare quotes. I am also not sure why you don't understand that a contrived case history can show how a model would work under particular circumstances.
and you have no explanation for why a method that has "no ability to predict declines" is being successfully used to predict production declines.
I suggest you re-read my analysis of Texas where I showed it predicting a false peak 16 years too early. So I do have an explanation.
Why don't you take a detailed look at the Lower 48 and world HL plots?
I am starting to wonder why you don't. You keep asserting that these histories worked. Show me. Tell me how you would have made the determination in the case of the Lower 48. I think once again, we will see that you are merely using a benefit of hindsight that you don't have with Saudi. I am sure you could predict the winners of the last 20 Superbowls, but I don't think that will help you predict the winner of the next one.
I see arrogance, pigheadedness and perhaps even childishness on both sides of this argument. This is not what I've come to expect from Robert, Jeffrey and The Oil Drum.
I see nothing wrong with encouraging people to prepare now - whatever the impetus.
The only reason I can fathom why people would be dissuading others from preparedness would be *faith* in the growth paradigm.
-----------
Ask Dr. Bartlett what time it is...
I agree. See my final comment below.
Preprinted Version of M. King Hubbert’s 1956 Speech:
Figure (1) Lower 48 HL Through 1970:
http://static.flickr.com/49/108477614_b15aab378c_o.png
Figure (2) Lower 48 Post-1970 Predicted Versus Actual:
http://static.flickr.com/43/108482206_8769d44c1c_o.png
Published on 24 May 2006 by GraphOilogy. Archived on 25 May 2006.
Texas and US Lower 48 oil production as a model for Saudi Arabia and the world
http://www.energybulletin.net/16459.html
by Jeffrey J. Brown & "Khebab"
Hubbert predicted, based on quantitative modeling, that the Lower 48 would peak in 1966, if URR were 150 Gb, and in 1971, if URR were 200 Gb. The larger estimate appears to be more accurate.
Khebab generated a predicted Lower 48 production curve, using only the HL data through 1970 (Figure #1). The post-1970 Lower 48 cumulative production was 99% of what the HL model predicted it would be (red curve on Figure #2).
The Texas HL plot is clearly noisy, but I think that the point I made in the Texas/Lower 48 article is valid, to-wit, the overall Texas HL plot can give us an idea of where the peak was.
I did ask Khebab to run some estimates for me regarding Texas:
In other words, the stable linear data prior to the Texas peak, excluding the rapid increase in production provided us with a reasonably accurate estimate of Probable URR. The 1958-1972 estimate, which includes the pre-peak runup in production, was wildly wrong.
Note that Texas is the noisiest of the HL plots that we looked at the Texas/Lower 48 article, but based on the Texas case history, the 150 Gb Qt estimate for Saudi Arabia (excluding the recent runup in production, the infamous "dogleg") is probably more accurate than the 186 Gb Qt estimate.
I would particularly call your attention to the following two HL plots. See any similarities?
Lower 48:
http://static.flickr.com/45/145149304_a4a72211e6_o.png
World:
http://static.flickr.com/54/145149301_b930ef7bc4_o.png
Deffeyes predicted a decline in world crude oil production, using the HL method, and crude oil production is declining.
I predicted a decline in Saudi crude oil production, using the HL method, and crude oil production is declining.
Khebab predicted a decline in Mexican crude oil production, using the HL method, and crude oil production is declining.
The North Sea decline in crude oil production precisely fits the HL model, and the post-1984 cumulative Russian production, through 2004, was 95% of what the HL model predicted it would be, using only data through 1984 to generate the model.
It’s a virtual certainty that 14 out of 14 of the fields that are or were producing one mbpd or more are in decline or crashing.
IMO, we are now entering Phase Two of the bidding wars for declining world oil exports, where we will be bidding against China and the EU, instead of against regions like Africa.
It’s hard for me to imagine a bigger waste of time than arguing over how accurate a mathematical model is for predicting production declines, even as crude oil production in large producing regions and the world is declining as predicted--and more importantly, as net oil exports are declining, as I predicted, faster than overall crude oil production is declining. From the point of view of oil importers, I predict that the gradual decline in world crude oil production will look more like a production crash. IMO, you need to be thinking very hard about how you are going to feed your family.
Way to go, Jeffrey. If you can't provide a reasoned response, at least we can always count on some hysterics.
He's made a reasoned response before, to wit, we'll find out for sure in a couple of months. KSA is obviously declining, but RR and Mearns have taken the stand that it was voluntary. It'll be obvious what's happening in a short period of time.
Analogies, like mathematical models, are helpful tools for understanding complex systems and information, but they are not reality.
If one forces an analogy to far, like this overlong Titanic piece, it begins to fall apart and lurch into the absurd. The analogy slides from being useful and helping understanding, into something so which is clumsy and actually self-defeating when carried to extremes, like this gross Titanic analogy.
An analogy needs to be relatively short and succinct to have maximum effect and meaning, otherwise one might as well drop the analogy altogether and just say what one means!
Often, one can become so enamoured with brilliance of ones spectacular analogy that the thing takes on a life of its own, regardless of how foolish a calm examination of the analogy's content makes one appear.
Hubbert's models are only a model after all. Of course they won't fit reality perfectly especially as they are predictive. I always take all models and statistics with a large grain of salt. One can do all manner of wonderful tricks with numbers that actually tell us very little about "reality".
None the less models can and do help our understanding of complex information.
Was Hubbert a prophet? No, he wasn't. However, in some respects he appears to fit the role of prophet, which would probably have appalled him. He was a man with a mission, a lone voice crying in the wilderness, with a potentially terrible message about the end of the world as we know it.
Given the timescales we are opperating with in relation to Peak Oil and the consequences of not taking mitigating action in time, a decade here or a decade here really doesn't make that much difference in the great scheme of things. We need to reduce our consumption of energy as a priority and we should have started on this years ago, even the Hirsch report is clear about this.
I agree with Simmons that we are going to see a substantial gap developing between supply and demand in the near future, with all that this implies. Anyway the next few years are going to sort things out one way or another in relation to Hubbert's accuracy, though by then the result may only be of academic interest.
Often, one can become so enamoured with brilliance of ones spectacular analogy that the thing takes on a life of its own, regardless of how foolish a calm examination of the analogy's content makes one appear.
Nate, on the other hand, liked it. You know what they say about pleasing all the people all the time.
I agree with Simmons that we are going to see a substantial gap developing between supply and demand in the near future, with all that this implies.
I have stated the same on numerous occasions. This is the basis of my Peak Lite argument.
Anyway, for someone worried about overly long analogies, you sure wrote a lot of words without making much of a point.
Dear RR,
I admire the work you do here. I think you're correct to question many of the assumptions we make here. But you don't really need to get so touchy because I think you went overboard on the Titanic analogy. It wasn't meant to be a personal attack on you. Would it help if I said that I think you're a really clever guy with a lot to offer this site?
Would it help if I said that I think you're a really clever guy with a lot to offer this site?
I am not looking for praise. But I prefer that criticism be constructive.
I think I was being not only constructive but helpful as well in relation to your writing style; one shouldn't overdo a metaphore or an anlalogy. It's best to put the breaks on before one goes too far with these things as they have there limits. One could risk spending hours talking about the Titanic instead of something more relevant, and then suddenly find that the whole discussion fall flat because the historical facts don't actually support many of the details in ones analogy. Analogies have their place, but one does risk reducing complex arguments to absurd levels if one pushes things too far and I'm not sure how far that helps one to communicate and spread the message.
I do admit that an overly wordy criticism about the analogy being overly wordy was brilliant.
"I do admit that an overly wordy criticism about the analogy being overly wordy was brilliant."
Hey, when did any of us ever worry about being overly wordy! :-)
(oh, oh, could we have possibly hit peak wordiness?)
RC
Remember, we are only one cubic mile from freedom
Westexas, you clearly know which tool to use, how to use it and when to use it. You demonstrate an innate ability to see the shape of things, whose form eludes the vision of others not so gifted. I look forward to your columns.
Westexas, you clearly know which tool to use, how to use it and when to use it. You demonstrate an innate ability to see the shape of things, whose form eludes the vision of others not so gifted.
"The faith-based proponents were praised by their followers for maintaining faith in the face of these challenges."
Wow, no kidding. Seems like we've got a nice little cult brewing. Good articles; looks like the emperor has no clothes.
That's right, cornucopians rejoice - oh Peak Oil/Energy Descent is NO LONGER going to occur because the HL method doesn't work, right? Hubbert, WestTexas, you guys are just sooo lucky with your predictions! Look, HL doesn't even have to exist to see the obvious - that resource limits are being hit right now, across the board - and that WestTexas and others will be proven right whether it's in 6 months or 3 years. That's the scary part - the earth is metaphorically pissed, and it's payback time for homo sapien sapien, man the doubly myopic.
I forgot to mention that the faithful will sometimes speak in tongues when unable to generate an actual rebuttal of the data.
RR
Have you been reading NAFTA documents lately? I forgot to mention in my comment about that practice, that besides 'speaking in tongues', reading it also tends to make one denigrate one's opposition and use phrases like 'The faithful'.
By the way exactly what is the time that the 'spaceship life boat' will arrive to save those with the correct 'lottery' timing of this game.?
How about in the meantime we send a few S.O.S.'s with the message, "we are sinking pretty soon don't know exactly when, but bring life rings cause we don't like the water and don't really want to learn how to swim"
Robert again you need to back up and cool down.
First WT is not the HL modeler is is interpreting the models. If you ever really prove HL is wrong then his interpretation is wrong by default. Better if you do a decent analysis we may find parts of WT statements that are unsound or wrong at the moment we know nothing.
At the moment your way way off base.
We know of several cases where HL seems to work well and we also know of one big case where it is probably not working Russia.
Next if you don't like these models fine. I given you a link to another model that models a very similar problem and it works very well.
http://openchemist.net/chemistry/chromatography/node8.php
Your claim of no possible model flies in the face of the ability to create a simple model such is this for a very similar physical problem.
A oil field could be considered overloaded chromatographic column if you wish and there exists studies of this condition. Although its the wrong model since it deals with low concentrations. I'm only pointing out that a simple model for a similar complex process exists so your statement that one might not be possible is probably not true.
And one more time you need to read this.
http://mobjectivist.blogspot.com/
The fact your not even looking at previous work bothers me.
Hello Robert,
Or, to rephrase it (which I'd like to do because I'm interested in what everyone says here...and I think it matters)
re: "And one more time you need to read this."
Could you possibly take the time to look up this reference, think it over and get back to us?
The fact your not even looking at previous work bothers me.
That's the problem with your conclusion-jumping: It leads you to incorrect conclusions. Why would you make that assumption? Of course I read that. In fact, I had read it before.
Now, the fact that you won't attempt to show me a time that the HL ever worked - while continuing to insist that it must - bothers me. I think your particular issues would resolve themselves if you would attempt to do so.
Ok how come you did not do a case where it does work ?
Even the logistic curve itself. Or a Gaussian its pretty much the universal starting point. No one is going to argue about assuming a Gaussian distribution at least initially.
Its not hard to show where HL fails. Russia is obvious.
And you have this post.
http://www.theoildrum.com/story/2006/1/8/25235/83999
It's trivial to show a Gaussian works better than HL.
Now with the error in our data its not clear if the better fit adds any real information same with the shock model.
If anyone of these methods say you may be close to peak and the bottom up approach points to the same conclusion your safe to assume your at peak. For the use cases we have it seems good enough.
You did none of this instead you posted contrived examples.
And you have claimed maybe no model works without even presenting them or offering one shred of proof.
Ok how come you did not do a case where it does work ?
You aren’t listening. I haven’t found a case where it does work! Show me one. How many times must I log this request?
And you have claimed maybe no model works without even presenting them or offering one shred of proof.
What I have said is that you can’t always be sure of having a working model. Sometimes you just don’t have enough information to develop a working model. We don’t have working models for many phenomena. So you need to get it through your head that because Model A doesn’t work, I must present working Model B before we abandon Model A. A non-working model is no better than no model at all. In fact, it is probably worse because it can provide a false sense of confidence in the garbage results it is spitting out.
Robert all you have done is succeeded in completely discrediting yourself. You dug your own hole its up to you to get out of it. The fact you can't even see what you have done makes me doubt you can.
If you ever wake up I'd be happy to talk with you. If some people want to believe you thats fine but its a faith based argument.
I'm sorry to be harsh.
I'm done posting I've said what I have to say.
> Why would you make that assumption? Of course I read that.
Get off your high horse. Of course everyone is making EXACTLY that assumption, because you still can't be bothered to reference the work at Mobjectivist's site. Been around for years now, it has.
Someone had some arguments in your last HL thread explaining why references weren't important or necessary, and they were ridiculous.
However, good job re-inventing the wheel. A little arrogance is fine for the peak oil movement in general, to match up with the likes of Lynch and so on.
Of course everyone is making EXACTLY that assumption, because you still can't be bothered to reference the work at Mobjectivist's site.
Um, hasn't this ground been covered?
http://www.theoildrum.com/node/2357#comment-168349
There is a little back history here, moreso involving Staniford. I think I merged you both together unfairly. I'll post again tonight, to highlight some of the issues I have seen, and I'll be keeping my temper in check.
Overall I was unfair in that I kind of lumped two seperate people in one post, and I'll clarify a bit later tonight.
Perhaps if you continue having problems keeping your temper in check, you might count to 10 before hitting the "Post Comment" button. While I appreciate your concerns that everyone who ever said “HL” is referenced, I don’t think this is practical. I did not use Mobjectivist's work in building my case. I did not rely on his work to plot any of my HLs. It is beyond me why you think I must reference his work. If your complaint was universally addressed, I could probably tack on 50 more references to each of my essays.
And of course here was the "ridiculous explanation" by Pitt the Elder:
There are compelling reasons why peer-reviewed papers have extensive bibliographies, such as attribution of merit for purposes of funding and promotion.
TOD has no such profession-related reasons, and hence RR had no need to cite other posters to attribute professional merit.
Moreover, not all mentions of a topic are cited - to do so would leave no time for doing research. So even in scientific journal papers, one makes judgements about which references to include. One important criterion is whether inclusion of the reference will help the reader, giving insight into the argument you're presenting by showing background work.
RR did not rely on reader knowledge of prior challenges to HL in presenting his argument; hence, there was no need for him to cite such previous challenges for the purposes of exposition.
In other words, the two main reasons for citations in scientific publications did not apply to RR's article, and complaints about how he should have cited certain posters are unfounded.
So, get off your own high horse and stop making ludicrous demands. If you personally have something of value to add here, now might be the time to do it.
However, good job re-inventing the wheel.
Good job re-inventing the same objections that were already addressed.
> I could probably tack on 50 more references to each of my essays.
Sure, there are n references possible for any essay one writes. But we are talking about criticism of HL. How many people - - in the world - - are doing this in a transparent and reproducible way? At least two other people right at arms length. And that might be the complete set. True, it is up to you whether to acknowledge them.
I notice you spent some energy gathering references and quotes on me. Good job with that. Notice how easy it was? That really exhibits the power, and the community, of blogging right there. That is why Pitt's comments were irrelevant and ridiculous. Guess what - - it is true. The oil drum is not a scientific journal. So what? Here is how one MIGHT reference prior work in a tightly bounded area:
"Also, if you are interested in reading more on this topic person X had this take on the subject, using different methods but coming to a similar conclusion"
But that would be ludicrous. That is too much to ask. So let's get back to the insults. On second thought - no - I regret the personal insults and I can change my behaviour and avoid them in the future.
Robert,
you asked if you left your model choices to small. Simple answer is yes and no.
Also my book The Sinking of the Titanic and Great Sea Disasters (Thrilling Stories of Survivors with photographs and sketches) C 1912.. Says that it sunk in 2.5 hours. Uh oh what does this new data do to your model. Only thirty off now for the Faith based. LOL.
Also this piece of information was withheld from the press and many passengers it seems. from my book....
"unknown to the passengers, the Titanic was on fire from the day she sailed from Southampton. Her officers and crew knew it, for they had fought the fire for days..
This story, told for the first time by the survivors of the crew, was only one of many thrilling tales of the fatefull first voyage"
J. Dilley., fireman on the Titanic :
I was assigned to the Titanic from the Oceanic, where I had served as a fireman. From the day we sailed the Titanic was on fire, and my sole duty, together with eleven other men, had been to fight that fire. We made no headway against it. The fire started in Bunker no 6....
and it goes on with a description how they fought the fire 12 men 4 at a time from the day they sailed until they hit the berg.
Lack of important info like in the oil analysis makes all theories on each side, just that.
You mention faith based and science in the same sentence and I always wonder about that. Because your science for all you know is perhaps only faith based. You have faith that what you have learned is the correct procedure.
Take Maxwell's equations and who, when, and what the evidence seems to have left out. There was some other "work" he did which is left out his story and life.
That's all there is "they" say, those equations say it all.. Our physical models of the universe are all based on them.
Of course most people aren't aware of how Maxwell's equations where finally published, and Maxwell's thoughts on "faith" and the universe. How he viewed the "ether" and what it held. The great minds of that day combined a sense of faith in their "thoughts" and how math and the world could be explained. They weren't "church going types" they were very spiritual though in their views of the universe. Maxwell wrote poetry that spoke of math and the universe and its telling of his views.
Here is a follow up paper on a peculiar statistical model. I dare think any of you have ever seen.
http://www.angelfire.com/ca3/citystars/
It's about a controversial theory and controversial proponent of another theory of the Universe etc. I am not promoting him or his theory. The paper and the statistics stand on their own. If she is wrong I suspect she would like to know. She has taken a ton of heat over this from her first paper, which had a different conclusion, amd here she admits to it, and offers a revised paper and startling conclusion.
Quid Clarius Astris
Ubi Bene ibi patria
PrisonerX
You mentioned "You have faith that what you have learned is the correct procedure"
Thank you for mentioning this. It is something that I have been thinking about for a while and trying to formulate in my mind.
Everything ultimately boils down to faith. People have faith that their calculations are correct. People have faith that the data they gathered is correct. People have faith that what their professors taught them is correct. People have faith that their memory serves them correctly. People have faith that Aristotle or Plato or whoever, said what they said. People have faith that their excel graphs are doing what they thing they are doing. Etc etc etc. In the end I think much of what we think is proof or fact or knowledge has at it's base faith.
People have faith that their calculations are correct.
I can have all the faith in the world that 2 + 2 = 5, but it is easy to demonstrate that this faith is misplaced. Such is the case with many arguments, and those are not faith-based. If I assert that Saudi will peak in 3 years, and only search for data to reinforce that conclusion, then I am veering into faith and away from science.
Maybe the calculation wasn't the best example, but I am sure at some point, you have had a math problem complex enough where you said "I think that is right".
You wrote:
"To calculate cumulative production prior to 1960, I assumed an average of 30,000 bpd from 1938 through 1945, and then an average of 250,000 bpd until 1950, and finally an average of 750,000 bpd from 1950 to 1960. There may be an actual cumulative number available, but I haven’t found it. Regardless, later production rates are high enough that even if we assumed no production prior to 1950, it would have minimal effect on the results. But based on my assumptions, I calculated a total of 3.2 billion barrels produced in Saudi Arabia before 1960"
So I will ask this: what is the difference between assumptions and faith?
You were not there in SA from the 1930's to the 1950's measuring every drop of oil that was taken out to the ground and recording it. So how do you KNOW that those numbers are even remotely close? You assume or accept on faith that they are. Thus your finaly conclusion and opinion is still based on assumptions/faith.
When you were in college and a professor taught you something, did you go and immediately research every fact or point he taught you? and when you read something that confirmed what he just taught you, did you go and research that point? continually going back and proving everything that your read and learned? Or did you accept on faith until such point that you could prove it, that it was correct?
That is my point. I think that scientist still have an element of faith even though they will not admit it. They like to profess everything is empirical and data and fact driven but it isn't.
My apologies, I know there are probably some weaknesses in my arguement, but I am writing this off the top of my head as I haven't had time to really sit down and reason through it all.
Flame away :)
So I will ask this: what is the difference between assumptions and faith?
Assumptions can be tested. My assumptions were grounded in reality. That is why, when I received e-mails that showed the actual Saudi production prior to 1960, my assumptions were very close to the official numbers.
So how do you KNOW that those numbers are even remotely close?
This looks like one of those "how do we really know anything" arguments. Not interested in that. If you have some evidence that faith in the HL is warranted, or that somehow the "faith" I have used to construct my argument is invalid, by all means let's have it.
First let me say thank you for the dialogue. I do respect your contributions.
Second, I am not talking about HL. I am in no position to do so, I am not a geologist or math type by far.
My point is about what seems to be an implied statement that everything you do is based upon data and fact and faith is in no way a part of your conclusions.
If you owned your own oil field, you could go out and measure what you took out of the ground. Then you would KNOW what the truth was.
When someone emails you production data, you did not measure, you acccepted on faith that it is true.
See the difference? On one oil field you will know the data is true for you ultimate conclusions, the other you are accepting on faith that your conclusions are true.
This is not the point Robert. You also ignore the example I gave you. Are you claiming Robert that the example I gave you is intentionally this way. Then you must tell me how. This person is making mia culpa here because she did it wrong, and admits to it.
Now the numbers say NASA launches when certain things are in alignment and it is not random, but directed.
Now you surely must agree or disagree and that would or would not be your position. If you say the methodology used is incorrect then say how, if you wish to say its still a "coincidence" then that doesn't follow your believe in modeling. More of "faith based" belief.
I find it interesting you chose the example you did, and the example I give is of "star" based choices having an effect on the most scientific program the US ever attempted.
funny huh.
Quid Clarius Astris
Ubi Bene ibi patria
"not everything that can be counted counts."
"The only real valuable thing is intuition."
-Albert Einstein
Hubbert Linearization is modelling economic activity. In the hands of skilled and intuitive people, it has an impressive and expanding track record as a predictive tool.
Here is a description of economic models from Wikipedia, which might be instructive:
"In general terms, economic models have two functions: first as a simplification of and abstraction from observed data, and second as a means of selection of data based on a paradigm of econometric study.
"Simplification is particularly important for economics given the enormous complexity of economic processes. This complexity can be attributed to the diversity of factors that determine economic activity; these factors include: individual and cooperative decision processes, resource limitations, environmental and geographical constraints, institutional and legal requirements and purely random fluctuations. Economists therefore must make a reasoned choice of which variables and which relationships between these variables are relevant and which ways of analyzing and presenting this information are useful.
"Selection is important because the nature of an economic model will often determine what facts will be looked at, and how they will be compiled."
Hubbert Linearization is modelling economic activity. In the hands of skilled and intuitive people, it has an impressive and expanding track record as a predictive tool.
Yeah, you know people keep saying that. It is just that nobody will actually provide an example of when it worked and what the parameters were that indicated that it was working. That is why it is a faith-based model as a predictive tool. You have faith that it works, but can't give any actual examples of this "impressive and expanding track record as a predictive tool." You are merely kidding yourself. If you want to demonstrate that you aren't, show me.
WT - great post (excepting the last paragraph, which was self-defeating :-)
I had not appreciated the point that the HL can predict URR more accurately _pre-peak_ than it does post peak!
I have seen many references and allusions to the "Export Land" model, and I think I get the gist of it, but is there a posting where you describe it in detail? I think I joined up after you proposed it.
Thanks.
CW
Global peak: 2007 - 2010
Global decline rate, Post peak: 2%
Economic response: Severe global recession, ~5 years, then slow recovery
I had not appreciated the point that the HL can predict URR more accurately _pre-peak_ than it does post peak!
Well, it can't. It wanders around. You can't pick a point 30 years after the fact and say "Aha. It was correct at that point." Then how do you know at which point you are at on the Saudi curve?
The other point is that the rising production case shows that peak can't actually be predicted prior to production actually turning downward.
Not quite.
The point is the HL model presupposes a shape of an underlying production curve, which is roughly reasonable, but very simplified.
If production doesn't well match that curve then the HL, which in effect is estimating underlying parameters of that Ansatz, will obviously give a meaningless answer.
If the production does match the underlying assumption, then you can indeed estimate the peak before it happens, you need only see the second derivative decline before the first.
The KSA HL chart including data through 2007 is interesting. The dogleg could be turning down. Let's see what it looks like over the next three quarters.
I would particularly call your attention to the following two HL plots. See any similarities?
World:
http://static.flickr.com/54/145149301_b930ef7bc4_o.png
I see the similarity: world oil production, growth averaging ~1.2% annually since 1982; and figure 5: 1% growth for twenty years.
Great article Robert.
For the great majority of posts this site shuns criticism or personal attacks. Technical and learned information is presented by highly intelligent people that make TOD for the most part a very stimulating and intellectual part of my day. It also allows me to understand much of what is really going on in the world. So ladies & gentlemen, I thank you; and salute you.
This goes to the heart of the matter. What is abundantly clear is that global knowledge and understanding of this issue is too imprecise to predict exact production in a month, a year, or even 5 years. At the same time there are probaly few on this site who believe current or increased production, or equivalent substitution, will be possible in 10 years. We have even less knowledge about how the markets will react. So far they have been (as predicted) non-sensical. We think prices will trend upwards, but we have no idea by how much or how fast. PO is essentially a risk management problem (Hirsch, 2005) at a personal, community and national level.
How 2007 (maybe how every year going forward) plays out is significant. Following the recent great discussion on Saudi between Stuart and Euan we will see what happens over the next few months. Stocks have been wound down by the US that the DOE no doubt will want to rebuild. China and India have both announced they intend to build strategic stocks. The next few months will reveal whether normal consumption can be maintained without stock drawdowns. Or wether Saudi can "turn on the spigots" as they like to say in the press and life can continue as "normal".
On a personal level I have being crying "Wolf" for a year now. Nobody listens, or cares.
The Role of Oil Companies in Post-Peak Regions
For the purposes of this discussion, crude oil = crude + condensate.
The Lower 48 and the North Sea started showing a strong linear pattern on their crude oil HL plots in 1954 and 1988, respectively. The Lower 48 peaked in 1970, the North Sea, in 1999.
The HL data from 1954 to 1970 and from 1988 to 1999 are consistent with the respective post-peak HL data for the Lower 48 and North Sea.
The Lower 48 crossed the 50% of Qt mark in 1970, the North Sea, in 1999. The post-1970 cumulative Lower 48 crude oil production through 2004 was 99% of what the HL model predicted it would be--using production data from 1954 to 1970 to generate the HL model.
Interestingly enough, according to Matt Simmons, the major oil companies working the North Sea in 1999 were predicting that the North Sea peak was at least a decade away. Sound familiar?
There were no material restrictions on drilling in either region (minor, but not material restrictions in the case of the Lower 48), and both regions were developed by private companies.
Despite the best efforts of private companies using the best available technology, the Lower 48 and the North Sea have both shown long term declines since peaking. Empirically, the role of oil companies in these two post-peak regions has been to slow the rate of decline of conventional crude oil production.
In my opinion, major oil companies are deeply threatened by mathematical models like the HL method, as applied to world crude oil production, because it suggests that they probably can’t replace conventional crude oil reserves, and they are (justifiably) deeply concerned about punitive taxation. I thought it was interesting that Matt Simmons said that he did not own any major oil company stocks, because they probably could not replace their conventional crude oil reserves (he is focusing on service companies and smaller oil companies).
The world started showing a strong linear pattern in 1983, and on Deffeyes' crude oil HL plot, the world crossed the 50% of Qt mark in 2005. Deffeyes predicted that the most likely year for a world crude oil decline was 2006, within a predicted peak range of 2004 to 2008. As Deffeyes predicted, world crude oil production declined in 2006, relative to 2005 (EIA).
So, the Lower 48, the North Sea and the world all started showing lower crude oil production after crossing their respective 50% of Qt marks.
Empirically, in the absence of constraints on production, e.g., Texas and Saudi Arabia, regions tend to peak in the vicinity of 50% of Qt.
I can’t get inside Robert’s head, so I will assume that he is simply trying understand the HL method, rather than attacking the HL method because of the unpleasant implications it has for major oil companies.
But I do have a couple of questions for Robert.
MarkL:
While there may be nothing wrong with encouraging people to prepare now, Robert has provided an extremely thorough, scientific analysis of where the model falls flat.
There are many repercussions for this. For one, as someone else pointed out, CERA will always use the HL method to point to Peak Oilers and say, "the model doesn't work!" And, well, if you read Robert's analysis, that's precisely what he's saying.
You can continue down a self righteous path believing in the faith of HL without testing it strongly, and at each step of the way your critics will attempt to diminish you and whittle you away.
Otherwise, you can accept that the model is flawed, that its predictive abilities are weak, and work to generate a stronger theory and methodology. That's the way to win.
Much the same happened in the climate study debate. For years many of the proponents of climate change argued based on models that simply fell flat when tested rigorously. Critics had a field day poking holes in the theories. However, in recent years as more knowledge and tehcnology have accumulated and better models have been developed and tested positively, the scientific community by and large has come around in agreement.
I am in Robert's camp: with such poor data and bad predictive capabilities, one should be very skeptical of an HL of Saudi Arabia. Build a better model to test.
This is probably one of the worst posts I've ever seen.
I'm sorry you feel that its correct. In reality its a fatally flawed analysis. Robert posting junk like this has done a lot of damage.
Robert posting junk like this has done a lot of damage.
To faith-based forecasting. Yes. A model that makes one false prediction after another warrants being damaged. If you want to salvage the damage, show me where it works. Show us how to use it, instead of continuing to insist that it does. Assertions are not evidence.
Again Robert you have said that someone with credentials in science has done a shabby job of interpreting data. You did not respond. Why Robert. Its a few minutes read, and she gives you access to everything you need to back up here conclusion. Whats the problem the outcome doesn't fit your model so it must be wrong. Its about something that can't be right.
Wrong Robert, and you also say that you can make 2+2=5 when you wish to.
So I must ask someone that is posting here on "faith" that they are here to help, and not work in a sly way for the oil companies this. If you are so good at what you do, why do you ignore what I posted since it challenges you. Why should we believe if your so good why this paper is correct and you can so easily manipulate people with your skills that you can make 2+2=5 when you want that this paper is also a "trick" to manipulate people.
You're here on a faith based assumption Robert. Or did you forget that, or just wish that it be ignored when you post.
After this, I will not give you the benefit of the doubt which you have asked for on several occasions when the question is raised why would an oil company let you post here is brought up.
Again Robert, if you believe that correct procedure tells the story, explain why a person with credentials I suspect that are much better than yours is trying to manipulate people, and on a subject that is "dangerous".
Say Robert, why don't you go take a look at shuttle launches and see if it holds too. Wouldn't that be something. I mean its just another coincidence for the umpteenth time, but you have faith or is it something else that keeps your mind from accepting the real "data".
Quid Clarius Astris
Ubi Bene ibi patria
I see arrogance, pigheadedness and perhaps even childishness on both sides of this argument. This is not what I've come to expect from Robert, Jeffrey and The Oil Drum.
What you got here was a critical analysis of one of the models that has been used to tell us that Saudi has peaked. I am sorry that does not meet your expectations.
The only reason I can fathom why people would be dissuading others from preparedness would be *faith* in the growth paradigm.
I think if I had it tattooed on my forehead, emblazoned on a t-shirt in fluorescent letters, and I had a signature that read FOR GOD'S SAKE PEOPLE, WE MUST PREPARE FOR PEAK OIL NOW!!!!!!!, someone would still ask “Why don’t you think we should start preparing now for peak oil?” Ignorance is one thing. Those kind of questions at this point rise to the level of willful ignorance.
Yes, the analysis was worthy, the analogy wasn't.
Prepare now? Not two hours from now, not four?
Are we done with the analysis of the analysis? It's all good stuff but I think we have better things to do with our time. We'll find out what's what soon enough.
Section from TOD Mission: "What can be expected to happen as this crisis develops and unfolds? Stick around, because that's the kind of stuff we're talking about."
Are you guys afraid to talk about financials, geopolitics, human nature?
MarkL
They do get discussed on TOD.
Robert, I think "FOR GOD'S SAKE PEOPLE, WE MUST PREPARE FOR PEAK OIL NOW!!!!!!!" should be in a larger font and should be blinking in the top colors of our national warning system. :-)
Seriously, it is amazing how many times this question comes up. It almost seems as if some folks ass-u-me that you don't consider preparation essential regardless of the actual date of peak.
Excellent work RR - especially the lifeboat/timing example, written in true darwinian pit bull style.
To me, hubbert linearization is a mathematical attempt at quantifying thermodynamics/best first principles. Implicit in this view is the second half of an oil region (or any natural resource) is harder to get at and requires more energy and effort to extract and there is a point where you cross the energetic break even level. I dont need HL to tell me this is true.
The relevant question (as you suggested) isnt so much 'does HL work'?, but is there any plausible reason to expect that the 50 or so countries that appear to have peaked (including and especially the US) to resurrect and surpass their prior peaks?
In other words, at what point, if ever, can one look at production data and say 'this country has peaked...forever'?
Nate the more relevant question to ask might be "could production ever rise again" - whereby you find more oil, and bring on production that is in excess of underlying decline.
For the US the answer to that question is maybe.
well that wouldnt be enough, with growing population and demand.
But that is the crux of it. The EIA forecasts growth in US production until 2016 after which decline sets in. This being a bold prediction given 30 years of declines.
That statement should make the scientists who developed the math behind thermodynamics and statistical mechanics roll over in their grave. As RR has shown, no one has come close to proving HL as anything more than an empirical fit. In scientific circles, they refer to such models as "cheap heuristics". Usually the "cheap" adjective means inexpensive to calculate, but in this case, I would also add that we collectively are too cheap and chintzy to spend any more time and effort on the mathematics behind the problem to come up with something better.
And this is where we come to a cross-roads. Unlike other research disciplines, the brains working behind the oil industry realize that it wouldn't be in their best interests to come up with accurate oil depletion models. So they tell their researchers not to work on this stuff (or they keep it wayyyy in the back-room with the financial/stock market gurus). What's left is a rag-tag collection of amateurs, academics, and oil industry mavericks who hang out here at TOD. Of course, we don't have the funds so we will have to work together and create a collective intelligence that is somehow greater than the sum of our parts to get a handle on something beyond rank empiricism.
Myself, I think it is unfortunate that we rely too much on HL. I bet that Hubbert used graph paper and a slide rule to come up with his model fits and predictions. Anything more complicated than a Logistic curve would have taken him forever to calculate. If nothing else, I firmly believe we are way past that stage and we need to attack the problem with something better than a model that people use just because it is convenient to solve!
Your right but before we can be comfortable with a simulation we need ballpark analytical methods and understand where they fail. This provides the "faith" in the simulation. Today of course in a lot of areas we are comfortable attacking many problems with pure simulation bit it took a while to get there
and a lot of money as you noted.
You have many comparisons on your web site so you have looked at this. Its just its still not obvious that the cheap analytical methods are not good enough for our needs.
Maybe you simply have too much information in to many short papers if you posted a summary here and on your site that might make it easier to get a handle on what your proposing and why the "cheap" models don't work. I think you need to keep one cheap model around since it probably works most of the time so you can show where it does not work.
Also can you put a quick link to the models you have for the USA world and KSA I've seen you post these and they are buried in your blog I've not seen Russia is it there ?
This is just a ease of use issue.
Great work btw.
Here is Russia (aka FSU):
http://mobjectivist.blogspot.com/2005/11/fsu-oil-shock-model.html
I believe that that the collapse of the Former Soviet Union had a big part in the dynamics after the 1988 time frame.
THANKS!
So the oil shock is showing a sharp peak. The HL prediction would only work if this was the case. Whats important is that we cannot expect to see much of a plateau in the Russian production profile in retrospect this makes sense since they where already declining/peaked at some point the will get "back on curve". Considering above ground factors in Russia
such as lack of investment and technical challenges and WT export land model we can be pretty sure that they will be unable to mount a massive drilling campaign to offset this peak.
I thought the oil shock model would be very useful for Russia and so it is.
Can you put links to your oil shock analysis of regions on your front page finding stuff is a pita.
THANKS AGAIN !!!!
IMO, Conditions for the HL to work:
1. an unimodal unconstrained production profile
2. the growth rate has to exhibit a somewhat linear behavior with respect to the cumulative production Q (i.e. (dP/dt)/P ~ K(Reserves - Q)/Qt).
now, those are pretty stringent conditions! you can design an infinity of curves that would not meet these requirements.
The case of a constant production (square production profile) illustrated in you first example is a particular good case of a constrained production where the HL will always fail because we are basically trying to fit a straight line on a portion of a 1/x curve that has an infinite URR!
The HL should never be used in isolation. You need a least some side information on remaining reserves (1P and 2P) and future discovery potential.
Yes, it seems that is all of Robert's examples production is constrained for one reason or the other, whereas HL works for areas that are not subject to such constraints. I foresee a debate on what constitutes being contrained on the horizon.
HL works for areas that are not subject to such constraints.
"Demonstrate any case – real or hypothetical – in which the HL would have predicted a peak in real time. Details are preferred over assertions."
This is exactly what I mean about a faith-based model. People just hand-wave away examples and think that it works in some other realm. Show me where it worked. Ever. That's the whole point. In case after case, real, idea, rising production, flat production - it doesn't work.
In other words, the HL method assumes that the logistic curve is a valid approximation of reality. And it often is, if production is developed in an "unrestrained" way (leading to exponential growth of the output rate for a while), but then starts suffering the early effects of depletion (and thus eventually falling below the initial exponential growth curve in a certain gradual way). Robert's made-up Oilsville cases do not conform to these assumptions. Arithmetic growth is not exponential. And his exponential example has no depletion effect before the peak (constant exponential growth until the peak, then exponential decline). Thus those examples don't say much about the HL method's suitability for real-life data.
In practice I agree that "the HL should never be used in isolation". First plot the actual Production values (not P/Q), preferably on a semi-log scale, and see if it looks like exponential growth followed by a slow-down in the growth rate. Combine that knowledge with everything else known about the region in question: past restrains on production, recent discoveries, etc. Only if all that fits the HL assumptions would HL be a reasonable tool to use for the region of interest.
Only if all that fits the HL assumptions would HL be a reasonable tool to use for the region of interest.
Show me a case in which these assumptions are met and the HL worked. I predict that NOBODY is going to take up that challenge.
Robert, I think you need to give this up. It seems what you're saying is not what what people are hearing. I admire you're fortitude.
For my part, I don't believe the tatoo is necessary. I think you are saying that whatever else is going on, we really should be taking some action to reduce our collective consumption of oil, as well as, I would assume by extension, gas and coal.
Second, you've pretty much convinced me the HL is not going to give us a confirmation of peak at peak. As a tool to confirm KSA is at peak now, HL doesn't seem to be the one. You've won my support for your position. Although, I'm just a hand-waver at heart, so don't look to me for anything more than a slap on the back and well done me lad.
Good luck in your quest, you're going to need it.
First plot the actual Production values (not P/Q), preferably on a semi-log scale, and see if it looks like exponential growth followed by a slow-down in the growth rate.
It does not follow an exponential growth anywhere according to curves that Staniford has shown previously here: http://www.theoildrum.com/story/2006/1/8/25235/83999
This data comes from the full time span of the earliest discoveries to the current data.
(on a semilog graph, exponential growth will follow a straight line)
Dear Khebab:
Thank you for bringing this up, as it is what I was thinking while I read RR's excellent article.
Would you consider creating another of the same plot, but for the constant growth/constant decline model? Does it look the same?
What struck me on the plots, was that the HL *never* produces a linear result pointing to the correct URR. Why then are we using it? It seems to be almost useless.
Can we not produce a version 2, one that is actually accurate? Could we do this by recognizing that the resulting curve is not a straight line, and solving for the real URR? Is the HL curve a log? It is unfortunate that I don't have enough available time to further this analysis myself; it is not as helpful to ask questions than to answer them.
Thanks to all for your hard work.
The data itself has a lot of error and we actually don't know the final URR even for the US we are still pumping. So there is no such thing as the correct URR.
If you look at this graph.
http://www.theoildrum.com/uploads/12/gaussian3.gif
You see that HL got the peak date right and the Gaussian fit the production data better. So ...
I favor Gaussian over HL and the Oil Shock model over that but I don't see that one model is a hands down winner depending on what your modeling. HL seems pretty dang good at predicting the peak date so far. You should consider its URR estimate as more of a if conditions stay the same this is the URR. In general it tends to underestimate then over estimate but in reality since above ground issues tend to lead to lower production so it tends to get it right. The later overestimation is not important.
And don't dismiss the bottom up approaches they are the bible models are just that models.
Finally KSA Iraq and Iran will probably never produce all their oil for political/economic reasons. I'd be surprised if any of these countries are producing oil in twenty years.
What? URR is the solution for which we are solving! The correct number is the one that people will know in 3007 when they look in their history book and it says we pumped x number of barrels.
RR has been begging someone to back this assertion up with a demonstration of HL predicting a peak before the peak actually arrives, in real time. I have yet to see this and invite you to demonstrate a working example.
As far as I'm concerned he has already post a good example for KSA in this article.
Robert has claimed HL does not work his argument are not even close his assertion remains unproven.
Valid critiques of HL exist and so far although I like the alternatives better because they make more sense they are not giving answers that differ substantially from HL.
Next consider this for a oil field.
1.) The oil extracted before the peak is much easier to produce than oil extracted after the peak so if anything production rates which is our primary concern are inflated pre-peak.
2.) Production of a field at some point post peak becomes technology constrained not geology constrained. You can drill more wells or you can't handle more water.
3.) The URR is a economic number depending on the extraction method and costs a significant amount of oil is still in the field after primary and secondary extraction.
At least 50% of the oil will be produced under conditions that don't really fit HL and they result in steadily decreasing production rates and higher costs.
All I need from HL is some indication that we are past at least 40% QT the derived URR is just and indication of how much easy oil + hard too extract oil is left. Most of this oil will be extracted in the hard phase and thus can be discounted. 60% QT and higher is a strong indicator of peak.
Robert is making a big deal out of URR and this is not all that important except that it should agree within reason with P1+P2 real URR is determined by economic factors and OIP.
Understand that economically 50% of the worlds oil reserves don't matter what matters is how much easy oil we have left and if we can keep increasing production. HL helps in determining if this is true or false. The real problem is a simple coin toss.
And further more peak does not matter it what matters is if oil production can be increased fast enough to meet export demand.
For the part that HL needs to play in this analysis which includes a lot of other factors it seems to work good enough for you to make this coin flip.
Now as far as HL and KSA is concerned they have made what are basically outrageous claims that have been taken at face value HL is useful in doubting these claims all we need is probable cause and HL gives this. Thats the only piece of information I need to extract out of HL to decide what other factors are important you don't even need HL to make a decision bottom up points to the same answer. Its just bottom up approaches cannot readily discount KSA's claims.
Technically you don't need the models I find them helpful and they seem to provide better answers than we need.
Nothing Robert has said or done has convinced me that the coil is not showing tails. This post on modeling its not even relevant.
More good sense from Chairman Memmel. I learn more about the realities of oil depletion and peak oil from your succinct comments than from just about anyone on this blog, many thanks.
Mr. Rapier,
I agree with your overall point. I've played around with a few mathematical models expressed them on EXCEL graphs and would agree that until you hit a natural (not artificially throttled back) production peak you can't really tell all too much.
Now - having said that - why is it that global production has linearized since about 1983 (when SA limited production)? I've been looking at that and am still scratching my head (or am I reading the graphs wrong?).
Don't forget: digg, reddit, and the linkfarms.
Excellent work, Robert. Your explications confirm my intuition about HL predictivity: it ain't robust, or in other words, and through squinted eyes, in the neighbourhood of around plus or minus 20/30/40% or thereabouts approximately.
Robert - I posted this one a few weeks back, posing the question: "why the Captain ignored the advice of peril ahead?"
It would have been better for the Titanic to have avoided hitting the ice berg altogether.
As for HL, I'm a fan - but since joining this site about 9 months ago I've warned of the need for caveats in interpretation. Understanding the weaknesses of your own arguments is a good way of winning a debate. Petroleum engineers use this kind of methodoloy applied to fields on a daily basis - but the size of the system being modelled there has well defined boundaries.
If I recall correctly, Hubbert used estimates of the URR for the US in making his original 1956 predictions of the peak. He gave predictions of peaking in 1965 and 1970 based on different values for URR. He did not use linearization, but fit a logistic function to production data along with the estimated values of URR.
Oil production could be (generally) by the differential equation:
P = dQ/dt = f(t)
Some knowledge of a boundary condition, such as the URR, is needed to provide a unique solution. This suggests that there is no hope of accurately prediction the time of peak production from the production data alone.
Does anyone know when and how the linearization technique came into use? How did we come to believe it had predictive value?
I am also coming to the same conclusion. Although I think that a URR for conventional oil and a URR for Canadian Tar sands should be treated differently, due to the different possible maximum rates of extraction.
Unfortunately we have previous posts saying this (see below) Should the community admit that we need a URR, and do the same thing as Hubbert giving different dates for different possible URRs, with a special handling for low extraction rate resources. (I am not sure that this would change our overall conslusions by much from the aspo models)
In other words - Is it time to eat our hats and apoligize to CERA on this one point? (obviously not the whole argument).
http://www.theoildrum.com/story/2006/11/15/83857/186
And also:
http://www.theoildrum.com/node/2283 (Dialoguing with Dr. Peter Jackson...)
"In other words - Is it time to eat our hats and apoligize to CERA on this one point? (obviously not the whole argument)."
We should never, ever apologize to CERA. In actuality, they need to apologize to us for not releasing any of their mathematical models to the open source community. With a big IF that they actually have anything. You can't give these cretins an inch, because they don't have our best interests in heart and will just use it to bolster their neocon agenda.
The best defense is a strong offense, and the area that CERA, Michael Lynch, and geologists such as Attanasi & Root are really weak in are in the subject of reserve growth. The data behind their "theory" is very weak and is easily debunked with some elementary statistics.
I keep my hat on my head; I don’t have much hair left.
You don't need the URR to fit an Hubbertian.
If I recall correctly, the linearization technique was first used successfully in the 1960s by biologists studying population dynamics. Hubbert applied it successfully to oil in 1982.
Check Deffeyes' books, where it is called "Hubbert Method". The name "Hubbert Linearization" was coined here ad TOD in consequence of Stuart's posts.
This series of posts Robert has written are somewhat deceitful, if you ask me. He never looks at discovery so we don’t how many discovery cycles he’s modeling. HL works solely if you have a single cycle (check Khebab’s comment). When you have more than one cycle you can model it pretty good with several Hubbertians.
Check the references on the “Dialoguing” post.
If I recall correctly, the linearization technique was first used successfully in the 1960s by biologists studying population dynamics. Hubbert applied it successfully to oil in 1982.
Biological entities can reproduce and therefore subdivide on their own, leading to exponential growth. Oil production has no such property, forcing an unnatural use of equations like the Logistic curve to describe growth and depletion.
When you have more than one cycle you can model it pretty good with several Hubbertians.
If one cycle of a Logistic is empirical, then more than one cycle is even more empirical. For proof, no temporal function convolved with a Logistic curve will result in a Logistic curve (unless that function is a delta function). Q.E.D.
This series of posts Robert has written are somewhat deceitful, if you ask me. He never looks at discovery so we don’t how many discovery cycles he’s modeling.
So do you know how many discovery cycles are available from Saudi? Can you actually apply the HL to a real case and show where it would have accurately predicted a peak? Do you agree with those who base predictions of a Saudi peak primarily on the HL?
I should perhaps ask a new question:
"If Hubbert "doesn't work", how do we know there is an iceberg ahead"
I think I know part of the answer to this - and this is where part of our focus should be.
HL <> "Hubbert"
At the risk of resurrecting yet another picayune debate on HL, it is important not to confuse the identification of limits associated with HL, with an inference that Hubbert's analysis was invalid.
The core of Hubbert's prediction is that the maximum rate of production for an oil field or basin has an upper bound that follows a logistical curve. This is a geological / physical / ecnonomic bound, that is almost inconvtrovertible at this point.
The HL is a transform of the production curve, such that if it is following the logicstic curve, you can get a linear plot line which can extrapolate to the URR.
(I think that much is relatively uncontroversial...)
The squabbling has been over how reliable this transformation is, not whether the Hubbert logistic bound is valid...
Since everyone on both sides are shouting "its not about the HL, its about Peak Oil", I think we are at a point where we should stop talking about HL validity for quite a while, and get back to discussing peak oil...
CW
Global peak: 2007 - 2010
Global decline rate, Post peak: 2%
Economic response: Severe global recession, ~5 years, then slow recovery
CW
I think you're right - the focus needs to be peak oil / peak energy -environmental and social consequences.
But if folks want to debate peripheral issues then that has to be kool too. Switch off and listen to music those days.
WRT peak oil, I'm thinking we need more rigorous bottom up analysis combined with a data base of discoveries to feed into a future development model.
I've suggested to PG that we should invest part of the TOD fortune in the IHS data base.
Hi Euan,
Thanks.
re: "WRT peak oil, I'm thinking we need more rigorous bottom up analysis combined with a data base of discoveries to feed into a future development model.
I've suggested to PG that we should invest part of the TOD fortune in the IHS data base."
Some Qs for clarification:
1) What's your view of the current bottom up analyses? (Are there others, besides Skrebowski's)
ie.., a) How to make them more rigorous?
b) What is lacking in the rigor?
c) There currently exists an estimate range - yes? no? Do you agree with this range? Do you consider it to be too wide a range? )(or...?)
2) Is a "data base of discoveries" available - or not?
(Could you explain this a little more? ie., is this in the same category as "production data", which Simmons says Bush could easily put in place?)
3) I assume you're joking about the IHS data base? My Q is: Who does use it? Does Chris S? Who else? Colin Campbell?
If TOD did subscribe (or is it a one-shot deal)? - I think this has been asked and answered before...? It could or could not be made available to the readership? In any way? Some way?
4) So, would you be more willing to accept the conclusions of someone who had access to this data base, even without seeing the data itself?
So, then, it seems this might be simply a matter of asking...? (Simmons?)
I'd donate to support that. Even though I assume that a small # of TOD contributors would have access, it might greatly improve our understanding of the SA (and FSU) production, which would be well worth it.
CW
Global peak: 2007 - 2010
Global decline rate, Post peak: 2%
Economic response: Severe global recession, ~5 years, then slow recovery
The only problem I have with bottom up by itself is the depletion rate seems to be hard to confirm and URR is not there. Now with that said with a reasonable depletion estimate
its easy to see that bottom up approaches may be superior and predict the upper bound on future oil production. Your pretty confident it will never go over this since almost all external effects are negative.
My opinion is you need to combine bottom up with at least a simple model maybe a better one like the oil shock model.
Very sensible.
If the current economic extravaganza doesn't show any thing else it shows that the industrializing and consuming nations of the world are now bent on a 100 yd dash to the finish of any available cheap fossil fuel supply. That sprint runs smack into peak oil and peak EROEI. Any senario that interrupts this probably isn't pretty either.
Simply by having a list of the countries or regions which are now in irreversible decline as opposed to those which MAY not be gives the uninitiate a pretty good picture of the pattern. Dr Albert Bartlett on the exponential function or simulation results on water evolution at the eastern and western flank of Ain Dar work fine for me. That's over at Drumbeat today. Stark images.
At the point of inevitable economic contraction how many people go too? That's something worth mitigating and worthy of our efforts.
To argue whether the race is a hundred yds. or even a quarter mile does not impact most people as much as what is left functioning when we inevitably finish.
That energy constrained landscape is gonna be real humbling. So many are going to say ,"oh how sudden it all was" and then "what the hell was the big hurry to get HERE anyway"?
As with GW if we can just acknowledge that there is some uncertainty as to exact intersection but that we are well past mitigation start time it might make more sense to the vast percentage of people who have never even heard of the concept before.
Hello x,
Thanks for your comment.
re: "At the point of inevitable economic contraction how many people go too? That's something worth mitigating and worthy of our efforts."
I think this was the point of "x"'s extending of the metaphor above...the possibility of mitigation (for lack of a better term).
If one wishes to proceed with this possibility in mind, then,
what you say here:
"acknowledge that there is some uncertainty as to exact intersection"
becomes important.
My question is:
Would it be useful at all to do the following?
Ask a series of Qs to Robert, Jeffrey, and anyone else.
Along the lines of:
1) Do you have a date range estimate of "peak"?
2) If so, what are you basing this on?
3) If not a date range, then any other type of estimate? Or problems with estimates... and if problems, what stands in the way of their resolution?
4) When you look at the implications of your date range, what do you consider the most positive and immediate actions to be taken - by anyone, any where, and I suppose I'd like to include here, international and national levels. Not what is "doable", but what you think must be done in order to deal with the consequences you imagine when you look at your date range?
5) Do you see an uncertainty factor in the range? What is the implication of the uncertainty factor?
Aniya, Thanks for the thoughtful response and due to the lateness and being away doing greenhouse just a short reply.
Good questions and constructive. Two or more well intentioned, sincere and professional people disagree on a precise timing. One is more peak now and the other a bit peak later.
They both have good advice. Oversimplified ..Jeffery ELP. Robert lifeboat building. Hmmm. Both serve as a light into an area only dimly viewed by me. So in a word TOD 'rocks' cause getting their views and conversing with them is great as I have had the chance to do here and..
... there are many such people from which to gain insight.
We (Dragonfly41) toyed with this a bit the other night as the 'blind men and the elephant or warthog ..which?) Maybe Robert and Jeffery are some of the one-eyed kings!
What hinders their estimates is a very interesting notion. The idea of inquiry about what OTHER (other than HL, or field by field) information that influences these 'insightful ones'. I may pursue that with one of them if you do not first....however
My thing, even with this disagreement, which I see as pretty small in the great scheme, is they already have given all of us enough to go back to our neighbors with and start to think about contingencies. Part of my 'x' is that we live miles out on the end of the 'spur' line so local food 'contracts' and trip sharing surely need to be on the agenda :)
This summmer may really convince everybody we need to get cracking. That's what I'm going to do.
Thanks again for taking the time to respond.
Thank *you* for responding!
Please feel free to "pursue this" (as you say above) with them at any time.
re: "...is they already have given all of us enough to go back to our neighbors with and start to think about contingencies."
The new dissertation out - reference on Drumbeat and Energy bulletin - might help.
It seems to me that the idea of what we're basing things on is important...when we are telling our neighbors. There's something that gets lost in the message (it seems to me) when the dates/and/or situation can't be laid out in some kind of way wrt assumptions, who looks at what, what it means...
Yeah I'm looking for stuff to have in a booth at the Conservation Fair ..might use that. There is so much good material streaming now. I've got to check the blogpulse and see if PO has passed Paris Hilton yet!LOL
http://www.blogpulse.com/trend?query1=Paris+Hilton&label1=&query2=peak+o...
No but she's falling and 'we' are moving up!
On the neighbors thing. I'm maybe going with "although brilliant, well intentioned people disagree on dates and severity virually ALL are advising similar preparation"
The other thing that is starting to get through to me is that many people already seem to 'get it' at some level. A co-worker the other day who is about as 'salt-of-the-earth'
as they come and I mentioned Ghawar. The big pool
over in Saudi is maybe declining. He floored me said "they all are"
Look, fireworks!
How festive it must be aboard that party ship!
Great contribution to the discussion on HL utility (or non-utility).
Khebab proposed parameters for linearization to work.
Is it possible to bring statistical confidence measures into the analysis?
e.g., given Saudi P/Q vs Q historical trends, can we place a 90% confidence using HL of URR of X (+ or -) Ybbls?
Cheers
Second this question.
Fascinating read. Us biological types (the non-engineers) are left scratching our heads.
This sort of thing keeps me coming back again and again to the Oil Drum-- the second thing I look at in the morning. It also highlights the essentially metaphysical nature of all this.
Given that there is a lot of oil yet to be pumped -- by anyone's reckoning -- and human lifespans are short, it seems like the response to the world in general should be "what can I do with the rest of my life, and how can I make things better for myself and everyone else in the unknown time left to me." Or something like that.
Speculation about the exact length of life remaining, and attempts to corner the market, or even a tiny part of it for oneself both seem doomed to irrelevance. What good would it have done, for example, to organize a group to forcibly acquire all of the lifeboats on the Titanic? Just a different small random group of survivors would have reached the shore.
> Speculation about the exact length of life remaining, and
> attempts to corner the market, or even a tiny part of it for
> oneself both seem doomed to irrelevance. What good would it
> have done, for example, to organize a group to forcibly
> acquire all of the lifeboats on the Titanic? Just a
> different small random group of survivors would have reached > the shore.
It makes all the difference in the world, whether or not you
are one of the ones _on_ the lifeboat!
what good would it have done to organize a group to sieze lifeboats? statistically it might not matter if all one cares about is the total number of casualties, but to the individuals on the sinking ship, being one of the ones in a lifeboat matters quite a lot, and missing one's chance on account of a faulty assumption is a life and death mistake.
Exactly,
what is missing from the listed groups that formed on the Titanic? Where was the group that was trying to build some sort of floating "liferaft" from the multitude of available items on that ship. constructing something that could float for several hours or perhaps days in a couple of hours. Where where they. You don't hear about such a group. They stoically went down with the ship, the band played on, etc.
There wasn't a construct in their lives it seems to attempt such a thing, it just wasn't "civilized". Was there such a group. If so did the news of the day not reveal the info as to disrupt the natural order of things.
Theory and what is the truth. If you have high speed, and like science, check this out if you haven't seen it yet.. (THe first link). Its a video of the sun with a new space craft imaging system. Its something that has never been seen before. Oil, energy, here is the real power source as never seen before. If you saw the "tsumani" video of the sun a few weeks ago, then this is a must see.
The rest are to recent news stories on new discoveries or new theories that will soon be put to the test also, and imo have just as much impact on the economic system, which is what this is really all about as far as "civilization" is concerned imo.
However the correlation between two of these is interesting.
http://science.nasa.gov/headlines/y2007/21mar_chromosphere.htm?list29945
http://www.spaceref.com/news/viewpr.html?pid=22152
http://news.yahoo.com/s/nm/20070322/sc_nm/climate_ocean_dc_1;_ylt=ApEgjU...
http://www.physorg.com/news93696621.html
Quid Clarius Astris
Ubi Bene ibi patria
what is missing from the listed groups that formed on the Titanic?
So, you thought the analogy was too short? :-)
Well, not so much
But it would make a good novel
Everybody figured they were going to be one of the ones in the lifeboats until they were'nt.(Except steerage, of course they knew they were screwed.)
I've stayed out of the fray so far but wanted to toss in a
quick little comment, largely in support of Robert's
critique of HL.
I've seen heavy frequency of posting of HL plots here at TOD
in the past few months, and have been getting the feeling some
folks have begun putting the cart before the horse in the
matter.
When Hubbert made his two 1956 predictions, they were
predicated on two URR scenarios, he was not predicting URR
based on production numbers. Quite to the contrary, his knowledge as a geologist, oil man, and industry insider gave him a good feel for what might have been a reasonable range
for lower 48 URR (and he was smart enough to propose a range),
and his observation of production in a set of normally distributed wells peaking close to 50% of URR was thereto
applied to yield his predictions. I have considered running
the meat grinder in reverse to be kind of dubious from the start and am glad someone like Robert has taken the time to
put together a patient, coherent address of this matter.
On the subject of what is the KSA's URR anyway? well, it
seems rather obvious that the official 260 GB number is
bogus, and given that they've already produced on the order of 110GB, it has to be greater than that. is it 150GB? is it
180? is it 200? HL is not going to help us much there.
There are other analyses which have been helpful in giving us a general idea that somewhere close to 170-180 GB is
a likely URR,but it _is_ important to realize when even the
right answer has been produced by a questionable process- it
inspires false confidence in other outputs of that process.
KSA cannot continue to hide failing production much longer
if they have peaked. To me what we know of their recent
history indicates that they _have_ peaked, but the test in
the coming months seems a good one- with the one possible exception of smoothing things out from stockpiles as a
wild card in the deck. A shortfall of 1 mbpd could be
covered up for months on end from the stockpiles of the
western countries and if those stockpiles didn't report the
drawdown, there would be at best hazy rumors from industry
about where some of that crude was coming from.
Hello Rudolph,
re: "When Hubbert made his two 1956 predictions, they were
predicated on two URR scenarios, he was not predicting URR
based on production numbers. Quite to the contrary, his knowledge as a geologist, oil man, and industry insider gave him a good feel for what might have been a reasonable range
for lower 48 URR (and he was smart enough to propose a range),
and his observation of production in a set of normally distributed wells peaking close to 50% of URR was thereto
applied to yield his predictions."
Is there any possibility that Jeffrey, Robert, Euan, memmel, and anyone else might comment simply on agreement or disagreement with this paragraph?
--..."predicated on two URR scenarios" - ?
Read Hubbert's paper, as released by Shell:
http://www.hubbertpeak.com/hubbert/1956/1956.pdf
Especially take a look at page 32.
Takeaways:
1) HL doesn't work for unrealistic scenarios...
2) URR predicted by HL is unstable when production varies from unconstrained production
3) HL does not provide sufficient information (in isolation) to determine 50% Qt, particularly when production is constrained; it can oscillate back and forth across the 50% Qt boundary as it evolves.
4) didn't adress this directly, but it appears to still be true that HL does eventually converge on URR for most realistic production scenarios, and is still an interesting 'descriptive' tool, rather than a 'predictive' tool.
and, of course
5) TOD is least effective/interesting when people 'personalize' the analysis, at attempt to "win" the discussion.
CW
Global peak: 2007 - 2010
Global decline rate, Post peak: 2%
Economic response: Severe global recession, ~5 years, then slow recovery
1) HL doesn't work for unrealistic scenarios...
Produce one in which it works. For all the critics, nobody ever takes up this challenge. They just envision that somehow, somewhere, it works. Show me.
didn't adress this directly, but it appears to still be true that HL does eventually converge on URR for most realistic production scenarios, and is still an interesting 'descriptive' tool, rather than a 'predictive' tool.
That is in fact a very good description of what the HL actually is.
Hi Robert,
I certainly appreciate the desire to examine closely one's assumptions.
memmel rather bluntly asked (above) if you'd check out the ref. he gave. Would you be willing to do this?
Absolutely not! They were mostly women and children (and a few very smart guys) who got in the lifeboats and didn’t stand around and debate the issue.
Absolutely not! They were mostly women and children (and a few very smart guys) who got in the lifeboats and didn’t stand around and debate the issue.
But of course as an analogy to the real world, very few are actually getting in the lifeboats. I want to convince them to do so. How best to do that with maximum effectiveness is what I am after.
"I want to convince them to do so."
I don't think you can. Not for many, anyway. People weren't scrambling into the lifeboats before the ship struck ice, but after, when it was obvious that something serious had happened.
In the case of Peak Oil, people likely won't seriously begin clamoring for "lifeboats" until the initial impact occurs. Many will need just such a first signal. This can be any or all of a number of things, including, but not limited to:
1) Prices at the pump escalate sharply above all previous records.
2) The economy crashes. (As the Titanic did indeed crash into the iceberg.)
3) The nukes are in the air. Hallelujah, hallelujah.
Incidentally, some might argue that 1) has already occurred, based on price spikes last year. The “Peak Now” people are the ones saying the iceberg has been hit. The “Peak Future” crowd seems akin to the observers in the crow’s nest, who have spotted the big white beast dead ahead. But at that particular moment, with the ice raft off in the distance, there’s always the potential to think that there’s still time to avoid the collision altogether.
-best,
Wolf
If I remember correctly, many did not want to get in the lifeboats after it hit the iceberg. It was inconvienient, It was cold, it was uncomfortable. That good captain will do something before it gets that far. At the beginning they had trouble filling the lifeboats and actually released some partially full. Do not underestimate the ability of people to not see what they don't want to see.
In my universe I'm God. I'm looking down on the Titanic heading for the gleaming iceberg I've created and pushed into its path and I'm smiling ruefully. I'm slightly melancolic as well, as I'm not sure mankind, my creation, one that's amused me, is up to this new test I've devised for them.
Unfortunately they don't appear to be aware that the "Titanic" isn't really a ship, or a theory, or a society. No, what they think is great ship, is in fact, the world. A world I gratiously created for them, a pristine and quite beautiful thing which they have abused beyond measure. Another point lost on their tiny minds that presume so much in puny arrogance and hubris - there are no lifeboats. There are no ships coming over the horizon just in time like they do in their childish though often amusing stories. In this respect they are on their own.
The point, the ultimate test I've devised, is not how one deals with hitting my iceberg and how one deals with the consequences. The test is not to hit the iceberg in the first place! The iceberg is Doom looming. So get your act together and avoid it people, and then maybe we can talk.
I basically agree with that sentiment, but to continue the analogy: since there were only enough lifeboats for about 30% of the passengers, I'd like us to convince folks to build more lifeboats while there's time to do so, so that closer to 100% of the passengers survive (or thrive in a post peak oil world).
However Washington at the moment seems fixated on who might have rearranged the deck chairs most recently, instead of on achieving energy independence and supporting solutions for a post peak oil world. Talk about not having your priorities straight!
I'm really not sure what thess linearizations do. Oil in found in rocks, not in countries. If Saudi Arabia took over Kuwait, would we all have to adjust our graphs? Also, how do you apply a depletion graph to a country that has only operated at peak production for two years in the last 25?
After the price fall in the 80's, SA shut down everything except Shedgun amd Safaniyah offshore. They even shut the complex of Uthmaniyah, a beautiful complex and sent the employees to Abqaiq. I did most of the production testing on safaniyah inland. Mostly heavy crude, we perforated, flowed the wells for a week and shut them in. Nothing there was connected to a GOSP. I did almost all the testing in Shedgum and ran most of the neutron logs from 1984 to 1987.
We set packers in just about everything in Harad and most of the surrounding fields. So even though production in THE COUNTRY was low, production in the top of the Ghawar anticline was quite high. In short, the country went through a major cost cutting move.
Now, every indication is, it's time to pay the price. If shedgum is producing 50% water, we have a problem. All anecdotal information seems to be pointing in the same direction. They need to drill the dog shit out of Shedgum and Safaniyah offshore to reduce the number of barrels per well. If shedgum dies, the easy oil is gone. Time to ramp up the rig count.
The Hubbert's peak arguement is a theorectical field thesis. Oil production is an engineering issue. Sometimes the two meet. Usually though it's not the peak that's the issue, it's the slope of the decline. IMO, people have inginuity. That means the slope is probably always too steep.
pschwart,
There has been a lengthy on-going discussion about the Ghawar fields on the Drumbeats the last few days (continued on today's).
I would really welcome commentary and opinion from someone who has actually worked at these sites, on the speculations of those many of us who have not.
If you have the time and inclination...... thanks in advance
I don't think Ghawar's a big secret, but one thing is fuzzy. ?Is the flood front advancing as was planned IMO, probably not. I never could figure out why they'd horizontally drill a field producing in the open hole. The wells are in the middle of the anticline. one thing that hurts, IMO, is that the super permeability zone is on top.
So I'm guessing that Ghawar is probably pretty well depleted. I guess in the end, they could drill 35,000 wells and install pump jacks, but aside from that, I think simmons is right.
But in the end, this talk about catastrophy is silly. As long as it's not a war that causes the oil to stop, we can all adjust. 80,000 bpd of drop is a lot but not compared to all we use. Hell, al gore uses more than that.
I don't understand your 80,000 bpd figure. Ghawar is alllegedly producing 5.5 mb/d. The Heinberg rumor, less than 3 mb/d and everything else is full tilt to cover it up. We know it's been a con game since OPEC changed it's rules and everyone doubled their stated reserves so they could pump as much as they want. We don't know how much was sold under the table over the years. Stolen oil from Iraq may even be being laundered through SA and claimed as coming out of Saudi wells. Tell me how anybody, no matter what mathematical construct they are using, can have any idea where we stand. It's easier to watch the world leaders and the big players(as well as the engineering being used to access the remaining reserves) to assess whether we are close to 'Game Over'. When everyone is lying, don't even look at the figures. If Ghawar is close to watering out, we are screwed.
The signature event(s) that convinced me that P.O. was upon us was not an H.L. plot or data roll-up...
The telltales were...
1) the rush to develop tar sands
and
2) Cheney's super-sensitive consultations with senior oil execs.
There is no other explanation for those events.
And #2 also included the presence of major CEO's of NON-oil companies (it is part of the record that was released). I will never believe they all chatted about good news and our wonderful economy.
Amen.
The models at there most basic are to give a reasonable doubt to major spin like the KSA reserves. And to give you and idea that other data like bottom up analysis etc are telling you we are at peak.
And of course they make you pay attention and read between the lines.
The models at there most basic are to give a reasonable doubt to major spin like the KSA reserves.
This is where - had you not decided to dismiss all of the hypothetical scenarios - you might actually made an important deduction. In the flat production case, the URR is constantly being underpredicted. Production in Saudi was relatively flat for many years. This will skew the URR prediction. So if they were actually holding production steady intentionally, then the HL does nothing at all to disprove the comments about their reserves.
I really think it would be invaluable for you to plot out some HLs for yourself. Some things can only be appreciated through the experience of doing them.
Memmel, I was referring to watching the geopolitics to get many of the answers, and probably should not have included the first sentence in my quote. The geopolitical jockeying of recent years plus all of the lies we've been told has the stench of a petroleum crisis in the making.
I happen to agree with westexas that these arguments are a waste of time. Who wins as to when the peak occurs or has occured is not the point. As far as I can tell, most of us who follow TOD believe that peak oil is a reality now or will be in the near future. I also happen to believe that most people in this world don't want to know. They have too much investment in things remaining as they are. I do appreciate the efforts by everyone on this site in getting the message out to as many people as possible, but I don't see our message being taken seriously by the main stream media simply because as I said before, there is too mush investment in the status quo.
Robert R., you have said that it is important when the peak occurs so that we can be seen as credible, but honestly do you think people will listen? Yes, some, but they will be few! Our message will not be taken seriously by anyone as long as we continue argue amongst ourselves.
I actually think that arguing amongst ourselves, the great debate about peak oil, is mostly what TOD is for. It's pretty harmless, intersting, often entertaining, and informative. As long as the debate doesn't become way too personal, negative and destructive. The we waste our time, and it's not really producive.
Often being right is just not enough.
Getting the message out is a longterm goal, under normal circumstances. We may be moving towards un-normal circumstances where alternative views and ideas may become far more powerful and threatening to the established, but that kind of scenario has its own set of drawbacks.
Historically, ideas like peak oil, ideas so potentially disruptive and lets face it, dangerous, have lives of their own. Certain ideas can take decades to move from the underground and into the mainstream. I believe one can perhaps compare "peak oil" with something like the growth of "nationalism". One can argue that today, in our speeded-up society ideas can spread like wildfire and this is a valid and in some respects accurate view. However, we also live in a society which is very complicated and paradoxical. I would argue, for example, that the mass of information has never been higher and access has never been easier, but at the same time, relatively speaking understanding, education and dare one say it, "wisdom" is in incrdibly short supply in society. Our political institutions are terminally currupt, our political leadership third rate, and "citizenship" the fundamental building block of "deomcracy" has been fundamentally undermined and hollowed-out. We are no longer citizens, with all that that implies, we have merely become consumers.
Personally I contend that dealing with the problems we face in relation to peak oil will require a radical and fundamental change in our current model of "citizenship" and a groundbreaking redistribution of power in society, whether or not one regards this as being a utopian vision or not is probably a metter of individual temperament.
Gregb-2
Read my comment earlier about climate change: in the earlier days, those who proposed climate change developed models that were very poor at predicting what was happening, why it was happening and what impact it would have.
The result? The 'mainstream' scientific community didn't put much stock into these theories.
It was not until recent years when the models became far better, more precise, predictive, testable and examined that the issue of climate change has been able to rise to the forefront and become an actual dinner-table conversation.
In other words: good, rigorous internal debate is excellent, it's how science works and it will only make the cause for those who believe in peak oil that much stronger.
Conversely, you can continue down a path with models that aren't terribly predictive, useful or accurate and allow your critics to infuse enough doubt so that the issue of peak oil *always* remains a niche discussion.
Take your pick.
Who wins as to when the peak occurs or has occured is not the point.
I do hope that you, and others understand that I am not trying to win a contest here. I am trying to figure out the best way to understand what's going on. From the work that I have been doing, it ain't going to be via the HL.
Our message will not be taken seriously by anyone as long as we continue argue amongst ourselves.
And if we stop arguing, call peak now, and then see production rise next year, none of us will have any credibility remaining.
Well said Mr Rapier. We need to get together for a beer again some time and hopefully some better food than last time. We will definitely need to keep the venue a secret.
We need to get together for a beer again some time and hopefully some better food than last time.
Yeah, no more Scottish Tex-Mex for me. I have had the real thing too many times. Next time, Indian, or maybe a good seafood joint.
We will definitely need to keep the venue a secret.
I agree. Too many groupies and autograph-seekers. :-)
Robert: Rudolph Diesel said, "I have considered running the meat grinder in reverse... "
Maybe that might be a useful exercise in one respect - - not to predict but just to get a sense of the outer limits. After failing calculus and changing from engineering to political science, I played around a little with growth curves and so, maybe, vaguely recall just enough to be dangerous. Robert makes the case that too much is being demanded of HL. I'm following the discussion in the sense that I get the drift even though I don't have a command of the math...
So, here it goes... If there's a target URR for KSA that most feel comfortable with - - Rudolph's referenced 170-180Gb range - - could we backfill into a truth-table of sorts by (1) picking 4 sample URRs - - the target 175, 190, 205 and 220; (2) using Table 8 from Robert's presentation, backfilling a line from each of these thru the green dots from 1991-2006 on the HL chart; and (3) assigning peak production years by plugging in 60%, 65%, and 70% Cum Prod as being the points of peak? (The results put in a table 3 cells high and 4 cells wide.)
I'm not pretending this is predictive, just that we're given a sense of how much (or how little) expanding the URR changes the peak year. If something around 50% might be assumed in an unconstrained model, using 60/65/70% allows something for KSA's swing role (e.g., 60% @ 175 Gb looks like 2005). If the model let's you do this, how far apart from 2005 are the other 11 dates? (I'm thinking of how Hubbert's 33% expansion from 150 Gb US/URR to 200 Gb only got him 5 more years.)
For some folks, just seeing the possible "point-spreads" as it were is enough to get in a life-boat... (mixed metaphors ain't gonna matter where we're headed, Todo!)
Here, let me hand you a clue.
DO NOT PREDICT THE PEAK!!
How's that for a clue?
Simply show that we will peak, that we need to do something, that sooner is better, i.e. wouldn't you prefer to have the most cheap energy possible to make the change rather than the least amount of cheap energy?
Why is this concept so difficult to understand?
I believe we need to ignore the temptation to answer the mindless masses and their specious focus on the precise year we will peak. Tell them it will, we don't know when, and the best thing we can do is prepare while the preparing is energy cheap. Frame it in whatever jingoistic framework that will best motivate the sheeple: religion (GOD says DO IT, DO IT NOW!!), economics (Hey, get in on the ground floor you greed heads!!!), science (Look!! Cool new green gadgets!!), sports (just think about how good the fishing will be when we clean this mess up!!).
See. We avoid the dreaded incorrect picking of the peak and we prepare while the preparing is energy cheap!!! Wooohoooo!! SCORE!!!!!! Everybody goes away happy. No more nitpicking, no more egos being pompously, scientifically proper. Just working to ameliorate the powerdown.
Ahhhhhh. My shoulders are relaxing even as I type.
"First, they challenged the faith-based group to show a case in which their methodology had ever been demonstrated to work. Challenges to their arguments were met with repetitious assertions of the original claims. Yet the scientific group continued to challenge the argument – not because they didn’t think the ship was sinking – but because they saw some inherent dangers in faith-based arguments and they were not satisfied with the integrity of the conclusions."
Robert,
Your article, especially the analysis part, was well-written, and definitely made me think about HL more in-depth (and I'm still thinking).
However, to equate the "other side" as being faith-based is a bit over the top. Science is a broad endeavor, and involves many different techniques. The exploration of case studies, which in this case help inform about possible constraints in the utilization of the HL technique, is a scientific approach. It may not be the most pretty approach, but it is scientific. Observational studies count, as do experimental ones.
I'm going to make a suggestion. Why not stick to exploring the analogies and science without utilizing attacks, oblique or otherwise (this is for everyone)? I would have enjoyed your article more, and taken it even more seriously, had the initial tone not been so negative in the beginning. I almost stopped reading--but your expertise is too strong to just throw away, and so I quelled my inclination and continued my journey through your thoughts despite my misgivings.
I started reading TOD well over a year ago mainly for the objective analysis, not for tension between contributors. I get enough tension simply from the subject of Peak Oil and its potential consequences, thank you!
-best,
Wolf
However, to equate the "other side" as being faith-based is a bit over the top.
When the response to a challenge of your argument is to repeat the original argument, make insinuations about other's motives, and ignore the actual contradictory data, you have a faith-based model. A faith-based position is unwavering, so instead of modifying the model as needed you rationalize and ignore the evidence.
And I could actually give credit to someone else for coining that term (specifically in response to this debate), but he may not want that to be leaked out.
Robert seems to be very anti Faith based stuff.
I would like to remind Robert that he is posting here while working for an Oil company. He has been questioned as to whether or not he has a hidden agenda. He has been asked how come an oil company lets him post here etc.
Roberts response has been. basically "trust me", or in other words, have "faith" that I am on your side. Note he does this without ever having posting anything solid that backs this up. He uses anecdotal evidence etc, of his "position" and that he is trying to help.
After reading this thread his responses, his challenges to those that have responded and calling them faith based answers etc.
tell us Robert, exactly why should anyone believe what you say about why you are here when you are so anti Faith based on taking a position of importance, when you yourself are relying on a faith based position to post here.
little like the pot calling the kettle black.
Quid Clarius Astris
Ubi Bene ibi patria
You can't fulfill his request to provide a working example of the model, so you resort to personal attacks.
What does it matter what his agenda is? Is "correct" thinking required in order to debate topics here on the Oil Drum? I wasn't made aware of that stipulation, but sometimes from all the mud slinging I see, I have to wonder.
As for his supporting the Peak Oil position, I believe he has repeatedly stated that people should be making an effort to prepare for issues arising in the oil and energy arenas. That doesn't sound like the standard oil company line to me of "Everything is fine, keep shopping".
The only difference between him and say WT is that Robert has not placed the same faith in a model that WT does. They both have the same underlining message however, and that is get your butts in gear and prepare yourself.
These attacks on Robert personally simply re-enforce in my mind that Robert is perhaps dead on right about HL being junk for all practical predictive purposes. Heck perhaps more than Robert's original piece, the fact that nobody seems willing to rise up to his challenge of showing a working example of the model, or hand waving his methods of testing the model in that he didn't use Maximum production figures YELLS MORE LOUDLY TO ME, that HL is busted.
If anything half the arguments I read above about Max production and development being needed for a successful HL plot to work, PROVE HIS POINT that HL cannot be used to predict Saudi Peak, because Saudi has gone through periods of Max and restrained production, thus making HL useless by the very criteria the HL defenders are spouting.
Get a clue folks, and either show Robert and the rest of us a working example of HL and explain WHY it works or else lick your wounds and admit you were wrong and start figuring out a better and more rigorous model to adopt.
In otherwords put up or shut up. The ball is in the court of the HL defenders right now, and from what I can see it looks like a bunch of all thumbs football players fumbling the pigskin all over the place.
You know these arguments are somewhat entertaining, but not very useful. What do we really know, since so many people claim to be scientists, oil is a limited resource, it follows a bell curve in growth, peak, and depletion. We know that in 1956 Hubbert was castigated the fool for saying that oil was a limited resource and based on his best analysis, the US would peak some time around 1970 and it did, despite the fact of new finds in the Gulf and Alaska.
What we also know is that between the 70s oil shocks, when it came to public attention that the world supply of oil was limited, and now, the world has done nothing but consume more oil and the United States is at the end of a decades long failed policy trying to secure control of the remaining world oil reserves in the Middle East, which not one person can reliably say how much it is because the oil industry and all components of it, has been run with zero accountability.
Whether we peaked last week or 20 years from now, in the long run makes no difference, because we've done shit about it. These arguments simply divert attention from doing anything, because they weaken the most important message, oil is a limited resource.
Robert:
A couple of things I notic when doing the H(l) method. First, running the method goes pretty poor results when one includes ratios greater than 0.0600. If you toss those values out it changes the curves, sometimes substantially.
Second, if one assumes the basic logistic curve where peak production is somewhere close to 50% of the predicted linear Qt value, then the method might tell you when you are getting close but could still be off by a few years.
Third, as seems apparent from the Texas data, the US lower 48 data and even the Alsska data, when theQt value suddenly "flattens" or increases after dropping for quite some time, and it looks like the slope in the short term is predicting infinte oil because the slope is positive or "zero," that seems to be characteristic that is indicative of the peak being very, very close.
When the points suddenly go wandering off the ranch like this, it MAY be indicative of something at the end of the swing production cycle.
It was true in Texas, it was true for the lower 48, and it was true for Alaska (even with the pipeline constraint although much less pronounced). It might not be the definitive signature, but it is something to consider.
It was true in Texas,
It wasn't true in Texas. I documented that Texas would have forecast a peak 16 years too early. But with our hindsight, we look at Texas 30 years later and claim we can tell what is happening in real time in Saudi.
Yes, if you include all the data going back to 1935 through 1960, it would have predicted a peak too early. I don't disagree with that. Even running the Texas data from 1935-1970 (in 1971) would have suggested you should already be somewhat beyond peak even though the oil production rate was increasing. Obviously, that's not too useful.
But the H-l curve was pretty squirrely until 1951 when the data started to settle down (until 1966). In 1966, it started to wander off the ranch as the local tangent of the curve goes from negative, through zero (indicating "infinite URR" at least temporarily) and back to a positive value (would that be "infinite" plus we are putting back the oil produced?). One point may not make a trend, several might be worrisome (see below).
What I am suggesting is two things.
First, using only the portion of the data where P/Qt < 0.06 might be advisable (note in the case of Texas it would still suggest that if you ran the data from 1951-1970, in 1971, then you'd already passed Qt(50) AND the peak had not yet occurred). Without the allowable quota limit, however, I would say that AT THAT time (1970-71), it might have been difficult to surmise where Texas was with respect to the peak. Using a ratio less than 0.06 still does not cure the problem you note.
Second, and perhaps this is a characteristic worth researching, is that starting in 1966 the "curve" started wandering off the ranch as noted above. I haven't tried to delve back into the Texas RR Commission files to figure out when they had given the equivalent of "Go at throttle up" to oil production but it seems they lifted restrictions in 1970 or 71. This, for lack of a better word, "wobble" is most visible here in the Texas data from 1966 until the peak in 1972.
What is interesting is that the rest of the US was wobbling with Texas starting in 1966 (with AND without Texas included in the data, so it's not an artifact associated just with Texas production). Even Alaska shows a very slight wobble trend like this going to peak (but part of the limiting factor is the TAP, so it's nowhere near as pronounced). The Texas data does not help or hurt the lower-47 wobble, though one might argue that the lower-48 prediction might have been a pretty good guess as to Qt(50) and the peak.
However, if you subtract out the Texas data and consider the rest of the lower-47 separately you get a different picture of Qt(50) but that predicts the peak too late rather than too early as in the case you present for Texas.
Using the data from 1935 to 1965, you would have predicted that the URR would be ~156 billion bbbls for the rest of the lower-47 suggesting a Qt (50) of ~78 billion bbls. At the rate of growth that was occurring up through 1965, you would have predicted that this value would have been reached in 1973-74 (3-4 years after the actual peak).
Whatever warning you think Qt(50) might have given in 1965, it was opposite of what the Texas case history. The peak would have (and did) happen before you knew it (except Hubbert).
But the "wobble" was still there in the data. And had we run the data in 1970 (1935 through 1969), our guess on Qt(50) for Texas would have gotten us a little closer to the actual peak date and a lot further away on the lower-47. In a way, this reiterates your point about the extension of the linear trend.
But what if the "wobble" is the signature event or a signature feature, not the "before peak" linear trend and the Qt(50) guestimate?
We certainly would have to consider other artificial factors that might give us a wobble. But if there were no huge artificial barriers AND we suddenly found an H-L curve taking a sudden dog-leg to the right (that obviously isn't beyond peak, because we have estimated production data that shows increasing production), I wonder if THAT might be the warning sign that we are somewhere within a few years of peaking.
Please note I am just putting this out there as a consideration of one way the H-L curve might be useful even if it does not do a good job of predicting Qt(50) or the likely peak. Maybe this is just an anomoly of too few datasets (or maybe too many in combination for the lower-47). I don't recall anyone else making this observation from the data AND it may occur only in a few cases or in certain types of plays.
But what if the wobble is "real" and occurs more frequently than in just the few cases we've looked at here? Is it a characterisitic of approaching the peak? I don't know nor do I know why others would miss it (but how many here would be able to look at plant growth data and come to the conclusion that "light stunts growth?").
If we find that it's just an anomoly, fine as I think you point on the H-l point not being too useful until after the peak. But if it turns out that it's much more common, I'd look very carefully at whatever KSA data might be available based upon some of the graphs presented here.
re: "But what if the "wobble" is the signature event or a signature feature, not the "before peak" linear trend and the Qt(50) guestimate?"
Robert, are you still responding this evening? (If so, I'm interested.)
Please note that Jean Laherrere's data on the Hubbert Linearization (shown in a post further below) shows exactly this type of wobble for world liquids approaching 2005 (we probably ought to kick out NGLs).
I'm preparing for a presentation (unrelated to this topic area) so I'm a little distracted from this discussion. But, looking at some of Laherrere's other data (it's not plotted as P/Qt vs, Qt) and doing a few back of the envelope calculations, there seems to be a similar pattern shaping up.
First of all, you say that you don't have good data prior to 1960. I can help you with that.
I think that the best data available is the API Facts and Figures, The Centenniel Edition (1959). You can get the data here. Warning, I did split the production of the neutral zone between SA and Kuwait during the period 1954-1958.
Just for the record, I scanned the 6 pages of the book where all this data is.

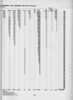
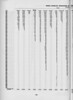
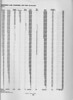
And more importantly, please take a look at my post at Graphoilogy: The Hubbert Parabola. In this post I analyzed 50 countries.
The Hubbert Parabola is a variation of HL: you plot P (Production) versus Q (cummulative production) and you fit a parabola that goes through the origin, instead of a line, to obtain URR. Your examples (constant production, constant rate of increase, etc) would do very badly in this method. The R^2 coefficient would be very bad, so you would know that the forecasts are useless. For example the production of Oilsville would look like an horizontal line (since you plot P vs. Q), to fit there a parabola is hopeless.
In my post I addressed 1), 2), 3) and 4).
I would really like to have your feedback.
First of all, you say that you don't have good data prior to 1960. I can help you with that.
A couple of people also e-mailed me the data. My back of the envelope came pretty close.
I have read your work before, and I felt like you made a very worthy contribution to the debate. I will pick your Hubbert Parabola argument back up as soon as I have some time to take a close look at it. My feeling is that it will take a bit of time to delve into it and investigate, and I don't want to comment until I have had a chance to do so. The true test is whether it could have called a peak in real time, and the value of the parameters you use to make that call.
In the past I have used a basic program called Curve Fit to predict recovery over time for leaching recovery of gold, silver and copper. It takes the data and goes through some 25 mathematical models assigning factors and exponents. It then prints out a series of formulas in order of goodness of fit. Unfortunately I have lost the program, however it should be found by an internet search.
I believe you are right about HL from my experience in those leaching tests. The best fits were always an exponential curve of some sort. This concides with your examples showing the the HL cannot predict the ultimate recoverable resource.
My biggest problem with any method of predicting a peak is there never any agreement about what should be counted. Many talk about light crude plus condensate. Then others want to add this or that e.g. NGL. That is like talking about beef production but only considering filet mignon, with maybe a top sirloin thrown in. Yep; liquid fuels will become more expensive, scarcer and less efficent, but the invisible hand still has some effect. Who knows the California may get there sooner this time.
Concerning the lack of early data, I found that the early periods of data (induction time) was actually deleterious to determining the ultimate recovery. There is just too many extraneous factors to contend with. The same can be said for the the part of the curve near the ultimate recovery.
I have to say, I think Roberto has done some very fine work in this analysis based on "The Hubbert Parabola". He uses a variant on HL to calculate URR (ultimately recoverable reserves) based on production so far. Then he looks at how the estimated URR would have changed over time. Does it stabilize? Or is it constantly changing?
Then he also looks at the question, suppose we called "peak" when cumulative production so far Q(t) is greater than 1/2 of estimated URR(t) on that date, how well does that work? He analyzed it for several dozen countries individually and plots the results.
The bottom line is that it works well for some countries and poorly for others. For example it works pretty well for the U.S. It would call peak in the late 70s, a few years late but not too far off. But for other countries, such as Saudi Arabia, it doesn't work at all. The URR estimate for SA has been going up every year since the mid 80s. It's now at 180 Gb and it looks like it's probably going to continue to rise. Also, SA appears to have been in a "post-peak" state since about 1983; ever since then, cumulative production has been greater than 50% of estimated URR based on data up to that year. The method falsely calls the peak at least 20 years early, in the case of SA.
The bottom line based on his analysis is that it works OK for about half the countries and not at all for the other half. We really can't tell from this method what the URR will stabilize at for Saudi Arabia but it looks likely to be substantially above today's estimate of 180 Gb.
It should be noted that this "Hubbert parabola" is a little different from Hubbert linearization, but mathematically it is based on the same equation, just fitting it a little differently. I suspect we would see qualitatively similar results with a straight HL analysis, if someone were industrious enough to repeat Roberto's work using HL. This is really nice work that Roberto has done.
Robert,
first of all let me thank you for using your talent and time for sharing in the search of getting a better understanding of HL. I consider it to be VERY important that we can objectively rely on the tools used to predict URR and production profiles, and that these tools should have been subject to professional, rigorous and independent validation.
One of the true challenges in the PO debate is that we don’t really truly know the World’s URR, apart from what it is often referred to based upon data from BP Statistical Review, World Oil etc., and we are presently (more or less) flying blind in trying to predict URR and future production profiles.
Your “THE IDEAL PRODUCTION CASE” where production grows by 5 %/year until 1980 and then starts to decline by 5 %/year indefinitely leads to some interesting observations and questions.
Prefix G = GIGA or Billion (as most of you prefer), Gb; Giga barrels.
How many years would it take to recover the assumed URR of 5 000 Gb of Oilsville with this scenario?
By 2050 your proposed profile would have recovered a cumulative of approximately 850 Gb and the production would have shrunk from an annual high of 26 - 27 Gb in 1980 to approximately 0,7 Gb in 2050. Truth is that if Oilsville knew they were still sitting on huge remaining recoverable reserves, they would employ remedies (technologies) to try to counter the decline and maintain production as high as possible. (Sound familiar?)
That would surely also influence the HL estimate for URR.
(It takes millennia to recover your assumed 5 000 Gb.)
It could be useful if you also posted the production profiles from which your HL graphs are derived.
As a “real life” test of the HL you could perform it for NCS (Norwegian Continental Shelf, a region that in no way has been restricted in its oil production (with oil I here refer to crude oil) with NPD data.
What I got was that HL with the NCS data for the years 1982 – 1998 resulted in a URR of close to 29 Gb, which (could of course be a pure coincident) is close to identical with NPDs estimate, which I am quite sure is not based on HL).
Further the HL of NCS production data for the years 1982 – 1998 generated a production profile for NCS suggesting a peak in 2000/2001 (Norwegian oil production peaked in 2001) and oil production from NCS has, as of 2006, closely followed the production profile generated from said HL.
By doing a HL with the data for the years 1982 – 2006 the HL predicted a lowered URR of 27 Gb. In other words as more data were used for the HL for NCS, the URR shrank.
Now guess what?
The NPD in their resource accounting for 2006 (recently published) has slightly revised down the URR for NCS.
These are hard historical facts, so I hope you Robert generously would share your expertise in explaining why HL so far has performed so well on NCS.
Rgds
NGM2 (in Norway)
I won't speak for Robert, but my answer would be that NCS is a "region that in no way has been restricted in its oil production".
How many years would it take to recover the assumed URR of 5 000 Gb of Oilsville with this scenario?
I have been looking for this question for half an hour. I read it earlier, intended to answer, and then lost track of it. In the ideal case, the URR is not 5,000 Gbl. It converges to 861.3 Gbl. You reach 95% of that value after 70 years of production.
As a “real life” test of the HL you could perform it for NCS (Norwegian Continental Shelf, a region that in no way has been restricted in its oil production (with oil I here refer to crude oil) with NPD data.
That is probably one worth taking a look at. I have a few that I intend to look at, but as I said I could spend all my time looking at one scenario after another. What I would like to see is someone produce a case in which the HL would have accurately called a peak, and the parameters used to call the peak at that time (as opposed to 5 years earlier or later). I don’t think it can be done.
RR, thank you for your reply and sorry for my late response,
Again, the production profile of your HL of the IDEAL PRODUCTION PROFILE with a cumulative of 860+ Gb should have accompanied your essay.
Why wasn’t it?
(Do you get my drift here.)
10 Gb/a from day one, no resource constraints, builds to 26 Gb/a in 20 years?
Why is the linearization in all your graphs of the IDEAL PRODUCTION PROFILE always done with the 10 latest data points?
From what I have seen I don’t think it is fair to try to point out potential weaknesses of the HL method by constructing a highly hypothetical production profile that bears no resemblance to anything that has been observed in real life.
I will admit that SA is a tough one.
From what I know about oil producing regions are that these consist of a “basket” of fields and usually the biggest are found first and are also the first to be put in production. Later on new and normally increasingly smaller discoveries are made that becomes developed and, if found economical, put in production. This is probably one of the many observations Hubbert made.
I think it is both welcome and admirable that talented people challenge the HL, but it should be done in such a way that it closely mimics the real world.
Some years ago when I discussed the HL method with a US professor (in Ohio), who has written books and other papers about HL, he cautioned that people expected too much from the HL method, which should be considered a simplistic tool for predicting URR (or more precisely (and hopefully) an acceptable range of the URR) and deriving production profiles.
As far I have observed of the HL method it has performed quite well for regions where quality data have been available, like NCS.
I have also used HL to estimate URR from several of the producing (bigger) Norwegian oilfields (that is those which NPD has estimated to have a URR above 200 Mb), and HL has predicted the URR to within a few percent of the estimates published by NPD. I have monitored how the HL has performed through the years for several of these Norwegian fields, and the HL predicted higher or lower URR for some of these fields, and guess what…….as time elapsed NPD revised the URR numbers for subject fields in the same direction as predicted by HL.
I have come to that probably the best method to make a good estimate on the peak would be to do a complete bottom up analysis of all the worlds oil producing fields, predicted future production (this is THE tough one!), fields sanctioned for development, discoveries with assumed start up dates and profiles and a statistical model of Yet To Find.
Even such a rigorous analysis would also have its shortcomings and still leave us with a time span of a few years where the peak most likely would happen. (If it could be completed in time.)
I have observed that it poses great challenge and great understanding or “intuition” to make good predictions of annual decline rates. I was considered being overly pessimistic as I presented expected decline rates for some of the Norwegian fields some years ago.
What history proved?…… I had not been “pessimistic” enough. This can clearly also now be observed for Cantarell.
To use a lot of resources and talents to predict the exact year of the peak is, at best, an academic exercise.
We will only know the true date of the peak some time after. What we should do was to complement many of the excellent analyses presented on TOD with identifying good proxies of the peak as times elapses, like;
Stagnant global oil production
Volatile and increasing prices
Gradually increases in Sulphur content and decreasing API
Any other?
Rgds
NGM2
(Who is grateful for your patience with my English)
Hello NGM2,
Thanks for your post.
re: "We will only know the true date of the peak some time after. What we should do was to complement many of the excellent analyses presented on TOD with identifying good proxies of the peak as times elapses, like;
Stagnant global oil production
Volatile and increasing prices
Gradually increases in Sulphur content and decreasing API
Any other?"
I'd very much like to see this line of discussion continue. Would you be willing to write this up as a guest post (assuming I'm within bounds to suggest it)?
And also suggest any other way I (or others) might be able to support this line of thinking?
I offer a quote from a prof in Ohio (James Evans) who wrote in to the journal "American Scientist" (July/Aug/2006) Perhaps it is the same prof.
"Should geologists push (and push hard, I would argue) their data and evidence to force the policy debate - or should we wait for political consensus to emergy? And what if that is when the last drop of oil is gone? Wouldn't that be personally irresponsible? How is that 'good science'?"
Hello Aniya,
It was not the professor you mentioned I refferd to, the one I refferd to has among, many other things, written a paper with the title ”Oil Depletion in the United States and the World”.
"Should geologists push (and push hard, I would argue) their data and evidence to force the policy debate - or should we wait for political consensus to emergy? And what if that is when the last drop of oil is gone? Wouldn't that be personally irresponsible? How is that 'good science'?"
I think not only geologists should push their data, but aslo professionals who have a detailed knowledge of reservoir and production engineering or to put it in more general terms; an interdiscipinary group needs to get organized or organize themselves to study available data and trends to try to establish a picture of actual developments and what these may lead to of future trends/developments.
(personally I am not impressed by the profiles published by ASPO/Campbell as many of them are based on (at best) very simplistic assumptions)
I think one route of action is to document how (what I refer to as) insitutional forecasts (from EIA, IEA and others) have performed lately (during the last 5 - 10 years) compared to actual developments in oil and nat gas production and reserves.
It may be that this could be an approach which could get wider attention. Most decision makers use these institutional forecasts as basis for the design of the future, and 99 % of all the folks in industialised economies bases now their faith in these institutional forecasts.
Fact is that through recent history these forecasts have been met with increased energy supplies from all sources. In other words as none of these institutional forecasts have yet come up with any red flags, why should not decision makers continue to put their faith in them?
They may notice many good discussions, like here at TOD, but as many debates focuses on understanding the uncertainties (which of course I consider important) of various methods, it will become hard for them to use data, analyses or opinions forming on TOD. Any decision maker that now dares to deviate from these institutional forecasts will most probably be put to other lines of work if he/she dared.
I believe that we should not wait for political consensus to emerge (Titanic has most likely sunk by then). I think like it was expressed by professor Hatfield in a recent post here at TOD “It is already too late.”
I am considering, and being encouraged (by some TOD contributors), to write a guest post about how some institutional forecasts have performed recently relative to actual developments for countries, economical blocks (like OECD) for oil and nat gas.
NGM2
nrgyman2000, you said, "I think one route of action is to document how (what I refer to as) insitutional forecasts (from EIA, IEA and others) have performed lately (during the last 5 - 10 years) compared to actual developments in oil and nat gas production and reserves."
Recently, Andrew Weissman, Editor-in-Chief & Publisher, EnergyBusinessWatch.com, did two excellent posts at EnergyPulse, "Playing with Fire - The 10 Tcf/year Supply Gap - Part I" www.energypulse.net/centers/article/article_print.cfm?a_id=1388 and "Part II" http://www.energypulse.net/centers/article/article_print.cfm?a_id=1397 . Part I briefly touches on EIA's U.S. nat-gas projection failures, but Part II covers these in detail. Failing to address the No. American nat-gas crisis while there is still cheap oil is likely to be a big story of the next decade.
kebu77
Thank you for the links.
Weissman normally presents in depth and reflective analysis.
I will read (printed the posts and comments in pdf files) and start translating my posts on the Norwegian blogspot http://energikrise.blogspot.com/ about this issue, which I have been encouraged to submit posting on TOD Europe..
From what I have seen nat gas markets (to put it carefully) will be very tight both in North America and OECD Europe in the near future.
Again, the production profile of your HL of the IDEAL PRODUCTION PROFILE with a cumulative of 860+ Gb should have accompanied your essay. Why wasn’t it?
That was explicitly stated in the essay. I wrote “861.3 Gbl.” No hidden data involved. I explained exactly how the data were derived. Three minutes with Excel and anyone can easily produce the same data set (except for Saudi, which will take a few more minutes to dig up).
(Do you get my drift here.)
If the drift is that I am somehow selecting cases or manipulating data in order to get a desired conclusion, the drift is way, way off base. But that hasn’t stopped others from making those insinuations.
Why is the linearization in all your graphs of the IDEAL PRODUCTION PROFILE always done with the 10 latest data points?
Because that’s the way that those who use the HL for forecasting do it: They select the most recent data to do the forecasting. See any of the HL forecasts. They are selecting the recent slopes.
(Who is grateful for your patience with my English)
I once walked into a restaurant in Norway and asked a waiter if he spoke English. He looked at me with a puzzled look and said (in flawless English) “Of course I speak English.” What I found, when traveling around Norway, is that all Norweigans seem to speak flawless English.
RR,
I did not mention anything about hidden data, but I think you should agree upon that it would have been useful for the readers if the production profiles (scenarios) had accompanied your post. (My mistake that I did not see that you changed the sizes of reservoirs between the various scenarios.)
Not all of the readers should be considered to be experts with Excel and expected to generate production profiles on their own.
I think, as I probably have written earlier, that it is important to understand and caution about the limitations of the HL.
I will agree that “cherry picking” the data is not a convincing, professional or prudent procedure. I have observed that estimates of the URR changes with time or as different data sets are being used.
What I genuinely is hoping for is that the HL could provide a range with good confidence of the URR and thus derived production profiles.
I also think that this was what Hubbert used, a range for the URR and the derived production profiles.
The range of the URR and derived production profiles could then be subjected to statistical analysis (or other and perhaps better ) procedures to generate a range of the future world oil production profiles.
NGM2
Hmmm....
So are telling me "the best and brightest" have absolutely no clue about oil production?
I find it absolutely impossible to believe with all the 3-d siesmic technology that I saw on TV that is used in the GOM (underwater no less!) to find ever increasingly small resivoirs of nat. gas that you guys are clueless.
This whole industry is flying by the seat of it's pants? You have absolutely no idea what is left? BS- I'm not buying this in any way.
When the CEO of shell oil makes a 50 stop tour and says "easy oil is over" I think this is HUGE. It is a warning of what there is to come. Unless he is just a dumb bastard and gets paid too much which I doubt very much.
Good luck not spooking the herd in the next two years...better get pumping all that oil...its almost summer ...I need to go to disneyland...
"over" and very much "out" of here..
That would have been a great analogy if it was at all historically accurate, but the Carpathia actually arrived almost two hours after the Titanic sank. Only the folks in lifeboats, and some that were later pulled out by the few lifeboats that returned, survived.
Some noble fellows declined, but in general the higher your class, the higher your chance of making it into a lifeboat. I suspect this is already true WRT any disasters that are in store for society.
No doubt they tried to keep warm arguing about whether the bow or the stern would hit bottom first.
But at least they were some comfort to the doomed.
http://en.wikipedia.org/wiki/Sinking_of_the_RMS_Titanic
As far as the analyses, even I know that Hubbert had a good feel for URR; he used those estimates in conjunction with his curves.
I have a question. What the heck function did you use to model hypothetical oil production? I can think of lots of functions that will give erroneous results when applying HL to predict peak production. If you'd have used the logistic function, for example, it would give a correct linear prediction. I suspect some cheating has gone on here.
Here is what has been modeled so far: Real production for Texas and Saudi, hypothetical flat production, hypothetical rising production, and then a production profile that rises and then falls. What these do is show how the HL will behave under various conditions. That's not "cheating" that's how you test models. For instance, it doesn't matter why production is rising, what the analysis showed is that the HL can't predict peak while production is still rising. The HL is going to underpredict the URR for a region undergoing flat production.
What has really been an eye-opener for me is how many people are ready to toss out the conclusions because some of the scenarios are hypothetical. What that tells me is that they don't know the first thing about modeling.
Of course flat production or rising production would give misleading results if you apply HL. Common sense tells you that flat production, for example, tells you nothing about peak production. Its the production profile that rises, then stops rising and eventually falls that HL should have some predictive power. The example given in which production rises 5% per year and then abruptly starts declining 5% per year is unrealistic. Real world oil production follows a more gentle curve which the HL technique is based on. Granted, real production for Texas and Saudi is problematic because the data is so damned noisy (probably due to various political, economic, and technological influences). That's a limitation of modeling.
My point is that if you use a more realistic production model based on the logistic curve, or something similar, it will be linear (or near-linear) and predict the correct peak, URR, etc. I find the "hypothetical" argument wanting. The problem with modeling real world data exposes the real problem - the data is horribly noisy due to external constraints - geopolitics, technology, etc. - that cause undulations in the production curve that throw the model off.
Common sense tells you that flat production, for example, tells you nothing about peak production.
Yet Saudi demonstrated flat to rising production for a long period of time. Only in the past year has production turned down. So you should not expect the HL to call a Saudi peak with any sort of precision.
The example given in which production rises 5% per year and then abruptly starts declining 5% per year is unrealistic. Real world oil production follows a more gentle curve which the HL technique is based on.
So then show me a case where it would have worked - hypothetical or otherwise - or admit that it isn't a reliable tool for making predictions.
So then show me a case where it would have worked - hypothetical or otherwise - or admit that it isn't a reliable tool for making predictions.
The HL technique is based on the relation P/Q = a(1 - Q/Qt), where P is production and Q is cumulative production. It is a linear relation between P/Q and Q. If P is replaced with dQ/dT, the result is the Verhulst equation, whose solution is the logistic function. Therefore, any hypothetical data set using the logistic function will show a linear relationship and give the correct peak. In the case where the correct hypothetical data set is used, HL gives the correct answer. I never said that it is a reliable tool for making predictions in the real world. As I pointed out, variation in production due to external influences create "noise" in the data which may preclude accurate prediction. However, I think the way that the hypothetical argument was framed was disingenuous. You generate data using a function that doesn't obey HL, and then use it to discredit HL.
What RR did was fair. The Verhulst/Logistic solution is purely empirical and therefore you should be able to compare it to hypothetical data. On the other hand, if the equation matched some physical process, then it would be shaky to make the comparison against hypothetical data since the fabricated data would need to conform to the physical model. Deviations from the real model would become quite evident and in that case you could reject the model.
AFAIK, no fundamental physical process matches the Verhulst for oil production. Somehow it got adopted as representing reality without going through any first-principles arguments.
And then the momentum kept it going with very few questioning its validity.
This statement
was unfair and uncalled for.
However,
Is a bit off as well.
If HL is intended as a model for unconstrained logistic-type production profiles, then testing it using data that don't fit such a profile isn't a very good test. That's like testing a climate model by putting stock price data into it.
I asked above, does the HL do any better for a logistic function? That doesn't seem like an unfair question. I suspect that one problem is attempting to linearize at all, some higher-order function might make more sense, but even there it would probably only be able to deal with an ideal unconstrained case. It's also probably a huge problem to assume unconstrained production, since that doesn't seem to happen in the real world. It would be helpful to know if HL works in the unconstrained logistic case, but you've certainly made your point that we can't rely on it - at least not alone.
If HL is intended as a model for unconstrained logistic-type production profiles, then testing it using data that don't fit such a profile isn't a very good test. That's like testing a climate model by putting stock price data into it.
But feeding it hypothetical data makes no assumptions on whether production is constrained or unconstrained. The numbers don't care what they are. The model tells you what the prediction is going to be, and it told me that it isn't going to be right.
For all of those who have criticized the hypothetical data, nobody has stepped up and shown any case that would have worked. Some (not you necessarily) are operating on faith that it does work. Show me.
I run process models all the time. I will feed the model all kinds of step changes and trends. If the model responds in a way that I know is not indicative of reality, then I have a problem. It doesn't matter if the step change itself is indicative of reality.
In a lecture given at the Fermi National Accelerator Lab, Dr. Robert Kaufmann allows that he would most assuredly be proud to have had something like the Hubbert HL of the Lower 48 in his own academic record. That said, In Dr. Kaufmann's ASPO lecture in Boston 2006, he points out generally that Hubbert was at least as lucky as he was brilliant--specifically wrt to the HL. I think the two comments reflect, as best as I can gather, where we are left with the Hubbert HL wrt to its success, and its predictive value.
My take is that people are going to keep using the model because on balance using it seems better than not using it, frankly. We'll just use it in conjunction with other data. You see this all the time for example in the financial markets. Many models get very disappointing at times but you use them anyway. You use them, but you step back from them.
Perhaps R.R. would consider presenting at ASPO Eire this Fall.
Kaufmann Site:
http://www.bu.edu/cees/people/faculty/kaufmann/index.html
Gregor
I also appriciate RR's work. It's good to be critical and subject Hubbert to robust investigation and analysis. It's just a shame he's dead and unable to defend himself and his methods adequately. I'm sure he would have refined his methods and results if he'd been imortal.
There seems to be a consensus that Hubbert was brilliant and lucky. But in this context what is luck really? How far does one create one's own "luck" by being in the right place at the right time with the right ideas? How much of success can be put down to mere chance? Couldn't one argue that what we call "luck" is really something else which we as yet don't fully understand? Perhaps luck is really focused and intuative intelligence. Do we mean that Hubbert was just guessing about the future in some respect?
Robert
Clearly you put little stock in HL, and further you don't think the evidence that Stuart presented re; sa nosedive is compelling. Meanwhile, from a previous thread, you are a betting man. Instead of a large bet, consider the four nominal ones, each $25, for a total of $100; winning all might just get you and a friend out of a steak house (petite cuts, sans vin... however, depending on the odds you determine, the total might end up including wine, further assuming inflation over the period is modest.)
For each, indicate what you think are the appropriate odds, such that you would take either side. 2:1 means the short side pays 25, the long side 50. Note the different start dates between bets 1/2 and 3/4.
Values are crude only, as shown by EIA. In the event any bets are in question end 2009, final determination will be EIA values first published for all 2009.
Gang of four bets:
1. Beginning 1/1/07, what are the odds that sa will average 9Mb/d in any twelve month period ending 12/31/09.
2. Beginning 1/1/07, what are the odds sa will average 8.5Mb/d in any twelve month period ending 12/31/09.
3. Beginning 1/1/08, what are the odds that sa will average 8.5Mb/d in any twelve month period ending 12/31/09.
2. Beginning 1/1/08, what are the odds sa will average 8Mb/d in any twelve month period ending 12/31/09.
Clearly you put little stock in HL...
And hopefully the reasons for that were clear. If it had made some predictions with precision, that would have been a different story.
further you don't think the evidence that Stuart presented re; sa nosedive is compelling.
I actually like Stuart's argument. I think his analysis was rigorous. The data are open to interpretation, though, and he will acknowledge that. And I still say that the Saudis have made moves consistent with market demands.
Meanwhile, from a previous thread, you are a betting man.
It depends. I am not a gambling man. If you bet me that oil prices will reach $100 this year, I will take it because it is a low risk bet from my perspective. If you want to bet that the Cowboys or Redskins will win the football game, I will pass.
Gang of four bets:
Well, they are all dependent on more than whether than "can" do it. They depend on demand. If it was simply the former, I would say all 4 are likely. I think demand will definitely be high enough to satisfy 2. I think 9 MM bpd is pretty reasonable, but it remains to be seen what the long term effect on demand these high prices will have. But are they sure things? No.
Robert, it is not a surprise for me that HL fails in the first two cases : they assume that the production does not depend at all on the URR; it's obviously quite different from the logistic law. The third one is more similar, but it has some strange features : the production growth is discontinuous, being + 5%/yr before the peak and - 5% after : no plateau, no sign of pre peak inflexion. Nevertheless, the error on the QT is only 20 %, which means 4 years with a 5 % growth. Well it depends if you consider that a 4 years error on the peak date is acceptable or not... I wonder if anybody remembers the exact date of the greatest extent of Roman Empire within 4 years...
In any case, I doubt that our reactions to PO will be very different in 4 years. This is obviously not a very long time to build millions of windmills, cover thousands of square kilometers with solar panels , or master thermonuclear fusion. More important, it does not change at all the perception we could have before the peak. As for GW, I would ask : what is the consequence of being to pessimistic about the date? what is the consequence of being to optimistic?
Obviously the comparison with Titanic sinking is not quite complete...
I think you're right, its all demand dependent. Prices will rise throughout the year, and the resulting demand destruction and lack of buyers will force sa to continuously curtail production to match the declining demand curve.
An interesting related question is, "when will Russia, which also sells a substantial amount of production to Asian buyers, similarly be forced to curtail production as their buyers similarly disappear?"
Hi Robert,
I really apreciate your thoughtful articles and admire your evidence based approach to PO.
By reading your comments and articles, it's pretty clear that you absolutely believe in PO and its (possible) dire consequences. So, I have a question for you.
How have you become convinced about PO?
I've read that you have an estimation of PO timing, How have you reached that estimation?
Thanks
Fernando
I am new on this website - Thanks for letting me join
How have you become convinced about PO?
I've read that you have an estimation of PO timing, How have you reached that estimation?
I have been thinking about doing an essay on this. There are some very disturbing trends. Discoveries have clearly peaked. The oil majors have been unable to replace their reserves. Demand continues to grow. And a look at the mega-projects list indicates that there will be a very tight supply going forward.
There is a lot of ground to cover in those statements, but that forms the basis of my position. It is based more on observations than on attempting to model the data, because I haven't yet found a model that I have great confidence in. Due to the nature of the various production regions, it may not be possible to develop any kind of universal model.
Wow, what a fun discussion.
Using linear assumptions to predict real outcomes in a nonlinear world. Probably better than nothing.
As the Hubbard curve approaches horizontal, the slightest blip in the slope hugely affects where it ultimately intersects the x-axis.
I'd rather have a chart to look at or a self-styled compass to give its opinion on where we may be headed. Better that than just sitting blindfolded on a spinning stool.
A Hubbert curve does not approach horizontal slope with a logistic law, but a constant negative slope. The horizontal asymptot holds only for infinite Qt. But again, a minimal condition for the HL method to work is for me that production depends explicitely on Qt ! if not, it is hopeless that a method based only on P(t) gives anything reasonable about Qt (the first two cases).
Wilbur,
This is not relevant. If you approach the x-axis, then a small blip would require a very large P increase, since Q is by then rather large.
So blips don't occur, without somewhere a new big oilwell being put in production.
The Logistic curve is not linear. HL applies a corrective factor to force it into a linear function.
Robert
I'm a layperson so please forgive me if I'm raising a point that's already been covered. But why the devil would one want to fit a line to recent data points rather than a bell curve to all of the historical data for a well/field? Naturally an extrapolation based on fewer data points will not be as good...am I missing something?
Hans Noeldner
"Civilization is the presence of enlightened self-restraint"
My math isn't good enough to explain it, but HL is in essence a way to fit the bell curve to historical data. A couple of transformations go between the down-sloping straight line of an HL plot and the time-domain bell curve of production.
The reason to use HL is that it makes fitting the curve to the data points an easy exercise, which you can eyeball with a ruler and pencil and come pretty close to the computed LS fit. You can apply the transformations in reverse if you wish to see the fitted bell curve. This post by Stuart explains some of the math:
...oildrum.com/story/2005/9/13/...
It sort-of makes sense to me, but I can't explain it as well as Stuart or Khebab.
Some other linearizations are posted here:
...oildrum.com/story/2006/1/6/...
, where you can see some of Khebab's work in the comment thread.
The closer the actual production curve is to an ideal bell curve, the better this works for prediction. What's being debated here is whether the current world production curve is distorted by political/economic manipulation, and whether the published figures have been munged for political/economic reasons, making the bell curve a less accurate approximation.
Robert's keypost here is to show how poor the HL technique may be, given a highly manipulated, clearly non-bell shaped, production curve.
Mexico is in decline, their decline is not as steep as they have new projects and replaced 47 percent of their production in 2006. There was no decline between Jan and Feb PEMEX production figures, but they are very worried about coming declines and not having enough money to prospect and develop enough new structures.
OPEC has cut back some production is another factor.
Part of Nigeria and Iraq are shut in due to violence.
The DOE country analysis pages have been updated to predict Ecuador and Malaysia are at or very near at least a temporary peak in production and will decline over the next two years.
I am worried about the ultradeep projects and the engineering for pressures several miles under the GOM. In a deep Idaho silver mine the rocks exploded as drillers released pressure with their hammer drills thousands of feet below the surface. It seems we do not have prolonged production data yet.
The recent upwards P/Q data points in the Saudi HL for 2004, 2005 and 2006 may have been due to Saudi Arabia using the latest technology of intelligent fields, smart wells and MRC wells to overproduce their fields to take advantage of high prices as explained below. Saudi’s recent wave of the latest technology applications recently started in late 2004. If they were overproducing then Saudi’s URR is probably closer to 170 Gbl.
Saudi Arabia’s Rapidly Thinning Oil Columns require Smart Wells and Intelligent Fields
From Saudi Aramco’s press kit page 11:
http://www.saudiaramco.com/sa/webServer/presskit/press_kit_full.pdf
”Technological Advances
Smart Wells and Intelligent Fields:
Smart well systems and down-hole sensors are part of a larger strategy to develop “intelligent fields,” an approach that combines real-time monitoring and timely reactions to changing well and reservoir conditions to optimize production and reservoir management. Overall, the company completed 24 smart well installations in 2005 (versus two the year before), and 55 maximum reservoir contact (MRC) wells, more than double the year before.”
To perform the above they needed one of these, a
”Geosteering Operations Center (GOC):
To further exploit the technological gains of horizontal, multi-lateral and MRC wells, Saudi Aramco opened the Geosteering Operations Center (GOC), where geologists and engineers remotely guide drilling activities in real time, around the clock, helping ensure that every well is optimally situated.”
In 2004, Saudi Aramco completed two smart well installations. In 2005, they completed 24 – that’s a twelve fold increase in one year! The world’s first smart well installation was in 1997 for SAGA Petroleum in the Snorre Field, Norway.
http://www.halliburton.com/news/archive/1997/hesnws_090497.jsp
Why do we need smart wells?
According to Martin Madsen, Production Engineer Visund, Statoil,
http://bergen.spe.no/doc/1%20day%202006/Presentasjoner%20PDF/Peer%20Gynt...
”– Compensate for different reservoir properties
•Pressure, PI etc
– Balance inflow
– Close / choke back zones with high GOR or WC
– Save intervention (time and money)
– Take into account the unexpected”
Point three above is important as zones with gas or water breakthrough can be closed or choked back using “above ground” controls. In other words, in these zones the column of oil can become too thin to extract. (GOR – gas oil ratio; WC – water cut)
Smart well studies by Baker Hughes
http://www.bakerhughes.com/bakerhughes/water_management/completion_IWS.htm
The use of smart wells can increase ultimate recovery by 53%. The main reason for this increased recovery is the improved ”management of undesirable fluids”.” (The undesirable fluid is water.)
On an annual basis, from 2004 to 2005, Saudi Aramco has a twelve fold increase in smart well installation completions from 2 to 24; and a two fold increase in MRC well completions to 55. (would be nice to have 2006 data – Haradh Increment III was completed in early 2006 with 32 intelligent MRC wells – intelligent=smart. I don’t know if these 32 wells are partly counted in 2005 data)
For more information about smart wells - this website is good.
http://www.welldynamics.com/technology/installations.htm
Welldynamics have installed 228 smart well up to October 2, 2006. They state that this is more than 50% of the world's smart wells so it could be assumed that there are about 400 to 450 smart wells worldwide.
This is a link to Shell's snake well technology, (I think a type of smart well as it uses smart technology). The video on the right is worth playing. It states that without this technology the oil was previously inaccessible.
http://www.shell.com/home/Framework?siteId=technology-en&FC2=/technology...
As mentioned above, Saudi Aramco is using intelligent fields and smart wells:
Article on intelligent fields
http://www.spe.org/specma/binary/files/547715699777Syn.pdf
also can be called smart or digital fields
http://www.digitalenergyjournal.com/DEJ2.pdf
From page 15 of the link above (dated June 2006):
”Fahad Al-Moosa, VP drilling and workover, Saudi Aramco said the company is promising output capacity of 12m bpd by 2012, compared to around 8 mbpd now. It will achieve this, he said, using geosteering for drilling, smart wells and intelligent fields.
“We will use smart technology to reduce water encroachment and prolong well life, with real time monitoring and reacting to change,” he said. “We see this as strategic for the future direction of our industry.”
Aramco has implemented this type of technology in the Haradh III field, part of the
giant Ghawar field, he said. “We started working on this a few years ago.”
“In the beginning, there were some problems, but we were able to get this moving very well.”
“We are building experience. It is very reliable real time data. We are moving
strategically in this direction,” he said.
Water advance through the reservoir, as a result of water injection, is a particular concern and something Aramco is monitoring carefully, he said.
“We are looking at mature areas where water is already advancing – real time
monitoring helps control the advancement of water,” he said. “We want to make sure we are maximising the ultimate recovery.”
“Service operators and others really need to get together,” he said. “We need to identify solutions, how to develop and encourage it. And no-one will develop something if there isn’t a market for it.”
Al-Moosa’s comments above are from the SPE Intelligent Energy Conference held in Amsterdam in April 2006.
http://www.intelligentenergyexpo.com/page.cfm/ID=1/trackLogID=7429_A18D1...
In April 2006, the EIA states that Saudi Arabia was producing 9.35 mb/d (including about 0.25 mb/d from the Neutral Zone).
http://www.eia.doe.gov/emeu/ipsr/t12.xls
Al-Moosa said that for April 2006 that Saudi Aramco’s output capacity was much less at around 8 mb/d! Has Saudi Aramco been its advanced technology to overproduce its fields to take advantage of high oil prices? This provides further evidence that Saudi Aramco was supply constrained as shown by Stuart Staniford’s graph from his key post.
http://www.theoildrum.com/node/2331
The aggressive development of intelligent fields, including the huge increases in smart well installations and MRC well completions from 2004 to 2005, strongly indicates that Saudi Arabia is now extracting its last remaining oil reserves – difficult to extract oil from their rapidly thinning oil columns. Saudi Arabia's oil production rate may already have passed its peak.
Here is an article stating that in early 2006
http://www.post-gazette.com/pg/06191/704785-28.stm
"in a critical trial of Saudi Arabia's heavy-oil potential, U.S. oil giant Chevron Corp. began a field trial of a technique designed to pump out heavy oil that was previously considered unrecoverable. In the pilot project, which it plans to expand to additional wells, Chevron is injecting steam to loosen up sludge-like heavy-oil reserves in Wafra, a field in the so-called neutral zone between Saudi Arabia and Kuwait. Oil from the neutral zone is shared equally by the two countries.
Chevron and the Saudis say initial results are promising and that the technique could greatly enhance recovery at some huge fields.
In Oman, Occidental Petroleum Corp. is preparing to spend $2 billion on a large-scale steam-injection project in the Mukhaizna field, which holds about a billion barrels of oil.
Although it hasn't specified it will use steam flooding, Kuwait is planning a pilot project to exploit its northern heavy-oil fields."
This is more evidence that Saudi Aramco is supply constrained and that their peak oil production rate may have passed.
The last frontier of oil - Middle East tar sands?
Excellent post!
I'm a little confused as to why the final case is referred to as "ideal". Like the other examples (constant production and rising production) it seems very artificial, and it doesn't surprise me at all that HL would do a poor job of describing it.
Generally, I would expect the following qualitative features of any curve that was "approximately Hubbertian", regardless of mathematical details:
1. An initial period of exponential rise, during which the production profile was concave upward.
2. An extended inflection region, where the curve slowly turns over, subsequently becoming concave down (but still rising), then flat, then begins to decline (still concave down) at a slow rate.
3. A final period of exponential decline, during which the curve is again concave upward.
If you were to plot any of the cases above, they display very different quantitative behavior. Even the last case, which is called "ideal" for some reason, where the curve instantly reverses from exponential rise to exponential decline, will be missing the middle region-- which is precisely the region that is being used to predict peaks in cases like Lower 48. It just peaks to a sharp point, then instantly changes direction without ever passing through any inflection points!
I'm very sympathetic to the case that RR is making here, and I'm inclined to believe that if he had used more realistic production histories (with the above qualitative behavior) he would have still found HL to often fail to be quantitatively accurate. That would have made a strong case for disbelieving HL for Saudi Arabia, where the production bounces around in ways that make it quite far removed from the sort of curves seen in Hubbert's original paper. And I certainly don't believe you'd ever be able to use HL to distinguish between a future with a long plateau and a future with a rapid decline.
But I'm perplexed as to why, instead, he choose to use highly unrealistic cases where it fails more catastropically. One of the two cases above causes the flat, zero-derivative "peak" region to be stretched out infinitely. The other causes it to be chopped out completely, replaced by a function with a second-derivative singularity! These are precisely the two cases where you are most egregiously distorting the "normal" shape of the Hubbert curve right as it is passing through the center, the region that everyone claims is most important in making a fit.
The whole thesis of the Hubbert linearization method is that production curves should have (roughly) a logistical shape, and so using curves that have shapes far removed from this case are destined to fail spectacularly. In effect, it's a method that involves comparing a real production profile to a hypothetical production profile, and assuming that if the front half of the real profile looks like the front half of the hypothetical, then the back halves should look alike. It's nothing more clever or sophisticated than that. If you test the HL predictive method using curves that don't look like Hubbert's curve, well then, of course they will fail.
This post is useful in demonstrating, however, that having a logistical shape is an assumption of the method. The farther the deviation from that shape, the worse HL becomes. I think that's a good reason to be very cautious about applying it to irregular data sets from swing producers.
I'm a little confused as to why the final case is referred to as "ideal".
Because it is an idealized version of a typical production profile: Production rises for some number of years, and then goes into decline. It seems to me that people are not really understanding the implications of the hypothetical cases, and are quite happy just to dismiss them because they are hypotheticals. In fact, the hypotheticals show how the HL would behave under a certain set of circumstances. Generally, the ideal production profile is going to resemble the actual production profile of a country. Plug in whatever number prior to and following peak that you like: You will see that the ideal case has shown you how the HL is going to behave.
I'm very sympathetic to the case that RR is making here, and I'm inclined to believe that if he had used more realistic production histories (with the above qualitative behavior) he would have still found HL to often fail to be quantitatively accurate.
But I have used actual production histories. I have looked at Texas, and now I have looked at Saudi. Texas failed badly. Saudi is evolving. So the actual production histories I have looked at aren’t behaving either.
But I'm perplexed as to why, instead, he choose to use highly unrealistic cases where it fails more catastropically.
Plug in whatever assumptions you wish. A flat production profile, which we have seen in KSA, is going to behave as was predicted by the flat production case. The rising case shows that peak can’t be predicted prior to the production actually turning downward. Personally, I find value in this information.
"Demonstrate any case – real or hypothetical – in which the HL would have predicted a peak in real time."
P = exp(-(1970-[1940:2000]).^2/100);

Q = cumsum(P);

PQ = P./Q;

linefit = polyfit(Q(24:31),PQ(24:31),1);

figure(1), hold on, axis([0 20 0 0.4])

plot(Q,PQ,'ko',Q(1:10:end),PQ(1:10:end),'rx')

plot([Q(24) Q(31)],linefit(1)*[Q(24) Q(31)]+linefit(2),'k')

plot([Q(24) -linefit(2)/linefit(1)],[linefit(1)*Q(24)+linefit(2) 0],'k:')
For those who don't speak Matlab, P(t) is gaussian, peaking in 1970 with sigma = 10 years. For the HL, I've marked every 10th year in red, and fitted the 1963-1970 points. In 1970, your guess at URR would be within 5% of the true value, and you would call peak as Q/Qt = 53%.
As I understand it, the linear portion of HL is an expected consequence of a negative second derivative of P (3rd derivative of Q):
Q''' = -2k where k is a positive constant
Q'' = -2kQ + b
Q' = -kQ^2 + bQ + c. Q' is production (P), so we set the offset constant for production (c) to zero and divide through by Q:
Q'/Q = P/Q = -kQ + b.
So HL should be reasonable for production curves whose central portion is sufficiently smooth with an approximately-constant negative second derivative e.g. parabolic-downward. None of Robert's test cases resembles this (his "ideal case" is very sharply peaked in the middle).
That said, I feel that in most real-world cases the production curve is not sufficiently smooth. Norway is the best example I've seen, and Mexico looks likely to follow, but too many countries (including SA) have big swings in their production curves, and nothing resembling a constant second derivative.
peace,
lilnev
Thank you. I would have tried to add something like this but I've been busy at work. If hypothetical data based on a reasonable functional form for production is used, such as a Gaussian or logistic function, fairly good estimates for URR and Qt can be obtained, as you've shown. Robert's functions (constant production, increasing production, discontinuous change in the production slope) are simply not adequate to disprove the predictive ability of the HL technique. For real-world data, the problem is the noise in the data, not the data fitting method.
Hello Lilnev,
[BTW, thxs to R-squared for this keypost, and to the other TODers who replied.]
Thxs for posting this in an effort to create a better model. Hopefully, Khebab, SS, RR, WT, and others will evaluate your model for strengths and weaknesses. Unfortunately, I don't have the statistical expertise to do this myself.
I think the HL model could be greatly improved by some derating factor equation that would incorporate a decreasing ERoEI function, plus some smaller uprating factor equation for tech improvements. For simplification in an initial modeling effort: we would, for the time being, just assume past voluntary prod. chokeback distortions would equal the future distortions of delayed production infrastructure. This could always be factored in with more equations later once we had a basic formula, or interactive set of formulas, that would first chart ERoEI > tech effects upon production and reserve expansion.
In the real world: we know that depletion and declining ERoEI will eventually overtake any level of tech improvement in FF-production; the Red Queen treadmill effect of ever decreasing net energy. We just need to figure out this formula[s] first, then start refining it as the next generation of HL modeling. I am sure WT & RR could agree to this.
Bob Shaw in Phx,Az Are Humans Smarter than Yeast?
lillev,
There is an error in your calculation, because a HL plot of a gaussian curve starts at (0,0).
In 1970, your guess at URR would be within 5% of the true value, and you would call peak as Q/Qt = 53%.
Of everything you wrote, this is the most important. Why wouldn't you call peak at 48%, as has been done in some cases, or 58%, as has been done with others? These two values can span many years. So what we don't have are parameters that allow us to call peak with anything resembling precision.
It has become clear to me that the only time the HL can really call peak is with years of hindsight. Only then can you say 53% Qt. Otherwise, you have no idea whether it should be 48% or 58%.
*shakes his head*
this is another reason i don't really recommend this place.
your post was vindictive, and spiteful. using your contributer status to attack another person on this blog in such a manner speaks ill of you.
i no longer consider any information you give as credible, and recommend others to do the same.
Hey don't leave out this guy, cwilbur2000 with his:
Looks like a meany weeny to both sides.
By the way, does anyone have time to get into a highspeed elevator analogy?... where elevator operator Westexas gets off a floor or two too low with attendant angry passengers while elevator operator Robert takes them for the scenic view? ...No? well it has been a long and interesting time here but our days are drawing to an end.
Maybe though, I could presume on your patience with a trifle of doggerel somewhat suited to Titanics however they sink.
'We sat dark and silent as limpets in a wake,
wishing to fix the ship but afraid to rock the boat'
a twisted misshapen thing, but my own.
oops
I'm no meanie but I probably do deserve impalement for misspelling Hubbert.
That's likely okay with Robert...if that's any consolation.
This is another double post ...if it does it again I will talk to management.. sorry.
i no longer consider any information you give as credible, and recommend others to do the same.
Fortunate then that I and a number of others stopped caring about your opinion a long time ago. I can always count on you and Cherenkov to drop by, make some shrill noise, and not actually say anything. So I hope you are not under the impression that your dismissal of my credibility hurts my feelings. There are those whose opinion I value, and those I don't.
Robert,
I may have missed something in the past on TOD but as I saw it TrueKaiser was commenting on lilnev's delightfully complex (to my limited math mind) solution and making a Haw Haw great stuff Iilnev statement.
Laugh! I could hardly contain myself...medals should have been presented, laurels placed and you didn't get it? Shame! also shame tarring others with your, I feel, misconstrued brushwork.
But on the other hand and keeping with your mood of reproach, in your debate with Jeffery titled:
A Debate on the Substance and Timing of the Peak of Oil Production and Consumption, Part II
Your beginning paragraph :
I have never experienced apoplexy but I think you brought me close. First I think you could have treated your opponent with more respect and defined the debate before entering the lists. A point between you and Jeffery maybe, but when you say your opinion, about something you seem to suddenly have decided not to debate, is based on some things I can't discuss I start to gibber. I think you have previously decried the unfalsifiable in argument and here you have done just that, and that besides cutting your opponent off at the knees by refusing to come to the mark and discuss the timing of Peak Oil. Phooey I say, yes, and even doublephooey.
Robert,
I would agree that with the production profiles you propose HL would fail to predict the peak, however i would argue that neither of those situations
a) match the assumptions that HL makes, and as such are deliberately constructed cases where it does not work
b) contains enough information in the production profile to predict the peak by absolutely any means (note, in the production profile - using external knowledge it would be possible)
c) match any known production profile, as people are greedy.
The hubert curve assumes that the oil extracted is proportional to the continually increasing effort to extract the decreasing reserve.
In oilsville this assumption is violated as there , however with their exact knowledge of the size of their oil field, there is no need to to a HL, as everyone already knows exactly when it will run out.
In the ideal production case up until peak, the oil production has simply been an exponentially increasing function of time. with no deviation from a simple exponential, even you would caution that this is too early in the production profile to apply HL.
I might be wrong here - if so, would you be able to explain how such a production profile could arise?
The change of the growth rate by 10% in 1 year is not one that is likely to happen, given the constant nature of the growth up until that point. The resource has ~48% left at the hear before the peak, and you can increase production by 5% of your current rate, the next year the amount you extract somehow decreases by a large amount, despite the infrastructure in place to do the extraction.
Although a Hubert curve is symmetric, the front side and the back side are constrained by different things. As long as the curve is exponentially increasing, it is an infrastructure limited extraction, on the downward slope the %increase in infrastructure does not counteract the %decrease in the amount of resource.
it is the segment of the curve that is in between these two situations that allows both the URR and peak to be (theoretically/approximately) predicted. specifically i think that it is the inflection point (the point where the rate of increase begins to decrease) on the upward curve that is the most suitable candate for indicating that a HL could be sensibly performed.
Your ideal production curve is not actually the "ideal production curve" as the effort used in to extract the resources strongly decreases at the peak year - in some ways the ideal production curve (with a continually increasing effort to extract the resource) is actually what leads to the hubert curve. (note: not HL - that is a separate analysis tool to try to work out which hubert curve the current curve most strongly represents)
A more complete attempt to disprove the HL technique would be to have a continuous function that has a peak fail HL.
Any artificially constructed function with function a before time t and function b afterwards is not a sensible thing to try and HL, as the function in the first part does not have any information about the downward slope on the other side.
all up, while a few interesting points are raised, a discussion of a more sensible production profile would of been more constructive (in my opinion)
Andrew
i would argue that neither of those situations
a) match the assumptions that HL makes, and as such are deliberately constructed cases where it does not work
Well, your argument would be dead wrong. I wanted to find out how the HL would behave in a period of increasing production, flat production, and then an idealization of a country in which production rose, peaked, and then fell. There was no deliberate construction – despite the same suggestion by numerous people – to find cases where it did not work. I came up with the cases, and it didn’t work. I didn’t discard any of them.
In oilsville this assumption is violated as there , however with their exact knowledge of the size of their oil field, there is no need to to a HL, as everyone already knows exactly when it will run out.
Not in the ideal case. Production rose, peaked, and fell. You can plug in any assumptions you chose as to the rate of the rise, whether there is a plateau, and the rate of decline. I think you will be unable to extract any kind of predictive capability out of this data, which is my point.
It's evident in every HL analysis we see that oil production doesn't fit a logistic model and HL won't work except over a limited range of data that meets some restrictions. It's evident from the P/Q vs. Q plots. If oil production fit a logistic model they would be linear over the entire range, but none are.
Even over a limited range there are problems with HL. A good way to determine if a model is a good choice is to plot the residuals (P/Q actual - P/Q predicted) vs the independent variable, Q. If the model fits the data well this plot should be a random scatter, if a pattern is discernable the model's not a good choice.
The figure below shows a residual plot for a HL regression I did of P/Q vs Q for Laherrere's data from 1982 - 2005.
Note that there is a definite pattern so the HL logistic model is not the best for this data.
HL isn't useless; it's an approximation which can be used to understand oil production in certain limited stages, especially past peak since it gives a reasonable picture of how production can decline. But it's not so good before peak.
We'd be better off finding a model which fits the data reasonably well over the entire range, perhaps a Gaussian or a related model.
This is my first chart upload and it didn't turn out too well. Please provide any tips to make it better. Thanks.
Robert,
HL assumes a logistic curve as a production function. In that case, it works perfect. If you deviate from that, the URR prediction becomes less reliable.
From Stochastic theory, one would expect a Gaussian curve as a production function for aggregate fields. But even that is not completely true, because it assumes constant and identical technology for all fields.
Last but not least, HL assumes that you have found all fields and no new 'big' fields are put in production.
I would say: before using HL, one should first check the assumptions. And one very convincing argument is the discovery curve and the production curve, basically shifted for 20-30 years.
HL is a nice tool after you have already established peak oil or near peak oil by other means.
As you know, the exact PO date is not so relevant. The interesting point is when demand and production start to separate. That happens ~ 5 years before PO and the price of Oil starts to rise. That is another indication that PO is either now or not far off.
Further, to repeat the standard arguments: Depletion is about 4% per year and growth is about 2% per year. On a total of 85m bpd, that means about 5m bpd. To deny PO, you must be able to point out where these 5m bpd are coming from. 5m bpd this year, another 5m next year, another 5m the year after. Unless you can show the oilwells that are doing it, PO is happening.
One small technical remark: HL will always stabilize towards a linear plot, no matter how the production function looks. It's the nature of a (Q,Q'/Q) plot.
One small technical remark: HL will always stabilize towards a linear plot, no matter how the production function looks. It's the nature of a (Q,Q'/Q) plot.
Strictly speaking, that's not true. As examples, Q = a*t + b (constant production), or Q = a*t^2 + b*t + c (linearly increasing production), do not stabilize toward a linear plot for (Q, Q'/Q). However, you're probably right that any reasonable production function tends toward a linear (Q, Q'/Q) plot.
Free,
A linear production function or a quadratic one doesn't work. Oil is finite, so Q' goes to 0 as time goes by. And Q goes to a limit (the URR).
So your endpoint will be (Q(inf),0/Q(inf)) = (URR,0)
But you are correct that this doesn't help, if your Q' function remains very wild as t progresses (basically the fundamental flaw of the HL procedure and the source of all these discussions about HL and its validity)
If you assume that the production function will go to a depletion curve
Q' = c e^(-kt)
then Q will go to
Q = urr - c e^(-kt)/k = urr - Q'/k
or
Q' = k urr - k Q
and
Q'/Q = k urr/Q - k
and thus
d(Q'/Q)/dQ = - k urr / Q^2
When Q goes to urr, this goes to -k/urr. So that would be your slope. This is basically the depletion ratio.
Now, you can add difficult math to analyse the stability of this estimate, say Q' = (1+e(t)) c e^(-kt) and assume e(t) << 1), but I'm a bit too lazy to figure that all out ;-)
Why is a depletion curve interesting? Because it is the solution of the Hotelling model, when a cartel-supplier like OPEC has a partial stronghold over the market. This will give the supplier the maximum amount of $, depending on the discount rate, the price-elasticity and a little bit on it's own production curve.
And take my word for it: These guys can do the numbers too.
Well, just my 2c's. Ignore it if it makes you laugh ;-)
Small point but excellent. Without a doubt in the world, it's that (downward sloping) linear quality that really works on the minds of people not used to messing with numbers and grabs them hook, line, and sinker. However, one could play around and cook up some really random funny production graphs out of whole cloth and the HL plot would make something of a line out of it.
It's called 'linearization' after all.
Without a doubt in the world, it's that (downward sloping) linear quality that really works on the minds of people not used to messing with numbers and grabs them hook, line, and sinker.
Precisely why I presented the flat production case (and to a lesser extent the rising production case). I think people look at that down slope and think that means decline. I wanted to emphasize that it means no such thing.
So Robert...where does this all leave us now? What have you brought to the table that will help us figure things out? At this point, I see you have succeeded in sowing a lot of doubts, but what are you offering up to help the resolution of what we are trying to uncover here at TOD.
I see a lot of people picking sides..yee haw for that.
But, it also seems like we are running in place and rehashing a lot of old debates. Many are losing interest with this diatribe.
Our whistles are whetted for something more. Who is going to deliver it?
I'm sure RR will have plenty to say on this but I would point out that Matthew Simmons' work is not based on HL.
And there are bottom-up analyses that I've always found more convincing anyway. ASPO's work, for instance, isn't impacted by any criticisms of HL.
Robert
To me, the extrapolation of the data to predict a value for the URR would be better performed with a polynomial function rather than linearization. The gradient of your linear function appears to be greater than the last few points of the data. Also a polynomial function would better reflect the trend of the future data following the point of inflexion.
Oil: the fifth horseman of the apocalypse
Mr. Rapier,
I would like copies of all your data sets used in your ideal case.
Thank you.
Ghawar Is Dying
The greatest shortcoming of the human race is our inability to understand the exponential function. - Dr. Albert Bartlett
Goodness, are people unable to use Excel to generate the data set? I explicitly stated what my assumptions were: 5% production increase for 20 years and then 5% decline until the URR is effectively reached. There is nothing to generating the data.
It's like I give people a recipe for making toast, but they insist I send them the actual toast. That is not aimed at you in particular; more a general frustration that people are demanding to see my data set. Folks, it isn't hard to make toast. If you can't do that, you shouldn't try to model this in the first place.
"I explicitly stated what my assumptions were: 5% production increase for 20 years and then 5% decline until the URR is effectively reached. There is nothing to generating the data."
RR, that's always amusing to me...:-), even with a straight line (or nice pretty curve with no ugly bumps in it) the predictive side seems to be a struggle....
recently I asked very clearly for ONE HL on on ONE field ,(that being the Khurais complex in Saudi Arabia) that would be considered predictive, and give us any idea what the URR of that field would be, how much yearly production could be expected from that ONE field (because remember, these folks claim to have the power to predict the URR and the yearly production of the world!) and when it would peak for good....needless to say, there were no takers.
Several folks here have asked, "but shouldn't we be preparing anyway?"
YES, more so than ever! What these developments in modeling means is (as I said here on TOD over and over) we are running completely in the blind. The last several times I said that, TOD folks became surly and sometimes rude: "How can you say that! Don't you read....understand....grok.....digest....know about....etc, etc., Hubbert Linearization? Here's a primer...and another....and another....
Well, what we seem to be coming closer to realizing as a population is that we REALLY ARE running completely blind.....CERA doesn't know, ASPO doesn't know....IEA and EIA and USGS doesn't know....and HL doesn't prove.....should we be preparing large scale and well researched and funded fossil fuel reduction programs and alternatives, given this level of doubt?
It is EXACTLY because of this level of doubt that we must prepare.
The level of blindness in which we now operate, the complete condition of vulnerability in which we leave a great technical culture means we are in a permanent state of emergency NOW, simply due to our lack of information, peak or no peak, now or 30 years from now. CERA be dammed, we cannot afford, based on this level of information to say, don't worry, it will fix itself when it needs to. it's insane.
Don't sell massive mitagation effort based on impending Peak! Sell it on everything, every front. Sell it on the Pearl Harbor fear....we have no radar, we have no early warning system, we have no scouts that can be relied upon, and we have no bunkers in which to hide. Peak oil and Hubbert curve and HL be left behind for now, sell the need for massive change on the fact that we must restore our vision, our ability to see, at least to some limited degree, what is coming and what we can plan for.
Thank you
Roger Conner
Remember, we are only one cubic mile from freedom
Don't sell massive mitagation effort based on impending Peak! Sell it on everything, every front. Sell it on the Pearl Harbor fear....we have no radar, we have no early warning system, we have no scouts that can be relied upon, and we have no bunkers in which to hide.
Very apropos, Roger. Well-stated, and it captures my sentiments very well.
Hi Roger and Robert,
Thanks for your tenacity in this discussion.
re: "The level of blindness in which we now operate, the complete condition of vulnerability in which we leave a great technical culture means we are in a permanent state of emergency NOW, simply due to our lack of information, peak or no peak, now or 30 years from now."
Robert, you agree w. the need for "massive mitigation", (I know you do.)
Still, the zero or "30 years from now" - it matters, too, (yes?)
So...if there isn't a model you like, and you see some problems w. bottom up/megaprojects (I'm not sure if you've gone into what those might be)...and, you said (If I remember it right), you think "peak" is between 2008 and 2016 - yes?
Does this jibe w. this part of what Roger says above - ("or 30 years from now")? Or does this part matter?
Also, I'm wondering about the points about decline rates, in the post above, and your thoughts on that.
Stipulating that all the groups you listed don't know when the peak will come, does Saudi Arabia know whether or not they have reached or will shortly reached unavoidable declines in oil production? And if they know, how do they know? If they know, would this be based upon some sort of model? And if not, what is it based upon. Guess it depends on how one defines "model".
As for me, the consumption and, therefore, production of all fossil fuels needs to be reduced. The concept of peak oil is (was?) just another way to get people's attention, especially those who don't care about the planetary implications of continuing greenhouse emissions.
Do we have a better ability to predict now that 30 years ago? If not, why would anyone listen if HL has been rendered bogus?
This post by RR and the responses to it is making me feel this whole peak oil discussion/exercise is a waste of time with respect to its possible policy implications. Every argument has holes upon holes upon holes.
An idea I worked out regarding developing future predicting models was in the simplest form, not to develop the model at all and let the data do it.
At one point I worked for a gas transportation company as a database consultant on their billing system. All of their billing was done monthly by GJ and all of the meters took gas samples at intervals through the month. At bill run, they knew the volume, but the gas samples went out for analysis and they didn't get the actual heat value (aHV) until after they billed the customer. Previous to my tenure, due to using the previous month aHV and the extreme error, they had developed an algorithm for a predicted heat value (pHV) for each meter to "guess" at what the HV would be for each meter. The algorithm tried to make up for error on the next month's bill by adjusting the pHV to compensate for over/under billing the previous month. This was working horribly. The algorithm didn't attempt to predict the volume the customer was going to use, and had no way to predict the aHV for the next billing and would adjust the pHV for the cumulative error based on the previous month's usage. The customer would increase volume, the aHV would change and the adjusted pHV would skew the billing to a larger error most of the time. This was extreme enough that we had some large meters off by a cumulative 10,000 GJ (~$8/GJ) at the time.
To get the billing right, the predictive model had to "guess" at the aHV to get a base pHV and then take the actual volume for the month and adjust the pHV to make up for cumulative error. We had 5 years of historical actuals for most of the meters.
What I came up with was to pick a set of arbitrary aggregations and points to be used as potential estimates for each meter's pHV based on aHV historical data (i.e. previous month, 3 month average, 12 month average, 1 year spot, 2 year spot, 3 year average and then several other values based on all meters and geographically close meters) and then a table for each meter that stored a weight for each of these from 1 to 10 for each meter.
I then wrote a recursive loop that tested assigning each weight for each value and comparing the result pHV for each value against the aHV across the 5 year dataset and calculating what the cumulative error was at the end of the 5 year period. Once all of the values were calculated, the database kept the best set of weights for each meter and used that set of weights to "guess" the pHV and then adjust it for any cumulative billing error, with some sanity checking and a "smoothing" factor that didn't attempt to adjust the full amount in case their aHV spiked severely on a given month.
I could prove that if this system would have been used over the 5 year billing history, the cumulative billing error would have been within 100 GJ for every month for each meter, which was substantially better than the 10,000 GJ some of the meters were currently off.
This was written, tested and proved and then never implemented. The engineering and billing departments said that if they couldn't understand it, they wouldn't be able to explain it to the customers and they ended up just dropping the whole predicted heat value idea and issuing manual adjustments every quarter.
Oh well, I got paid by the hour. I think there is some value in this approach though. Rather than trying to make up a model and see if it holds against actuals, pound the data with 610 models and see which one the data likes best.
The Titanic analogy was an obnoxious attempt to frame the debate by discrediting those who might disagree as ignorant stargazers.
My time avialabe to read this in depth is very limited right now. While I will get to it in time, my fist attempt ended after the first couple paragraphs with the thought - "now here's a guy with an aganda and a axe to grind".
It's not even a good analogy, although it is quite revealing (in an unflatering way). Weren't you worried about turning off to the idea of peak oil?
The Titanic analogy was an obnoxious attempt to frame the debate by discrediting those who might disagree as ignorant stargazers.
Stuart disagrees. I don't think he is an ignorant stargazer. Ditto Matt Simmons, and numerous others. The "ignorant stargazers" are those who refuse to examine the data, and instead continue to repeat their assertions. That is faith, not science. Science requires that you actually respond to the objections with something other than repeating yourself.
My time avialabe to read this in depth is very limited right now. While I will get to it in time, my fist attempt ended after the first couple paragraphs with the thought - "now here's a guy with an aganda and a axe to grind".
So, no time to read it, but that didn't stop you from sharing your snap-judgments with us? Bravo. I shall share my own snap-judgment. If you have spell-check, use it. Of course some might call that unfair (after all, I don’t even know if English is your primary language), but no more so than reading a couple of paragraphs and sharing judgements.
Sorry for the spelling errors - I forgot I was using an older version of Firefox. Apparently this prevented you from grasping the point of my comment - which was that your introduction damages your credibility. It doesn't matter how good your analysis may be if people tune you out. I'm well aware that data and results for any complex system can be manipulated to support whatever conclusion is desired (I am NOT saying you've done that here). I don't always have the time (or sometimes ability) to go do my own analysis in areas outside my own field. So I must be willing to accept the results of others, based on my own judgment (FAITH) that both the science AND motivations of the other party is sound. That is why I pay no attention to medical studies done by researchers funded by drug companies, for instance.
You state that you are concerned with "the ability to persuade others". You may think that your work will be judged on the merits of the science you do, but in fact it will be judged more on the perception of your own credibility. That's life.
Also, note that my comments were not on the technical content of the piece, they were on the paragraphs I ACTUALLY read. However, I don't even know if English is your primary language, so perhaps reading comprehension is not a strong point. See how easy it is to make such petty, snide comments?
So your effort here was to show that one of the main tools that have been used is not accurate. Let's accept for the moment that this is so - what next? What would you suggest would be a good approach for a better one? It would appear you've discovered a systematic error in the HL model - at the very least it always predicts too low. This would imply that it could be improved.
Whoa there Robert.
Why the anger?
I think you both proved your point and didn't.
As I said from the beginning, oil does not come out of the ground on its own volition. Everything depends on how the above-ground humans behave. Are they going to operate under a "need and greed" free market model like Texas plus the 47 did, or will they behave otherwise? If otherwise, all bets are off for Hubbert Linearization.
The problem for predicting the gross global sum is that we do not know how everyone is behaving. We do not know for sure if OPEC members are following the Texas+47 behavior model. And that is why we live in the land of the perpetual fog.
(BTW, before you criticize others for slips in spelling, "judgments" doesn't have an "e" after the "g".)
Peace brother.
And do keep up the good work. This was an excellent discussion.
AIUI, judgment is current, but judgement is still accepted and may even be the preferred spelling in Great Britain.
I think Robert has demonstrated that HL will not produce a useful prediction in a case where the pattern of production is determined by something other than geology and immediate short-term self-interest.
The assumption underlying HL is that the low-hanging fruit gets picked first. This is is an assumption about the interaction between human nature and geology. Geology leads us to discover the large easy fields first, human nature leads us to choose to produce the most productive fields first, and once we start, to produce for all we are worth to maximise profit.
HL assumes that the data reflects the flat-out picking of the low hanging fruit. And that will usually be a fairly accurate assumption.
But if people start behaving in an atypical fashion - for example, producing a modest, constant amount each year regardless of demand - then the assumption behind HL will be invalid, and the predictions will be invalid as well.
I think Robert perhaps misses the point that HL cannot be expected to work with a data set generated by something other than the interaction of human greed and geology.
To put it another way, if the data doesn't mean what the model thinks it means, the model will be useless. Any model.
On the other hand, the implication for those attacking Robert's efforts is that any prediction they make will become inaccurate if the meaning of the data changes. Suppose a region is pumping flat-out (in capitalist fashion) for a while, producing data suitable for HL, but there is then a change in government which leads to underinvestment or deliberate restraint in production.
The data points produced after this date would give us a false impression of plateau or decline, even though the underlying geology of the area may be very promising. And any attempt to fit a curve based on this data would result in misleading predictions.
In other words...Mexico, Venezuela, Iran, Iraq, Saudi Arabia, Russia. How do we know that the data reflects geology in any of these countries?
If the data does not reflect the interaction of geology and the market, how can a model evolved to fit this kind of data provide an accurate prediction?
The more you believe, the less you know
In other words: We can use a method utilizing a logistic curve to predict the shape of a logistic curve. The underlying assumption is therefore that oil production follows a logistic curve.
Consequently the question isn't so much whether HL works with production curves that do not look similar to a logistic curve. That's obviously not the case.
The question is whether oil production follows a logistical curve. If it does, then we can apply HL. How do we know it follows a logistic curve? With hindsight is one answer, but a basically useless one. This would be done by applying HL to any historical production data to see whether it fits well.
From what I gather in cases where a country is producing at maximum capacity and continuously invests in new capacity HL basically works well enough (ie Norway).
Saudi Arabia and Russia do not fit. This isn't really surprising. A logistic fit assumes that the underlying functions do not change over time, but clearly they do/did.
I guess one can conclude that the "ideal" production curve is a logistic curve. What remains is what to do with those cases where production does not follow an ideal curve.
One approach that comes to mind is to divide the country and/or time series into subsets. This is what people did concerning Alaska.
The problem with Saudi Arabia and Russia of course is that we lack the necessary data. Human behavior can't be predicted well enough, we can't even predict recessions with any accuracy. Therefore for any model to work we need geological and production data.
Stuart Staniford basically used assumptions about human behavior and information related to oil production (price, stocks, etc.) to guess whether SA is producing at maximum. If so, we could use HL at some point if we have a stretch that is long enough to have a reasonable amount of data points to work with.
But one problem remains: We don't know whether Saudi Arabia really works similar to the lower 48 at this point even if one is assuming that they are declining right now, or the USA. Do they have an Alaska somewhere?
To summarize I'll quote Number Five: "Need input."
If Stuart is right and SA is supply-constrained, a HL of the data points after 2005 should indicate the correct URR.
Hello six,
Could you possibly do this and show it some place more current?
Saudi Arabia would have to be both supply-constrained and investment-unconstrained.
Isn't that the usual prerequsites for having some confidence in a logistic-like production curve, as just discussed above?
0) Capitalist produced oil in stable countries (US, North Sea) is likely to be investment and production unconstrained (relatively) and so declines or decelerations are likely to show the underlying geological factors. Logistic model most applicable. Maybe Brazil is in now in this category as well as nationalized oil in sophisticated petro-countries, e.g. Gulf statelings.
Of the remaining there are three categories:
1) Nationalized oil companies with revenue used to support employment and economic goals, and oil subservient to politics.
Examples: Russia, Mexico, Indonesia, Venezuela, Iran. Here, there is likely underinvestment in productive capability for dealing with future, more difficult production, because of political demands to divert oil profits into general funds.
Frequently accompanies politically popular yet unsustainable domestic subsidies, resulting in even faster decreasing exports.
2) Production limited by chaos and war. Examples: Nigeria, Iraq.
3) Saudi Arabia. A category of its own. Technologically capable like capitalist majors, with potentially strong reserves and yet utterly opaque data. Potentially voluntarily withholding production.
Situations #1 and #2 mean a nearer term peak, somewhat before the situation where purely geophysical factors would result in a peak even in the face of unrestrained E&P. If political factors could be ameliorated, it may mean that if major reinvestment were later made possible, that decline rates could be more shallower vs canonical Hubbert curves, later on.
Situation #3 might(?) result in a more distant peak. But who knows?
I find this so funny. Academics are so thin skinned.
You can rob me and make love to my wife, but don't disparage my beliefs!
Good entertainment value though.
Keep it up. The TOD is a great site, and despite my schoolboy giggling at the back of the class, this is a very useful debate.
...my belief is that the due to financial derivatives, the "war economy" deficits, and the housing meltdown etc. that the oil price spike will be the straw to break the back. Only answer is precious metals. Every (yes every) economy throughout history that has used fiat currency has failed.
... now don't make fun!
In part what is going on here is that different levels are being addressed and mixed up:
A) the behavior of the model in extreme, odd, invented, rare or whatever cases. This should be known and understood, and RRs post, sinking ships apart, clarifies some very important and interesting aspects.
B) the adequacy of the model as a descriptive tool for known, real life cases. 1) If the ‘fit’ with reality is generally good, only a few cases falling by the way side; 2) if the odd cases fall in a particular class, can be grouped together according to some real-life or mathematical criteria; and best yet, 3) if the model is theoretically grounded in some way, then one has a useful tool.
Many have argued that 1) holds for HL, but according to me 2 is in doubt, and 3 does not apply. 1) is of course enough to be going on with, particularly if no alternatives present themselves. It was argued above that A does not detract from the usefulness of HL, as models often fall down in extreme cases, etc, and that is surely true, particularly when the model itself seems somewhat lame or feeble, in this case, poorly circumscribed.
C) the power of the model as a predictive tool. In the case of HL, that power is directly related to its descriptive adequacy. If it’s a good description, it can be used, by analogy to past cases, for prediction. HL does not present a theoretical principle that provides hypotheses or predictions that could be put to the test (such as in physics for ex.) It purports only to model one aspect of a complex process in a digestible way.
D) the pertinence of the predictions made for human decision making in the real world. This is obviously low - if peak was on my birthday last week or in 2010 is trivial. That takes nothing away from the mathematical or theoretical aspects that stand on their own and should be vigorously pursued. Yes it matters.
The quarrels really seem to center around descriptive adequacy, which is not good news for a model. The problem is that process (digging, wells, etc. - real life conditions, too many variables) is left in the shade and only outcome is tagged. HL is a legitimate attempt at generalisation, ‘empirical fit’ but no more...
Bit late in the day, and a meta-post, probably not useful, but the discussion taught me a lot and I felt I had to write!
Full disclosure: I am not fond of HL.
The comments are long, I had no time to read them all,I hope nobody raised the same comment before...
I believe the main reason that the HL method applied on the ideal case gave a bad prediction is the value you used for cumulative production probably begins at 10. Since the HL should be close to an exponential growing function, hence the cumulative production should not be 0 at the begining, but close to first year production divided by ln(1+growth) (e.g. 10/ln(1.05)=205 in your example), i.e. the integral from -infinity to time 0 of C*exp(ln(1+growth)*t)). This should give better predictions, especially since 205 is not small with respect to the URR.
Again, I think that the reason why HL did not work well in Robert's examples is more understable if you perform a quadratic fit of P(Q) instead of a linear fit of P/Q(Q). Obviously, this is equivalent, but the fit can work only if P(Q) has some parabolic, or close to a paraboloid form, so that the parabolic fit intersects the x-axis at Q = Qt.
Obviously, if P is constant (First case) no parabola can fit the data !
In the second case (exponential growth) P growth linearly with Q and no parabola again can fit the data.
Basically, in these two examples, the behaviour of P(Q) does not know anything of Qt, P is not influenced in any case by the amount of reserves, and Qt could be infinite as well : so there is absolutely no hope, just from a mathematical point of view, that any fit gives any information on Qt, because there is no information on Qt in the P(Q) law.
In the third case, this is the same in the exponential growing stage (no influence of Qt) After teh midpoint, the parabolic fit can give some estimate : it is not very good because of the sharp transition of P(Q) which is far from a parabola.
In summary : HL technique requires at least that P(Q) depends in some fashion of Qt, and specifically that it has some parabolic shape at least around and after Q=Qt/2 : otherways, the result will be meaningless.
jbunt
Are we missing the forest by focusing on the trees? Is not the real question, "What on earth evidence is there, or has there ever been (based upon drilling, geology, seismology, production, etc.) that Saudi Arabia has 260 billion barrels of reserves?" There never were, there are not now, nor perhaps in our lifetimes, will there ever be enough rigs running to confirm such an assertion. Unless one can argue that Gawhar will produce forever at current rates, then certainly Saudi Arabia's production will peak. Gawhar has already acheived more than any known geological formation ever found on earth. As an anomoly, or outlier, what are the chances that it becomes an anomoly by a factor of 10? (Hey, if it is that good, why are 10's of billions of $'s being spent to increase production? Why is Chevron doing tertiary production in the neutral zone? Forget the HL math, just follow the money.)
"Given this, I conclude that it is highly unlikely that Hubbert actually used this sort of linearization technique in making his forecasts. "
Is the methodology that Hubbert used to predict US peak in the 1975-1971 time period and world peak in the 1995 - 2005 time period unknown?
If Hubbert didn't use this technique who proposed it?
Which of the famous Peak Oil spokespersons use the HL methodology?
I think Kenneth Deffeyes has a section on it in his book.