A Nosedive Toward the Desert
Posted by Stuart Staniford on March 8, 2007 - 10:15am
...Or, Why the Decline in Saudi Oil Production is Not Voluntary
Summary
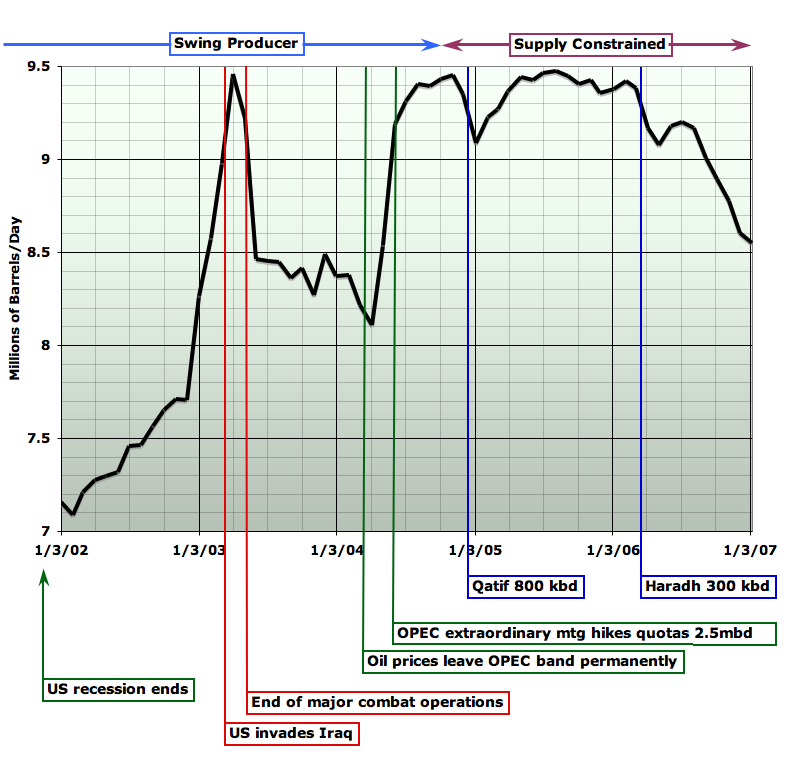
In this post, I extend my analysis of Saudi Arabian production backwards four years earlier than my post of last week. I explain in detail how the evidence strongly suggests that since late 2004, the Kingdom of Saudi Arabia (KSA) has entered rapid decline of their oil production, at least for the time being.The headline graph summarizes my conclusions, which are as follows.
- Saudi production can be divided into two eras. In the first, prior to the third quarter of 2004, KSA had spare capacity and acted as the swing producer, making large voluntary changes in their production to stabilize the market. During this era, all major features of the production graph can be well understood based on demand side needs.
- Since late 2004, KSA have entered a new era where they cannot raise production in response to demand side needs, and instead the major features of the production curve correspond to supply side events.
- During 2002, KSA was increasing production to accomodate increasing demand as the world recovered from the recession of 2001.
- In 2003, there was a major spike in oil production immediately preceding and during the US invasion of Iraq: this was a voluntary action to stabilize oil prices in the face of the loss of Iraqi production. As combat wound down, and Iraqi oil production resumed, Saudi production declined back to levels slightly higher than before the war.
- Oil prices increased due to increasing US, Chinese, etc demand in the strong economy of 2003 and early 2004. Once it became clear that oil prices had risen pronouncedly above OPECs desired $22-$28 price band, KSA initiated a large voluntary increase in production in the spring of 2004 in an attempt to bring prices back into the band. They were not able to raise production by more than 1 million barrels per day (mbpd), however, and this was not sufficient to stabilize prices, which have never returned to the price band. The band was abandoned a year later.
- After continuing to increase production very slightly for several more months, Saudi production began to decline in late 2004. This was only arrested by the arrival of the first KSA oil "megaproject", the 800 thousand barrel/day (kbpd) output from the combined Qatif/Abu Sa'fah fields (690kbpd of new crude and condensate production). This 690kbpd arrested declines during early 2005, but never sufficed to raise production above the peak achieved in 2004. There was no sign of Saudi increases in production in response to the high prices of 2005 and since, nor to the loss of production from the Gulf of Mexico hurricanes in 2005.
- Production began to decline again in 2005, and at greater rates through 2006. This was only arrested briefly by the arrival of oil from the 300kbpd Haradh III development in late spring of 2006.
- If these trends were to continue, Saudi oil production would halve over the next five years. However, it seems more likely that KSA will find ways to bring smaller fields on line and start to mitigate the decline within this time period.
The Production Data
Saudi Aramco has not historically published detailed data on its oil production, and so data is inferred by third parties from a variety of indirect methods (eg counting tankers - but see below on JODI data). Here, I consider four data series that are published by various agencies, and none of which agree perfectly. The series are:- EIA International Petroleum Monthly Table 1.1
- The US Energy Information Agency, in their monthly publication International Petroleum Monthly give a variety of data tables conveniently available in spreadsheet form. Table 1.1a provides monthly oil production estimates for OPEC countries, including Saudi Arabia. The EIA generally produces estimates about two months after the end of the month in question and revises them relatively little later. The data series includes crude oil, together with lease condensate, but not natural gas plant liquids (NGPLs). About half of neutral zone production is included. The EIA lists its sources as "Dow Jones, Middle East Economic Survey, Petroleum Intelligence Weekly, Monthly Oil Data Service from the International Energy Agency (IEA), Monthly Oil Market Report from OPEC, Oil & Gas Journal, Platts, and Reuters." It's unclear what algorithm the EIA uses to compute their final estimate from these sources.
- IEA Oil Market Report Table 3
- The OECD International Energy Agency produces a monthly Oil Market Report, available for free only as individual PDF files. Table 3 (Table 4 in older reports) contains a summary of oil production for a variety of countries, including Saudi Arabia. The IEA generally produces a preliminary estimate quite quickly after the end of a month, but then revises it multiple times in subsequent versions of the OMR, sometimes quites significantly. For Saudi Arabia, the production estimate excludes condensates and other NGLs. The exclusion of condensates probably makes the IEA's numbers systematically lower than the EIA's. The IEA does not document its sources or methods for its estimates of Saudi production, to my knowledge.
- JODI
- The Joint Oil Data Initiative is a global collaborative attempt to reconcile data from various agencies and improve transparency in the oil markets. They tabulate monthly oil production data, for many countries, including Saudi Arabia. Generally the data are a couple of months behind and do not get revised, but what is particularly interesting about JODI data is that it is based on self-reports by the countries. Thus since January 2002, when the JODI series begins, the Saudis have been making an assertion about their own production via the JODI process. This is of interest since the Saudis are in much the best position to know what their own oil production is. On the other hand, there is considerable reason to question the integrity of Saudi reports on their oil industry (discussed later), and they have incentives to distort their production data at times. JODI definitions of oil production includes condensates, but excludes other NGLs. In theory, the JODI data should thus be comparable to the EIA data. JODI data is available in convenient CSV or spreadsheet form.
- OPEC Monthly Oil Market Report
- The Organization of Oil Exporting Countries publishes a Monthly Oil Market Report (as individual PDFs) which includes data on OPEC member country production. This is in a table in the section on "World Oil Supply", but the table number varies from issue to issue. The sources of the data are listed only as "based on secondary sources", and OPEC does not document whether or not condensates are included, but apparently separately accounts for NGLs. OPEC data are generally produced within a couple of weeks of the end of the month, but then are significantly revised.

Clearly the data situation is scientifically quite unsatisfactory. We have four data series which are undocumented, of uncertain veracity, do not agree, and yet the differences cannot rightly be interpreted as statistically independent noise. They do not measure quite the same thing, but lack the auxiliary information to make them commensurable.
Nonetheless, for lack of any other way to make progress, in this essay I take it that trends that appear in all or most of the data series are veridicial. Having no a-priori reason to favor one series over another, I generally take the average of the four as the best overall estimate. I also assume that the spread of the series is some kind of estimate of the uncertainty in the values.
I now turn to justifying the narrative explanation of the data given in the summary.
Economic Growth
When economies grow well, people build more houses, take more vacations, and buy more goods and services. Businesses hire more workers, send staff on more business trips, and open new offices and factories. All these things increase the demand for oil to power cars, trucks, planes, heating systems, etc. Thus the usage of oil is highly sensitive to economic growth - indeed economic growth has a far stronger effect on oil demand than the price of oil (an economist would say that the income elasticity of oil demand is much larger than the price elasticity).As the swing producer, historically Saudi Arabian oil production has varied widely based on oil demand - they reduce production the most when demand drops, and they were best placed to make very large increases in production when there was a sudden need in the market for more oil.
The next graph shows the history of real GDP growth in three key developed economies: the US (quarterly), the European Union (yearly), and Japan (also yearly), together with the Saudi production estimate for comparison.
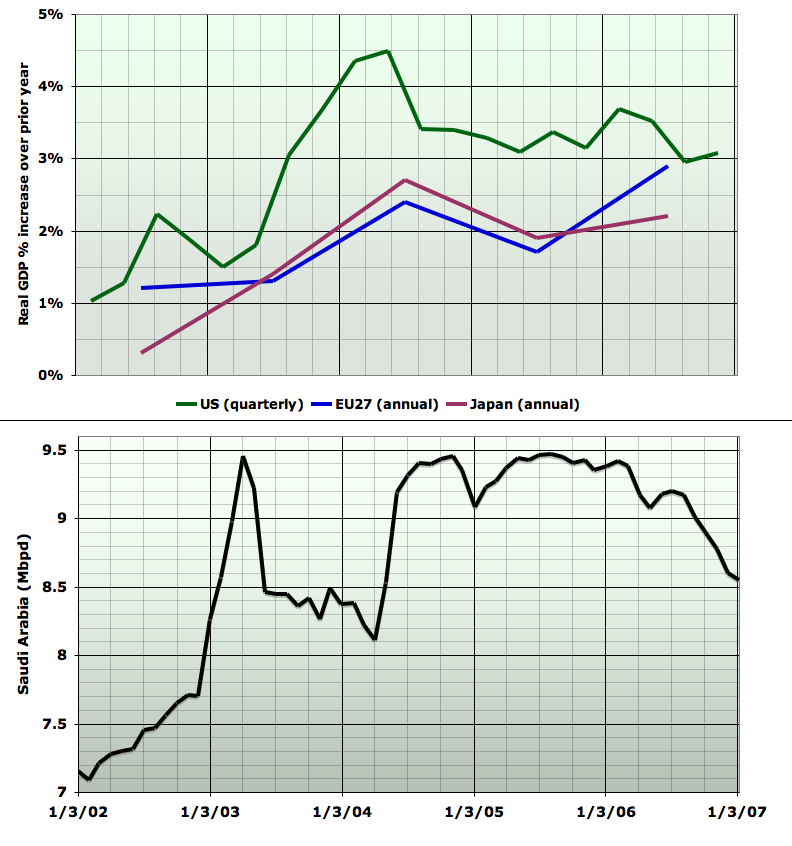
In 2001, there was a recession in the US, and probably in the global economy, as a result of the bursting of the Internet stock bubble. The US recession officially ended in November 2001. So in 2002, economic growth resumed and gradually increased from a low base. Economic growth continued to increase until it reached a peak in mid 2004, after which it moderated, but remained overall healthy.
A-priori, in the face of steady economic growth like this, we would have expected world oil usage to increase several percent a year throughout the period of interest, and we might have expected Saudi production in particular to increase. The production increase in 2002 may well have this character, as may the increase from 2002 to 2004 and then to 2004 (though other factors enter the picture here as discussed in a moment). However it is striking that increases in production essentially ceased after a last step up in mid 2004, despite continued economic growth. This is surprising in the historical context. It is possible that the failure to increase oil supply (and resulting high prices) are the cause of economic growth being lower after mid 2004 - at any rate the two events coincide in onset. It is also likely, as discussed below, that the very strong economic growth of late 2003 and early 2004 led to the price increases which triggered the step-like Saudi production increase of mid 2004.
At any rate, it is important to note that there were no recessions during the study interval and no sizeable periods of low growth after 2002. Thus production declines in Saudi Arabia in the period of study cannot be due to weakness in global economic growth.
The Iraq War
The next graph is concerned with the large spike in KSA oil production in early 2003. It's fairly clear that this is due to the Saudi's increasing production to compensate the market for the loss of Iraqi production due to the US invasion, and to some extent the Venezuelan oil strike. Iraqi production is shown above Saudi production, and the spikes match up well.

All sources agree this spike began in January 2003 (the Venezuelan oil strike began in December 2002), peaked in April (the US invaded in March), and declined by June to a new, but higher level from which it sloped down through the remainder of 2003 (see the graph fragment to the right). Once the war was over and Iraqi production began to recover, the Saudis ramped down again - initially quickly, and then more gradually (OPEC was reducing quotas at the time). There does not seem too much to say about this interval. Clearly the Saudis were acting as swing producer and demonstrated an ability to raise production by 2mbpd in a fairly short interval to a total of somewhere around 9.5mbpd.
Breaking the OPEC Price Band
Now we come to what I think are the critical events in the story. With the very strong economic growth in late 2003 and early 2004, oil prices started to rise. The next graph shows oil price in the top panel - with OPEC's intended price band of $22-$28 shown in blue - and the Saudi production curve in the bottom panel. My price is the export weighted OPEC average from the EIA, not the official OPEC basket, but I don't think the difference matters too much.
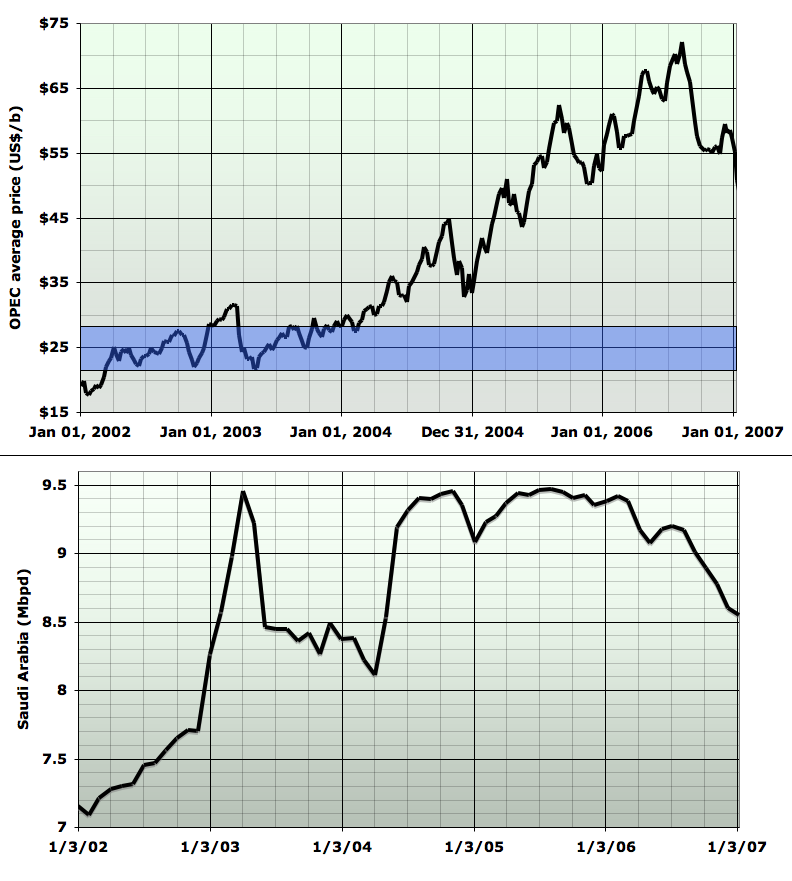
We are going to focus now on explaining the large (roughly 1mbpd) rise in production in the May/June 2004 timeframe.
Reading through OPEC publications from the early 2004 timeframe is quite enlightening. In February 2004, the OPEC Oil Market Report gave the recent history of price, which was above the price band:
The OPEC Reference Basket started 2004 on a firm footing, with an average of $30.33/b in January. The Basket gained 89¢/b over the previous month but dropped 1¢/b lower compared to the same month for 2003. On a weekly count, the Basket put in a strong performance early in the month gaining 55¢/b or 1.9% during the first week, followed by another rise of 67¢/b or 2.2% in the second. Then the Basket made a downturn losing 8¢/b to average $30.67/b in the third week, followed by a hefty loss of 85¢/b at the end of January for an average of $29.82/b. The fall extended to the first half of February when the Basket shed a substantial 3.9% of its value, averaging $28.67/b in the second week of the month, yet remained comfortably above the upper limit of the OPEC price band.However, although technically above their policy, this is not a high enough price to alarm OPEC, and concerns are mainly about the risk of making stocks too large and causing prices to collapse:
Therefore, despite the uncertainties inherent in any forecast of the supply/demand balance, the range of opinion among regularly published oil market reports points to the inevitability of a higher-than-normal build in stocks in the 2Q of this year to minimum 2.7 mb/d with a mean of 3.6 mb/d, close to OPEC’s February figure of 3.4 mb/d. Moreover, no reasonable further upward revision in demand or a drop in non-OPEC supply is likely to change the consensus on the balance for 2Q 2004. If this surplus is not handled in a timely and effective manner, there is likely to be excessive downward pressure on prices. Such a development cannot be left unattended, as it would lead to a protracted spell of volatility in the market, something that is in no one’s interest.and, responding to these concerns, OPEC quotas were lowered and Saudi production in March and April fell slightly. However, this proved to be the wrong direction to move in: by May, prices had continued to rise, and we read,
The $32.35/b April’s OPEC Reference Basket price is second only to the all-time high monthly average of $34.32/b registered in October 1990. The constant strength of the Basket since the beginning of 2004, combined with the pronounced drop seen in March and April of last year, considerably widened the 2004 year’s year-to-date average with respect to 2003. The Basket averaged $31.13/b to 30 April of this year versus $29.02/b during the same period in 2003. Early in May, following a surge in crude prices, the Basket added another 5% or $1.66/b to average $34.91/b in the week ended 6 May and rose by another $1.25/b to $36.16/b in the following week. As of 17 May, the Basket’s daily average had risen to $37.72/b, or about $1.20 below the all-time high, driven primarily by geopolitics, security concerns, the gasoline situation in the USA, high demand for petroleum products and rampant speculation.and OPEC is now worried - sneaking a few bucks above the price band was apparently viewed as a harmless good time for the membership, but $35 oil is worrying them. They are going to do something about the situation:
OPEC crude oil production in April, based on secondary sources, is estimated at 28.05 mb/d, 0.26 mb/d lower than the revised March figure. However, May nominations and tanker movements indicate much higher volumes, and OPEC Member Countries are considering further production increases as part of their commitment to respond to market realities.This is the lead in to the large Saudi increase - it goes up 1mbpd by June. By June 3rd, OPEC is having an extraordinary meeting to officially sanction what is being done, and consider what more to do. The meeting summary reports:
Having reviewed market developments since its 130th Meeting, held on March 31, 2004, as well as the supply/demand outlook, the Conference noted with concern that, as a result of several factors, prices have continued to escalate, despite the efforts by OPEC Member Countries to meet market requirements. These factors are mainly the robust growth in demand in the USA and China, which had not been fully anticipated; geopolitical tensions; and refining and distribution industry bottlenecks in some major consuming regions, coupled with more stringent product specifications. Combined, these factors have led to unwarranted fear of a possible future supply shortage of crude oil, which has, in turn, resulted in increased speculation in the futures markets with substantial upward pressure on crude oil prices.Given current high and volatile prices and prevailing concerns regarding supply security, and in order to ensure continued, robust, global economic growth, especially in the economies of fellow Developing Countries, the Conference decided to increase the OPEC production ceiling (excluding Iraq) to 25.5 mb/d, with effect from July 1, 2004, and to 26 mb/d, with effect from August 1, 2004, in order to ensure adequate supply and give a clear signal of OPEC’s commitment to market stability and to maintaining prices at acceptable levels to both producers and consumers. The Conference also decided to convene an Extraordinary Meeting in Vienna, Austria, on July 21, 2004 to review market developments.
Ok. So as of June 2004, OPEC and Saudi Arabia are doing all the right swing-producer things - flooding the market with extra oil to damp down prices and bring them back within reasonable range of the price band. However, as the price fragment to the right shows, it didn't work. Prices dropped a bit in May and June, and then shot up again. What went wrong?I think the basic dynamic here is that futures market traders were essentially saying to Saudi Arabia: "show us what you got". This is six months after Matt Simmons gave his first presentation on his concerns about the future robustness of Saudi production, China and the US were both growing very fast, and prices were being bid up challenging the Saudis to show they could put enough oil on the market to rein prices in. Let's look at what happened. Here is oil stocks in the US, and the rest of the OECD, expressed as an anomaly relative to the average over the period.
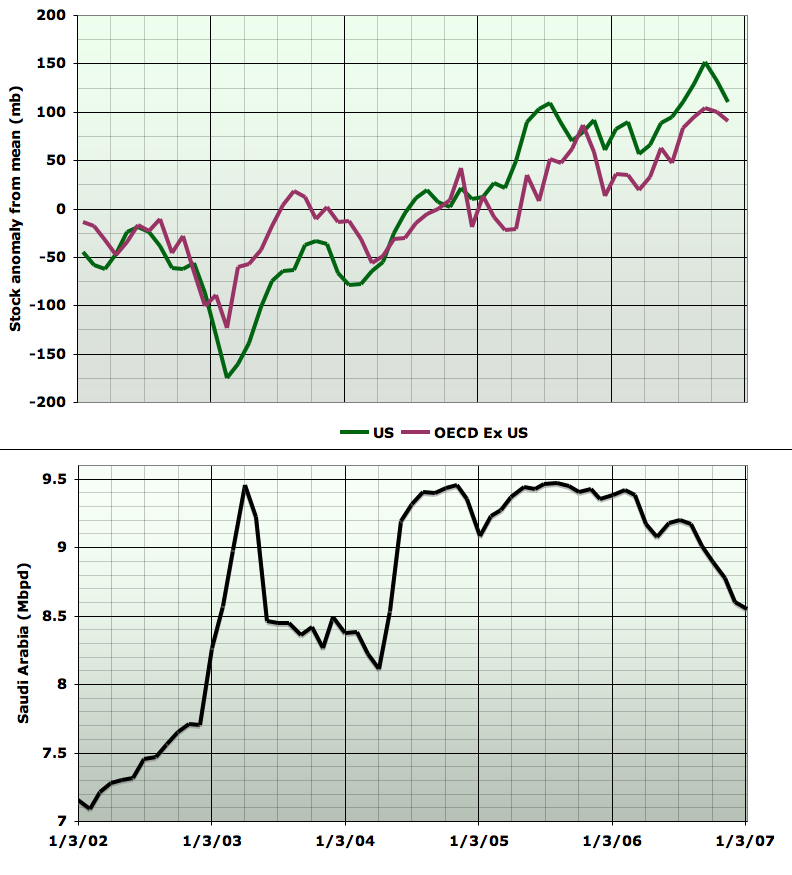
As you can see, in spring 2004, stocks increase a little, but then, critically, they stop increasing in the third quarter of 2004. This coincides with the Saudis stopping increasing production. The Saudis cannot pump any more, and it's not enough to drive stocks up further. The point is even clearer in this EIA picture Euan found:

No matter in which time-frame is considered — monthly, weekly, daily — the OPEC Reference Basket in July and early August broke records all across the board. On a monthly basis, the rise of $1.68/b in July brought the monthly average to an unprecedented level of $36.29/b. Besides the previous monthly high of $36.27/b reached in May this year, the Basket has never been above $34/b since October 1990. On a weekly basis, the $37.40/b average for the week ending 29 July constitutes an all-time weekly high, while the daily average of $40.08/b on 11 August now holds the Basket’s daily record.but the bulletin was, unusually, silent on what anyone should do. There was nothing to be done. OPEC had lost control of the price of oil.
They would effectively acknowledge this in Janauary 2005 when they suspended the price band. I think it's important to stress that OPEC had every reason in late 2004 to think that these prices would hurt the world economy. Their literature at the time says they thought so, and as recently as 2000, $35 oil had caused massive civil unrest and an economic crisis in Europe. This seems endearing looking back from the era of $60+ oil, but there's little doubt that people at the time believed oil prices above $35 were going to cause serious problems, and that's why Saudi Arabia made a real effort to contain them.
Entering the Supply Constraint Era
This third quarter of 2004 was the point when Saudi Arabia, and by extension OPEC, crossed from being a swing producer, to being supply constrained. And, as is typical of oil production in some region, once production cannot go up any more, it starts to go down. In the fourth quarter of 2004, Saudi production drops sharply: my hypothesis is that after nearly six months of running flat out, parts of the oil fields really needed to be rested to prevent water breakthroughs (producing a field too fast can allow water to find channels to the wells and then flow straight into them, instead of pushing the oil ahead of it). This is in the absence of any suggestion in the September OPEC OMR, or the press release from the 132nd OPEC meeting on September 15th 2004, that anyone should do anything but keep increasing production.In fact, the meeting decided on yet another quota hike:
In light of the foregoing, the Conference decided to raise the OPEC production ceiling (excluding Iraq) by 1.0 mb/d, to 27.0 mb/d, with effect from November 1, 2004, in order to bring prices down further to a more sustainable level, whilst, at the same time, vigilantly monitoring market developments. In taking this decision, the Organization reiterated its commitment to take action to stabilize the market at prices reasonable to both producers and consumers.Saudi Arabia appears to have been obliged to do the opposite, dropping production by around 400,000 barrels per day between October 2004 and January 2005.
As the next graph shows, it was this quarter - the fourth quarter of 2004 - when the rig count began its rise above the long term very modest number of rigs that the Saudis had needed to maintain their production (given the extraordinary permeability of some of their large reservoirs - a point Euan helpfully reminds us of).
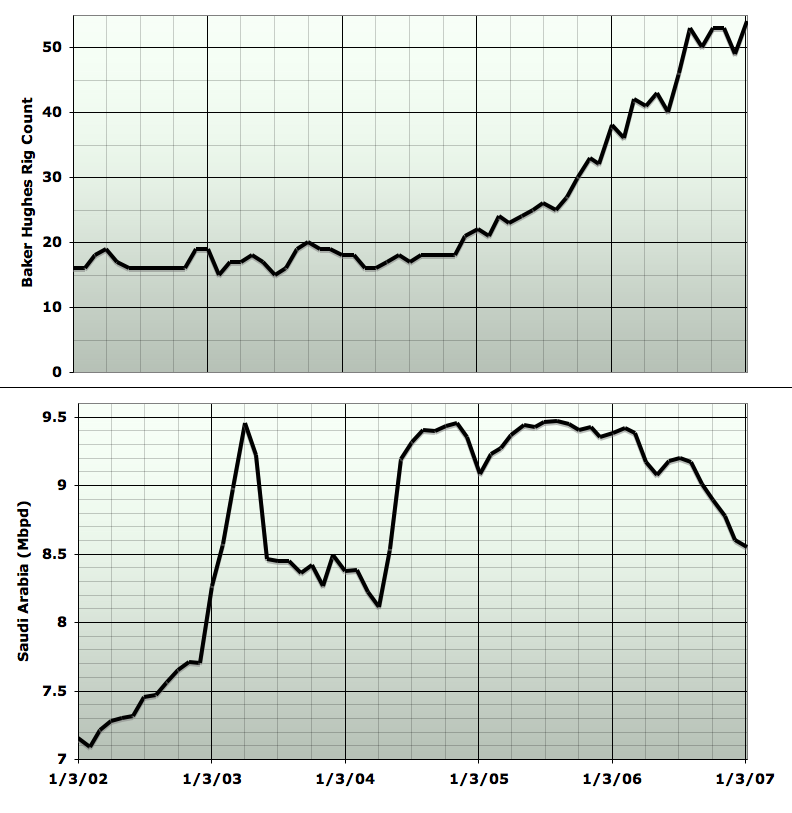
It is at this point that megaprojects come into the story. After the initial development of the Shaybah field, which came on stream in 1998, the next major development the Saudis took on was the redevelopment of the Qatif and Abu Sa'fah fields. Qatif had been produced from 1951 to 1982, but was in serious decline at the end of that time and was mothballed during the low production years of the 1980s. It was then redeveloped using all the latest technology (horizontal drilling, multilateral completions) from 2002 to 2004, with official inaguaration in December 2004. A similar project rehabilitated the nearby offshore Abu Sa'fah field. Together, these were intended to produce 800,000 barrels per day of crude, plus 40kbpd of condensate, which was 690kbpd of new production, since Abu Sa'fah was already producing 150kbpd.
My suggestion is that the production bump that started in early 2005 should be interpreted as the new flows from Qatif/Abu Sa'fah being used to offset declines elsewhere. However, they did not allow Saudi production to rise above the almost 9.5mbpd attained in October 2004 - instead that level was just matched for a few months in the summer of 2005. This suggests that the rest of the production base was being produced 690kbpd lower than it had been 10 months earlier. That's about an 8% decline rate in the underlying base production, compensated for by the new field to give an overall roughly flat production profile.
By the end of 2005, beginning of 2006, the new projects were presumably fully in production and there was nothing to offset declines, which therefore show through into the top line production again. As I discussed at length last week, during 2006 we saw declines in the base production accelerate to 14%, offset to 8% as a net decline rate after addition of the smaller Haradh III megaproject.
Alternative Explanations
Next, I'd like to look at alternative explanations that have been proposed for what is happening, most of which stem from the Saudi's and OPEC's own explanation for what is occuring (with Euan and Robert Rapier adding wrinkles to this). It will be impossible to look at all variants, so let me try to string together the strongest possible narrative along these lines, and then point out why I don't believe it's plausible. That narrative would go something like the following:
Due to long-standing under-investment in production capacity, Saudi Arabia did indeed temporarily fail to increase production as much as oil markets might have liked in the fall of 2004. This caused prices to rise very high, driven primarily by speculators in the futures market. However, KSA has now rebuilt significant spare capacity by utilizing more of their ample reserves. In the interim, it became clear that the world economy could in fact continue to grow with oil prices in the $60+ range, and so they realized that there was no point in increasing their production again to lower prices. In fact, as western oil stocks have been increasing since then, the market is overall well supplied, and in recognition of this fact, the Saudis have been lowering production voluntarily. If the onset of new megaprojects shows up in the production statistics, that is just because they waited to be sure that the new production was working before resting existing production. Nonetheless, they could increase production further if they really wanted to, eg. if oil prices became high enough to cause serious distress to the world economy.Let me start with the idea that the visibility of the Qatif and Haradh megaprojects in the data is not significant. As Robert Rapier at one point put it:
That (Haradh III) probably is what it was. They probably brought that production on line. But, you want to prove your production rate before you take other production offline. You don't take the other production offline as you are bringing the new production on, because you don't know for sure if things are going to work out like you think they will.I found this completely implausible from a theoretical perspective. Aramco, a very sophisticated high-tech company, has several decades of experience running the oil infrastructure for a swing producer that participates in political arrangments dependent on changing their oil output regularly. We have to assume that they would have made it easy to centrally control the amount of oil output. Indeed we see many occasions in the past when they've changed production by 1mpbd up or down from one month to another. So it has to be, from a technical standpoint, easy for them to adjust the level of their base production, assuming they are not operating at capacity. This means they can mask the effects of new production in the curve.You can see this same pattern on their prior production declines. There will be a decline, and then a little step up, and then more declines.
Furthermore, according to Robert's hypothesis, these declines (in 2006 for example) are voluntary. The declines occur every month according to the production statistics. Therefore, the level of production must be being adjusted at least every month under normal circumstance to implement the decline schedule. So again, if they are being adjusted every month, how can it be so difficult to change the adjustment to do a little extra ramping down on existing production when new production is coming on line?
And the failure to match the intended production has real consequences: extra tankers must be ordered and paid for to take the extra oil away, and that extra oil will affect prices in the marketplace. It's hard for me to believe that it's easier to face these consequences than just turn the base production down a little at the outset of turning on the new megaproject, and then turn it back up again if there's a problem with the new field.
However, in my modus operandi, empirical evidence trumps theoretical prejudice every time. So I went back and looked at the inauguration of the Shaybah field. This was a megaproject to bring on a brand new field, 500 kbpd, during the swing producer era. Specifically, first oil was in July 1998 and the official inauguration of the completed facility was in March 1999. Presumably the new oil came on to varying degrees between those dates, or perhaps a little after, but we don't know exactly how much when. I made a graph of the 1998-1999 period, and I plotted two things: the official OPEC allocations for Saudi Arabia, which is the schedule that production is supposed to be following. I also plotted the average of IEA and EIA production estimates (JODI didn't exist back then and I don't have the OPEC production series done back that far yet and it's particularly time consuming to compile).

As you can see, at the time Saudi Arabia was tracking its quota pretty well. OPEC was ramping down production in response to the Asian financial crisis, and the Saudis were behaving as well-disciplined members of the cartel. The new megaproject has no apparent impact on their ability to follow the schedule - they are never more than a couple of hundred kbpd off, usually less, and they are particularly close to the line during the interval whan Shaybah came on stream. (Note that it is just a coincidence that both first oil and inauguration of Shaybah are in the same month as OPEC production cuts).
To me, this strongly demonstrates my contention: when KSA is not operating at capacity, they can control base production so that a new megaproject does not influence their total production level. Thus the fact that they did not achieve that control for the onset of Qatif and Haradh III continues to strike me as highly significant. For reference, here is the production profile and quota for the last five years (on the same vertical scale):
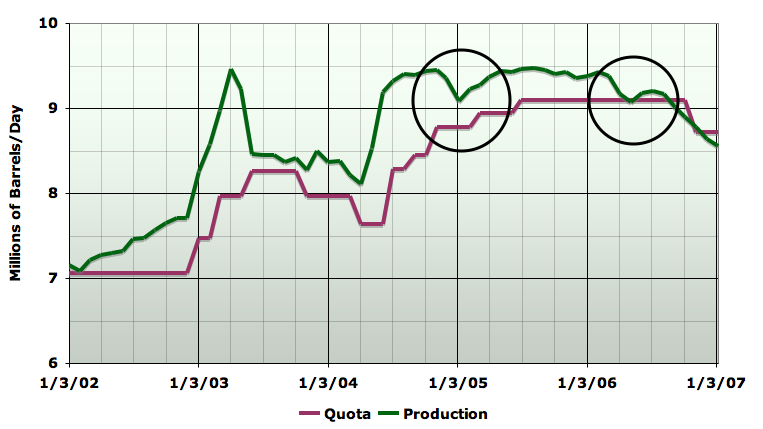
In general, KSA was not following its quota so closely during this era - in particular, they seem to have responded much more aggressively than OPEC required to the market need for more oil during the Gulf war, and also in response to the loss of control over prices in mid 2004. However, as the two circled regions show, there was nothing in the quota curve to explain these events.
Now, let's turn to the issue of rising OECD stocks:
It's certainly true that stocks have been rising from 2004 until last summer, both on an absolute and a days of supply basis - though the rise is not historically outrageous. OPEC is fond of claiming this mean that the market is well supplied and so nobody needs any more oil. Clearly, the average minimum wage worker forced to cut short on driving because they can't afford the gas would have a very different perspective. The problem is in the supply constraint era, inventories just do not mean what they used to mean. The price rises of the last few years have frequently come from the long end of the futures market - the market has often been in contango in which the right to have a barrel of oil in five years is more expensive than the right to have a barrel today. When the far future oil contracts are driving up like that, two things happen: one is that it makes it more profitable to store oil, so stocks rise. The other is that the current price of oil has to rise too (because otherwise even more oil would be stored, which tends to drive the far future price and the current price towards one another). So the historical role of inventories as the main signal OPEC used to balance the market has broken down. But I find it hard to believe that OPEC doesn't know how the futures markets work.
But obviously, none of this would happen if the futures markets thought that there was going to be ample oil in the future. $60 is high enough that demand has flattened out, despite decent economic growth. Thus there are certainly additional customers who would drive further and turn up the heating oil thermostat if only oil was a bit cheaper and they could afford it. The fact that there's no-one available to supply it to them is why prices have remained so high. If OPEC had the capacity and convincingly demonstrated their ability to flood the market with all the oil anyone anywhere would pay for, oil market bulls would have no choice but to run screaming for the hills - selling their long positions cheaper and cheaper lest they be faced with the prospect of tankers heading up Long Island Sound trying to deliver to their hedge fund offices.
Ok, but what about the idea that the Saudis, having recognized that the world can cope with $60+oil, are now deliberately holding production down in order to maintain prices at that level. At one level, I think it's incontrovertible that OPEC has gotten very fond of the high prices. There does seem to be some evidence that some countries did actually make very small cuts specifically in response to the recent OPEC cuts. Could the Saudis simply have decided that being the swing producer is a mugs game, and they're just going to take all the money they can?
Well, that hypothesis has some problems, I think. One is, why don't they cut even further, and make even more money? Knock another few mbpd off, and oil will be $150, which is even better for the treasury. Ok, they can't do that all at once, or they'd throw the world into recession. But after prices peaked at almost $80 last summer, why did the newly greedy Saudis let them come down again. Why not have managed them slowly higher to find the point of maximum profitability, which is almost certainly higher than $60? Or if they aren't that greedy, and $60ish is the new price band, the new balance between the interests of producers and consumers, why'd they let the price go almost to $80 over the summer? Why not ramp up to 10.5mbpd for a few months and scare the markets back down to $65?
In short, if the Saudis had spare capacity, we'd expect the production profile to show some intentionality around managing the price in some way that they perceive to benefit them. But that's not what we've got. If we focus on price and production over just the last three years:
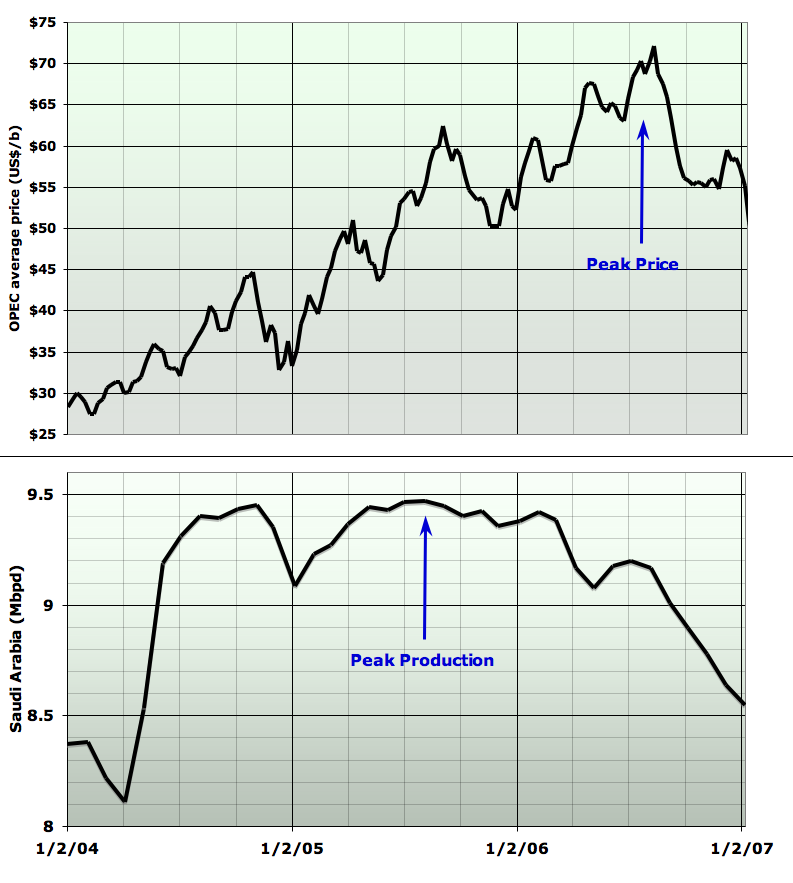
I just can't see Euan's contention that the peak in Saudi production and price coincide. From my perspective, declines in Saudi production start a year earlier than the peak price, gradually at first, and then accelerating.
Instead of some rational looking approach to price management, we see a profile of drops interrupted by each new megaproject.
Thirdly, if the Saudi's were indeed sitting on 716gb of ultimately recoverable oil, there's some serious risks in running prices so high now, so early in the history of their production. In particular, they are triggering a huge boom in investment in trying to find alternative forms of energy (this is going gangbusters here in the SF Bay Area). That's pretty risky for them - who's to say that Silicon Valley won't solve the electric car battery problem and the cheap solar panel problem? It's not usually a good business strategy to price your product so high that your customers are driven to furiously trying to invent an alternative. In the past, they understood this which was why they created a moderate $22-$28 price band which balanced the needs of producers and consumers. They had the experience of the 1980s when the price spikes of the 1970s caused a huge shift away from oil and contraction in demand, which absolutely killed their revenues for years. Why would they repeat that experience?
So, at this point, I'm pretty strongly persuaded that this can't be the explanation.
The Future of Saudi Production
The very near term future is generally agreed to be continued declines. The most recent IEA Oil Market Report (from Feb 13th, 2007) says:The Saudi Arabian crude supply estimate for December was revised down by 100 kb/d to 8.7 mb/d in light of updated tanker data and reported production levels. January supply is assessed unchanged, although Aramco has signalled to Asian term buyers that exports will be curbed by between 10-13% in February compared with 8-9% in January. Moreover, steep price increases for March exports suggest supply remaining constrained next month.For the medium term, if you just project the underlying linear decline rate in 2006 out for the next five years and add in the known megaprojects, you get the red line in the following graph:

If that were true, production would have halved by 2012. However, it's very hard to believe that declines would continue at that rate. Eg, if they continued all the way to zero after ten years, that would only be another 16 billion barrels of oil production. No-one is that sceptical of Saudi oil reserves. Eg Hubbert linearization suggests there's about another 80gb or so of oil there. ASPO estimates 170gb still to produce (though based on a fairly generous recovery factor).
So rather than declines continuing at the present rate all the way into the ground, more likely, I think, is that there are a large number of small fields, and pockets in big fields, which carry the remaining reserves. Hitherto, these have been beneath the attention of Saudi Aramco, which prefers to engage in massive heroic engineering projects - they haven't gone below about a 5gb field in recent publicly announced projects. Just as in other regions, the addition of increasingly large numbers of increasingly small fields to the backside of the production peak should serve to moderate the decline rate. How quickly Saudi Arabia will move to exploit the remaining smaller fields is anyone's guess, but the green line on the chart above is intended to suggest that the present decline rates should moderate at some point.
Parting Thoughts
No-one has taken me up on my bet, but since I feel even more confident of my conclusions, I'm raising the offered stakes to $2000. I need to go find some cornucopians to take the other side of it.Which reminds me. For those of you doomers keen to see this as the end of civilization as we know it, it's going to take more than this for me to join you. While it's certainly worrying, we need to keep some perspective: 8% of Saudi production is 1% of global production, and as long as global declines are less than a few percent a year they are well within society's proven capacity to adapt. Probably the biggest potential issue is the political stability of the Kingdom of Saudi Arabia once this news becomes clear to everyone.
Contact
- Content: editors at theoildrum dot com
- Tech support: support at theoildrum dot com
License

This work is licensed under a Creative Commons Attribution-Share Alike 3.0 United States License.
Prof. Goose reminds us:
Outstanding work! It's a shame it's getting so little digg count:
On the front page of digg at 90 odd.
Getting noticed on digg is majorly a matter of the rate at which the story is 'dugg'. People need to hit ~40-50 within a short period of time to maximise the probability of receiving attention.
Unfortunate, but that's the way these sites work. Getting the story noticed by those that matter, that's another story.
Darn - just 288!
Khebab - I've often said that I like your loglets analysis with global peak in 2012. If Stuart is right here, then your analysis is most likely wrong. Care to comment - maybe further down the thread. I'm off to nose dive into bed!
For me it all comes down to the 1988 reserve increase:
If we correct for the increase, we get 180Gb left, the HL would then look like that:
A global HL without a priori knowledge is saying 90 Gb left:
Stuart's hypothesis is clearly very pessimistic (dotted red line) but would be consistent with a rapid crash of Ghawar probably followed by a small rebound or a least a flattening in production coming from smaller fields.
more comments later.
If i look at the maps http://maps.google.com/ i could see that the concentration of oil in middle east must be a lot higher than for example in us or the north sea. Is there any gelogical reason to believe that middle east has a lot more oil per area than any other area of the world. Then i check these http://www.searchanddiscovery.net/documents/2004/horn/images/13.htm and http://www.searchanddiscovery.net/documents/2004/horn/images/14.htm i could see that middle east are dominated by carbonate. Is it possible that this could create a skewness towards large easy to tap reservoirs that gives the perception that they have lot more oil than they have.
It's possible. Saudi Arabia has (had?) the most productive wells in the world because of the exceptional quality of their reservoirs. That's explains also why they have drilled so little compared to the US for instance.
I first saw that chart about the 1988 reserve increase in a 2000 issue of Outstanding Investments. They had all the other OPEC countries graphed too, and it was the beginning of my interest in peak oil. I still remember the sudden knot in my stomach when I saw the charts and "grokked" their meaning. Suddenly, the year 2000 doomers did not seem quite as whacky as they did before.
Yes, if Stuart is right the loglet result is probably too optimistic. Growth is coming from the type II group as I have tried to explain here. The type II group is dominated by KSA and Russia. If KSA is going down or flat and Russia not as strong as it used to be in 2004, I don't see then how we can compensate for depletion coming from the type III group (countries that have passed their peak) as shown below. The only positive news is that tar sand production from Canada is growing nice and strong and will probably meet the most optimistic forecast.
We will probably loose an additional 0.5 mbpd of production every year due to depletion in the type III group (blue area above). If KSA enters that group, well... it means the world has peaked.
At around 7 PM CST, it was 12th on my RSS feed with 342 diggs. As I write this comment, it has 354 — apparently this article has reached 'critical mass' on digg.
If I can only understand about 50% of what someone says because he speaks over my head, then I don't dig it.
Stuart: Impressive article. Your ability to summarize a lot of info into an easy to read format is top-notch. Maybe you should get a book together and contact an agent/publisher.
Wow...amazing work Stuart.
This has to be one of, if not, the best article I have ever seen on TOD.
Excellent graphs and references.
=================
It's all about population!
Absolutely agree - superb article. The previous article by Stuart last week did not entirely convince me. After all, KSA's lower production had prevented oil falling below $50 and now brought it back up to $60 without causing much sign of further slowdown in USA, or any at all in the EU. However, Stuart's detailed dissection of oil price, OECD economic performance and KSA output over 5 years, to my mind leaves very little room for alternative explanation.
I think those of us who watch TOD should take this as warning that the peak oil storm will break upon us fairly soon. IMHO, this will occur when this reality begins to be recognized by the MSM and hits the money markets and business optimism. My guess on this has been for some time, the second half of next year, but that may be optimistic. So those of us here have maybe 15-20 months (max.?) to get our affairs in order and, if we are minded, help our local communities to prepare too.
Stuart's book
Stuart - one of the things that jumped out at me looking at this chart was the symetry - that is the point you make from the chart. It is also quiet clear that Iraqi production surged 600,000 bpd (settling back to 400,000 bpd) just before the fall in Saudi production began. And shortly after that the Baku-Tiblisi-Cayen pipeline was oppened with first oil on 6 May 2006. This was ramping to 1,000,000 bpd over the course of a year I believe. So here we have from these two areas alone somewhwere between 900,000 and 1,400,000 bpd new production coming to market and Saudi production has been reduced by around 800,000 bpd.
Do you think that the Saudi decision to reduce their production may be related to all this new oil flooding onto the market?
Euan,
If Saudi Arabia has been cutting the production of oil voluntarily for the last 17 months, it can only mean that they want to drive the price of oil higher. But that doesn't make any sense because they continued to cut production as the price surged to $78 last summer. And if they think the world can bear $78 oil without any problems, why did they not defend that price by cutting their production deeper as the price fell to $50 in January, 2007?
You can see that for the last 17 months, their production has declined consistently whereas the price of oil has been all over the place.
In my opinion, the evidence is overwhelming that Saudi Arabia has peaked and the decline in production is not voluntary.
Suyog, best to just address the issue raised in my edits to Stuart's chart. Do you think that an additional 1.4 million barrels per day coming to world market is significant and do you think there is a possibility that the Saudis actions may be influenced by such events?
WRT to Saudi actions and price, I imagine that they study supply and demand very closely and adjust their production accordingly. Getting ths balance right is of course difficult. Price fluctuations will flow from these actions and not the other way around.
Euan, I think what you are missing is that demand is a function of price. There is a lot of forced conservation going on in poor countries. Don't you think Bangladesh & African countries would love to buy a few more tankers of crude oil if price was $20/barrel? Even in the US, quite a few people will buy SUVs and pickup trucks instead of small cars if price were to fall that low.
Only a year before the Saudi production peaked, they were trying to keep the price of oil in the range of $22 - $28 and $35/barrel was viewed as a calamity. I find it hard to believe that they suddenly started cutting production because they were concerned about an additional 1.4 million barrels hitting the market; especially when the nominal price of crude oil was so high.
Saudi Arabia has stated several times that they are not going to flood the world with crude oil when refined product price margins expand. If you take those statements into consideration, you will find that they have no choice but to shut in production as refinery capacity is still limited.
But the Saudis were telling the Asian refiners a few months ago that they will be cutting their supply of crude. If refinery capacity was the issue, it would be the other way (refiners would be telling the Saudis to ship less crude), wouldn't it?
You are confusing Saudi compliance with OPEC cuts with Saudi reduced oil production.
Stuart is trying to argue that Saudi production has been in decline before they implement OPEC cuts, and those production decline are caused by field exhaustion rather than business reasons.
At least, that is how I am reading it. Feel free to correct me.
If that is Stuart's position, then I think there are many flaws with it coming from an analyst's perspective.
I perfectly understand Stuart's position. But you attributed Saudi production cuts to refinery capacity. My position is: if refinery capacity was the issue you would expect the crude oil consumers to tell Saudi Arabia to ship less oil; you wouldn't expect Saudi Arabia to unilaterally announce cuts in crude shipments to refineries.
Also, note that Saudi production cuts of 1 million barrels per day (so far) are twice as large as their share of OPEC cuts.
Then, the answer to your statement is that refineries are ordering less Saudi oil.
The only cuts that Saudi have done that are under contract are the ones for OPEC cuts. (These are contracts with pricing already predetermined based on market prices.) All other cuts are from open market pricing. If refineries lack oil, they will bid up these prices, which is not happening. On the contrary, prices have been dropping and oil shipments from other OPEC members and from Caspian region via Turkey have been shipped out without contracts during latter half of 2006. The oil market picture is very clear that refineries do not lack oil at all.
Suyog,
The time frame you discuss might not be long enough for Saudi organizational politics to come to a course of action. The price signals might mean exactly what you think, and then again they might not.
You will certainly get a better picture during the next demand surge - perhaps during this summer's drving season. Market reaction cannot be swept under the rug.
Further, all of the above charts are in US$. Now, I know that Crude is priced in US$ - for the most part. Oil, priced in Euro's to europeans is 9% (+ or-) less than Oil priced in US$ to Americans compared to the year ago period. The decling dollar has at least some impact.
Stuart's is a compelling narrative. The idea I got while reading was :
It looks to me that the Saudis increased production every time the price got out of control. In 2004 they chased it down at $45, then slackened off production; in 2005 they again chased down peaks at $50 and $60. In 2006, they failed to increase production to head off peaks at $65 and $70 : compelled to let demand destruction do the job...
Henceforth we have "plenty of oil". By the same token, there's no shortage of caviar either. For those who have the money.
I love your parallel...until they kill the last sturgeon...
Oil if you can afford it, until they stop exporting it.
=================
It's all about population!
Euan:
If you want to maintain that they are adjusting their production up and down voluntarily in pursuit of something, what is the something? If they have voluntary control of their prouduction level, then in order to have a falsifiable hypothesis, you have got to suppose that they are in rational pursuit of some goal with that production level. What are they in pursuit of, in your view? Constant price? Maximum profit? Target OECD stock level?
Stuart - I would suggest that they are striving to achieve a supply demand balance in the global market. This needs analysis and forecasts of supply and demand, both of which are difficult to achieve accurately. But when they see several hundred barrels of new oil coming down the pipe they may act accordingly.
I venture one flaw in the analysis that you lay forth and that is the notion that the Suadis watch the oil price and adjust their production accordingly. I imagine they are much more likely to monitor supply and demand, act accordingly and price will flow from those actions. I'd be interested to hear others' views on this.
One part of your yarn where you may be on the right track is the entering of a new era with OPEC. What has happened is that we have gone from an era where OPEC in concert were supposed to act as swing producer (that never worked because of cheating) to one where Saudi Arabia are all powerful within the OPEC block - being the only nation with significant reserve capacity. So we see an end of cheating (that actually caused GWI) and Saudi in the driving seat. Does $60 suit them - well Hell its still only 10 cents a cup.
I'm going to post a few more comments if that's OK, picking holes in your argument. As I said in my post earlier this week, you may be right, I'm just a bit sceptical about drawing such firm and potentially catastrophic conclusions on a stack of well researched but circumstantial bits of evidence. We will end the evening on a humerous note!
What about the United Arab Emirates? Do they have any spare capacity? They are significant producers, yet I hardly ever see them mentioned in any context whatsoever.
And what about Kuwait? Does the decline of Burgan establish all by itself that they no longer have spare capacity?
"supply demand balance in the global market. This needs analysis and forecasts of supply and demand, both of which are difficult to achieve accurately. But when they see several hundred barrels of new oil coming down the pipe they may act accordingly"
Ok, but supply and demand will always, in some sense, balance (absent major sudden disruptions). Prices will adjust one or the other until they do. So it doesn't really mean anything to say they want to specify supply and demand balance, since there are many possible balances. Should they pick the $20 balance? Or the $80 dollar balance? Or pick the balance that holds stocks at 80% of capacity? Or what? If their goal is either a particular price or a particular stock level they've sure done a lousy job over the last few years, as I discussed in more detail in the post.
What you seem to be groping towards in the comment here is the idea that they are trying to keep total global supply flat, so when somebody comes on with new production, they cut theirs to keep total global supply constant. But why would they target flat total production? It's almost like they decided to bring peak oil early for some reason.
But then in comments below, you're cherry-picking features out of the price graph and arguing that they explain certain features of the supply graph.
Overall, the impression is you're grabbing bits and pieces of different explanations for different pieces of the production curve, whatever will fit each piece, without having any coherent hypothesis of what the Saudis are trying to do, and then showing how that hypothesis explains all of the data. I can't really refute a hypothesis like that because it's not well specified enough to really know what its implications are.
Thanks, Stuart,
re:
"But why would they target flat total production? It's almost like they decided to bring peak oil early for some reason."
Interesting.
Just out of curiosity...do you have (or could you come up with)an idea about this?
And...does Advokat's idea make sense? (Or, are you saying his/her hypothesis isn't specified enough in the way it relates to the data?)
Euan's hypothesis is, in other words, is 'not even wrong.'
Stuart please expalin yourself. You know as well as I that global demand can go up as well as down?
For the sake of clarity:
Change in Global demand ± change in Global supply (ex OPEC/KSA) =(approx) Change in OPEC (KSA) production
So if Global demand goes down or Global supply goes up (e.g. the Azeri Field), then the swing producer (OPEC dominated by KSA) may adjust their supply accordingly. Can you please detail which part of this you don't understand.
In 2006, Global demand was flat, supply from other sources was rising so OPEC faced a choice. Cut supply and sustain price or continue to produce flat out and dump the price. You seem to think they should have done the latter?
You might understand Stuart's argument if you would learn the meaning of the terms, supply and demand. These terms refer to schedules of quantities that producers or consumers are willing and able to offer or buy at different prices at a given time. Supply, to choose one term for clarification, does not mean the amount a seller puts on the market at a given price. That is quantity offered. Supply means the differing amounts offered at different prices.
Sofistek, lower down this page, points to the inaccurate use of the term 'demand' in data reports, when consumption is what is being described. So your misuse of the language is understandable. But it appears that a misconception underlies your misuse and this misconception is blocking your ability to comprehend Stuart's explanations.
Your error is in believing that the economics-theory definition of "supply" applies strictly to the phrase "oil supply".
I second toilforoil's comment above. From an economics perspective there is no such thing as free-floating demand(independant of a specified price) that must somehow be 'balanced' with supply.
Don Sailorman could give us a nice lecture on the difference between consumption and demand.
Is Euan saying that the Saudis are targeting a certain level of world consumption?
Or do the Saudis have price targets? (for any of a variety of reasons)
Or are they maximizing revenue?
It appears that both toilforoil & asebius fail to understand the concepts of supply and call. It is also a reality that OPEC failed to address with its quota system.
During a typical year, demand can vary by 2 mb/d and I have mentioned that Q2 is usally the softest. The call on OPEC is down 1 mb/d at that time, but global demand expects an extra 1 mb/d from OPEC in Q4's.
The accomodation of this led to the original label of cheating. But it is an unfair label if that assistance goes *both* ways.
OPEC's position is that the supply should be level through the year and inventories will take care of the high curve season. This is what transpired in Q4 of 2006 and may be the scenario unfolding for 2007Q4.
Euan's comments reflect this practical flaw. OPEC regular confernces and special meetings often are unable to respond to the dynamic marketplace in real time. While some nations are pleased to surge when needed (to get extra revenue), they frown upon the reverse requests of low call on OPEC (because it hurts national revenues of NOC's).
Saudi Arabia affluence dictates that it does not have these
concerns and it yields indifferently to monthly changes in call. The risk of its actions has always been that other OPEC nations accuse SA of cheating and then rationalize doing it themselves. This has forced SA at times to be right on the money wrt quota (as one of Stuart's graphs demonstrates).
Insolent OPEC members must learn to be team players and mature in their comprehension of the seasonal and geopolitical factors affecting global demand and the subseqent call on OPEC as the swing partner.
Impatience on this issue has caused SA to go public with statements of concern wrt whether it alone should be the swing producer or if OPEC as a pool should attempt that role. This is magnified by the reality that its surplus capacity was significant one or two decades ago; and could easily manipulate supply and price. But at the 86 mb/d flow rates of today, their moves are but hiccups.
It's time you returned to the classroom, Freddy.
Last Viking, you got any links on this point. This is not something I'd previously thought about but which clearly just has to be true. OPEC / Saudi reserve capacity is shrinking whilst global production is rising giving rise to a very potent de-gearing of the effect of swing production.
Toilforoil and Asebius - thanks for the lecture in economics where I have no formal training.
IMO this bit of the thread has gone off at a tangent. The point I made at the outset was that about 1.4 million bpd new global production started to come on at about the time that Saudi production began to fall.
Armed with the knowledge that this was going to happen do either of you think that Saudi and / or OPEC may respond in some way by adjusting their production volumes (as swing producers) or is this something they would simply ignore?
Stuart,
The answer to your question is answered, in part, by the analysis of the Hotelling rule with regards to pricing a non-renewable resource such as oil. The methodology involves maximizing the present value of the stream of profits out to infinity. Now, the Hotelling scenario is far too simplistic to apply directly, but it gives us a very good intuition.
Before 2003-4, the world more or less seemed to perceive oil as being infinitely renewable, in the same way that coal is perceived today, even though technically, coal is not renewable. The Hotelling analysis is based on the "perception" of renewability within a generation or 2. Thus, timber, while renewable, may also be viewed as a non-renewable resource for the purposes of the analysis.
It could well be that Saudi Arabia got "religion", so to speak. Once the $22-28 price band broke, crude oil went up and up, economies didn't crash, and the "Peak Oil" meme gained some momentum, Saudi Arabia realized that this is the time to start behaving according the Hotelling rule. This is especially true, when they discovered that there were no other viable swing producers out there.
Your analysis also focuses on what I would call "near-term" capacity. Can KSA raise production 1.5m bpd? Probably not. Can they easily invest in up to 300 rigs (several times more than they currently have but a far lower number than other oil producers) and then increase production by up to 3m bpd? Probably.
As I mentioned in my last comment, the key variable for me is the ratio of total recoverable barrels remaining in the ground and current production. If we assume KSA has about 85Gb left, then at 8.5mbpd, that is an R/P ratio of 27.4. We've seen in the OECD that R/P ratios higher than 15 can easily raise production by 5-10%.
So 10 % is 1 mbpd. Why you are hypothezing/argumenting on 3?
The risk is we are never gonna see >10 mbpd from SA again...
Euan,
this chart is the only glimmer of hope that I now see for the future of SA oil production. As noted below, it is within the Kingdom's strategic interest to have some semblance of order in Iraq. I do not think it is a big stretch to now examine combined Saudi and Iraqi production for clues. I think that is now clear that SA cannot ramp up production above 9 mmb/d and they will be hard pressed to maintain it at that level. The unique partnership between the House of Saud and the US makes me believe that the US will insure that KSA is the last one standing by explicit coordination of the Iraqi and Saudi production. The US will go out of its way to enable the Saudi's to minimize their decline rate at the cost of Iraq. The decline is combination of voluntary and involuntary factors.
This is classic example where oil truly manifests itself as a strategic commodity.
For the record, I find Westexas's and Khebabs HL analysis of Saudi production compelling. The kingdom is clearly in a transition phase and is at the tipping point, it is only a question of how long "above ground" factors can obscure the truth. I don't recall the poster that reiterates that 3Q07 will likely be the moment of truth....we shall see.
PS Excellent article Stuart... I doff my cap.
Hello SS, Euan, and other TODers,
Thxs for this keypost SS, and contrapost by Euan--Great food for thought! I would refer you to my earlier 3/7 post that generated no replies, reposted again below for convenience:
+++++++++++++++++++++++++++++++++++++++++++++++++++++
Hello TODers,
If we take the word of Heinberg's inside source that Ghawar was under 3 million barrels/day, then add the now online 300,000 b/d of Haradh III: Can the other KSU oilfields make up the difference? Could this be a another method to help predict the possibility and error bars of KSU being postPeak?
http://energybulletin.net/18904.html
-----------------------------------------
[4 AUG '06] What happens next? It depends on the real condition of Ghawar. Perhaps a heroic drilling campaign could result in a temporary bloom in production, lasting perhaps three years, followed by a swift, terminal collapse. On the other hand, it is possible that the field has been so thoroughly exploited already that we are seeing the irreversible, rapid decline. At the ASPO conference a well-connected industry insider who wishes not to be directly quoted told me that his own sources inside Saudi Arabia insist that production from Ghawar is now down to less than three million barrels per day, and that the Saudis are maintaining total production at only slowly dwindling levels by producing other fields at maximum rates. This, if true, would be a bombshell: most estimates give production from Ghawar at 5.5 Mb/d.
-----------------------------------------
If one looks at SS's graph [green background with the two hand-drawn lines above]: this bombshell of info was right when Haradh III was turned on. So, is this a valid equation?--> 9.2 - 3.3 for Ghawar = 5.9 mmbpd for the other KSU oilfields. Is this even possible for the queens, princes, and barons: Berri, Abqaiq, Zuluf, Marjan,etc?
So if Ghawar is dying, but the other oilfields last Aug had the capability to be only temporarily ramped up to cover this decline-- does that help explain all the unsold heavy crude and the further decline since last Aug?
Bob Shaw in Phx,Az Are Humans Smarter than Yeast?
+++++++++++++++++++++++++++++++++++++++++++++++++++++
Recall that ASPO's insider, called 'Nemesis', has been eerily correct in his/her prognostications as evidenced by earlier postings by TODer Down Under. I thank him for binging Nemesis to greater TODer attention. Additionally, has Heinberg's insider been accurate? Hard to tell without direct Aramco confirmation, but Deffeyes, WT, Darwinian, Ace, Simmons, Pickens, and others seem to be finding corroborating data with the passage of time.
Now our very much admired data-freak SS seem to be reaching the same conclusions as Nemesis, Heinberg's insider, and the experienced data analysis of the aforementioned Deffeyes Group. Let's not forget that Simmons and Pickens can easily afford to field impressive research staffs on their own as they have billions$$$ in market play.
As repeated again from my earlier posts when Heinberg first released this bombshell info in Aug06: He should have kept this confidential unless he could have found additional confirming evidence. I contend that Heinberg was 'played', and benefits accrued to some [I just don't know whom]. Nonetheless, it has been added to the mindset of astute observers along with the Nemesis reports, and other FF market data.
The geo-political and monetary aspects should not be underestimated vis-a-vis the strictly straight forward but data-obtuse geologic depletion. As Churchill said, "We are entering a period of consequences". I note the low prices mentioned by others at US election periods--Could Heinberg's source's revelation in Aug purposely have over-hyped the market early when combined with over-blown hurricane and ME expectations, then Goldman Sachs' index revision combined with other events to drive the gasoline price so low in Nov. 2006? Recall how TODer SelfAggrandizedTrader [SAT] had this so clearly pegged so early. Even RR, who I believe clearly watches inventories closely, was late in recognition.
As Euan, RR, and others point out downthread, it is entirely reasonable for KSA to see early forsee climbing Russian and Iraqi output, plus the addition of the Caspian pipeline, and other factors: then adjust their output accordingly. But the question remains: has Aramco adequately forseen and invested in a timely manner to offset their inherent oilfields depletion's decline rate to retain sufficent swing capacity to market demand?
If Heinberg's source [same as Nemesis? I don't know!] revealed 'Truth'--I strongly doubt if Ghawar alone can regain back the 2.5 million BPD of swing capacity [haradh-3 maybe the last gasp?], the Deffeyes Group's conclusions are sound, and SS's ugly, jagged future KSA downslope will be the result of heroic efforts on the remaining oilfield queens, princes, and barons. Ghawar, the king, will be riding astride untold thousands of flagging horseheads into the depletion twilight.
If Heinberg's source revealed 'False Info', then RR, Euan, and Dave Cohen's Sadad Al-Husseini conjecture maybe correct that KSA retains additional capacity, and the voluntary resting of Ghawar, along with further drilling and infrastructure enhancement will allow later, and greater kingsize flows combined with the other oilfields' production.
But then the earlier release of this 'False Info' [once proven false somehow] from Heinberg's source would strongly indicate that geo-political concerns override or will be used to direct geologic concerns going forward. Time will tell what conclusions we can draw from this.
Bob Shaw in Phx,Az Are Humans Smarter than Yeast?
This reduction is not a decision, it is INVOLUNTARY. That is Stuart's point. Of course you know that. You're just trying to twist his words and give the impression he is saying something he isn't.
Also, All what Oil? Even an extra mb/d can't save them from this decline.
Stuart,
this was a VERY impressive analysis!
I think you and Euan lately have done some admirable pieces of analysis (well documented and supported by impressive graphics) that has shed some more lights on the oil supplies situation in KSA.
Thank you both for sharing.
NGM2
I'd suggest to TOD readers that they e-mail a link of this article, along with a few comments and some of the initial summary to news reporters and to influential people they know or have even slight contact with.
To link to the article, close out of the article and click on the permalink. Send a copy of the permalink address.
Gail,
It's far too late for that.
I suggest they figure out what, if anything, they can do to protect themselves and their families, then take that action.
Hi Chimp/AMPOD/Matt,
Given your premise, ("too late"), what is the action you suggest? (I'm being 100% sincere, BTW.)
SS - Thorough and impressive as always.
Here we differ:
If SA production is cut in half or even by 1/3 in the next 5 years, as your last graph suggests, that will be the smoking gun that will trigger a mainstream realization globally that 'holy crap our oil really IS finite, and soon!'. Instability, resource grab (local and global) and the geopolitcal game of RISK, will quickly ensue. Its never been about running out of oil, its been about the perception that oil will be readily supplied over near and intermediate future.
Irrespective if SA is only 8% of worlds production, it means that all the warnings are true, Peak Oil is here, and we're not going to Disneyland.
I would recommend that Senate staffers and aides print this out and show it to all policy people in DC and elsewhere. However, as valid as your points are, all it takes is one respected authority (CERA comes to mind) to poo-poo it and the warning is lost, except to those who can connect the dots.
Nate, I agree this is one of the best articles ever to appear on TOD, perhaps even the best. And I must agree with Nate on this second point. Once it becomes obvious that Saudi does not have vast reserves, not even close to the 262 billion barrels they claim to have, but more like 70 billion barrels instead, this will hit the financial world like a bombshell.
People will then realize that not only are Saudi reserves mythical, but so are the rest of those vast Middle East reserves. I shudder to think what effect this will have on the stock markets of the world.
Ron Patterson
Yes, it's great. And now compare it with what appears simultaneously elsewhere:
Huffington Post
I'm with Simmons: "The situation is desperate."
I'm with my geology professor, Craig Bond Hatfield: "It's too late."
NYT with a cheshire grin :)
I luv being right
Now, I know only Freddy writes like that.
Glad to have you aboard again. :)
If Saudi production is down by 1/3 people will realise “the party’s over”? Maybe not, not if the decrease can be explanined by above ground factors on the evening news.
For example what if there is millitaty acation againest Iran which somehow ends up a significant chunk of Saudi oil infrstructure being destroyed? Production will be down – people will blame the war and live in hope for brighter times to come.
Another example, reveloution in Saudi, the overthrow of the House of Saud with a period of civil unrest during which production falls. Again an above ground factor allowing people to hope to brighter times ahead.
I’d be very surprised if a permanent 1/3 decline in production would not be accoumpined by some above ground factor which could be blamed – the chicken and egg debate wouldn’t be mainstream.
Sigh...
Chris - you're right. Its quite possible Peak Oil might never be realized as geologically based, but will be rationalized as due to some 'above ground factor' in perpetuity. "There is plenty of oil - if only that real smart petroleum geologist hadnt died in the copter crash, we'd be able to get 100mbpd next year!" There will effectively never be 'proof' and people will be arguing about it 10 years after the fact.
Its like debating evolution with a religious apologist - 'well how do you explain that humans have tailbones'? "well- God works in mysterious ways"....
Hows this juicy rationalization - "well if those democrats hadnt removed the troops back in 2007 from basically the heart of oil central, we'd still have single digit gasoline! Duh!"
This is CERA's saving grace and probably true. As long as there is an "above ground" excuse for drops in production, no one can ever really declare a geologic peak. It is a sick little spin.
What does it matter to the world how peak oil is explained. Isn't the outcome the same?
Tom A-B
Not really. A recognition that the peak is real and permanent would elicit different reactions than a belief that next week [or month or year] things will get back to normal after the arabs, the big oil companies, the illuminati, and / or the environmentalists stop screwing with the gasoline supply.
Buying a used land yacht in 1974 wasn't necessarily a mistake on a micro level. Buying a bargain priced monster SUV in the crunch period after peak oil probably won't work out even on a micro level.
This isn't happening in a vaccuum. It doesn't matter what they believe. As, Deffeyes says, there's a snowballs chance in hell of a soft landing. Game Over is Game Over. It doesn't matter who they blame for it. Those with the power to grab everything they could in the last days of oil will still be in power.(Probabally running little fiefdoms around the world). Most others will die in some horrible fashion. No there won't be any great holding of hands and sharing of what is left. Those in enlightened Post-Oil communities will be knocked off for their resources or incorporated into the aforementioned fiefdoms and become serfs. Certainly the world will not continue as it has at a smaller scale. Those that think protest will accomplish anything; Yes it will. It will get your ass thrown into one of Haliburton's Concentration Camps.
Yes we're all going to die. But if you are expecting a quick peak oil induced population crash, [it may come at some point in time if our choices are stupid enough for long enough], my contention is that most of us now living will die from old age. Maybe with a sweater on ... but from old age.
American don't need to consume like we do to live very well. We don't need to buy as much stuff. We don't need to drive to work alone 5 days a week, go shopping 7 days a week [for stuff that we don't need], drive our kid across town to excercise by playing soccer, drive 3 ton SUVs every day [alone], continue to buy mostly incandesent lights, transport most of our long haul freight in trucks, eat apples flown in from Chile, under insulate our homes, heat / cool every room in our oversized dwellings, maintain our indoor climates at 74 in the winter and 68 in the summer and on and on and on.
Oil production won't stop. The tail to the right of the peak oil curve will be long and probably quite fat.
There is a lot of coal. Nasty stuff, lots of CO2 but it's there and we'll use it.
There is a lot of uranium. When push comes to shove, the supply of grades of uranium that can be mined & processed to yield a positive EROEI is vast. Breeder technology -- yeah probably.
Fusion --- well maybe.
In situ recovery of tar sands and oil shales -- another well maybe.
The sun shines, and solar cells will decrease in price over time.
The wind blows and wind power is economic now.
The sun shines and biomass [probably algea] will make economic sense and a reasonable multiple on energy invested.
I suspect that pricing will take care of most of the problem if people are not flim flammed into believing that more oil is going to be forth coming.
If the peak is now or even 10 years from now, CERA is the enemy. Politicians who believe in throttling energy production or push unsuitable "solutions" such as corn based ethanol, or price controls on energy are the enemy. Environmentalists who oppose construction of nuclear power plants or wind turbines because they are ugly or are threat to bird populations are the enemy.
I have rarely been noted for my optimism, but even if I am wrong and we are indeed doomed as a civilization, we lose little or nothing by trying.
RR: IMO, you are basically correct. America has a simple way of dealing with these supply issues, which is basically you take the bottom 25% of users of any product (in this case oil) and they are thrown to the curb (demand destruction as the mouthpieces call it). Bingo-problem delayed for a long long time (assuming you are not one of the bottom 25-30%). Remember, this is a country that will not even provide proper medical care for these people so IMO their oil usage is not a priority to TBTB.
RW & BT Both good posts. Believe together you have both outlined the dangers of ignorance and painted a most plausible outcome.
Agreed - plus the political ramifications are quite different. Blaming supply problems on Ay-rabs, Lib-ruls, Joos, and Tree-Huggers will be easier if above-ground excuses are what the media and political system concentrate on. Below ground causation would cut to the heart of the way we currently organize and run our society. Much easier to find internal enemies rather than focus on the entire society and, more importantly, its leadership elite.
I imagaine that in the degenerate, primitive English that will be spoken after the collapse of our current civilization, the word 'Lib-rul' will come to be associated more fully with demons and Satanism than it is currently in some of the darker parts of North America.
I "second" all of this:
#1) trigger-->holy crap-->resource grab
#2) staffers print-->CERA poo-->warning is lost
Some folks implore TOD members to get this story out to the public, but this will do nothing except cause #1 above -- useless panic.
Whereas, #2 keeps happening all too frequently (e.g. Bartlett speaks to empty congressional chamber).
Relax. When the price of gasoline went up to $78 last summer, we got a lot of elite attention. When it gets up there again, we will again. The CERAs are only winning now because the price is currently low due to demand destruction. Once demand starts to grow again, and it cannot be supplied, the New York Times will change its tune. It will not be long.
I agree that #2 above will eventually change. It's #1 above that's hard to relax about. TOD members seem to keep wanting some sort of validation from the MSM -- a scenario that could lead to useless panic.
I think some of our best political leader probably understand the situation but do not think they can be straight with the public about it because of the impact it would have on the next election and the pressure that would come about for your scenario #1. Bill Clinton has previously spoken about imminent peak but recently he quoted Matt Simmons as saying we would be out of oil in 35 years. The 2008 election will be dominated by the peak oil issue even if it does not soon come to be openly accepted.
I struggle with that. My brother says if Im wrong I will look foolish writing what I write and if Im right I should shut up and share my analysis only with friends and not with the public. However, it feels like the right thing to do - to raise awareness of these issues by asking better questions and getting info into wiser and more influential minds than our own...
So we are left with the middle ground as our objective - raise awareness with policy and decisionmakers but NOT causing a mainstream media panic at the same time. A tall task....
There is also the additional risk that an unfortunately timed (and unrelated) nasty recession could delay the price signals that drive mainstream opinion. Many people have been "disproved" socio-economically by just such events.
The public has essentially no history of being able to separate an accurate theory from unrelated (but confounding) developments. The threshold to credibility then widens dramatically.
Considering that the bubble economy today was driven from the policies of our central banks i.e manipulation by the few and powerful I question that the timing is an accident.
Also the price of oil is not unrelated to our economy the relationship is complex but it exists.
The fact that we should enter a bad recession in 2008 the first year that peak oil would be obvious is intresting ...
Hopefully we will get a chance one day to find out exactly what people knew about our oil supply and when and if they acted based on this knowledge.
A recession in 2007/8 could keep PO from becoming obvious to the public, but if for the first time ever, oil prices remain high despite worldwide economic contraction, that would suggest to me that PO is really here. And surely someone like SS could sort out if oil prices are contracting like they should given a particular level of economic contraction. If PO is truly upon us, we may see an interesting phenomenon: the economy contracting in lock-step with oil-production.
I don't know. The storyline can still read: 1) internet bubble and collapse, 2) dramatic interest rate cuts, aggrivated by the fed mis-reading their own inflation numbers, 3) resulting in unintended consequence of housing bubble, and finally 4) debt laden recession.
Oil is kept offstage in this saga. Can't be definitively tied to the crime.
What people knew? I watched one Greenspan speech twice. The one that was very soon after his chairmanship ended, where he talked about the energy problem in front of a special committee. Very interesting. There was another panel which included the head of the IEA. Also very interesting. But none of this plays out in the storyline above.
#1) trigger-->holy crap-->resource grab
#2) staffers print-->CERA poo-->warning is lost
Yep, 1 and 2 are not either-or. They're both happeing right now. The smart money and in-the-know elites already made for the exits and reworked their portfolios. The MSM infotainment fed masses will get #2 untill reality has repoed their house and put them out on the stoop.
I agree. Whatever KSA are/are not pumping for whatever reason, many will take no notice while oil remains at $sixty-something. I believe the price will have to approach or exceed the nominal record ($78) before the spotlight switches back to KSA and TOD. That may still be a year away and I don't rule out some "above-ground" factor being conjured up before or about then to try to hide the fact that it's due to geology.
And further, an above ground factor could actually raise the price of oil (not conjured up) which again obscures the geological picture. In fact, above ground factors are perhaps more likely as supplies tighten.
Question:
What (if any) is the common tie that makes PO accepters different from the rest of the world?
Intelligence?
Education?
Less fearfulness of the unknown?
Pessimism?
Carefulness (caring for the future)?
Ignorance (of what really matters - eat drink and be merry)?
If we can discover what that is, then we'll know why we believe as we do and how best to make the 'knowledge' more widely known.
in my case, being overeducated, single, in my mid-30's with no offspring, and by design having not much in the way of material wealth makes PO easier to accept (but not easy). Certainly no-one I have introduced the idea to really gets it or wants to...but most have spouses, kids, houses/mortgages, cars, boats, trust funds etc...can you blame then for not wanting to hear about TEOTWAWKI?
Peak Oil now is a good thing for our civilization. We need to launch onto a trajectory of declining CO2 emmissions and the slow squeeze from Peak Oil will do it nicely.
$60 Oil appears sufficient to squeeze Oil demand growth to nothing while the world economy has to continued to grow at 5% per year. I would never have guessed this was possible.
Maybe $90 Oil is sufficiently expensive to launch a trajectory of 1.5% decline per year.
Will it? I don't know but we've surely passed the point of 1.8% growth per year we had at $30 Oil.
Peak oil probably means economies will transition to coal through ctl process or some such thing. To understate the case, coal is not real good for GW.
I would make a rather decent bet that most believers in Peak Oil are latter-borns (i.e. not first born children).
Maybe I'm the outlier, then...first-born, have a child, decent income, etc.
Another outlier heard from.
Q. Why would one assume that first-borns would have more difficulty in accepting the reality of PO than latter-borns?
I'm also first-born.
I wondered more about the matter of character traits of those posting, not their sibling status.
There are two traits I believe show up in the posters to this site:
Fearlessness, and
Forward-looking.
However, that could also be viewed as 'too stupid to know danger when they see it' and 'living in their own little world'. Which almost certainly describes me. (First born).
Things required for peak oil belief..
Some sort of resposibilty for yourself / others (often a firstborn trait)
Rejection of dogma
Imagination
Curiosity
Most important is numeracy and critical thinking skills
Scientific training helps
I am not fearless or forward looking
At least not any more!
Carbon, UK
Meyers-Briggs personality type INTJ or INTP would surely predominate here as it does in science and engineering.
That might explain the technical bent (and preference) of the sight, but not of the interest in the world-changing "event" of peak oil.
I'm a INTJ/P (a tiniest tad more J, I think)..
Gosh, I think we'd need at least 3 data points to calculate a normalized correlation coefficient. :-)
Seriously though, for example, a graph of the percentage support for "scientific controversies" by birth-order shows that laterborns support is far higher than support by firstborns until the "controversy" has been generally accepted. In the "middle" of the controversy it's about 70% to 40%.
(ref, Sulloway, "Born To Rebel", pg 336, Receptivity to Scientific Theories over Time by Birth Order, sum of 21 historical controversies).
I'm a first born son of five sons. I was made aware of Peak Oil in a financial news article on the web several years ago. Within-my-lifetime phenomena that could "change everything" greatly interest me, firstly as an observer of the phenomenon as it unfolds, and secondly to base current decisions with regard to the future situation.
By way of analogy, On a Sunday morning in August 1992, I clearly remember taking my 10 year old son outside our Coral Gables apartment and explaining to him that the beautiful world around us was about to be destroyed - that night. Hurricane Andrew had been just upgraded to Category 5 over the Bahamas and was aiming straight for Miami. Forewarned, we took the proper precautions. Now I live in Austin, Texas.
It's the heart of the matter. I do wish for validation in the MSM. Principally because if above ground factors continue to be the dominant mainstream rationale for rising prices most people will tend to blame some geo-political event. If, for instance nationalization of oil in Venezuela is the reason access to oil is limited, then an 'above ground' 'bringing of democracy' to oil rich states might be in order.
OTOH if it seems the long term potential to create increased access with military occupation is truly limited especially if what Stuart, Simmons ,WT are saying is right. Why risk damaging access to a very limited resource which is increasingly going to be used in domestic consumption anyway.
Time to transition to a more sustainable future a la Switzerland or Sweden? I figure there has been an overt insightful policy revision to make these changes happen. Enlightened public opinion would be a plus.
If everyone buys there are still plenty of great fields to be conquered well then hell no.....just party on!
I'm trying to imagine what support by the MSM would accomplish. Can you think of an issue where MSM support helped?
After thinking for a few minutes I came up with "smoking". There was a lot of industry resistance (and other doubters) about nicotine addiction. But eventually, MSM helped shift the public to fighting it.
Of course there are many examples where MSM support hasn't really helped. And even the "smoking" issue took a long time. Also, no one *needs* to smoke.
What's the model for moving forward? I'm not trying to "bait you", I just don't see it working. I still only see useless panic.
No that's fine. Your view may prove to be the more valid.
I am traveling now around Seattle. Nobody has slowed down there are lots of 6000lb. single occupancy vehicles on the road. The cheap oil extraveganza. Reality belies the whole idea that our civilization could be suddenly altered by above ground or below ground events in the Mid-East. If something significant were to happen all this activity would be in jepordy. People will surely panic to some degree. Panic with shortage to add bite will make an intense situation.
In the embargo of the 70's there was intensity, but most people believed that shortage would be 'solved' above ground which it eventually was. The taps were turned back on. Meanwhile we bought smaller cars we drove less, (mpg went up) we car pooled, and we drove 55 (well that's what the sign said anyway). Carter lectured us on energy from the White House wearing a sweater. We as a nation grumbled and groaned, waited in gas lines and drove on with a bit less. Of course this time it will be much worse.
I guess what disappoints me so far is the lack of a strong
mandate to change. There seems to be this mandate in other countries but not in the US.
I guess we ask ourselves. What they got that we don't. Is it high prices or threatened shortages. Probably.
Maybe 'recent' memory of real hardship too. Meantime we boldly proclaim our lifestyle to be non-negotiable. That is of course absurd. Therefore to ignore the chasm is to hurtle headlong w/o mitigation. Robert Hirsch looks damn worried when he urges us begin now. Roscoe Bartlett has been telling the truth for years. Simmons has been warning what Stuart is telling us may have evolved. The military commissioned a study from some big college and they came to the same conclusion about vulnerability. Pretty strong stuff, don't have the link right here. That's interesting.
If we are lucky we won't sail over the cliff in the darkness but the onset will be less than catastrophic. Then there will come a teachable moment or two. A 70's style mandate could form. A strong national voice recalling the truth that has been told could become a clearing house for dissemination. Leanan-like and urgent. Lou Dobbs for peak oil. National response type stuff. What did Barlett suggest we do? Alan Drake?, Simmons?, Heinberg?, Hirsch?, you know people that spent some time thinking about the problem. Here maybe Olberman or someone may run some in-depth analysis. CNBC, Bloomberg LINK and FSTV are nibbling at it already. With pain at the pump as a background there may be less channel switching. How much good will it do. Well it's reality. It does not go away because we stop believing in it. Every day the same dilema. The long emergency. Something's got to give. What will help. ELP, conserve, foster renewables. (Some more coal and nuclear to be sure) Back to the 70's with that one big difference. What else will there be? I hope it doesn't come on so fast that we lose our way forget what works. I'd wager that a few well timed strong trusted voices will help. It seems when people get religion about peak oil they behave differently. Witness those of us here. A bunch of true beilevers just might make enough of a difference to save a whole lot of discomfort.
xburb, (Sterling and doctorbob),
So, from my post above, it looks like we have a group here that sees a shift in the scenario to #3:
#1) trigger-->holy crap-->resource grab
#2) staffers print-->CERA poo-->warning is lost
#3) $79+ oil price-->public "realizes" PO--> some (useful?) response
...where the response is...what exactly?
Whereas I see
#3) $79+ oil price-->public "attention"-->[pick from the list]
a) above ground factors intensify (Chavez, Putin, etc)
b) more partisan populist pronouncements (i.e. PO denial and more ethanol)
c) really ugly (unrelated) recession which drops the oil$ back down
I think that the really influential people already know about PO. The public/MSM needn't get involved because of a/b/c. The price is enough for the public to deal with until solutions mature.
I think this mindset severely underestimates alternative energy sources, and the market's ability to rapidly uptake them.
The issue is that a transformation in mankind's energy paradigm *will* require a significant dedication of economic resources. This does not necessarily mean immediate poverty; rather, it means a mild form of staglfation, which, arguably, has been brewing since 2003, and has coincided with the collapse of the U.S.'s (and more generally, the first world's) position in the manufacturing industry.
Consider; which economies will be stung most, and worst, by the peak? Consider which populaces. The Middle East population, by and large, has terrible purchasing power parity, as does Africa. We'll probably see the Kingdom fall, but even an Taliban-style government will only be *very slightly* more conservative than the Saudis. Iran, if an when it falls, is going to fall in the other direction; towards military secularism. Russia? It'll just collapse into the same anarchy and chaos that ensued after the end of the cold war.
No, the nations that will be hurt worst by the peak are industrializing nations. Particularly nations whom have little to no flexibility in capital investments. This rules out South Korea/Japan/France, and most of northern Europe. These nations can, and have, gone nuclear; and mass transit, as well. Witness the joy that is Amsterdam's public transit system. China, on the other hand, will see a collapse of industry as
a) export costs skyrocket, and
b) manufacturing costs balloon.
On the contrary, financial management, intellectual property, and technological prowess become ever more important.
This leads to the second half of my post.
There is a *great* deal of wealth in the U.S., and most of the first world, actively alternatives to oil usage. In my experience, lots of development has been done in the past decade or so, but corporations have been waiting for prices to spike.
The breadth of technology that has been patented regarding BioFuel production is stunning. And I don't just mean ethanol, which is an incredibly crude sort of fuel. I mean heavy hydrocarbon blends which can be run through mostly-existing refineries, and existing sorts of petrochemical engines. And the products are substantially easier to work with than various oil "high-tech" products being extracted these days.
My own, personal experience encompasses face-to-face discussions with shockingly wealthy and high-powered business people.
Give that I work at a company which makes chemicals, it's only natural that I see things closest to BioFuel technologies, and as such, do not have the perspective to what may, if anything, be going on in materials sciences (radiation->electrical), or nuclear realms. But there are rich, intelligent minds looking at the issues involved, technologies are patented and ready to go, but the capital investments required do not yet justify the unit profit possibilities, yet. The goal of public policy (and this *is* something we are seeing worldwide) should be to encourage this investment with incentives, while managing the fade out of fossil fuels. Efficiency is one of these steps (no one would have believed hybrids would be as successful as they have been 10 years ago, and one can envision a market in 10 years where *all* vehicles are hybrid), and inexorably, additional sources of energy, including turnkey petrochemical replacements, are coming online.
There is a LOT of money to be made in managing peak oil. There *will* be a redistribution of wealth, and will most likely result in concentration of wealth, and even a possibility of worldwide economic contractions while this occurs.
In the long run, however, sustainable, and more importantly, scalable energy supplies are a necessity for growth. There is a great deal of energy to be exploited out there, and mankind only really gets better at it when forced. This isn't necessarily a rosy process (hell, it explains the horrible cycle of violence as the world developed its thirst for oil), but there's no law of physics, or conditions of chemistry which impede these developments. The technology we need is out there, is tested, and works great.
Just my 2 cents :)
Assuming you are not naming names, how would you characterize these people and businesses? Venture capital? Fortune 500? "Eccentric" billionaires? Politically connnected? "Beltway bandits"? Energy sector?
I like your way of thinking, Nuts.
It may well be that the world is more or less on the optimal course to a post-peak future : oil price is high enough to stimulate innovation, not yet high enough to choke off the economies which are working on the innovations.
This raises the somewhat disturbing idea that maybe the Saudis are benevolently guiding us towards a better future, by managing the price within this new optimal band. Or else it's purely Hotelling-rule maximisation of returns, but if it comes to the same end result, it's all good...
I'm truly impressed at the rate of R&D these days, and astonished at the centres of political decision-making which seem to have a new-found determination to act on energy reform...
In fact, perhaps the optimal result is if the hypothesis of a Saudi peak never actually gets tested : i.e. Saudi production slowly sinks "because the demand isn't there" at whatever is deemed the appropriate price...
Peak or no peak, we're in a watershed year.
By the bye, Nuts, I'm not knocking your line of business, but I think that "turnkey petrochemical replacements", and liquid fuels in general, are pretty much a dead end. Quite simply, the ICE will never be efficient enough to be a good idea in a world where energy is expensive. Much much better to go for broke on electrical transport.
Rolling out hybrids over 10 years, assuming that they are plug-in hybrids which only use liquid fuels as range extenders, may or may not be useful... depending on progress on battery technology, which is pretty stunning at the moment.
"a necessity for growth"
We need to recognize the folly of growth. Albert Barlett illustrates this pretty well:
http://www.globalpublicmedia.com/lectures/461
Excellent work, Stuart, probably your best ever, IMO.
However, ask me a question about the weather, and I talk about net oil exports.
According to the EIA, on a Total Liquids basis, Saudi consumption increased from 1.64 mbpd in 2004 to 2.0 mbpd in 2005. It took 100% of the Total Liquids production of the world's 14th largest producer, Brazil, to offset Saudi consumption in 2005.
It looks likes C+C equals about 85% of Total Liquids, so the 2004 to 2005 increase in C+C consumption was probably about 300,000 bpd. Assuming the same rate of increase from 2005 to 2006, Saudi C+C consumption may now be on the order of 2.0 mbpd.
In any case, based on a month to month decline (12/05 to 12/06), I estimate that Saudi net oil exports (C+C) fell at a rate of about 13%, which--at this rate--would translate to a 50% decline in five years.
In summary, I think the problem with the semi-optimistic post-peak view is the net export situation. IMO, we are going to have to bid oil prices up much, much higher if we wish to keep our Total Petroleum imports into the US up.
Consider the simple fact that three of the four largest sources of imported oil into the US are reporting declining production--Mexico (as predicted by Khebab); Saudi Arabia (as predicted by Brown/Khebab, based on work by Deffeyes/Simmons) and Venezuela.
Edit; BTW, I have repeatedly described Ghawar and Cantarell as "Two Warning Beacons" heralding the onset of Peak Oil (and especially Peak Exports). As I have said before, IMO, the key difference between Saudi Aramco and Pemex is that Pemex has grudgingly admitted to the decline/collapse of its largest field.
Pemex is eliminating and/or curtailing shipments of crude oil to Gulf Coast refineries, even as we discuss this topic.
WT: You are right to hammer away at net oil exports. For the global economy, the problem is that as KSA consumption (as an example) grows, this takes oil away from the economies which are more efficient at squeezing GDP out of oil usage (India, Japan, China)causing a drag on global GDP.
Not to beat a dead horse (actually this horse is very much alive), but:
Did Saudis drive 20% more in 2005? Buy more toys? Take more trips? I suspect not. This is the insidious impact of lower net energy creeping into the facts. Much of that higher energy use went towards procuring more energy. It is VERY important that we change the debate from 'supply' or 'resources' to net liquids available to non-energy producing society. (i have a post coming on this).
How much energy will it take to increase Saudi production from here? Why hasnt Chevron sanctioned Jack II yet after a media fanfare of a 'major oil find'? These are much more important questions than how much oil remains underground?
** WT - do we know how much Saudi internal consumption there was in 2006? or 2007 ytd?
Nate,
I haven't seen anything on internal consumption yet for 2006, but of course from the point of view of importers, there is no difference between liquid fuels used for personal consumption versus industrial/oil production use--a barrel consumed in Saudi Arabia is another barrel not available for export.
WT-
There is not a difference on PRICE impact, but a huge difference on POLICY. If oil exporting (and importing) nations are consuming too much oil - governments can institute policies to reduce frivolous consumption. However, if the geology requires substantially more energy to procure the energy, then there is nothing we can do, exports AND imports will both ultimately drop, year after year. I think this is the main point that the Rex Tillersons and Dan Yergins of the world are missing.
Of CERAs 3.7 trillion of oil resource, how much will the 3.7 trilionth barrel cost? In terms of dollars or energy?
Nate,
I don't think they are missing the point. There's a difference between public and private acknowledgement. I can only imagine the scrambling that is going on in the Exxon strategic sessions. Put yourself in the position of an Exxon stategic planner, write down the list of options. The cheapest way they have to grow resources/reserves is to complain that they are being shut out of NA regions. Disingenious, definately, logically correct, moreso. Well, maybe Yergin misses the point, but then again he's isn't being paid to make decisions.
"Well, maybe Yergin misses the point, but then again he's isn't being paid to make decisions."
No, he is being paid to debunk.
Compared to Exxon and the other Oil majors KSA has been very truthful. So in the spectrum of major oil players they in a sense lie the least. From their perspective I'd say they feel if they are stretching the truth its nothing compared to the major oil companies. Not that I believe they are telling the truth.
If you consider KSA's statements along with others from the industry its obvious that a lot if not all of it is a pack of lies. If anything Iran is the most forthright.
Only the data we have is the truth.
The Saudi population is still growing extremely fast at 2.18% per year, with a median age of just 21.4, according to the latest CIA World Factbook. 2006 population of 27,019,731 including foreign workers.
"Pemex is eliminating and/or curtailing shipments of crude oil to Gulf Coast refineries, even as we discuss this topic."
Actually, that may have been reflected in EIA's weekly inventories report.
Will second the Kudos to SS. This piece and the one on the effect of improved car efficiency are two of the best I've read in my short stay here.
Stuart mentions:
While not further discussed by Stuart, some posters take the position that PO will likely lead to internal instability for SA. It would seem to me, up to a point, the opposite is true and it is an instance of the rich getting richer. That is to say what will a 10% drop in SA production due to oil prices and to SA oil revenues. In PO it seems the wealth transfer from oil importing to oil exporting nations might be expected to increase. From where I stand this is not a good thing, but likely wouldn't lead to SA instability. It would likely lead to a more rapid increase in domestic consumption in oil exporting nations, compounding the issue of oil available for export.
Of course at some point, unchecked, such a situation leads to world wide depression, an unstable system, and all sorts of doomer scenarios. There are, however, three countering influences which allow for more peaceful demand destruction.
1) Conservation: As has been discussed frequently on PO
2) Efficiency gains: By this I mean being able to make ten widgets with the same energy that was formerly used to make five. My understanding, though I can't document it offhand, is that the GDP/per barrel of oil has increased steadily for decades. This helps to account for why gasoline expenditures are not currently near an all time high in regards to disposable income despite a relatively high absolute price. It is analogous to Greenspan's oft noted productivity gains.
As an aside, I would wish that efficiency gains, i,e. doing more with less could somehow be incorporated into measures of economic growth. I realize the metrics might be a bear and fraught with peril, however, it seems the incessant drumbeat for economic expansion is a good part of what has gotten us into our current mess. I noted that there has been a recently established Conserve Magazine http://www.conservemag.com/ so perhaps this can change.
3) Development of alternatives. This has been discussed at length at PO but would just second that increased oil price means increased incentive for alternatives development.
Certainly, if the analysis presented by SS and others holds then this Summer and Fall could see the start of some real, not easily deniable problems. Longer term the interplay of the countering influences should give an idea of how big of a hole we may have dug ourselves and whether this crisis has a significant component of opportunity to go along with the danger.
opec was formed on the basis that, if all cut when prices were crashing, the result for each would be an increase in revenue even as sales declined. The formula does not work as well when a single player cuts; prices do rise, but the net effect is typically reduced revenues. If sa production is cut in half world production declines 5%, which imo will not double the price of oil.
You're right, it would probably quadruple the price.
At least that's what happened in 73 during the first oil shock when supply was 5% off of demand.
The whole point of OPEC was to keep the market from being flooded and collapsing the price of oil.
But now even if the rest of OPEC pumps full out they can barely meet demand. Nobody has to worry about flooding the market anymore.
The formula (now) works very well if a single player cuts production. That is because the other oil producing nations can't increase production to fill the gap.
I won't pretend to have specialized experience in economics, PO, engineering, process control, etc. However, there are some commonsense observations that can be made. There have been tremendous improvements in efficiency in any number of industries. The current GE or Toyota factory line is far more efficient then the model T-line in terms of energy expenditure per product generated once adjusted for product quality/complexity. That is to say a modern auto line could produce more model-Ts with less expenditure of energy. Not to mention, to the joy of Pascal, I can crunch any number of figures on my personal computer or cell phone for that matter and back up the results plus the encyclopedia britanica to a thumb drive.
Developments such as automation, sensing technologies, computerized process control, etc. are independent of geography and are implemented to improve profitability.
I think a distinction may be validly made between conservation efforts, such as "wear a sweater and turn down the thermostat to 65F" and efficiency gains such as replacing an incandescent bulb with a fluorescent bulb where, assuming similar quality and not to great difference in price, one has conserved resources but really hasn't sacrificed at all or made any significant lifestyle change in doing so. Conservation efforts are more likely to dissipate quickly, that is one will turn up the thermostat once energy is thought to be more abundant. However, a hybrid locomotive with 15% greater fuel efficiency will continue to be used even if the price of energy decreases because it still leads to an increase in profitability. As for GDP, the health of the economy, etc. I really have no specialized knowledge. I see though, from your handle that you likely work towards protecting the environment. I think the question of conservation is paramount going forward and even if we survive PO and GW I wouldn't be surprised if there is discussion of an energy footprint, not just carbon footprint at some future point. Searching for the most elegant and unobtrusive solution to accomplish a particular goal seems a reasonably wise application of our rapidly expanding technical prowess.
Roger Conner wrote on the previous Saudi thread, (Saudi Arabia and that $1000 bet), in an otherwise excellent article on Khurais:
Well, not according to :
http://futures.tradingcharts.com/hist_CO.html
who's historical data only goes back to 1983.
Khurais collapsed in 1982 just before prices spiked up. Prices did not collapse until 1986, four years after Khurais collapsed.
Ron Patterson
Well, never let the facts get in the way of a good story.
Stuart, a great comeback to Euan's excellent piece. I don't know which one persuades me most strongly... though I firmly believe that the "truth" definitely lies between one and the other.
With regards your bet, what do you think of the following proposal:
Why don't you publicly challenge CERA / Daniel Yergin on your bet? Three details need to be resolved.
Firstly, a definition of a "sustained period of time" is required, my suggestion would a period that goes beyond Saudi's ability to surge produce out of stock in tanks. Say, six months?
Secondly, theoretically, you can never win your bet, since the other side can always claim that it is theoretically possible for KSA to produce at a sustained rate of 10.7 at some point in the future. Therefore a down-side limit should be introduced at which point it is accepted that you have won, I am thinking of a "sustained period" below 6.50 mm bpd.
Lastly, a very clear definition of "production" needs to be agreed upon: "crude only" or "crude and condensate" (or "all KSA) liquids", along with an agreed source for those production numbers. Maybe the average of the four sources you have used is the best way forward, I don't know.
In the event that you win, CERA would be obliged to provide you with $2000 worth of subscription to its publications at zero cost (and your choice of publication - maybe a chance to get inside their data!). If you lose, you are obliged to pay CERA $2000 in subscriptions.
A major benefit of this bet would be that it might spark the imagination of the media, and thus allow the debate to enter more into the mainstream.
Additionally, you could issue the challenge in public to CERA, and they would therefore be hard-pressed not to accept without coming up with a very good explanation as to why not.
Lastly, it would be interesting to see CERA negotiate on the upper and lower limits, definition of sustained production, production data sources, etc. That alone would give some small insight into their thinking.
Thoughts, anyone?
Good idea! And if you win Stuart, you will now get TWO free copies ($1000 retail each) of Why the Peak Oil "Theory" Falls Down. Myths, Legends and the Future of Oil Resources"
(Personally, I fervently hope you lose the bet, as I quite like drinking coffee, traveling to British Columbia in summers and visiting my family in Florida and North Carolina.)
- And if you win Stuart, you will now get TWO free copies ($1000 retail each) of Why the Peak Oil "Theory" Falls Down. Myths, Legends and the Future of Oil Resources" -
That thought had crossed my mind - what a prize!
Perhaps they could print it specially on soft, ultra-absorbent paper, rolled onto a cardboard tube, to give it some extra utility...
Why doesn't The Oil Drum challenge CERA. Let's take up a collection. But then it doesn't look like there is enough agreement to do that. I would chip in.
Amazing article. Great analysis
1 Question to WT: what would HL suggest as the slope of the green line for future rates of production?
2 Do the conclusions of this detailed analysis differ from previous discussions about global decline? That is, in Stuarts concluding remarks he says %8 KSA = 1% global. Is that what Kebab had factored in in his monthly reports?
The P/Q intercept for Saudi Arabia is less than for Texas, which suggests a somewhat lower decline rate. However, the wild card is Ghawar. The largest field in Texas at peak production was only about 7% of total production.
On an average annual basis, the Saudi decline from 2005 to 2006 was 4.3% (C+C), which is quite close to the long term Texas decline rate of about 4%.
However, as I pointed out up the thread, the key factor to keep an eye on is Net Oil Exports.
Many of these post-peak regions showing single digit decline rates are going to show double digit decline rates in net oil exports.
For example, the decline rate in net oil exports in the UK (with a single digit production decline rate) was probably on the order of 40% per year--they went from exporting one mbpd in 1999 to being a net importer in 2005 (I assumed 1.0 mbpd net exports in 1999 and 0.1 mbpd net exports in 2004).
Texas & Saudi HL plots: http://www.energybulletin.net/16459.html
I guess the lesson from Texas and the continental USA is : there's plenty of oil left to be produced in Saudi Arabia; it's just that never again will it be produced at anywhere near the peak rate.
I agree. This "is" what it is all about, everywhere. Notice how the MSM always flips to "running out of oil". At best everything made or moved with oil will get more expensive in relation to the cost of labor. At worst we will fight it out. Given that we didn't evolve into something with 3 times the brains that we have used in the last 200 years I'm starting to think this is where it will go, unless bird flu or something else hits and reduces the pressure on resources.
IMO, sa decline rates will be more like the north sea because of the prevalence of horizontals, totally absent in texas as it approached the peak. Also, Texas had a long period of water injected secondary production... in sa, secondary has been produced along with the primary.
The last few articles have confirmed to me that Saudi has problems, but is dealing with these things in a logical manner; from both a production and political standpoint. If they can pay off enough Princes with the current production, while waiting for the rest of OPEC to go dry they become the big prize. The political situation can be managed to their advantage by directing the disaffected youth to fight the Shia's in Iraq and Iran with the help of US and A. If managed correctly Saudi Aramco can rebuild the Iraq and Iran oil infrastructure. I think the time table is a little out of whack, which is why Dick Cheney got called to Saudi for consultation.
The other point I am worried about is not investing in enough diversified energy projects at a Regional Level for the World to adjust in an orderly manner. The time for a world government with a highly planned economy appears to be a necessity. It might also prove we are humans and not yeast!
The bulk of KSA's population is migrant Shia workers, not Sunnis. They cannot throw that segment of the population against Iran or into Iraq to defend the Sunni minority there. Keep that in mind as you see KSA talk about confronting Iran directly in that region and the possible repercussions of such an action.
Ghawar Is Dying
The greatest shortcoming of the human race is our inability to understand the exponential function. - Dr. Albert Bartlett
"It might also prove we are humans and not yeast!"
Oh, just admit it. We're yeast.
"The time for a world government with a highly planned economy appears to be a necessity. "
I think a decrease in the amount of available petroleum will negatively impact the breadth of authority and level of organizational complexity of most human institutions. Which probably means that a highly planned world government economy is not in the cards.
Yes, we have seen how efficiently and smoothly centrally planned economies have worked to the benefit of their inhabitants. For example the former Soviet Union and present North Korea stands out as fantastic role models. More socialism to the people!
(Yes, irony.)
Wouldn't a well thought out, single design build for a nuclear plant constitute a plan. Or a standardized model for electrification. Or requirements for landscaping with no irrigation. During the last Barrett-Jackson auto auction, I tried to buy a 1943 Lincoln, but I could not; was it Peak Auto or a Planned Economy?
A masterful presentation. I have long thought the smoking gun was reduced production combined with 3x increased rig count over an extended period.
As I was reading I wondered what future production would look like as a steady decline rate broken by new projects... and, scrolling down, there it was!
The green line may be the best we can hope for. Ghawar has been produced with horizontals... don't see how the northern bit can avoid hitting the mat in a few years, and without this their production would 4-5Mb/d. And, other fields may have been/are being produced in the same, modern way simply because water is everywhere approaching the gas caps... However, if the underlying decline rate is 12%, or whatever, then the decline should not be a straight line and production would never go to zero, even in the absence of new projects.
Looks eerily like the twilight zone.
Adding to the above, if the decline rate is 14%/y, then production would decline from 8.5Mb/d now to 4Mb/d in five years, but adjusted upward by the announced 3Mb/d new projects, so resulting production would be around 7Mb/d...
However, I see this as a best case. The base decline rate may well rise to 16-18%, and meanwhile the khurais project seems highly unlikely to generate 1.2Mb/d.
Then, adding the WT exportland model, exports would of course take an additional hit by then... of course, twilight in the desert may well lead to turmoil in the desert, and this might then lead to no oil in the desert.
OK, I'll let Sadad Al-Husseini do the talking. From Rebutting the critics: Saudi Arabia's oil reserves, production practices ensure its cornerstone role in future oil supply, Oil & Gas Journal, Volume 102 Issue 19 May 17, 2004.
The argument is not between Stuart and anyone at The Oil Drum — the argument is between Stuart and Al-Husseini. Since the article is subscription only, I will quote the long excerpt where Al-Husseini talks about factors affecting Saudi Arabian oil production. I will not interpret his remarks at all. You guys can do that. I will remind you that this is not Ali Al-Naimi we're talking about here. This guy knows more about Saudi Arabian E&P than anyone else on Earth and my view is that although he may have a made a big mistake — if Stuart is correct — he is certainly not a liar.
Sadad Al-Husseini
Dave,
I debated Peak Oil with ExxonMobil and Michael Lynch, and I think that they--and Daniel Yergin, Peter Jackson, et al--probably believe what they are saying, i.e., that we don't have to worry about Peak Oil for decades.
Another example, I have previously described how the Texas State Geologist, at an industry meeting in 2005 (who was presenting the "Undulating Plateau" thesis), stated that Texas, while it may not be able to increase its production back to its peak level, could--with the use of better technology--significantly increase production. This was 33 years after we peaked, and after we have shown almost continuos production declines. I suspect that this guy probably believed what he was saying.
So, does the fact that these earnest people--with decades of experience--believe that the worst case is an "Undulating Plateau" make them correct?
No. We all have evolved mechanisms that cause us to believe that our own particular BS is the truth. (its called self-confidence and optimism) Think about how successful our ancestors would have been if the opposite were true...
(this is true for everyone but me btw - my own views are definitely not BS..;)
Actually, most people are externally validated and seek "experts" to tell them what to believe. Only when people become internally validated and arrive at their own conclusions through research and critical thinking is their understanding not BS.
I've never heard of a senior executive who was not acutely and even painfully aware of the need to manage public perception. The ones that I've known personally (at three different companies) never showed the slightest hesitation with lying in that context if it advanced the company's interests and costs of being caught were managable. All those guys were well-educated and very savvy in their fields who made a lot of money for their shareholders and themselves.
Recommended Reading
The Saudi Riddle — excellent introduction to the Saudi issues, with good references.
Oil capacity outlook for the Arabian Gulf Five (pdf, by Dr. Sadad I. Al-Husseini, September, 2005)
And, of course, you should look at the geopolitics of the region. I wrote Revenge of the Shia?, which talks about some of the great complexities. As some of you may recall, Saudi Arabia has threatened to raise production enough to lower the oil price in order to cripple the shaky economy in Iran, whom they fear. They seem to believe their own story, which is very recent. It seems bizarre that they would be floating such a plan if they were also aware that Ghawar was crashing.
Remember, peak oil issues go way beyond what is happening in Saudi Arabia, as Stuart correctly points out.
"It seems bizarre that they would be floating such a plan if they were also aware that Ghawar was crashing."
Both Poker and Geopolitics are games that require the use of Bluff to be successful.
Well, what about this guy, is he a liar?
The comments from Aramco Senior Vice President Abdullah Saif dovetail exactly with what we derive from the actual data as documented by Stuart above. But the data actually contridicts everything Al-Husseini is saying.
So who do you believe, Senior Vice President Abdullah Saif or Al-Husseini? Both of them cannot possibly be telling the truth! Hint; which one does the data support?
Ron Patterson
Ron, every province has (some) fields or wells in decline after the initial year. There is no inconsistency here. You are confusing this with overall KSA decline which was not the author's intent.
You are absolutely correct Freddy. The author was only talking about existing fields. That is, all the very old giant fields that has been in production for almost half a century. He was not talking about the other tiny new fields that have only recently been put into production.
He was only talking about the old giant fields where 95% of Saudi oil production comes from.
Thanks for the correction.
Do you think the EIA were confusing the author's intent when they stated that Saudi needed .5 to 1 million barrels per day, per year, just to compensate? And did Petroleum Intelligence Weekly and the International Oil Daily make the same error when they reported these facts.?
And how about that silly Apache Corporation? They made the same silly error.
Seems like the EIA, the Apache Corporation and several others failed to solicit your opinion before they jumed to the very silly conclusion that the Aramco Vice President was talking about existing fields when he said existing fields. They should have known that existing fields does not mean existing fields at all.
Ron Patterson
Great answer, thanks D. We'd better keep our eyes on that LastViking and keep him in check with correct rebuttals.
:)
Re: Reservoirs and Declines
Another section by Al-Husseini from the O&GJ — perhaps the most relevant — that I left out. My mistake, sorry.
Some here think I am advocating something. I am just quoting Al-Husseini, who represents the argument contra Stuart.Also, perhaps this would be a good time to remind some people that there is no complex, large-scale, international conspiracy to hide the truth from us. This is quite beyond what people are capable of.
And, calling people like Al-Husseini liars is certainly not the right path by which The Oil Drum will win friends and influence people. Get the hint?
Well, you asserted up thread that he certainly was not a liar. That's just nuts and hopelessly naive.
Agreed, labelling people liars is counterproductive. But truth is, politicians, lawyers and senior executives should be assumed to be spinning the truth (often in very sophisticated ways) unless shown otherwise. Getting at the facts is not a Dale Carnegie seminar.
[which is the reason, incidentally, that the truth often arrives first via some very unlikeable characters]
Asebius: "Getting at the facts is not a Dale Carnegie seminar"-LOL!
i find this discussion about "lying" off base. you are lied to every single day. it seems to be a fault of modern society... the saudis, for their part are living a life with guns to their heads, it seems... this is a rough business, and the players don't play nice. i don't fault them in the slightest.
working in any company, the first thing you learn, is there is inside information , and it stays inside. why would you expect them to tell you their secrets?
Dave,
I have never heard any Saudi official referring to "the remaining 130 billion bbl of proven developed reserves".
How does this tie in wth the number of 260 billion barrels regularly thrown around in the mainstream media?
Is it simply the difference between "proven developed" and "proven and probable"?
If that is indeed the difference, are we to infer that KSA has 130 billion barrels in as yet undeveloped fields? The number is confusing to me, as I do not recollect hearing it from a Saudi source before.
I am merely reporting what Al-Husseini said in the most technical source article I could find and have access to — I subscribe to O&GJ and read through it every week. I can not answer questions about "the remaining 130 billion bbl of proven developed reserves" but I wish I could. Sigh.
Bunyonhead, anything here would just be a guess. Why did this Aramco official suddenly halve Saudi's "proven reserves". Dr. Nansen G. Saleri, head of Aramco reserve management says Saudi has 260 billion barrels of proven reserves, 368 billion barrels of proven, possible and probable reserves and 608 billion barrels of proven, possible, probable and contingent reserves. Dr. Saleri suggest that ultimate reserves will be more than 900 billion barrels.
http://www.nytimes.com/2007/03/05/business/05oil1.html?_r=2&hp&oref=slog...
Does anyone on earth actually believe that Saudi's ultimate reserves are 900 billion barrels? Things in this case have gotten completely out of hand.
It just may be that this statement was just a slip. Or it may be an actual attempt to bring some reality and common sense into Aramco's claim as to their true proven reserves.
Credibility is the word I am searching for. After that claim in The New York Times a little credibility needs restoring.
Ron Patterson
Bunyonhead, the key word is *developed* as KSA maintains that they have only developed 50% of their 1P Reserves at this point. The 130 is simply half of the 260Gb in that category presently.
- At the current depletion rate of 3 billion bbl/year, which represents 2.3% of the remaining 130 billion bbl of proven developed reserves -
So they are saying that, despite production to-date (approximately 115 Gb), they still have 130 Gb reserves in currently developed fields (Ghawar et al), and that on top of that they have a further 130 Gb of as-yet-undeveloped but proven fields.
This implies average depletion rate of 47% in exisitng fields, which sounds reasonable to me.
What I would really like to know is which are the as-yet-undeveloped fields (ie untouched, I guess) with 130 Gb of reserves. There have to be some untouched giants out there to get to that number. What (and where) are they?
Again, assuming these fields exist, why would KSA go to the trouble of developing the high-vanadium field (Manifa?) and building a refinery capable of handling it, if they still ahve 130 Gb of virgin fields out there, soem of which would presumably be far cheaper and easier to develop?
My best guess is that "the remaining 130 billion bbl of proven developed reserves" is all KSA thinks it demonstrably has left, though they believe they can find more.
Guessing again, I think Saudi is between 45% and 50% depleted, which probably puts me somewhere between Stuart and Euan. If I am anywhere close to the right ball-park, the key question becomes how long KSA can maintain its production profiles using secondary and tertiary techniques.
This means my guess is somewhere between the two HLs as posted by Khebab in this link (http://www.theoildrum.com/node/2331#comment-167004) and, by extrapolation, with a view that the production range will be between the two lines on the fourth chart on the same link.
Dave, the piece you quoted does not answer the statement by the Aramco Senior Vice President that Saudi fields are declining by 5 to 12 percent. And neither does it address the EIA's claim that Saudi needs .5 to 1 million barrels per day of new production just to keep even. Nothing in that statement directly addresses that point though it does dance around it quite a bit.
I have never said that there is any kind of conspiracy by the Saudis. There is an attempt however, to put up a front, a front that says that Saudi will be a major world player on the oil scene for decades. That may be true but not in the way most people think.
So, we may assume that neither the Vice President or Al Husseini are liars? But both stories cannot possibly be correct.
So I must conclude:
There is no conspiracy.
No one is intentionally lying, just dancing around the truth.
Saudi's giant and super giant fields are declining at a rate of 5 to 12 percent.
And one final point. No field starts to decline 5 to 12 percent, after over half a century of production, if it is only 20 to 25 percent depleted, or even 35 to 40 percent depleted. The 20 to 25% figure is totally absurd and the 35 to 40% figure slightly less so. With all the horizontal wells and water injection increasing production, a field would not begin to decline, under those circumstances, unless it was well past 50% of its URR. A field, with no enhanced recovery used, may start decline slightly before 50% is reached. But enhanced recovery techniques, as Cantarell has proven, will hold off decline until well past the 50% URR mark.
Ron Patterson
I don't think we need to get worked up about whether or not he or someone else is a liar - it's just a distraction. We know that well-meaning people with the best possible data consistently have been caught off guard by peaking of production and subsequent deline. This has happened everywhere that has peaked so far. Have the major players EVER correctly called peak and decline? I'm not aware of any. Clearly either their fundamental assumptions have had uncorrected systematic errors that lead to an optimistic bias, or the unpredictability of the peaking event prevents good prediction even with the best data. I tend toward the former explanation, because Simmons has correctly picked several peaks this decade using the data other analysts interpreted very differently.
So this is my response regarding Al-Husseini; he can easily be and probably is both honestly well-intentioned, and likely wrong.
I finished my first reply to this post in quite a hurry as I had an errand to run. But now, after thinking about it for awhile, I would like to expand further, and maybe clear up a misunderstanding. First, I believe that most Saudi executives actually believe that they have in excess of 260 billion barrels of reserves. I actually believe they think they can ramp up production to 12 million barrels per day. They remind me of a creationist trying to justify his position, which he truly believes, in the face of contradictory facts. Take this statement by Al-Husseini.
Now accept the fact, and I do, that Al-Husseini actually believes that their sandstone reservoirs, (most of them except Ghawar) still have 75-80% of their oil left in them, and their large carbonate reservoir, Ghawar, still has over 50% of its oil left, what can they believe? They observe that all these giant reservoirs are declining by 5 to 12% but they know that they still have about 78% of their oil left in the ground. They know this just as a creationist knows the earth was created in 4004 BC. And they cannot deny the facts that they have initiated massive recovery techniques, like horizontal Christmas tree wells and increased water injection in an attempt to increase production.
Yet the decline continues. They cannot deny that their fields are declining by 5 to 12%. So what can the explanation possibly be? Well, there is only one explanation, their fields started steep decline when they still had 75 to 80% of their oil left in them.
What most people do not realize is that belief is a very powerful thing. When one believes something so deeply any explanation however absurd will suffice.
One more point. I have never used the word “conspiracy” in any of my post as a position I believe in. I detest conspiracy theories. People who actually believe in conspiracy theories, that require hundreds of co-conspirators, have a screw loose. And there is no conspiracy by Saudi officials to convince the world of something they know to be false. True, they may occasionally stretch the truth, like initiating “voluntary reductions”, in order to cover a short time production problem. But they actually believe they have 260 billion barrels, or even a possibility of 900 billion barrels of reserves. They actually believe they can produce 12 million barrels per day. That will happen just after they get over this small production problem they are having right now. Or so they believe.
Ron Patterson
Ron: Sounds like Saudi officials have read THE SECRET.
Those 262 billion barrels of reserves are the official position of the kingdom and has been for more than 20 years during which time they have they have produced more than 60 billion barrels. No official can challenge it. KSA is 25% depleted with respect to that number. The Saudi officials believe it as an act of faith and loyalty. People elsewhere in the world pretend to believe it as an act of loyalty to their very important supplier.
The analogy that I like to use is to think of a man in his 50s who is in denial about his age, and still likes to do the same sorts of things he did when he was in his 20s, and still chases after the young women.
Eventually he would have to admit that he can't run that marathon as well as a 20 year old.
Well, I don't think Creationists have done a lot of 3-D seismic imaging, or drilled tons of monitoring wells, or run a multi-billion dollar extraction industry for several decades, so I'm not convinced that the comparison is very apt :-)
Seriously, I give the comments from Al-Husseini a fair amount of credence: The Saudi's have proven that they are capable producers over the long-haul, and that they are the most disciplined oil producer in the world . Name one other oil producer that has voluntarily restrained available production for years, simply to maintain an orderly market. Or a producer that can swing their production by 1 mbd in a month (e.g. Iraq war), then swing back down a few months later. Whatever else is going on in SA, they know how to manage their production, and I believe that they know where their oil is. They are also demonstrating an enviable (though not flawless) project completion record.
I think the only plausible hypotheses about the motives of the Saudis have to start with that as a baseline assumption. Note too that they do acknowledge decline in their existing fields - they are not denying the possibilty, and from this speech appear to be devoting considerable effort at predicting it, and managing production accordingly.
My current belief from the fascinating data and interpretation from euan and SS is that, while SA is nearing its peak productivity, they still have the ability to increase their capacity back to 9.5mbd, and possibly higher.
I do expect them to be surprised by peak, as many producers have been, but don't think they are there yet. This will certainly be an interesting summer/fall :-)
Mind you, I'm not taking Stuart's bet!!! My confidence levels are way too low :-)
CW
Global peak: 2007 - 2010
Global decline rate, Post peak: 2%
Economic response: Severe global recession, for ~5 years, then slow recovery.
What has this to do with anything? I know, it should have everything to do with Saudi proven reserves, but there is great reasons to doubt that Aramco officials, when making public pronouncements, totally ignore all technical problems.
For instance there are those several hundred SPE papers, (Society of Petroleum Engineers), that speak lay out in great detail all the production and reservoir problems that Aramco is having. Yet Aramco now denies that these papers mean anything. All the engineers who wrote these papers are ignored and it is denied that these papers have any meaning whatsoever.
So I ask you Hindmost, if all this technical data is ignored, then how do we know that the seismic data, that these very same engineers created is not being ignored also.
And how do you know Hindmost, that the seismic data is not being gerrymandered to make it say what Aramco officials wish it to say.
If any Aramco official deeply desires to see 260 billion barrels of proven reserves in the seismic data, he will find it there.
Global plateau, right now! It is obvious we have been on a plateau for two years. The peak month is not important. Which direction we go when we come off the plateau is very important. If the peak month is between 2007 and 2010 as you guess, then that changes nothing. The plateau still began two years ago!
Now here you get a little silly. How on earth can anyone predict what will happen when the world realizes that we are post peak? What is more likely to happen is that the first year, the decline will be less than 1%. The next year perhaps about 1.5%. And if things continued as it normally would, no emotions or nationalism involved, then the decline would slowly accelerate to 2%, then 3%, then 4% until it reached a natural decline rate of perhaps 5%, slightly more or less.
But the chances of that happening is virtually nil. High prices will change consumption rates and there is no predicting what that will cause. Plus some nations, those who can afford to do so, will start to hoard their oil. Exports will drop like a rock. The stock market may crash and a recession or even depression may happen. There almost certainly be resource wars among large nations and constant resource skirmishes among people all over the world.
There is absolutely no way to predict what may happen post peak, the number of variables are just too great.
A recovery! Good God man, peak oil is forever! When the oil supply starts to drop, the food supply will start to drop. This will cause conflict throughout the world. Unless you can keep the food supply, and the employment rate so people can afford food, at pre peak levels, there will be no recovery. But how severe the crash or how soon is impossible to tell. We can only know that it will happen, when, how or how severe is impossible to tell.
Ron Patterson
Ron, Hindmost is merely recounting that IEA and OPEC have stated significant 2006 output over 2005 (0.8 mb/d). Your issue is with those agencies and not Hindmost.
Similarly, your rebuke over the 2% decline rate is unfairly targetted. Bakhtiari and Laherrere use 1.9% & 2% respectively. Skrebowski reduced to 2.5% recently. While their rates no doubt change over time as you described, these are their overall rates for the tails.
Your comment makes no sense? What do you mean?
Ron answered that he had troubles with hindmost's optimism,
which said global peak 2007 to 2010.
Moreover the decline rate could geologically be who knows what, but what will actually be PUMPED? another question.
There is noone who knows that for sure. Dont pretend as if you have any facts, without writing them down next time, thanks.
H, Darwinian,
I quite agree with you that any idea of a conspiracy on such a scale is quite funny, it's difficult for one person to keep a story straight and after that you get the Bush/Chaney tap dancing duo.
What I would like to ask you or anyone else here is:
What do the Sandi's individually have to say about Peak Oil? While they may not be conspiring I don't think they are deaf and have no arguments, no matter how specious, to counter this 'theory'. I guess what I am trying to say is how do their individual statements on peak oil stack up against each other in what sounds to be some state of common denial?
I'm as I'm sure you are aware, new to this so likely speaking quite naively on this question.
Hi BBG, when I was at memmel's Trendline site on the weekend, I saw the Saudi graph. Going back this morning it looks to be a plateau of 120 MBD from 2020 to 2090, the second most optimistic series. You may have to scroll down a few inches.
On the same page, I see they don't seem to be too keen on Stuarts TOD article because of its contradiction with ASPO today. Snarly.
Freddy, this is by far your best sock puppet!
Hi Rethin,
Not too sure who you are calling 'sock puppet' me or Pam. If you mean me well guess I could be a suitable candidate just on a lack of fundamental oil knowledge basis. I don't know Pam and other than her giving me a link to Freddie Hutter's site see no reason to attribute that remark there.
I looked at the site and found the following statements by Mr. Hutter which in my 'sock like ignorance'(my words) will comment on. (By the way couldn't find, or failed to recognize, the aforementioned figures in the 'Saudi Graph' in fact I don't know if I found that graph at all. There were lots of incomprehensible copulating snakes graphs that were visually interesting but unnourishing, reminiscent of many 'piss and wind artist' works I have known as a painter)
'a lotta talk' is a vague and also non attributive term. What DO the $70 prices indicate after they fell to the 50's on a mild winter and are this spring rising again.
Unless that peak is repeated in the near future, especially on what could be a hot summer, I would think of that peak figure as an anomaly rather than a predictor.
These forward looking statements do not seem to be backed by any sort of analytical model (Am I incorrect in saying this?) 'P.O.' is backed by Hubbert's model.
Don't know enough to comment on that statement other than to say it is presented here as 'opinion' and that I would like to know what events caused this 'fear of shortages'
This is one argument I really can't see as other than one for rather than against 'Peak'. If there is a long future supply as Freddie seems to be indicating I would expect there to be new refinery capacity either being built or planned for with the increase in demand that a raising world economy would need.
Now that is a pot calling a kettle black.
Here I can see that Mr. Hutter's views would pander to a business class quite happy with life with oil and not too happy with life and a depleting resource...plays hell with bond rates and all those good things.
I am totally lost here. Sounds like my local politician's bafflegab, why 'ironic' and what does 'decades of future crude production' mean in output?
Does 'At the time' mean the time when he was dispelling 'wrongful conclusions'? How thinly is that oil spread?
Wasn't that forecast a transposing of the 70's USA peak to the world and based on information at that date, not something chiseled in granite. I don't know what the 3 fold increase is based on ..Canadian tar sands etc?
I think anyone with a half brain by the age of 12 was 'aware of that realization', so I am sure Freddie did. (Sorry about that crack, one that anyone with a half brain could make)
So?
Can't comment here as I have no information to dispute these claims. Anyone , anyone...
I meant Pam Rocks.
Oh.
Dear "Pam Rocks",
Freddy Hutter is what Daniel Yergin might have been, had he not wrote "The Prize".
"Some here think I am advocating something. I am just quoting Al-Husseini, who represents the argument contra Stuart.
Also, perhaps this would be a good time to remind some people that there is no complex, large-scale, international conspiracy to hide the truth from us. This is quite beyond what people are capable of."
Oh, give me a break. Go get your gun again.
http://europe.theoildrum.com/node/2330#comment-166160
This quote from Al-Husseini doesn't seem to be rational. How does a 2.3% depletion rate show that Saudi Arabia could meet production targets over the next few years? Such a depletion rate could be experienced on the upslope or on the downslope of production, or even on the plateau of production.
Dave, if you're so convinced by Al-Husseini, then you must be very confident that Saudi Arabia will sustain 10.7 mbpd, in the future (Al-Husseini thinks 15 mbpd will be possible). Given that as other producers decline, KSA will eventually have to produce 10.7 mbpd, don't you think? If so, why not take Stuart up on his bet? You're inclined to Al-Husseini's argument and aren't convinced by Stuart's, so you stand to make a cool $2000, no problem.
Similar to Darwinian, you have confused depletion rate with decline rate. There is no inconsistency when viewed in that context.
Not at all; I well understand that he was talking about depletion, as my comment about seeing that rate on the upslope or downslope demonstrated. I just don't see that it is arithmetic proof that they could sustain the rates Al-Husseini talks about. Do you?
Dave,
That is . . . unless the people are being controlled by reptialian aliens via mass mind control technologies.
There is also the "mind control via anal probe" possibility.
Hey, don't discount it out of hand! It would certainly explain a lot these days.
Should I quote George Bush and leave open the implication that because he is president he should know better than the rest of us the truth about Iraq? Should I quote Lord Brown about BP's "excellent" safety and investment record?
You and I both know that Bush is full of it as the international problems rocking the US over the last few years demonstrate. You and I both know that Brown is full of it as the series of problems rocking BP over the last few years also demonstrate.
You cannot simply make an appeal to higher authority when that authority is demonstrating no firm data to counter Stuart's argument. In fact, you posting this article amounts to a faith based posting relying solely on a higher authority. Now the curious question is why would Dave Cohen, who has ranted incessantly in the past against faith based positions and in favor of reality based thinking, suddenly post a piece that is essentially faith based?
For everyone else here at TOD, I will not interpret Dave Coehn's remarks any further. You guys can do that. I will remind you that this is not Hothgor we're talking about here. This guy has emphasized reality based positions more than anyone else at TOD and my view is that although he may have a made a big mistake — if Stuart is correct — he is certainly not a liar.
;)
(See? Two can play this game.)
P.S. The article is two years old. One wonders what Sadad Al-Husseini thinks about KSA production today in light of the unfolding events of the last two years.
Ghawar Is Dying
The greatest shortcoming of the human race is our inability to understand the exponential function. - Dr. Albert Bartlett
An excellent response, this is what I thought too, when I read Daves comment. I just wondered if someone else would have written it down already.
Dave believes the guy. The guy says nothing, NOTHING on data.
He states a line of plausible activities that might end up in a certain future production scenario. Thats story-telling. So Dave put more faith in the story than in the little real-world data available.
Not convincing. Re-read the article at top of this page and search for data to criticize...
Actually I think Dave is doing the rather thankless task of making sure we critically evaluate every explanation of the data.
Dave, I'm with you here. Stuart has done an excellent job stitching together circumstantial, available data into a coherent, short-tell story. But his story is too smooth, which tells me he's reaching. Reality, for me, is too complex and blustery, like the weather, to be encompassed in a six-point storyline, and though within Stuart's presentation this peak matches that peak and this data coheres with that explanation, conspicuously absent is the very complexity of interests and motivations, many contradictory our countervailing, and the resulting, multitudinous many-factored decisionmaking that renders production at X bpd this month, X+1 the next, X-2 the next. I mean, where in Stuart's presentation are the discussions between Saudi and the US, between Saudi and other OPEC suppliers, between Saudi and Iran, between Saudi engineers deciding this and that apart from political considerations, between Saudi executives wondering just how high oil prices can go before oil begins to lose market share, between ....
Where are the lines in appropriate graphs showing Saudi reduced/increased production for this or that political reason, for this or that engineering reason, for who knows for what sort of favour to whomever, etc?
All of this is missing and, to me, tells the greater part of the story. Absent that larger story, I'm inclined to give credence to Al-Husseini's public statements that Saudi can increase its production.
Much of the problem with the KSA essay is that Stuart assumes that spot price and production act in tandem. As I have said on occasion, nobody buys at Spot. Oil sales are based on contracts that are months or evey years in lead time. Aramco knows when a demand is going soft or stiff far ahead of the speculators.
This allows them to cut back output weeks or months ahead if going south. Further clouding Stuart's vision is the fact that spot prices can be as much as 26% higher than contract. Or, as little as 8%. Therefore, what seems obvious in the graphs above, just ain't so sometimes.
Layer this on your own astute factors; and it just boils down to one thing: If Aramco pumped at 9 and a half mb/d for two or three seasons like many here thought they should have based on what people here assumed was in play, oil would be about $35/barrel. Even KSA is recently too greedy to go that low!!!
And just how does Aramco get this knowledge? If they actually knew this stuff months ahead of time they could make millions every day on the futures market. And no, contract prices are not set years or even months ahead of time. That is the most absurd thing I have ever heard. Saudi contract prices follow, up and down, the NYMEX price, on a daily basis! Albeit between 3$ and $5 below the NYMEX price. Check OPEC (and Saudi) contract prices here:
http://tonto.eia.doe.gov/oog/info/twip/twip_crude.html
Ritght, Saudi knows what is going to happen months ahead of time. They have a crystal ball you know. While OPEC contract prices do deviate from NYMEX prices, the discount is set according to market forces, that price would follow, up and down, the NYMEX price, just discounted by the given amount the market sets at that time. So Stuart’s charts are just as valid for heavy sour as they are for light sweet as both follow the NYMEX price, up and down, just discounted according to the grade of oil. Reading Freddy’s statement above one would think that heavy sour crude is totally disconnected from light sweet. They are not!
No Freddy, check the above link to get OPEC contract prices. Saudi prices will be within a few cents, depending on the grade of oil exported, of the average OPEC contract price.
Folks, not just you Freddy, but when we make outlandish statements, we need to post a source or URL to back up that statement. Making statements like he makes above, without a source or link, is just unacceptable. Well, in my opinion anyway. Others may think making unproveable outlandish statements is absolutely okay.
By the way, the heavy sour discount is explained very well, along with a chart, here:
http://www.oxfordenergy.org/pdfs/comment_0606-3.pdf
Ron Patterson
Yet Stuart's analysis of prior price/production cuts makes you wrong yet again, Freddy. KSA can and did cut/increase on a moment's notice in the past yet now you are arguing that they have to throttle back in a manner exactly consistent with natural decline months in advance to achieve what they could nearly instantly do in the past??? Are you ignoring those data points deliberately or are you just blind?
Ghawar Is Dying
The greatest shortcoming of the human race is our inability to understand the exponential function. - Dr. Albert Bartlett
I believe you did not read to this section from Stuart's article above "Reading through OPEC publications from the early 2004 timeframe is quite enlightening." ff
Where he then spends the time and a few screens discussing exactly what you just say you didnt find. Please re-read and search out things to criticize, or add what you think is missing.
I dont find anything in your text that advances either point of view.
Dave, it is disingenuous and misleading to leave out that the 15 mb/d max sustainable *capacity* outlined in 2004 was not scheduled to come on stream until 2016.
The final output of 13.5 mb/d was stated as not likely until 2025 at the earliest. These figures are intrinsically related to the Kingdom's belief that they have those vast reserves and there was never any sense of imminency implied.
YOU are being "disingenuous" supposedly criticizing Dave while actually trying to put across the idea that KSA has "vast reserves". There are too many people with the ability to critically think on this site for your debunking tactics to work. Why don't you just go away before they ban you again.
Dave, he may well have been telling the truth -- two years ago.
At the time of the article, the ramp-up to 9 Gb/day was still pretty young, i.e. they had just started pushing Ghawar really hard, and perhaps did not yet have a handle on the decline rate...
Could he truthfully say the same stuff now? Who knows?
My reading of Stuart's thesis is that they lost their ability to push production upwards about a year ago.
There is no doubt that there is still shiploads of oil in Saudi... but clearly, the rate of new megaprojects is not currently sufficient to keep up with Ghawar's decline if it is indeed crashing.
Maybe they do indeed have lots of juicy middle-sized fields, just waiting for them to poke a straw into them... maybe they can bring them on line in five years or so, and replace lost production from Ghawar... maybe...
But in the hypothesis that Ghawar is crashing, and that they didn't anticipate that two years ago, they had better hope that nobody calls their bluff in the meantime.
The changes to the Term Structure of the Crude Oil Futures curve, over the past 5 years, may be roughly described as follows: 1. The farthest end of the curve has risen from deep backwardation to Front month, to now trade at parity with Front Month. 2. The middle part of the curve has risen into steep contango to Front Month.
Once Peak Oil as a current, unfolding event begins to be discerned by the market, the farthest end of the curve will then begin to rise from Parity, and will charge into steep contango to Front Month. The action there will be known as a price-discovery type of market, in which investors and traders will speculatively keep pushing it higher, seeing what the market will bear. To be sure, large integrateds and other producers will be increasingly tempted to sell their production into those far years. Someone will have to take the other side of the long-side trade. I think a reasonable price objective would be to have 6 year oil trade at double the price of front month. Based on today’s parity between Front and Far, that obviously would mean a 100% rise. For example, if KSR has peaked, and that observation begins to spread in the market in 2007, I would expect oil for delivery in 2013 to rise, say, to 140.00, against front month of 70.00. That’s just one example, and one could model price action along the Curve in myriad ways. The effect of peak-oil acceptance on the crude oil futures curve will surprise. All sort of unexpected things may happen.
The bull market in oil since 2000 has vexed many intelligent and educated people, who have unsuccessfully brought their knowledge from other areas of investment and finance to bear on the oil market, only to find that knowledge wanting. Of particular note has been the broad misunderstanding of inventories, and the rather calcified insistence on measuring inventories on an absolute, rather than days supply basis. Total OECD Days Supply have indeed risen in the past 5 years, but only slightly. And at times, the trend in OECD Days Supply has actually been down. Discussion of Front month oil, and inventories on an absolute basis, are everything to an Oil Trader, but are of almost no relevance at all, to Peak Oil. Action in the front end of the crude oil futures curve of course can pretty much take any course it likes, over 30 day periods. If Heating Oil inventories are backed up because of abnormally warm winter weather, it matters not at all if broader fundamentals are bullish, because the traders at NYMEX are going to get the price down of all Products to get that Heating Oil cleared. Traders at ICE and NYMEX can pretty much take crude and crude products any direction they like for as much as 10 to 15 trading sessions. After that, fundamentals begin to reassert themselves.
As for last Summer’s Saudi offer to sell crude at lower prices, and their claim that they had no buyers for their oil, this was a situation almost universally accepted by oil traders as a mark-down sale of heavy oil that no one wanted, for lack of refining capacity. As far as I’m concerned, lack of global refining capacity to process heavier grades of oil is right down the strike zone of the peak oil paradigm, and its attention to Flows.
The original Staniford post on 02 March 2007 was clearly offered within the existing framework, in which the world has on ongoing problem, as it tries to get data from the secretive kingdom. Jumping up and down like monkeys therefore, and pounding the table that we still don’t know! is hardly interesting. Duh. Yeah, we already know (that we don’t know.) Sheesh, when it comes to KSR, we are nearly faced with an ontological problem. And, I think Stuart’s post was very much offered up in that context. He took the Harradh III start-up as a kind of brief outlier, and milked it for its possible meaning. As they say in the UK: Well Done.
Gregor
Actually - its gone farther than that - today front month is at $61 and December 2012 is at $66, a premium of $5.
Of course, $66 balances the dollar viewpoints of all those expecting $100 oil and those expecting $30. But the fact that long dated oil has been outperforming near month, suggests that more people at the margin are buying into what we've been saying on this site for past 2 years...
Yes, that's right Nate. But I was trying to be a tad broader in my characterization of what has happened over the past five years, which was to essentially imply that the far end has risen to, and has since then, somewhat oscillated around parity to Front Month. Another measurement is to compare far month to the average of the nearest 3 months.
When front month corrected from 78.00 to 60.00 last year, that was when the far month broke away from parity, into contango. My perspective has a bit more time-length in it, so I am keen to see what happens, as I said, in what I sitll consider to be an oscillation around Parity. Despite these changes, the far end as you know is much less volatile, so there are days when this recent small contango tightens quite alot, when Front Month surges.
That said, I am w/o question of the opinion that oil depletion is now active in the far end of the curve.
Gregor
Very informative. When I first looked at oil investments late 04 markets were, as I remember, firmly in backwardation, as has nearly always been true historically. The epochal change to contango strongly encourages refiners to hold higher stocks, so the current levels, with no change in days cover, and thought by some to be bearish, IMO is very bullish.
I agree that futures will soar if/when the market accepts that sa is on the way down... This is something the MSM does not want to believe, so denials will continue. But hedge funds will look at the data, and they don't give a damn about sa, just want to get to the next trend first... they will jump hard on this if sa production continues to decline thru 07. Looking at Stuart's curve, and noting that the next project looks to be in production early 08, then sa production looks to be down another 1Mb/d to 7.5Mb/d end 07, sufficiently low that, even if world production hangs on to Stuart's plateau, hedgies will likely notice.
If Saudi production is 7.5Mb/d by end 07, hedgies will be buying farmland and quitting their jobs. The new post from Gregor will be about the Term Structure of Soil Amendments.
Hi Jkissing,
I have been trying to model recently how I think the Oil Futures curve will behave, when significant recognition of peak begins to break out, in the market/culture. What I realize is I need at least 99 other people to do the same, because the number of possible outcomes makes my head spin. My conjecture that Back Month rises first to 2X Front Month is really just a comment on how I see speculative behavior, and nothing else. The price of oil could really vex participants in a PO awareness breakout, and actually fall. Especially in the Front end. What traders will do of course is make volatility bets, by taking both sides of the market at different expiration points, and taking profits as the market swings to and away from their positions. Stuart made a joke about people putting Oil in their living rooms, but inside that joke lies another factor--which is, a race to build new storage capacity could get underway, which would have yet another effect on the curve. Again, in these remarks I'm just scratching the surface of myriad possibilities.
Gregor
Lot of confounding bits in trying to sort that out. Very good potential profit if you can.
Stuart mentioned storing barrels in the living room, much easier to leave them in the ground if futures remain sufficiently higher.
Further down I ask if producers might begin to hold back current production and sell into the future (you mentioned the latter, but not the former.) This behavour is consistent with po, but has never been seen before. So, front month would imo surge to follow the back ones, bringing the anticipated future price crisis to the present, just as markets are supposed to do. (Economists say high prices encourage production, but higher future prices do not.)
I'd guess that most hedgers are not very active in contracts that are more than a year or two from expiration. If true, then it's just a bunch of speculators' guesses out that far. Speculators making a bet very far out will still have to keep margins current -- and it could be frustrating to tie up money in margin for that long with a bad bet.
I read an article a while back about the oil futures market that discussed what happens with hedgers. There is quite a bit of hedging activity among oil consumers. Southwest Airlines saved a lot of money the past few years because they had heavily hedged their fuel purchases, in effect locking in oil prices in the $20-30 range when others were paying twice as much.
However most such hedging does not take place in the public markets, rather it is the result of long term private contracts between the participants. Since everyone's requirements and abilities are different, these contracts have to be negotiated specially in each case.
There is also not that much interest in hedging among oil producers. First, most of them these days are governments and the incentives are different for them. If a government locked in a long term price which then turned out to be disadvantageous, they could fall. OTOH if the government does poorly because global oil prices drop, nobody blames them, it was out of their control.
Second, private oil companies have similar disincentives to hedge. Their investors generally seek exposure to oil price changes, that is why they are buying stock in these companies. They don't want to play the risky futures markets but they can get a piece of the action by buying an oil company. If the company is hedging much of its long term production, that exposure is gone, which makes investors unhappy.
The bottom line is that, as you say, most action in long term oil contracts is purely speculative. And clearly as you can see from the data, these contracts are very thinly traded. This should be a recipe for volatility, but actually the prices tend to be quite stable. The fact that they are so stable is IMO due to the action of market makers, who keep the price in a range associated with the front months where the trading is far more robust.
Perhaps the hump in the contango at Dec '08 is a prediction of the IPO of A123 Systems?
:-)
Of particular note has been the broad misunderstanding of inventories, and the rather calcified insistence on measuring inventories on an absolute, rather than days supply basis.
I will explain this once again, because there appears to be a broad misunderstanding of what I am saying. I repeated this today to Stuart in an e-mail exchange.
I don't know how many ways I can spell this out, but I will try again.
Here is an actual example, which is a microcosm of the world oil market. Let's say that over the past 10 years, an oil refinery's capacity has doubled, but they have not put in any new crude storage tanks.
Now, let's say that the tank levels are high, and for whatever reason those tank levels start to rise over time. Physically, it does not matter one whit that the days of storage has been halved from the previous 10 years. You are going to have to make some decisions regarding your crude oil purchases, because based on the trend you are buying more than you need, and based on the level you have to do something in the short term. And when you decide not to buy as much crude, your crude supplier is either going to have to find someone else to sell to, or they are going to have to reduce production. If everyone else has rising crude tanks, then a production cut is in the cards.
This was the situation when the Saudis started to cut. Crude inventories were at all time record highs, and they were rising. Furthermore, refinery turnaround season was starting up, which reduced demand even more. That is a major factor in why I think their claim of cutting production based on market demand is completely consistent with what the market was calling for at that time.
And not long after they began making their cuts, the price began to fall. Many seem to think rising prices have some meaning, while quite content to ignore the fact that prices are well off their highs even as the Saudis have made steep cuts. What does this mean? The market is adequately supplied. Might the Saudis know that if they hadn't made cuts, the market would be oversupplied? Well, they aren't stupid.
Now, I think that's crystal clear, but I thought it was the other 20 times I have explained it. Inventories and trends provide a very important piece to the puzzle. Those who ignore are trying to solve a mystery without using all of the evidence.
In that case, with very little demand, wouldn't you expect the price of crude to fall significantly, say to around $10/barrel?
There is a lot of forced conservation going on in poor countries. There would be more demand if the price was lower. In that sense I don't think the market is adequately supplied.
I think the mistake here is to focus exclusively on inventories in a few OECD nations. During the last few years, non-OECD countries have become significant consumers of oil. I don't think we know much about inventory levels in the rest of the world. When OECD inventories were high, there was still enough demand in the rest of the world to keep crude above $60/barrel.
In that case, with very little demand, wouldn't you expect the price of crude to fall significantly, say to around $10/barrel?
I didn't say there was very little demand. I said that demand was falling. That is a fact.
I think the mistake here is to focus exclusively on inventories in a few OECD nations. During the last few years, non-OECD countries have become significant consumers of oil. I don't think we know much about inventory levels in the rest of the world. When OECD inventories were high, there was still enough demand in the rest of the world to keep crude above $60/barrel.
We have OECD inventories, but then the Saudis have also cited high inventories across SE Asia as a reason for the OPEC cuts. Iran has also stated concern about high inventories. So, the evidence we do have indicates high inventories. The only rebuttal I ever hear is "we don't know about the rest of the world." Well, we know about a lot of it, and the part we do know about supports my point. I am waiting for someone to show me the part that doesn't.
Maybe the demand was falling. But it was still high enough to keep crude well above $60/barrel. And it was only a year before Saudi production started falling that OPEC viewed $35/barrel with alarm and tried to defend a price band of $22 - $28.
In other words we don't have verifiable inventory data for SE Asia; just the word of Saudis. Let us ignore what the Saudis said and take a look at what they did.
Around the time the OPEC cuts were announced, Saudi Arabia was telling the Asian refiners that they will cut their shipment of crude oil. If the Asian refiners had their tanks full I would expect them to tell the Saudis to ship less crude and not the other way.
Suyog says "But it was still high enough to keep crude well above $60/barrel."
On the surface, that seems logical, but Trendlines says the real price was down to $45. Wouldn't that rot your socks if you were sitting at the order desk?
Record high inventories + $45/barrel = get out of Dodge City. Suyog, at what price would you have waited until you shut down the tanker fleet?
Dear "Pam Rocks"
please note that Freddy supposedly now disavows TOD, Note also that since he was kicked off of this forum last month visits are up about 50%. So much for his prediction that "TOD has Peaked".
About TOD he said "i'm oudda there". I hope he keeps his word, since his language was not acceptable for ladies like yourself.
He is back in a new incarnation named LastViking. He is trolling and leaving links to his own blog where he debunks Peak Oil. I also, believe he may have more than one ID so he can complement himself, agree with himself, and make it appear that someone else agrees with him. (serengetiplains?starvid?)His specialty is twisting and misrepresenting what real Peak Oil theorists are saying.
I noticed him going back to old posts that nobody visits anymore and making posts that insinuate he "won" some argument and was right as no one rebutted him. He is also "pushing" the NYT article.
Sadly, yes I know. He is also "Pam Rocks". See the post about 30 posts up this thread as well as the other comments by pam rocks in the user comments, most with links to trendlines. What a scumbag. As I said upthread, Freddy is what Daniel Yergin might have been had he not wrote the prize. I hope TPTB will make it clear that he is no longer welcome here.
TOD Editors:
Please observe the above two posts by Cid Yama and desiderata. While I have no idea if Pam Rocks or Last Viking is any of the posters you banned last month, neither of them has insulted anyone nor used bad language. Yet, (surprise, surprise) they are being pig-piled upon by the two luminaries above simply for expressing an opinion.
Did you really mean to empower people like these two when you banned Freddy, Hothgor, etc?
But, hey, maybe I'm wrong and having people who treat peak oil like a religion and anyone who disagrees with the most extreme interpretation as a heretic increases the credibility of TOD. And - who knows? - maybe non-doomer newcomers are impressed by Cid Yama's assertion (in these very comments) that we'll soon be eating each other.
Institutionalising the intolerance of Cid Yama and his ilk really has worked out well.
Cid Yama: How exactly is Freddy going back and changing his old posts given that a) his account has been terminated, and b) 99% of his posts are in articles now closed for comment? You explain it, genius.
"Yet, (surprise, surprise) they are being pig-piled upon by the two luminaries above simply for expressing an opinion."
Posters engaging in the practice of disinformation are not "expressing an opinion". Intentional misrepresentations by these posters are having to be addressed, Their intent being to "muddy the waters" and put a drag on open and honest discussion. They attempt to "give the impression" that there is a question as to the validity of well researched and well presented posts without actually addressing the posts they are trying to put in question. They are attempting to disrupt open and honest disscussion, not participate in it.
It is not entirely clear that the cadre of abusive posters here are well able to tell the difference between "posters engaging in the practice of disinformation" and "posters who disagree with me".
The standard for turning insulting is rather high. Among open-minded folk, at least.
Now again you sound like my boss who asserts things without always knowing. Maybe you DO know, however:
"That is a fact."
Please in that case You have to supply a fact to verify that, with the same figure for the last thrree years (for the month in question). Otherwise I cannot simply believe your assertation. ie I dont take your word for it (anymore).
Cheers
Now again you sound like my boss who asserts things without always knowing. Maybe you DO know, however.
Well of course I DO know. Even Jeffrey will tell you that demand fell due to high prices. The demand numbers are readily available at the EIA. I have posted them before, and I am pretty sure I posted them in the response to Jeffrey. I will not hold your hand - especially when you are questioning my integrity - on matters that have never been in dispute. Do your own research.
You have to supply a fact to verify that, with the same figure for the last thrree years (for the month in question). Otherwise I cannot simply believe your assertation. ie I dont take your word for it (anymore).
I do want to make one more thing clear, because those who are relatively new to TOD may not understand this. If I state that "X is a fact", that means at some point I have linked to graphs, provided references, etc. I am not simply making an argument from authority. That also means that the information is not difficult to verify.
So, when someone comes along and says "Why should I believe you; provide your sources", I do find it a bit annoying because it takes time to look this stuff up again and again. Lately there have been some pretty serious demands on my time from many places, and if I feel the information is easy to verify - as the information that you have asked for is - then I will probably just ignore that request. If you dispute something I have written, why don't you provide your own data to dispute it. I think when you start doing this, you will find that I am not just pulling "facts" out of mid air.
Hi Robert,
Thanks for your replies. I did indeed read your comments on the original Staniford thread. While we are both talking about inventories, I see now that we are marshalling our respective points about inventories towards slightly different ends. I actually agree with your points. My perspective however concerns the 6 year bull market in oil, and yours at the moment is more concentrated on Q4 of 2006.
I agree with your previous point that it's the direction in which inventories are moving, that will drive Front Month price. No question. Also, I agree there would be infrastructure issues wrt to total, available storage capacity. In fact, Ben Dell of Bernstein began to warn about this also, just as we were rolling last year from Q3 to Q4. So I understand and agree wrt to your example and personal anecdotal story of your refinery experience.
OECD Days Supply and absolute levels in 2H 2006 rose to the highest levels since this bull market began, as far as I can tell looking over the data available to me. I think one is actually more free, however, to chose how one uses this information to discern the issue of Saudi declines.
What's interesting about the Crude Oil Futures curve, is that it is both and at the same time a reflection of market participation, and, a feedback mechanism that influences market participation. I think I may have made my initial reponse to your remarks over-broad, because my interest lies in the longer term trend of oil price, whereas you were making perhaps a finer point about inventories as a rebuttal to KSA voluntary vs involuntary cuts beginning in Q4. I think that's a fair point. Where I would differ however, is that absolute inventories are volatile. Not as volatile as front month price. But volatile nevertheless. And in that volatility comes less usefulness, less meaning.
Stuart would do well not to ignore the inventory situation, as others, would perhaps do well not to place too much emphasis on them, especially in timeframes as short as quarters. Where I think absolute inventories are helpful is in explaining large price swings as we had in Heating Oil in January. Generally, however, I have little interest in that measurement given my attention to the longer term trend.
Gregor
I'd be more encouraged if we had a better picture of world inventory. Considering KSA sales most of its oil to Asia for example which has not slowed it growth significantly I question looking at American supplies and applying this knowledge to KSA's actions. The data we have on world inventory is even more fragmented than what we have for supply. Its simply not enough to make a convincing argument.
Also I've not seen a good refutation of the fact that markets are in contango and in general over the last several years the fear of supply disruptions is high. Both lead to a bit of hoarding behavior. And finally we would expect the initial reaction of the market post peak would be exactly what we are seeing inventories kept high. So in the end the inventory data we have is both incomplete and can be interpreted two different ways.
If anyone can find more data on world inventory even European inventory for example that would be nice. And what about inventory in Canada and Mexico? Anything but the price of heating oil in one corner of the US driving the world markets.
In general in the face of the overall economic growth over the last several years plus the extreme growth in Asia one would have expected oil supplies to increase at a healthy clip this has not happened and in fact KSA has been on a steady decline at a rate that matches depletion effects.
And last but not least if KSA has changed its approach to bolster world oil prices they seem very confident that they are the only swing producer in the world and that relatively minor cuts in production are sufficient to get the price points they want. This means that if Robert is correct that KSA believes the rest of the world has peaked. The only question is KSA itself.
I suspect, Robert, that inventory levels are indeed a key mechanism that enables producers to adjust supply at the margin. But they can not be a prime moving force in supply and pricing.
For those who follow global warming science, we could say that inventory levels are a feedback, but not a forcing.
Hi robert
Somethings you say I wonder about:
"Here is an actual example, which is a microcosm of the world oil market. Let's say that over the past 10 years, an oil refinery's capacity has doubled, but they have not put in any new crude storage tanks."
You repeat this over and over, but hey, the world has surely adapted a little bit over time? Some tanks are built, say China SPR?
"This was the situation when the Saudis started to cut. Crude inventories were at all time record highs, and they were rising. "
Please supply a figure and a link. 2004 was as high as 2006,
no, from EIA table 1-3?
"Furthermore, refinery turnaround season was starting up, which reduced demand even more. That is a major factor in why I think their claim of cutting production based on market demand is completely consistent with what the market was calling for at that time."
But this is only US, and surely in the world other countries would like SA oil?
"And not long after they began making their cuts, the price began to fall."
And now its rising again. I think that SA has no longer control over price. They cannot flood. Full stop.
You repeat this over and over, but hey, the world has surely adapted a little bit over time? Some tanks are built, say China SPR?
Have I ever said that no tanks have been built? Whack away at that straw man.
Please supply a figure and a link. 2004 was as high as 2006, no, from EIA table 1-3?
Here you go, the 10 highest levels of U.S. crude stocks this century (listed in chronological order).
Apr 07, 2006
Apr 14, 2006
Apr 21, 2006
Apr 28, 2006
May 05, 2006
May 12, 2006
May 26, 2006
Jun 02, 2006
Jun 09, 2006
Jun 16, 2006
The highest levels seen this century all happened in the first half of 2006, just when the Saudis were making their cuts. [There were in fact some higher levels in the 90's (and there were more refineries then, which may mean more tankage then), but none have been higher in recent times.]
Knock yourself out:
http://tonto.eia.doe.gov/oog/info/twip/twipcrvwall.xls
That's that last reference I will look up for you. I tire of repeating myself, and I tire of arguing against endless straw men. I tire of arguing with people who think that it is meaningful when prices go up, but not when they come down.
For the last time, for those who either ignorantly, or willfully misunderstand my argument:
Inventories can give you a part of the picture. They don't give you all the picture. But the trends can provide a means of hypothesis testing. Their behavior, along with the price, can either support or contradict the Saudi explanation. After all, if the Saudis really were having trouble filling orders, I certainly don't expect to see low and falling inventories. Such would contradict their explanation. And in fact that is not what we see. The USA, the world's largest consumer of oil - and a big customer of Saudi - in fact had high and rising inventories just when the Saudi cuts began. That is an indisputable fact. Choose to ignore the significance of that if you wish. But when the tanks are rising, you have to back off of your purchases. And some of those purchases were undoubtedly from Saudi.
Now, I am keeping a writer from Rolling Stone waiting on some answers because I stopped to answer this post. I honestly have much better uses of my time than to repeat myself to every single person who wants me to personally answer every single objection they have. I will no longer do that. Some of you are going to have to work some of this out on your own.
The back end couldn't get to 2x the front end for very long because of storage arbitrage. People would be going nuts piling barrels of oil in their living rooms.
Ahh... So when Simmonds argues:
1. that oil is very cheap at today's price in relation to the amount of useful energy it contains per unit
2. that much, much higher prices will be justified in the future as essential consumers compete for ever-dwindling supplies of total liquids
And Stuart argues that:
3. higher back-end futures prices will drive up the front end futures [and spot] prices
Then as a consequence:
As soon as futures traders perceive that oil will become very dear during the back-end years, those new much higher back-end prices will propagate down to current prices, because today's consumers would otherwise be competing with hoarders.
Could then oil producers truthfully bemoan speculators bidding up current prices when that happens? Even as future depetion is the direct cause.
As soon as futures traders perceive that oil will become very dear during the back-end years, those new much higher back-end prices will propagate down to current prices, because today's consumers would otherwise be competing with hoarders.
That's absolutely correct, and it's a very important point.
The corollary is that as long as current prices are not enough to be market-clearing in a situation of significant oil shortages, it means that futures traders do not think Peak Oil is a problem. And futures traders presumably includes insiders from the oil business who would be in position to know.
Perhaps, but a strong recession could depress demand enough that prices could crash. I don't think it is a guarantee that prices will always be high - it is more likely that we will see high volatility instead, and you can't predict that accurately enough to try and make money in the futures market.
In the seventies, oil went up 9x, and were a prime cause of 3 recessions. The recessions never brought about a yoy decline in the price.
It might be difficult to get those barrels... producers might store their own oil in the ground and meanwhile sell for future delivery, jacking up the front end... Peak oil means that all producers re-calculate the benefit of selling today vs. selling tomorrow, something that virtually never happened in the past. Actually, the poster alluded to this possibility, in which case the front price is pulled up by the back price...
CHK did this in a micro fashion recently, refusing to sell some of their ng at low prices, I assume on account of they expect higher prices later. Kuwait was talking about the same thing on a macro scale, we will hear more of this if/when sa declines.
If all producers start hoarding we will have spare capacity again. In effect then, all of the oil producers in the world will join a new "OPEC". The incentive to cheat this new OPEC will be quite high, just as it was in the past when OPEC had spare capacity.
Much higher prices far into the future will drive up today's price which will cause significant demand destruction and revised estimates for future demand which will lower the future price of oil thus lowering today's price thereby alleviating the demand destruction ... this process happens very fast actually, one doesn't have to wait for actual demand destruction to be significant.
That's what futures markets do (most of the time), they stabilize things so that an equilibrium is reached.
Of course, like the dot com bubble, it's possible that speculators will drive the price higher than it needs to be, but the consequence will be lower demand in the present which simply means that either inventories rise or production needs to be cut. Both will increase supply in the future. Arguably, that is what we're seeing now. Without the previous demand destruction due to high oil prices, prices might actually have been higher today.
The end result is that through time arbitrage the needs of the future will be reflected in today's price. And that is a fundamentally good thing.
As a side note: You may be wondering why high oil prices haven't had much of an effect on economic growth. The reason is that much of the higher amount of money paid by industrialized countries has been given back to them right away at low interest rates.
Then you may wonder what made the 70s oil price shock so different. I would argue that it was both the speed of the price increase and that financial intermediation between oil producers and customers was much less developed.
What your saying suggests that the price heights seen in 1980 are lower than what economies can bear before significant demand destruction kicks in (assuming no quick price spikes and continuing flow of investment $$ from producers to consumers)
Comparing the 70s/80s economic situation to the present, what would you say the major factors that make todays economic order more or less susceptible to high FF price?
I've discounted the inventory argument for one key reason, it only measures part of the market, even if you look at OECD countries, whereas spot oil prices reflect global supply/demand (and to some extent geopolitical factors).
The key metric for me is the approximately two-thirds increase in average monthly Brent spot prices, in the 20 months following 5/05 versus the 20 months prior to 5/05, while the cumulative shortfall between what we would have produced at the 5/05 rate and what we actually produced is on the order of 366 million barrels of oil (EIA, C+C).
Let's assume that we have two towns--Rich Town has a per capita income of $100,000 and Poor Town has a per capita income of $10,000, with equal populations.
Everyone in both towns has sufficient food with 50% of the food going to Rich Town and 50% going to Poor Town, but then there is a crop failure, and the food supply drops by 40%. The price of food increases by two-thirds, resulting in Poor Town only being able to buy 20% of what they used to buy, but Rich Town can outbid Poor Town, and Rich Town has plenty of food.
So, if you look at the food inventories and food supply in Rich Town, there is no problem, but if you look at the food inventories and food supply in Poor Town, they are only able to acquire 20% of the food that they used to be able to buy.
http://www.energybulletin.net/22775.html
Published on 18 Nov 2006 by Wall St Journal. Archived on 23 Nov 2006.
As Fuel Prices Soar, A Country Unravels
by Chip Cummins
I've discounted the inventory argument for one key reason, it only measures part of the market, even if you look at OECD countries, whereas spot oil prices reflect global supply/demand (and to some extent geopolitical factors).
That never stopped you from promoting the export hypothesis. When U.S. imports were falling, you cited that as evidence that the crisis was upon us. But of course, the U.S. is only part of the market, so if we apply your same criteria we can "discount your argument." On the othen hand, when imports starting rising, I do recall that you said "The U.S. is not the world." That's when I said you were cherry-picking your data points. I do not think you use consistent methodology when looking at these arguments.
My point was that oil prices were increasing while our imports were falling. If US demand was falling, why were oil prices rising? My conclusion was that it was evidence of falling export capacity. And yes I know that US imports rebounded, as prices fell, but I suspect that it was because we had killed off a lot of demand--and some people--in regions like Africa.
But the whole US import situation was never my primary point.
My primary point, which I made in January, 2006, was that the top three net oil exporters would show lower exports, and that is precisely what we have seen. The whole US import, US/OECD inventory thing has been nothing but a distraction.
It makes as much sense to focus solely on US/OECD imports and inventories as it does to focus solely on African imports and inventories. What does give us a good idea of the global supply/demand situation is the average monthly crude oil price.
IMO, the 20 months after 5/05 have been a simple case of consumers bidding against each other--as Deffeyes predicted--for a reduced supply of oil. It's really not that complicated.
In any case, I do think that we are facing another round of bidding for declining petroleum exports, except that we will be bidding against the EU and China this time.
My point was that oil prices were increasing while our imports were falling. If US demand was falling, why were oil prices rising? My conclusion was that it was evidence of falling export capacity.
But as I have clearly shown in the past, our falling imports coincided with peak refinery turnaround season. Again, look to the inventories. When the refineries are down they aren't buying as much oil. Why? Because there is no place to put it, which you know if you are watching inventories.
My primary point, which I made in January, 2006, was that the top three net oil exporters would show lower exports, and that is precisely what we have seen.
Once again, using your logic, we don't know that, because you don't know the export situation for the entire world. This is why you are inconsistent. You are using different methodologies depending on whether you want to argue for or against a point.
What does give us a good idea of the global supply/demand situation is the average monthly crude oil price.
Again, you cherry pick when price matters to you. You suggest that it is meaningful that Saudi cut in the spring, even though I showed that the refinery utilization and inventory trends are consistent with their cuts. But then, price started falling and fell for the rest of the year, even in the face of their cuts. What does that tell you? The market was not calling for the oil they took off the market - which is why they took it off the market. Again, if they peaked, it was most fortunate timing for all involved.
"we don't know that, because you don't know the export situation for the entire world."
Speaking of which, you don't know the inventory situation for the entire world. In fact you don't know the inventory situation for the OECD countries, since no data exists on the mix of product held. I wonder if you even have knowledge of any trend in the mix of state and commercial sector inventories. You rest your claim of abundant inventories in the non-OECD world on some remarks you say were made by Saudi officials regarding south-east Asia. Pretty skimpy.
Despite not having any real data, you continue to assert that you know something of inventory trends.
As for your logic regarding the significance of increased inventory levels, it asks us to believe that the Saudi's were and are unaware of a perception of instability that supports a trend to higher inventories in the OECD countries. The decision in China to build an SPR is in this same vein. If an experienced analyst working for Apache can see this trend, would it escape the Saudis?
I doubt the Saudis consider their peak to be fortunate. That it is occuring co-incidently with world peak and with unsteady demand is entirely predictable. Demand for oil is primarily dependent on income. Peaking oil involves declining eroi, which via shifting investment priorities erodes productivity and income. I have posted comments on this elsewhere.
Well, crap. I just had a 500 word reply wiped out because I accidentally clicked on a link to the left. So, let me just hit the high points.
Speaking of which, you don't know the inventory situation for the entire world.
Is there an echo in here? That is exactly what I am answering from Jeffrey. He is being inconsistent in whether it is significant that we don't know data for the entire world (it apparently is when it is my argument) or whether it is not significant (if we are talking about his export argument).
I have provided graphs, tables, and links to support my argument. Criticisms, such as yours, rely on appeals to unknown information. Yet they still want to make conclusions. They want to have it both ways. What we do have is information for about half the world. And that information supports my argument that the Saudi cuts were consistent with what was happening with inventories. If you wish to take the position that the missing information supports you, then it is up to you to support that contention somehow.
You rest your claim of abundant inventories in the non-OECD world on some remarks you say were made by Saudi officials regarding south-east Asia. Pretty skimpy.
The Saudis and Iran both said the same thing. They said they were cutting shipments because inventories were high. We know they were high in the U.S. and across the OECD. The comments by KSA and Iran are an additional piece of information to plug in. Show me where inventories were falling. Support your argument, instead of appealing to undiscovered evidence. Again, here are the facts: For the countries we know about, inventories were rising when the Saudis starting cutting. Of course we also know that the price started falling shortly after they began making their cuts. I can’t believe people can’t see the significance of that!
Despite not having any real data, you continue to assert that you know something of inventory trends.
You are really on a roll. Thanks for the comic relief. Perhaps if you continue to close your eyes and ignore it, the data that I have presented really won’t exist at all. On the other hand, if you are interested in opening yourself up to new information, review my response to Jeffrey where I posted the graphs.
That’s enough. I think you get the gist.
Edited to add: I had stated this is the response that got deleted, but your point about not knowing the product mix is completely irrelevant. In tracking Saudi’s crude moves, what is relevant is a look to the crude inventories to see if they are consistent with the moves. Product inventories, for reasons that should be obvious, don’t matter in this case.
In any case, the macro picture remains the same.
As Deffeyes predicted, world crude oil production is below its 2005 peak (EIA).
Because of reduced supply, oil prices in the 20 months after 5/05 are about two-thirds higher than in the 20 months prior to 5/05. Currently, prices are right at their post-5/05 average level.
Forced conservation has primarily occurred in poorer regions like Africa, but IMO, forced conservation is going to move up the food chain.
Used to happen to me all the time Robert. Especially with Yahoo mail. I would type a very long letter, then hit "send" only to have Yahoo tell me I needed to log in again. I would then go back and all would be lost. Boy that really pissed me off.
Then I wised up. I started typing everything into Word, then copied and pasted it into my email, or into TOD, or wherever. I have never lost a post since. If I screw up, or if Yahoo screws up, I just go back and re-copy the post from my Word copy. And besides, spellchecker is much easier to use in Word.
Ron Patterson
A slightly easier approach is to type in TOD, or Yahoo, or whatever, and before attempting to post, select all text and copy (ctrl-A, ctrl-C). If you then lose your text you can paste it back when you get the web-page available again.
I always do that as a safety measure. If there is a delay, or for some other reason I'm afraid of forgetting that I have stuff on the clipboard, then I do copy it to Word.
Then I wised up. I started typing everything into Word, then copied and pasted it into my email, or into TOD, or wherever.
I almost always do that, but hadn't intended to write a long response. I usually just copy the text to the clipboard, unless it is a really long response in which case I will save a copy. I just failed to do so that time, and accidentally clicked on an ad.
I wonder, Gregor, if you could describe in layman's terms what determines the rather curious shape of the oil price curve? Climbing steeply from the present day for the next year or two, and then falling back to near-present-day prices? I've only been looking at oil for the past couple of years, and the curve has had roughly this shape throughout this time.
What are the forces that determine the shape of this kind of curve, and why is oil so different from most other commodities?
You did not ask me, and I am no expert; however, it is worth noting that the current situation is different from the past up to around end 04, when oil futures changed from virtually always lower (punters apparently thought oil would become more plentiful) to higher.
For metals, where storage costs are negligible, futures are always higher, because otherwise one who wishes to hold the metal would just buy the future, rather than paying the interest inherent in holding the physical resource; and, the difference in the front to back contracts is approximately the going interest rate over the given time, or in other words there is, I believe, usually no interest-adjusted difference between present and future price.
IMO, the change to higher futures for oil means that the market is beginning to accept that energy will be more expensive in the future. However, this idea is barely sufficiently to counter claims by cera and others that a wall of oil is coming in the most distant contract years. If sa declines another 1Mb/d by end 07 there is a chance that more will want to have some claim on future energy supplies.
Stuart,
RE 'Bumping the ceiling'
I see no one so far has mentioned that there are other constraints to increased production besides what all the world's oil wells can pump. That is clearly the oil processing infrastructure, including the full tankage that RR refers to in saying the market is well supplied. How about the hypothesis that the market is not well supplied but has outstripped the processing infrastructure bottlenecks. This would indeed be a 'convenient' excuse for the Saudis to slack off production and would lend credence to their assertion that they could not find buyers (refiners with full tanks) for their crude even though there were plenty of buyers (SUV drivers with empty tanks) for the finished product.
I'm beginning to lean more toward the scenario of what some have termed the 'unlikely coincidence' of involuntary Saudi decline and peak of world wide crude processing capacity. The rise in rigs and construction of new refineries would lend credence to this view.
Isn't worldwide production fairly flat right now in spite of Saudi decline? That is, to some degree at least, producers other than KSA are keeping the oil processing infrastructure full, allowing KSA to cut back. If the bottleneck is full and remains full through the driving season, we should expect to see higher prices and possibly no increase in KSA output, leaving us still 'proofless' as to whether they can actually significantly increase production or not.
Great analysis Stuart. Let me just add a few things.
I ran Neutron logs on a couple hundred wells in Shedgum field in 1985-87. Aramco was drilling wells on the fringes to monitor the flood front advance. Ironically, we used to laugh at the fact that we could never find water but Aramco's engineers weren't impressed. IMO, Simmons is accurate in saying the advance isn't working as planned.
I agree with you that this is not a resource problem but a supply chain problem. Aramco needs to drill a shit load of wells in Ghawar, safaniyah and Abqaiq. Ghawars wells originally produced 18mbd through a 2 7/8 choke. My guess is that to save the field they need a smaller choke and more wells. How many more I would know. God help us when they go to pump jacks! haha
IMO, the one problem is that most of the worlds available rigs are a bunch of 30 year old rust heaps. Were that not enough, steel is brutally expensive.
That being said, Hubbles least read and most important papers were on the hub system and dollar based pricing. One thing that is abundantly clear is that Saudi Arabia was set up to deliver oil in dollars to the US market. As the world gets flooded in dollars this pricing system will be put to the test.
There is a disconnect between the reported “Saudi proven reserves” and “exactly where all that oil is located. I have said it before but I must repeat it here because so many people simply ignore the statement by Aramco Senior Vice President Abdullah Saif. He stated that their existing fields sustain a 5% to 12% decline rate. The EIA stated that this means Saudi needs around 500,000 to 1 million bb/d of new capacity just to compensate.
Okay, just what did Vice President Abdullah Saif mean by “existing fields?” I think we can safely assume he meant all fields that came on line before 1967. These fields include Ghawar, Safaniya, Zuluf, Berri, Marjan and of course those two very old giants that are almost totally depleted, Abqaiq and Qatif. He may not have meant Shaybah, which though discovered in 1968 did not come on line until 1998.
But for half a century before Shaybah, these giants and super giants produced over 95% of Saudi oil. The Aramco Vice President most certainly meant to include all these very old fields as “existing fields”. As of 1994, the last year we have any field by field data; these fields produced 8,060,000 barrels per day. That was almost all the oil Saudi produced that year. If these existing fields are all declining at from 5% to 12% per year, then we can safely conclude that Saudi oil production is in a nosedive. If 95% of your oil production is declining at an average rate of 8%, it is impossible to expect the new, much smaller fields, to take up the slack.
And of course, if all their giants and super giants are in decline, just where is all those proven reserves located? If Saudi has produced only 28% of URR, as they claim, then how is it possible that 95% of producing fields are in decline? There is an obvious contradiction here.
One more point. I am at a loss to how people can believe Saudi is telling the truth when they give optimistic news when they talk about future production potential or “voluntary cuts” but seem to believe the Aramco Vice President was lying through his teeth when he tells us the most pessimistic news he could possibly give us, that Saudi’s giants and super giants are in a production nosedive. Yet that is what some noted oil men expect us to believe. I tend to believe that this was a slip by the Aramco Vice president. He may have had his hand slapped and told never to give out news like that again. They must proclaim that their reserves are almost inexhaustible and they can increase production to 12 mb/d at any time they wish.
They simply do not wish to do that, that is all, and they are not likely to wish to do that any time in the future.
Ron Patterson
I think that one must consider as a possible explanation for the dramatic increase in production in 2004 the 2004 US elections. KSA has a strong relationship with the current administration, and it is plausible to see the big jump in 2004 as attempting to drive down prices in advance of the US elections. Once that was over production declined. This thesis does not explain why KSA gradually increased production in 2005, nor the subsequent drop off. Some explanatory power, but not all. Lots of factors at work here.
I'm a new user, but have been following The Oil Drum posts with interest.
westexas, in his post on Saudi internal consumption, mentioned that it had increased from 1.64 mbd in 2004 to 2.0 mbd in 2005, and then in the following paragraph, mentioned that since then, Saudi consumption "may now be on the order of 2.0 mbpd".
You may have intended a figure greater than 2.0 mbd for present-day consumption...
Keep up the good work.
I was talking about Total Liquids versus crude + condensate. If the Saudis showed the same rate of increase from 2005 to 2006 that they showed from 2004 to 2005, their Total Liquids consumption is now up to about 2.44 mbpd, an increase of 440,000 bpd (Total Liquids). If it was "only" half the 2005 increase, this would still be 220,000 bpd.
Best Post I've read here - Great work Stuart!
Question: under the "entering the supply constaint era" heading, you state: "In the fourth quarter of 2004, Saudi production drops sharply" and later: "Saudi Arabia appears to have been obliged to do the opposite, dropping production by around 400,000 barrels per day between October 2004 and January 2005."
looking at the graph of Saudi production, this isn't the case, the drop occurs in Q1 2005.
Is this an error in the x axis labelling, or actually a mistake, as it's a significant date change. Either way it would be nice to see the x axis on the production chart relabelled to show the start of each calender year rather that the beginning of March - as it is the price band graph is somewhat misleading.
They are US style dates with the month first. So 1/3 is third of January, not 1st of March. The actual dates in my spreadsheet started life as the rig count dates in the Baker Hughes spreadsheet, and I haven't got around to cleaning them up.
I'd like to focus on your comments concerning the effects of peak oil. First I'm convinced that it will cause hardship and increases the chance that political or other above ground factors such as a Iran war could cause significant drops in production.
But outside that I agree peak oil is not the end of civilization and we should be able to weather it. The US is in a very poor position because of its size and reliance on automobiles but this is a lifestyle choice not the end of civilization. The US will have to adjust and their is a good chance it will lose its status as the only superpower.
In any case most of the drop can be handled via moving to a prudent and reasonable life style probably centered on electric trains.
But I am now concerned abut what I call peak EROI. Most alternatives to oil have a far lower EROI and as we move to these we have to depend on new infrastructure built with these low EROI energy sources. The EROI drop is on the order of 10:1 or 5:1 depending on the energy mix. If you consider that a all out boom in coal production is not feasible because of global warming and even if we take this approach coal supplies will rapidly peak and decline and they are unevenly distributed thus coal is not a good solution for the world primarily benefiting china and the US.
I'm hoping you will be willing to look at this problem since this coupled with increasing effects of global warming point to the possibility of a real threat to our civilization within the next 30 years. I think that by assuming peak oil now and some reasonable assumptions about replacements we can see if this concept of peak EROI is real.
The reason this is important is that as peak oil becomes obvious and we consider mitigation strategies I believe a understanding of peak EROI would be invaluable for guiding policy. Already the US seems to have picked on of the worst solutions corn ethanol hopefully as time goes on people with a better understanding of the entire problem can offer solutions that are more reasonable.
And last but not least electric cars do not solve the problem of road construction using asphalt so its quite possible for us to end up with plenty of electric cars but no roads. The general economic effects of expensive oil suggest that increasing taxes to offset the potentially major increases in road construction costs is not feasible.
In fact the tax base will be steadily shrinking as requirements for new infrastructure increase esp. in place like the US that don't have a good rail infrastructure.
So if we move to electric rail even less money flows into road construction compounded with the lower tax base from economic contraction.
I think your post verifies why Kunstler is probably correct, but let's hope not.
There have been some posters here from time to time that will claim America is in an OK position, because we have so much waste, but if the world wakes up all at once with seemingly no plan; then how will the US have the latitude to make the investments required to transition to this less wasteful lifestyle? On the face of it all Industrialized countries that have an electrified transportation structure in place would seem to be the winners.
With that said the US still holds some cards with respect to world stability and that would be food production and the ability to wreak havoc militarily when things do not go our way. Therefore, we may be digging canals, building Nuke plants and building railroads by hand, while the agriculture and the military get the oil.
I think we should call it the Civilian Conservation Corps (CCC). Do you think Americans can still build quality structures like the CCC?
I don't know. I would say Americans today are not the same as in the 1930's. In general I don't have a lot of hope.
But we will see. America is a wealthy country and it does have significant coal reserves so its capable of making the transition. I'm just saying that it won't be easy for the US and I think we have made the worst possible choices in infrastructure for a post peak world.
So we will almost without a doubt get cut down a notch or two.
But this is not the end of the world. Peak EROI on the other hand seems to indicate the point at which we start having problems supporting our population. I'm hoping someone would peruse this and see when it will occur. Its more important in many ways than peak oil. Your talking about total usable energy dropping by 50% a year after peak EROI.
I think that your analysis is flawed. The U.S is very inefficient but it is also the third largest oil producer. Europe is very efficient yet still produces only a small portion of its oil needs domestically. If the U.S were as efficient as Europe, we could export oil. Therefore each gallon of gas that Europe loses in imports is more greatly felt than each gallon of gasoline that the U.S loses because there is plenty of room for improvements in efficiency in the U.S while in Europe there is less room for improvement.
Good point. Except the EU can more easily adopt electric transportation and Nuclear and PV wind to power it.
The cost of useless infrastructure cannot be easily dismissed.
The EU has to build alternative energy sources we have to move a lot of people around which leads to massive losses.
And we still have to build the same alternative sources.
kebu77 Politics tempers geology. Stuart's post may give too much emphasis on the geology, leading to a too pessimistic downward projection in KSA production in 2007-10.
The two KSA swing-production events in 2003-04 tend to distort the shape of the 2002-06 KSA production curve – the large increase for the Iraq invasion is the clearest of the two, and the second larger surge (larger in area/volume, not vertical scale), MONTHS before the 2004 U.S. presidential election (the elephant in the room no one wants to mention - the KSA tribe looking out for their Bush tribe friends - can we forget the picture of the two clan members holding hands at the ranch?) If you level these out, closer to the OPEC quota limits for these periods, and then extend the production chart back to 1997, then the later KSA declines don't look so severe. (Note also that the steep production drop at the end of 2004 closely matches the price drop for that period.)
In addition to KSA's offset for the Iraqi production increase in 2006, note also that Russia continues to increase production to the end of 2006. (The overlapping KSA-Russian production chart posted, sorry I forgot by whom, yesterday was telling in this regard. While KSA swings, Russia steadily increases from 2002-2007.) Assume KSA has economists and sees OCED economic softening and demand destruction in the third world; it's not too hard to imagine them in July 2006 anticipating lower demand beginning soon and continuing for some time, thus jumping the gun on the price peak. An added geopolitical factor is KSA's growing impatience with U.S. failures in Iraq: this could explain their reversion in 2006 to more closely hewing to the OPEC quota limits than in the prior three years (don't listen to us, invade; oh, you failed... now we need extra $$ to defend our Sunni Iraqi friends...).
Fascinating article! This is the first article I've been moved to comment on here. It's very well written and reasonably convincing. I do want to ask about one alternative hypothesis, though. It appears that the noted 2006 drop served to bring KSA production pretty much exactly in line with their OPEC quota, and since then their production has stuck relatively close to quota. Before that drop, it was outrageously over, especially in the periods when they were, under whatever pressure, propping up Dubya's attack on Iraq and Dubya's re-election campaign. (I don't think it's any coincidence that production drops at the end of 2004.) Is it possible that, having seen that a higher price point is sustainable and good for everyone involved, they have simply chosen to abide by the quotas for the first time in several years?
I acknowledge that the smoothness of the curve seems to resemble continuous gradual decline more than deliberate cuts, though, but is there any real way of ruling out the possibility, other than waiting to see whether they decline to significantly below their quota? It looks like a few more months might answer the question, if not.
Furthermore, according to Robert's hypothesis, these declines (in 2006 for example) are voluntary. The declines occur every month according to the production statistics. Therefore, the level of production must be being adjusted at least every month under normal circumstance to implement the decline schedule. So again, if they are being adjusted every month, how can it be so difficult to change the adjustment to do a little extra ramping down on existing production when new production is coming on line?
I will make just a few comments here. First, I made it very clear that after going back and looking at the data, I no longer believed that the bump was due to Haradh III. The problem for me was one of timing. The plant was finished in January, commissioned in March, but then we see no production bump at all until July - and then suddenly the entire bump comes all at once? Given that commissioning means that they should have ironed the bugs out and actually started the plant, I find that odd. Also interesting in my opinion is the fact that the bump came right in the middle of peak driving season in the U.S. Maybe they received a large order at that time. I don’t know. Stuart doesn’t know. He has definitely provided food for thought, but as I indicated in an e-mail, I don’t think the truth is as straightforward as it may seem.
Now, I don’t mean to imply that we should trust that all will be O.K. I don’t believe that, and I think it is terrible policy that national security is in the hands of a country with an opaque oil industry in an unstable part of the world. Whether or not I believe the Saudis are holding production up their sleeve, I believe we need to move away from our dependence on them post haste. But, because of the costs involved in such a move, I am inclined to believe that we will be dependent upon them until they have no more oil to sell us.
I don’t plan on getting involved in debating this issue ad infinitum. That’s been done. Behind the scenes, Stuart, Euan, and I have exchanged many e-mails discussing this, including quite a few today. I have laid out my cards on several occasions. Euan and Stuart have laid out their cards. I think we will see Saudi called upon at some point this year to increase their production. If they fail to do so, and the inventory/price signals are suggesting that their oil is needed, I will conclude that they are unable to raise production. As of now, I still conclude that their moves have been entirely consistent with what the market demanded, and if they have peaked, they certainly did so at a convenient time.
One more thing :)
I agree withs Euans hypothesis of resting some fields and wells. It fits with what your saying to some extent but it means they really needed to rest some wells. And of course my on idea that they can empty tank storage for a while.
This means they should be capable of a mini surge this summer.
I'd hazard to guess about 90 days close to 9 mbd. The point is this is not proof they are not declining. The proof will come if they then decline and prices are high or they rise later in the fall and KSA does not respond. So I'd agree they may be capable of shipping close to 9mbpd for a short time but its not what I would call real production and its not sustainable for very long. With 33 million barrels of storage thats 33 days from storage alone and assume they have say 1-1.5 mbpd of production that consists of surges from rested wells and damaging production from other fields.
Note this puts their real decline rate at closer to 6% then 8% and maybe as low as 4%. They are still declining.
This leads to my 90 day surge hypothesis.
My point is I am sure this will happen and its not proof that they can still produce.
The proof comes later in the fall or early 2008. If they really are declining they won't be able to do it again. I am convinced mainly by Euans arguments that they are gaming to show what looks like a surge but its just that a game.
This just requires that 2% of the decline is from resting fields that are brought back into production for short times. So at best the arguments presented say that the real decline rate may be lower than 8% by a small surge factor from pulsing production in some of the aging fields. These are large fields so pulsing them like this can result in large but brief periods of increased production at least for a little while.
$1000 wager.
So far, CERA et al has not taken Stuart's challenge. This seems strange considering the following:
SA is rapidly increasing their investments, rigs up 3x (some at $500k/d), new refineries to handle heavy/sour/Vanadium, etc.
SA, backed by CERA, says SA is rapidly on the way towards 12.5Mb/d production. Separately, SA, as noted earlier in the thread, claims to be able to get to 15Mb/d.
CERA may be nervous that Stuart's 10.7Mb/d value is, in spite of the above, too high. So, lets lower the bar;
SA recently produced nearly 9.5Mb/d for an extended period.
9.5Mb/d is 24% under the SA/CERA 12.5Mb/d target.
So, I offer to bet $1,000 that SA will not average 9.5Mb/d for any twelve-month period between now and 1/1/2010, using EIA statistics.
Note that 2Mb/d new production is scheduled to come on line thru early 09, potentially raising production from 8.5Mb/d today to 10.5Mb/d, or 11.5Mb/d if their recent cuts are voluntary; so, I can only win if depletion is both substantial and ongoing... unless, of course, the world has no need for this much oil, requiring that SA continues to exercise restraint to avoid a price collapse. Perhaps the latter will be CERA's position.
I see your $1000 and raise you $1000 for 9.4 mpd.DO I hear a 9.3?
Great work Staniford. I would like to add 1 point that further makes your case. The 3 disruptions we had in the last 15 months when Saudi's did not raise production.
Hurricanes, Nigerian conflict and BP's purdhoe bay debacle.
http://www.financialsense.com/fsu/editorials/2006/0810.html
I would also add, with respect to $1,000 bets, that I do have a $1,000 bet on with respect to oil prices this year:
The $1,000 Bet on Oil Prices
No way would I have made that bet had I not believed that the Saudi reductions are voluntary. So, I have also put my money where my convictions lie.
Your bet is reasonable fot the time period. IMO we are at peak, and have been since 1/05. Being at peak does not immediately translate into substantially higher prices... flat production will boost prices over time, but of course other events, such as warm winters, may ameliorate.
SA in decline will only offset brazil/angola etc this year. Of course, there is some risk, you would lose in a heartbeat if bush attacks iran. you're probably safe, even tho he really, really wants to. OTOH, the official terrorists are even less predictable.
edited.
Whatever the gyrations of the oil futures market, a price spike for actual oil is not sustainable.
In the past, oil price spikes were reversed by increases in supply. In the new era of constrained oil supply, a price spike will be reversed by decreases in the energy profit of oil production.
The insight provided in the following sentence from Stuart Staniford's excellent analysis of the trend in Saudi Arabian oil production helps understand why a price spike is not sustainable:
"Thus the usage of oil is highly sensitive to economic growth - indeed economic growth has a far stronger effect on oil demand than the price of oil (an economist would say that the income elasticity of oil demand is much larger than the price elasticity)."
If real income declines, then the demand for oil will decline. Income does not decline because the price for oil goes up; high prices merely transfers income from one agent to another. Nor is income increased when the price for oil declines; low prices mean only a smaller transfer of income.
Income is dependent upon productivity and productivity is fundamentally dependent upon investment.
What is peaking oil doing to investment?
One characteristic of peak oil is the volumetric peaking of oil production. Another characteristic is the decline in eroi. This follows from the tendency to harvest the low-hanging fruit first. It is an observable fact that technology does not enable us to outrun the rising energy cost of obtaining oil. It is also observable that the rate of decline in eroi is a function of the size of demand.
Because oil plays such an important role in all aspects of the economy, is such a large share of total energy supply and enables the provision of virtually all other sources of tradeable energy, and also because natural gas is reaching its own supply limit, the decline in the eroi of oil leads the decline in the eroi of the total energy supply.
The effort to maintain the supply of energy requires a shift in investment. The share of the economy committed to provisioning energy grows, and it grows faster than any increase in the total energy supply. Effectively, investment shifts to a sector where productivity is falling, without reversing that fall, indeed is intrinsic to it.
Investment is taken from the rest of the economy. Consequently, the rest of the economy is embarked on the road to declining productivity. The upshot is a decline in purchasing power.
Advances in communications technology have facilitated the globalization of industrial processes and so in the short term declining productivity resulting from declining eroi can be offset by the productivity benefits which accrue from this globalization, principally, it appears, from new divisions of labour. But rust never sleeps. Moreover rising transportation costs slowly erode the advantages of an international division of labour.
This process takes time, but it is underway. It is unfortunately reinforced by untold numbers of bad micro and macro investment decisions made while suffering the illusion of plenty. We simply have to think of single occupant SUV on clogged arterials.
Great post. This is the problem we need to look at.
Not peak oil per se. It when this EROI treadmill kicks in.
The problem I have is I see that 50% or more of our economy could easily be devoted to energy depending on EROI factors.
This leaves little for other pursuits. Ethanol's EROI is so low its not worth considering. I'd have to guess that to maintain a resonable economy we need to say keep energy investment below say 10%.
In any case the combination of peak EROI/GW is troublesome.
I'm not even worried about peak oil now.
TFO,
Would you agree that non-biomass renewables (wind, solar) have a high E-ROI?
edited
Not yet. But I do think that they are worth pursuing, slowly, steadily and strategically. The intergration of wind with hydro in Scandinavia appears to be a good model for increasing the eroi of wind technology.
It appears to me that predictions of cheap and abundant energy from wind and solar (and nuclear) fail to account for the impact of the decline in the quantity and quality of fossil energy. Nonetheless, there is something to be said for experimentation and skills acquisition.
Georgescu-Roegen writes: "Life must rely on novel mutations if it is to continue its existence in an environment which it changes continuously and irrevocably."
This assertion is clearer in the context of the principle: the emergence of novelty by combination.
Like it or not, our economy is a life force which has changed its environment irrevocably. Bountiful oil is transformed into still useful artifacts and waste. It is barely still available in crude form to do work for us, and increasingly its work is consumed in repairing the destruction its waste wreaks.
We are embarked on a desparate search for new arrangements. Utopians promise that they have visualized the new arrangements; some, for example, promise the good life premised in large part on nuclear power and electric cars. But all we really know is that diversity improves the probability of falling upon novel combinations of technologies and social organization which will support the project of civilization.
This, in large measure, is why I support continued investment in wind, solar and certain other energy conversion technologies. I don't for a moment doubt that these are better investments than synthetic oil from the tar pits of Alberta or Venezuela.
Conservation is now potentially the most productive investment, and will do most to maintain income and social stability. All other investment has to be measured against opportunities lost in foregone conservation efforts, even if the full potential of conservation remains theoretical while we struggle for the appropriate economic model.
Embedding materials and energy in durable housing designed to provide comfort at the lowest possible energy cost for centuries is a conservation investment. Conservation investment of this type is labour and capital intensive so to make it work economically, markets need to be redesigned such that the cost of the investment is shared equitably by the beneficiaries, some of whom will not yet be born. Clearly, discounting future utility is a practice that needs revisiting.
I agree that efficiency improvements are, in effect, the cheapest source of energy around.
"predictions of cheap and abundant energy from wind and solar (and nuclear) fail to account for the impact of the decline in the quantity and quality of fossil energy."
I keep seeing this idea, and it still doesn't make sense to me. The basic concept of E-ROI is that if a process has an high E-ROI, say 30, then for every unit of energy you put in, you get 30 out. What does it matter if you have only 50% as much fossil energy? You can take 2% of it, put it into your high E-ROI process, and get back 60%. Voila, you have 110%.
Surely high E-ROI investments will be the first place our remaining energy will go? We may drive less, but we'll still build windmills as long as there's any energy left at all.
Oil is only 40% of our energy, and peak oil predicts that you'll have at least 50% left after, say, 20 years of decline. So, that's only a decline of 20%, and we'll still have 80% left. More than enough to invest some in a process that will generate energy that will be so much more valuable.
Wind power accounts for more than 40% of planned new U.S. generation in 2007, and it's growing by at least 25% per year, so in 5 years it's likely to be able to supply all new generation needed.
Wind is variable, but there are a lot of cheap, very low energy investment ways to handle that: geographical diversity, demand management (including planned charging of electric vehicles), storage of various kinds, and cheap backup generation.
Hi Nick,
re: "We may drive less, but we'll still build windmills as long as there's any energy left at all.
Oil is only 40% of our energy..."
To take the latter point first:
It seems that the degree of difficulty we face has a lot to do with what activities are predicated upon that 40%, how critical those activities are (to whom, for what), and if a rapid loss of that 40% will endanger the functioning of the entire economy.
These seem to be big questions - not answered.
re: "We may drive less, but we'll still build windmills..."
How will you (or we) insure this? For example, with what funds will the windmills be built? Tax? From whom? From people driving less...because...they are out of work?
"These seem to be big questions - not answered."
Sure. OTOH, I'm addressing the narrow question of windmill building. I would suggest that windmills will be built unless the economy collapses far, far beyond anything we've seen in US history, including the Great Depression.
"with what funds will the windmills be built?"
With the funds of utilities and private investors, as they are now. The utilities will continue to have cash flow, and if capital markets are still working they will be happy to lend for such a profitable project.
Re collapse: I think you have to ask yourself what reason we have to believe things will collapse. They didn't around 1980, when oil prices skyrocketed, and the US reduced consumption substantially for several years. All of the arguments that I have seen for collapse involve basic misunderstandings of our basic energy situation.
Again, the US still produces 40% of our own oil, and we could reduce our usage by 30% much more quickly than most people in PO circles recognize. Heck, we could reduce gasoline usage by 10-20% by simple driving changes: less acceleration, slower highway speeds, which we would certainly do if gasoline tripled in price.
my word, for engineers, you boys certainly are riverboat gamblers!...who'da thunk that?...i need to re-up my ASPO membership!
Stuart - This edited version of one of your charts shows the Hardah blip that seems to form the cornerstone of your argument. I've also included the analagous hypothetical decline curves for the Qatif and Abu Sa'fah development in 2004/5 which you suggest also shows up in the Saudi production profile.
If this were analagous to Hardha, and the Saudis were fighting off uncontrolled decline, why then does the production not follow the dashed red line - that is drawn 700,000 bpd above the late 2004 decent line?
You may also wish to comment on the inferred 500,000 bpd uplift assocaited with Haradh, even though the production is only 300,000 bpd. Also, the gradient of these lines, which are eyeballed through the 2006 decline data (which as you know I maintain are voluntary), suggest a 17% decline rate that seems unrealistically high to me to be natural.
Euan - I'm not claiming the decline in Q4 2004 was at the same rate as the others. It doesn't make sense to me that declines for an entire country would be that rapid in the first quarter. My best guess is that they were overproducing their fields and decided to rest a few vulnerable pieces of production in a hurry. So you aren't contradicting a point that I was actually making there. I'm assuming the declines themselves would have started more gradually (at least I can't think of a scenario in a region as large and complex as SA where they would start out the gate at O(15%).
The second point (500 vs 300) does seem to be the case and I'm not sure what's going on. The main (known) difference between this plot and the earlier one is the inclusion of the OPEC numbers in the average (which I had not finished transcribing back into 2005 at the time of the earlier post). One possibility is I was just lucky the first time and actually the answer is pretty sensitive to which series are included in the average. Another possibility is some other kind of screw-up. Unfortunately, I won't have a chance to track it down until tonight (Pacific time) - I will then investigate in detail what is going on with that.
I've done a quick initial look at this 300 versus 500 thing and what I think is going on is that small changes in the data, or fit, allow for somewhat large changes in the value of the vertical offset between the lines - one can make plausible looking solutions with a range of values. (Due to the steepness of the lines). So clearly, being sloppy and hand-placing lines is not good enough here, and a proper statistical analysis is required. However, that's going to be a little time consuming (simple routines will not fit two lines constrained to have the same slope, so I think it will require actual coding) and I'm not going to tackle it tonight. But my intuition is that the 2 sigma range will include both 300 and 500 as offsets - thus not ruling out the Haradh explanation, but providing less compelling evidence for it than if the fit constrained the value tightly to the advertised Haradh capacity.
I extrapolate forward and backward respectively into June, and then difference each sequence. I get EIA: 300kbpd, IEA: 220kbpd, OPEC 330kbpd, JODI, 650kbpd. Overall, it's 375 ± 190kbpd. So Haradh, at 300kbpd, is well within the range, but it does allow features somewhat smaller or larger also.
Had the mar and apr 06 data points been down just a little, there would have been a very smooth looking shoulder as the decline accelerated, and then briefly arrested by haradh - which, as you noted, seems to be producing more than expected; well, they are drilling a lot of wells these days, maybe they had a bit of luck somewhere. Whatever your position, one tends to read into the tea leaves what one wants to see.
For 'natural' decline rates, look at other examples of fields with water flooding from the beginning that are now resorting to horizontals. 18% is not unusual. What is quite unusual is for nearly all fields in a major oil producing region to be the same 50year+ age. What would be highly unusual would be for sa to decline at a rate similar to the US, mostly developed with old tech vertical wells, and water flooding as subsequent secondary production.
Well, nothing major until end 07. If decline rate continues sa will be down to 7.5Mb/d... if this comes to pass, faith will decline along with the oil, but not all will lose faith; 12.5Mb/d will remain on target. The locals are a faithful lot, wonder what they'll be thinking...
Obviously there's no way to know for sure, but here's a notional scenario of the kind of thing I'm thinking:
Great graph... worth at least 1000 words. I can imagine somebody in sa looking at this graph and wondering who leaked it.
The underlying rate looks to be 1.2Mb/y... this fits in with ghawar going down at 20%/y, consistent with other horizontally drained fields at end of life, and the rest of their fields declining 6%/y. YE07 would be around 7.5Mb/d, and looking four years out to end 2010, production would be around 2.0 ghwawr/3.5 balance for 5.5Mb/d total, boosted by their announced 3.1Mb/d new projects to 8.6 Mb/d. Of course, this depends on none of their other ageing fields crashing.
The red queen is running as fast as she can on the hot desert sands.
On the plus side, they can direct more rigs looking for oil, less for gas; the ghawar gas cap is becoming available.
Hello SS,
Great Chart! Assuming KSA is going forward with bottlebrush horizontal wells: is there any way to generate an avg expected lifetime before watering out? Also, I would expect the avg well in a carbonate field to water out faster than a sandstone field due to porosity and permeability differences--is this generally true?
I hope you develop the above chart further as the basis for your next keypost.
Bob Shaw in Phx,Az Are Humans Smarter than Yeast?
Most excellent essay, Stuart, well reasoned, supported by data and argued.
I'd like to focus on the predictions your analysis makes and when we might conclude it is probably accurate, mostly accurate or possibly incorrect for the medium (5 years) term.
If accurate, Saudi production looks likely to fall to 8 mbpd in about 6 months. Economic recession (or 'growth recession') is likely to muddy the demand waters by then but some significant supply disruption elsewhere is reasonably likely to occur within the next year. That is likely to require KSA to produce above 8 mbpd within that time, should they fail I would interpret as strong support for your analysis.
When re-reading a good number of articles on KSA production plans last November all the KSA originated ones firmly concluded that they would have a productive capacity of over 11 mbpd in 2011 and 12.5 mbpd in 2012, some were as high as 13.5 mbpd in 2012. The planned new projects were consistently reported and planned with some apparent certainty for the next 5 years. What did smell, to me, were the extremely low decline rates they were projecting, typically less than 0.5 mbpd per year, even lower over the 2006-2009 period. The KSA contention was that infill drilling and EOR were mitigating natural decline rates of 4% to 8% down to an overall 2%. Your analysis contradicts that most clearly, which is more correct should be visible within 1 year.
Global all liquids production has barely, if at all, increased from 2005 to 2006. There seems to have been sufficient demand stagnation due to the higher price over the last couple of years for this not to expose possibly constrained supply. That is unlikely to be the case by late summer 2007 - demand projections suggest we'll need 86 mbpd average global production, every month, an amount we have never produced in one month so far.
It is unlikely that a global 86 mbpd can be produced while KSA is producing below 8 mbpd. I think we will probably have a pretty clear idea of the accuracy of your thesis before the end of 2007, highly probably by end of 2008 Quarter 1.
Stuart,
Brilliant work. This is what I teach my students: the careful step by step analysis of an issue and an evidence-backed argument that addresses as many of the counterarguments as possible.
You did a very, very good job, not only writing about the issue but maintaining internal cohesion where you explain the significance of charts and how they relate to your local and global arguments. Well done.
I also noticed you wanted to warn off the doomers, let them know that you were still at heart a technological cornucopian. I would say that if you applied the same sort of logic you use in your article to the holistically integrated resource equation, you would perhaps see that a world at 6.8 billion people is only a brief pinnacle soon to topple and never to rise again. The "pure" scientists will only look in the rearview mirror. They could care less about the future. To them planning for a post-carbon world cannot be done because they don't know if we'll run out of oil on a Tuesday or a Friday, something that they aparently think is very important. The best analogy I can think of is the "pure" scientist on the Titanic who sees the iceberg but declines to divert the ship because there is a billion to one chance that the iceberg is harmless because it is either hollow, made of soft-serve ice cream, soon to be transported to Vega due to a water shortage, or it is a fake iceberg created by the Titanic's competitors. The scientist also notes that no one has actually tested this ship, this particular ship, by ramming it against an iceberg exactly like this iceberg and therefore, we cannot know what will happen. Once the ship hits and starts to list, the scientist refuses to abandon ship because there is a slight chance that a gigantic herd of blue whales will swim beneath the ship, prop it up upon their backs and haul it to safety.
Yup, wouldn't want to actually use science to predict and prevent disaster. As I've noted before, the entire crisis can be evaluated using deductive logic. We live on a sphere in space, therefore, EVERYTHING is limited. Not just oil.
If you, Stuart, were to use your skills with which you look at this admittedly very important subsidiary element and see the larger equation, and then extend your thinking as you do with several charts above, you will see that 6.8 billion people are too much and that, with fluctuation, it will decline. Some would argue that we will swoon into a controlled decline with natural death rates slowly bringing us down to the probable optimal population of around two billion, if we use this or that technology. To anyone who has studied population, very few societies have declined without an extreme incident spurring the decline. The few societies that are declining without an emergency are those that are highly technologically advanced. (Those people who believe that making everyone similarly techno advanced is the solution to overpopulation are simply living in bizarro world.) Population will continue to grow until it reaches that Malthusian flexion point that changes everything. That point may be war, disease, starvation, ecological collapse, or political willpower. Fossil sunlight will be going away. We have X amount left with which to back ourselves away from the cliff. Anyone who does not believe in infinite growth on a finite planet must inherently believe that some sort of integrated ecological stasis must be achieved, or nature will do it for us.
The believers in infinite growth, including who refuse to admit this concept into their thinking, are exactly like those who believe in magic. Where is the science? Where is the careful thinking? You cannnot escape the very, very elemental physics of my argument no matter what techno fix you think you have come up with. In other words, tell it to the perptual motion machine.
You can treat the earth as a closed system for most short-term projections (although you have to include sunlight as an exogenous input, at the very least), but for very long-term analysis that doesn't seem like a valid assumption. We could harvest resources from the near solar system without violating the Second Law, in the event that we survive long enough.
And while there have been localized catastrophes in our past, the long-term view shows that we have been the most successful higher-order animal in all of history, successfully adapting physically, and then socially + economically, to great extremes of climate, available resources, and social disorder. The current economic system, while highly inter-dependent (and possibly leveraged more than is wise), is also the most successful system for deploying capital ever devised.
The peak oil transition may well prove to be catastrophic, and climate change will defintely be cataclysmic (on a long enough timescale, with or without changes in carbon emissions). But I don't think you should count out homo sapiens just yet. If it is possible to adapt, evidence suggests that we will...
(I am as much a catastrophist as any on the board, but I try to temper my morbid fascination on disaster with skepticism & scientific objectivity...)
CW
Global peak: 2007 - 2010
Global decline rate, Post peak: 2%
Economic response: Global recession, ~5 years
So lets say in a thousand years all is fine and utopia is here (due to space travel to other solar systems????!!!!).
So what about our economy, and my job, the next 50 years?
And my son?
And people in developing countries who dont have a PC with internet connection to TOD?
Come on man, lets talk about the next 5, 20 and 50 years, where we have the smallest clue at least of what might happen.
All the rest is waste of time or SF.
Except the argument that "it will be utopia in 1000 years time if we suffer now". I just dont buy that.
As Keynes said - 'in the long run, we're all dead.'
I think this comment is why I've started reading more about species extinction, destruction of arable land, water and air pollution, loss of biodiversity, and overshoot and collapse. IMO, there's really very little else one would need to learn besides the principles of exponential growth laid out in Dr. Bartlett's presentation, but there are, apparently, several authors who are worth reading: E.O.Wilson, Meadows, the Ehrlichs. I have to part company with most of these folks who insist (is it obligatory or something?) that we can do something in time, when it's apparent that it relatively little is being done, and certainly nothing on the scale of what needs to happen. See the dithering over global heating for a fine example.
There is a great classic novel called "Earth Abides" by George R Stewart. In it, human population is nearly wiped out by a pandemic. He then relates how succesive species explode in population, peak as their food supply peaks, then crash; the following species having used the the previous species as a food source following the same crash and so on. Like I say, a great novel about a man critically observing what happens longitudinally to a human depopulated world.(Yes, I know it's exactly opposite of what we're facing; OR IS IT?)
"Population will continue to grow until it reaches that Malthusian flexion point that changes everything. That point may be war, disease, starvation, ecological collapse, or political willpower."
When you say Political Willpower do you mean bumping off some so that others may survive?
My final serious comment tonight - got to off to the caves and munch on some Hobbits:
I just want to draw attention to the fact that it is possible to draw different conclusions looking at the same charts. To my mind there is a strong correlation between drops in oil price, drops in demand and drops in Saudi production.
The problem with correlating production with the price signals is there is variable and extremely difficult to quantify speculation component in the price. I see this as the so-called fear premium.
Is there anywhere where one can get a handle on the amount of Saudi production/exports that is contractual, i.e., well defined price over some time horizon and the amount that appears on the spot market?
Euan, extend the price chart out to today. Oil closed today at $61.64. That's up about $10 from where the above chart ends. If your theory is correct then Saudi production should be headed back up.
It isn't.
Ron Patterson
Not quite right Ron. My theory is that recent drops in Saudi production are voluntary. The fact that global demand, supply from other sources and speculation have moved the oil price short term without moving Saudi production has no bearing on my theory.
I dont get that EM?
"The fact that global demand, supply from other sources and speculation have moved the oil price short term without moving Saudi production has no bearing on my theory."
WHAT IS THEN THE CRITERION that the SAudi use to keep stable?
If not price?
Some inventories? Which?
Global economy (demand)? Whihc?
...
I dont buy your argument EM. It makes not sense to me? Care to elaborate?
If you want to argue that the first trough is on account of a price drop, then why did production flatten out at 9.5Mb/d, instead of continuing higher as prices rose for the following twelve months? Do you think 9.5 was, in fact, their max production? If this is the case, then the first trough was clearly bumped up by qatif, and the trough itself is logically depletion.
If 9.5 is max production, why did it decline down to 9.1 as prices continued to climb? Note that haradh was only able to raise production to 9.2mb/d, and that for only a month. Note they were on record as saying price was too high. If they are following price signals, the only basis for reduction would be that, at least to aug 06, they could not pump more than they did.
BTW, if their capacity was just 9.4Mb/d, then they could have sold an additional 30Mb in 06 up to the early aug peak price date, bringing in maybe $1.5B... useful, even for sa, considering their enormous handouts.
The Saudis have admitted that their 2005 production rate of 9.6 mbpd was virtually at their maximum capacity.
Hey, I want some cherries too!
You take the price curve with about half a dozen bigger spikes and even more little ones and line up the minority that support your case, and ignore the majority that contradict it. Not to mention the fact that the global overall shape doesn't match at all.
Why don't you go ahead and calculate the R^2 of those two series :-)
I think that's a pretty important observation - trying to understand Saudi Arabia in isolation of the remainder of OPEC (at least those members still exporting oil) and what is going on in the rest of the world gets kind of futile.
Global demand for oil was flat in 2006. Production rising else where, in excess of natural decline else where, meant that someone had to cut or the price would have got dumped - IMVVHO.
When the SA production started to decline, they were stating that it was because they didn't have a market for the oil. This confused me somewhat because at the time other producers were still increasing and selling their production. Granted inventories were high so demand at the price might have been down some - but others were selling.
Then, SA stated they were voluntarily decreasing production to prevent the world from being over supplied. This is consistent with above, but the problem was that they steadily reduced production, apparently out of fear of oversupply, for months without asking for any OPEC quota reductions. In all other instances I can recall, no OPEC nation, certainly not SA, voluntarily took it upon itself to unilaterally reduce production to support prices for others. This is utterly inconsistent with any prior behavior or even self-interest. If they had plenty of oil to sell, they would want others to also reduce so they can keep selling plenty at high prices. Only later did they finally support an overall OPEC quota reduction - why? This has never been answered to my satisfaction and only makes sense if they were having enough problem in production that they wanted a way to reduce their production without creating a scene.
Data reports always talk of "demand", when what they mean is consumption. Note that consumption was above production in 2006, according to EIA reports. Maybe "demand" was down because supply couldn't provide any more?
However, you appear to have completely ignored Stuart's very detailed explanations (in both his posts) as to why the current declines appear, statistically, to be not voluntary. All you've done is state your belief and use two cherry picked data points to try and support a possible (but as yet unexplained) alternative reason.
Perhaps EIA is showing this, but most analysts use IEA figures and their website illustrates a 0.8 mb/d surplus of supply over demand in 2006.
As a long time TOD member, it should have become apparent to you that most inconsistencies in arguments at TOD are proved in the end to be based on faulty or untimely data from EIA.
Most of the successful debates are won by those quoting IEA stats or relying on those same stats as a foundation for their argument(s). If one has a good road map, one seldom gets lost.
The anti SA decline argument is easily supported and was forewarned in posts as early as October. The 35% crash in contract prices to $45 was only averted by KSA's forthright actions prior to OPEC intervention. KSA was clearly ahead of the curve because they saw their order volume dwindling.
Darwinian has stated this week that he believes all contracts occur in real time and subject to Spot. I recall several weeks ago as we watched in fascination as Hothgor gave Darwinian a tutorial on discounts after Darwinian's denial of their existence. Similarly, TOD members that do not realize that contracts are made weeks, months and years ahead are driving blind.
China is making these long term contracts as we speak. LNG contracts are typically for 10, 15 or 20 years. Some with sliding scale pricing. Some not.
To go OT for a bit, as the NIMBY phenom continues in the USA, other nations are taking advantage of long term LNG contracting. The USA and IOC's are unable to participate in most bidding rounds because they may not have the accepting terminals.
Prudent planning near me is resulting in negotiation/planning/construction of offshore infrastructure to take advantage of the unfortunate american situation.
Back to the debate, it is KSA's knowledge of upcoming seasonal demand via its sales network and pre-season heads-ups on call via IEA etc that gives it the ability to respond in kind with mystical accuracy.
January's soft landing at $45 is a case in point.
Freddy, you are up to your old tricks again, making up lies. I never said contracts occur in real time. What the hell would that mean, before the tanker was loaded or just after? Of course contracts for tanker delivery has to be made before the tanker is loaded and I never stated they were not.
However OPEC, and Saudi Arabia sets their price according to the price of oil at the time of the contract. And they set them according to the price, at the time, on the NYMEX, the IPE and the SIMEX, (Singapore International Monetary Exchange).
http://www.opec.org/library/FAQs/aboutOPEC/q20.htm
You need to learn how to tell the truth Freddy and just stop making up crap. Any fool knows Saudi does not set the price of oil years ahead of time. And you saying that they do just makes you look silly, not an intelligent person in the know, which is the image you are trying to potray.
There is an old saying: "It is better to keep your mouth shut and be thought a fool than to open it and remove all doubt." You would do wise Freddy to remember those words.
Ron Patterson
To your point, I watched Lee Raymond on CSPAN testifying to congress about how the Saudis price their oil. He essentially said that Exxon calls them up and the price they state is not exactly NYMEX but is heavily influenced by that price.
Just to be clear (and the OPEC web-page on pricing doesn't clarify this), you're stating that KSA oil contracts do not have fixed prices, but rather have variable rates that float roughly corresponding to NYMEX?
There's no a priori reason for it to be one or the other - for instance, AFAIK coal contract prices generally are fixed, for a period of some years.
LastViking, Stuart's analysis doesn't rely on EIA data alone, it uses averages of 4 data sources. Also it does not rely on the EIA data and forecast showing an excess of consumption over supply in 2006 and 2007 (with a slight supply excess in 2008). IEA data is revised for many months, so it is difficult to use it solely.
And you are doing this for free? We who depend on TOD for information just like this are in your debt for the incredible amount of meticulous work and expertise you have donated to our education. Thank you, Stuart!
Euan too. His posts provide really useful perspective.
The WSJ Energy Blog Today Once again Has Noted Staniford, and Earmarked This Post.
_________________________________________________________
March 8, 2007, 1:51 pm
Oil Demand Growth to Double; Can OPEC Meet It?
Posted by WSJ.com Staff
oilwell
A new Reuters poll finds energy analysts expect global oil-demand growth to surge this year to an additional 1.39 million barrels a day from growth of 800,000 bpd in 2006. Correction: An earlier version of this post said global demand would grow to 1.39 million barrels a day — which is obviously wrong.
“OPEC is going to have to boost output in the second half of the year, [as] non-OPEC supply growth will be unable to meet global demand,” Mike Wittner, analyst at investment bank Calyon, told Reuters.
But does OPEC have enough spare capacity to meet extra demand? In a new post at The Oil Drum, consultant Stuart Staniford suggests OPEC’s biggest producer, Saudi Arabia may be incapable of raising its production any time soon. He points out that, since 2004, Saudi production has not typically risen at moments when it would have behooved the Saudis and OPEC to raise production to keep prices at a reasonable level and keep customers from fleeing.
“If the Saudis had spare capacity, we’d expect the production profile to show some intentionality around managing the price in some way that they perceive to benefit them,” he writes. “But that’s not what we’ve got.”
– Mark Gongloff
Comments (6) | Permalink | Trackbacks
Save & Share: Share on Facebook | Del.icio.us | Digg this | Email This
http://blogs.wsj.com/energy/2007/03/08/oil-demand-to-double-can-opec-mee...
______________________________________________________________
Gregor
PS: The WSJ is actually now linking to its Energy blog from the Front Page on its website, thus pointing readers to the Staniford-related blog-post:
• Energy Roundup: Is OPEC's Well Dry?
http://online.wsj.com/home/us
Stuart,
Great work.
It's a shame your brain won't let you digest the implications of your analysis. Your current location (SF?) is screwed and I do mean screwed. As is mine, which is only an hour north of you. But I'm now looking for a lifeboat community as fast as I can, partly due to this article and the other one. I had hoped we had 5 plus years till this unfolded although I think deep down I knew we probably didn't.
I supposse from political and psychological perspective you're better off not understanding the implications of this.
As far as our ability to adapt, I think you GREATLY underestimate the impact of even a 2% yearly shortfall year in and year out for an economy and monetyar system accustommed - actually dependent - on about a 2-4% increase each yar.
And whatever the depletion rate (say optimstically 2%) it's hard to believe the shortfall in oil supply won't be aggravated by war, terrorism, more radical weather patterns, etc.
I know, I know. "Matt you're a doomer, people will adapt, don't underestimate our ability to come together. . ." Whatever.
I agree with your sentiment, Chimp, and some of your analysis, but...
I think our energy consumption and economic system can mostly cope with a 2% annual decline in global oil production starting now - for a while at least. We could probably manage fairly well for 2 or 3 years just by conserving fairly painlessly. But we probably won't cope too well, geopolitical silliness is highly likely to intervene, even if it doesn't there are likely to be seriously weird and nasty adverse effects on our economic systems.
It might be relatively OK for a while but that depends on us walking a high and narrow tightrope, unwise to bet on not falling off. Everything happens faster now, the leverage, immediacy, co-dependence; almost everything could change for those living 'normal' lives within days rather than months. We haven't done this experiment before (on this scale at least) so it is sensible to take a cautionary view.
Now is a wise time to bail out, there is enough writing on the wall, and bailing out won't get any easier than now, I am, this is a part:
http://www.dylan.org.uk/utopia/
We've gotten car trips down to an absolute minimum. I fill my 90 VW once every two weeks (about 11 gallons US). We have absolutely eschewed restaurants, movies, any other outings that aren't necessary.
We manage to live below the official "poverty" level. Light bill down to below $40/month. No credit card balances carried beyond a month. No major debts.
So why am I on this computer? It belongs to a housemate who is away on a job. He's a high-flying computer programmer who seems to "get" peak oil, then goes off to Europe and doesn't make plans.
Aside from my students in my writing class, and certain friends, I no longer discuss peak oil. I'm in absolute shock at how immune and immobile the culture has been since I learned about this in 2003.
We've order more seeds than we did last year, and I'm restarting my beehives. My partner has decided to go into semi-retirement because he's not expecting any construction booms this summer. I'm contracted to teach through 2007, so we'll have some income when the decline/"geopolitical above-ground" event knocks us to the ground.
Folks,
Let's be honest with ourselves. we're primates at heart. We're a violent species when it comes to intertribal resource issues. (intra-tribal we're great at cooperation and sharing but NOT inter-tribal) And we've got 20,000 nuclear bombs at our disposal. I seriously doubt we will make it even halfway down the downslope of the per-capita energy production curve without those being used.
Yeah, yeah I know. "More extreme and unfounded doomerism . . ."
How about "More grossly oversimplified evolutionary biology". Human tribes have been peacefully trading with each other for millenia, as well as sometimes fighting with each other. It isn't deterministic which we do. Even within our primate relatives, there are massive differences between, eg, bonobos and chimps in how they treat neighboring groups, suggesting that a simplistic extrapolation from either to humans is fraught with problems.
STuart,
Do you not see what is going on in the world? The worlds 2-3 most powerful warrior tribes find themselves fighting over the world's 2 key resources: energy and water. (the 2 primary tribes being the Arabic and the Anglo-American or Judeo-Christian tribes.)
That war is being fought, primarily, right in the general neighborhood of the country whose oil production is "nosediving into the desert." What determinations seem like they've been made to you? To me it seems we're all damn determined to go to war to fight over whatever oil's left in that desert.
How much money is being spent on fighting over what's left? On encouraging people to use as much as possible? And how much is being used to come up with intelligent responses?
"Human tribes have been peacefully trading with each other for millenia"
How in the world can you equate the interaction of the enormous nation-states of today with the interaction of the comparatively miniscule tribes of our EEA (Environment of Evolutionary Adaptedness)? The main cause of problems in this world is clearly that homo sapiens are endowed with a stone-age brain to wield incredibly complex and dangerous technologies (which are used to pillage resources, grow population exponentially). All the evidence available seems to show that once humans surpass the population levels of our evolutionary past ("human tribes"), war becomes more likely, especially when resources are declining. Considering the history of violence of the last 100 years in an environment of INCREASING resource usage, how in the hell are nations going to suddenly get all friendly and sharing when as Energy Descent crashes the exponential growth party?
Yes, humans are naturally very cooperative when their bellies are full and when they know everyone in their community's face, but after that all bets are off.
I appreciate your work here, but it seems to me in this case that your optimism has outgrown the evidence. (Insert Albert Bartlett link here.:)
Actually, the % of the population killed in war was much lower in the 20th century than in previous centuries, and much lower than is seen in hunting gathering cultures.
The fact that we are acutely aware of the deaths is actually a sign of rising consciousness, and reduced tolerance of killing. A sign of progress.
Take a look at the old Testament. The kind of casual slaughter documented there (whole cities razed and populations murdered, man, woman & child) was routine at the time. We've come a long way, and the 21st century promises to be much better still.
Consider: US deaths in the current Iraq war are only around 3,000, and we consider that way too high.
According to Richard Heinberg, the murder rate in HG societies was something like 5 times what the murder rate is in the U.S. is currently. Like I said we're a violent species!
I can dig up the link/reference if anybody really wants.
Hello All, I'm new here and am thoroughly enjoying reading the well thought out arguments (and rebuttals to those less well thought out).
I am an evolutionary biologist and the brief discussion about cooperation and violence prompted me to register to make this comment (hopefully more in the future if they can be helpful).
veganmaster makes a very good point with, "Yes, humans are naturally very cooperative when their bellies are full and when they know everyone in their community's face, but after that all bets are off." This position is largely supported by ethological and ecological studies on the two chimpanzee species, the bonobo chimpanzee (Pan paniscus) and the common chimpanzee (Pan troglodytes). Bonobos are almost entirely friendly and cooperative while the common chimp is about a violent as we are in similar situations.
Probably the most significant evolutionary pressure difference between the two species is that food/resources are more consistently available to bonobos than to the common species resulting in sporadic competition between common chimps. This competition extend to sexual competition which has the interesting morphological consequence that common chimps (and humans who have a similar evolutionary history) are sexually dimorphic with respect to size - males compete with each other for mates so size is important for dominance over rivals; bonobos are extremely promiscuous - this promiscuity is most likely a consequence of reduced food resource competition (there is argument about whether this is a direct consequence or a result of a relative shift in competition for food relative to mates).
I'd say that from comparative studies of Pan and Homo that humans, with similar competition/cooperation behaviours to common chimps are likely not to cooperate when resources become limiting. Though what constitutes limiting is probably quite elastic for humans; people (at least in Australia) were very community oriented during the Great Depression when resources were arguably limiting. This is what gives me cause for hope - but I still make sure I'm a happy member of my local area who says hello to people in the street (trying to build a sense of community can't hurt).
cheers
Dan
I can't say you're not right, but I believe it will be limited to tactical nukes. There is no rationale to using strategic nukes anymore.
Really? I don't think you've thought it through.
Peak oil is as much about consumption as it is about production. Reduce consumption by 20% and everyone is happy for a few years. There are many mechanisms for achieving this (and I'll bet that most will be tried). However 'nuking them back to the stone age' on a pretext and providing they can't fight back, is a pretty efficient one. Instant demand reduction. You wouldn't even have to use too many nukes since most economies are none to steady anyway and a good EMP burst would do for most countries.
Note, if you play that scenario forward, its inescapable that the most likely and efficient country to be attacked is the US - deterrent or no.
Scary, but you make a good point. Whatever happened with neutron bombs that killed the people but left the infrastructure intact? Wouldn't a bioweapon be more efficient? Not easily tracked back to the source? According to the above logic, wouldn't it be better to do it to your own masses, thus improving your own position? Then you could target the specific populations that best increased your profitability(for lack of a better word).Like pruning a plant. Wouldn't a good rationalization be that if you can no longer feed them and they are going to starve to death anyway, wouldn't it be more humane, and better for everyone else? It would also relieve pressures that might otherwise lead to a collapse of your society, wealth or power.
I grok that, babe, but it ain't gonna stop me from dumbing down my lifestyle to the max.
Dylan,
I'm researching some places to go that I think will miss the worst of what is coming. I'll be frank with you: anytime I see somebody or an organization use the word "Utopia" to describe what they're trying to do community wise I don't even bother looking further. Yeah, I know: "insert reason why we're different then those other places that use the word 'utopia' here." It's almost like once a group uses that word they[re doomed to fail at whatever it is they're hoping to accomplish.
It's actually a frustration of mine I've run into researching lifeboats. Most of the "communities" preparing for bad times or getting themselves off-grid are filled with either jew-hating survivalists waiting for the "rapture" or dope-smoking hippies waiting for the "great turning". The ones that use words like "utopia" tend to fall into the later category. I'm exaggerating a bit but not by much and anybody whose looked into these things can probably vouch for the general accuracy of the point I'm trying to make.
As far as your community, according to your site you are the sole financier. Guests don't need to invest any money? Wow sounds great . . . . except my spidey sense tells me the reality is you don't want them investing any money. Allowing them to invest would give them some control. So long as you're the sole investor/financier you get to have the final say when the "consenus decision making process' breaks down, as it inevitably will with these arrangements.
What the "guests don't need to invest any money bit" really means is that when the shit hits the fan you're going to be the dictator and the guests will be your peasants. (and if not you then your heirs) I'm sure that's not what you are consciously intending at the moment but for all intents and purposes, that's what will end up happening in practice.
That sounds harsher than it should and makes me sound like an ass. Hopefully folks will understand my general point. I'm at my wit's end here with this sort of thinly veiled crap that gets tossed at me so regularly. Maybe your situation is an exception . . . .
You do have some nice Yurts set up there. Maybe a post on how those are working for you would be in order in an appropriate thread. I was in a Yurt at a solar festival and thought to msyelf "why would anybody want a "regular" home when they can have a series of these?" they're so cool.
mispost
choose the hippies. you'll have sex and drugs before Death.
Chimp, I'm not Dylan and wouldn't have used the word Utopia. You missed the main points: it is not an attempt to found a permanent community, it's a limited 18 months experiment and the population will be rotating with visits limited to at most 3 months per person. It is highly unlikely that it will end up like anything you suggest. It's not a lifeboat, it is a temporary experiment.
It is an opportunity for people to re-skill themselves in important basic tasks and learn from others. I suppose the two main aspects of the experiment are: how well will it achieve self-sustainability; how the social and decision making rules will evolve in a small, revolving community. I do share some of your skepticism towards many lifeboat communities, too many of them have specific ideologies or religions at their core.
AGric
My bad. Flew off at the handle there.
Are you in the U.K.?
No prob. Yes, I'm in UK, it's probably no better nor worse than most places to sit things out. I don't expect any significant near term collapse even if we are past peak now - these things typically impact as a series of stepped declines. But what is happening and is likely to happen should be a lot clearer in a couple of years, I'm planning to spend that time reskilling further and see where things are at then before making too serious a leap.
I'm afraid we're not going to get even the 2-3 years(though I too had been figuring 5 and hoping for 10) Once it's out of the bag, the pretenses will be dropped and it will be like 3 large dogs fighting over a single bone. It also is appearing that China and Russia have come to some kind of agreement to muscle out the US before deciding the issue between themselves. Also, NG supplies in NA this next winter could run out before the winter is over.
There are several issues with a 2% decline in oil:
1. A 2% decline in oil worldwide will translate into a 3% or more decline in oil supplies available to oil importers, because exporters will satisfy their own needs first and because of declining EROEI (more fuel is being used in oil production).
2. The US is accustomed to a 5% annual increase in oil imports, to offset its own decline rate, so we are talking about a very large change- from a 5% annual incease in imports to a -3% or greater decline in oil imports.
3. If countries realize oil is declining in availability, they are likly to hoard it, or sell it to countries that are their "freinds".
4. A nominal 2% per year decline in oil is worrying because of the US's huge amount if debt. We need rapid growth for companies and indiviuals to pay back their debt with interest. With a 2% nominal decline, growth is likely to be flat, or even declining. It seems unlikely that the banking system and insurance companies can deal with a high rate of defaults.
5, A decline in natural gas supplies in North America is expected in virtually the same time frame as oil. Oil comprises about 40% of the US's energy use; natural gas about 20%. With 60% of energy supplies declining, it is difficult to make up the shortfall from the remaining sources (mainly coal and nuclear), since they comprise only 40% of the total. These sources also have other issues - coal exacerbates global warming; nuclear has a waste diposal issues. Neither directly substitutes for oil or natural gas.
Gail as usual you detail the problems well. I think a general way of stating the problem with a 2% decline is eventually a critical mass of people will realise this decline is permanent and only to increase and alternative energies are not going to allow us to continue our way of life. This simple difference in perception- scarcity ( actually a fact re oil)-will bring on the grabs for oil/ (real) material wealth ,etc It is here already- some- with governments(degrees of denial/lack knowledge), just not enough people in general yet..
Creg: Don't underestimate the MSM. They have exceptional power in a country where maybe 20% of the population believes the universe was created approx 4000-6000 years ago.
Ummm, that 20% is more like 40-50%:
http://people-press.org/commentary/display.php3?AnalysisID=118
Sea: I first typed in 40% (just a guess) and then lowered it to 20% since I was guessing anyway-wanted to give the good old USA the benefit of the doubt. Anyway you slice it, an awful lot of brain dead.
Actually that's Bushes 36% power base. Any Republicans out there that believe in Evolution? Could we have a show of hands? Thought so.
It scares me to think about it, actually: a good part of the population believes in fantasies and supernatural beings...
Yeah-I could see us believing via misinformation -as soon as this war/group of hoarders etc. are brought to justice there will be plenty of oil. We'll probably be diverted for some time that it is temporary. I think there will come a day(s) in stock markets- when perception will bring them down; however it may appear to be war, etc. instead of oil depletion. thanks.
Maybe you are saying we may not know the Depletion truth for a long time?
Creg: Yep. Read WT's posts. They are still talking about maybe Texas rebounding (I think they are 33 years post peak). IMO, this global oil depletion story is such a big one that the full power of the MSM will be brought to bear (which will be something to see).
I'm almost glad for the propaganda machine at this point. Buys us some time to figure what if anything we can do as individuals and families.
Chimp:Me too.
Matt, what are you thinking?
Individual survival in the face of collective disaster is adolescent fantasy.
If there are no provisions for organized, collective survival on the order of at least a 100 healthy adults in thier prime, I can't fathom how individuals and their families have a prayer of securing food, water, shelter, personal security in the midst of a desparate population, eventually with organized mauraders out to get what they can.
Argentina's experience (especially in rural areas) in the immediate aftermath of their economic meltdown in 2001 should sober you up quickly.
I agree. These lifeboat fantasies are unrealistic and allow people to not think about making hard choices.
If the suburbs are no longer viable, it is not going to be in favor of bucolic rural life. Not at, least until after a huge die-off w/ resource wars, which none of us may survive. Much of the third world is already coming to be dominated by squalid, sprawling megacities which will only increase in density as the supply of oil declines. Subsistence agriculture is not going to feed the populations we have now.
I am particularly concerned about the people who think there is nothing we can or should do to try to avoid this fate. One can imagine a somewhat benign end state of small villages and a simpler life, but the transition would be unacceptably catastrophic. I think there are ways we can avoid it but it may mean that many people with this mindset will have to swallow a future that they do not now favor, such as one with a lot of nuclear reactors.
WeatherGlass wrote:
Sterling wrote:
For 99.9% of us, both of you are right.
However, I am scouting a location I think may miss the worse of it: low populaton density, lots of food, away from the fallout patterns and extremely isolated. On paper it might make it. I have some money saved so I'm going to check it out in about a month.
But you are right: most people - including those of us posting here and elsewhere in the PO sphere - are going to be dead meat. That includes me if I don't figure out something fast. The NA carrying capcity sans fossil fuels is 100 million. That means 200 million plus are going to die and that's if we do everything right which of course we are not doing.
People will say "but there is still lots of oil left, coal, etc. Maybe we can use nuclear power . . . We might be able to make do." I wish. What will happen is the positive feedback loops from climate change, economic disintegration and social chaos will within a few short years be so disastorous that most of that oil and coal left in the ground will never make it out. Those feedback loops will create an economic and social situation where the construction of any significant number of nuke plants is simply impossible.
And this is all before we even factor in nuclear war.
In the cities, when food shipments cease, people will begin eating people. Others will believe people in rural areas "have lots of food" and are "keeping it from them".
Rural communities will set up roadblocks and shoot on sight. It will get very ugly. Best bet for survival initially will be small groups of friends in rural wilderness areas "off the beaten path" away from towns and major highways. First rule of survival after food and shelter will be avoid others.
the place I'm scouting is so isolated nobody will be getting into or out of it once oil supply breaks down.
some people will say "but with such an isolated area you won't recieve any shipments . . . the cities might still get some shipments of fuel, medicine, food, etc."
I doubt it = at least to any significant degree - due to the PFLs I've discussed. I think if you can find an isolated place that is not already over carrying-capacity that's your best bet. PRobably less then 20 places like that worldwide.
Obviously, the implications of this are pretty upsetting to think about. Which is why I'm (yet again) off to consume enough coffee that things start looking happy-happy and then I'm going to workout and forget about this for the rest of the weekend.
That is too black or white. We are not facing an end of fossil fuels. We are facing a decline. We still have a large supply of low grade hydrocarbons. We have an essentially unlimited supply of fission fuel (one trillion recoverable tons of Uranium) that could be used in very high EROI plants to transform these low grade hydrocarbons into chemicals, fertilizers and transportation fuels. And we could build a potentially large fleet of ultra light, battery and hybrid vehicles that use but a small fraction of the fuel per vehicle that the current fleet does.
Of course society has to change. We have to conserve, stop using coal and develop every possible alternative as quickly are possible. But we do not necessarily have to have a massive die-off. Any realistic scenario for a massive short term die-off would be such a tremendous catastrophe for the world that no one should welcome it.
We have a choice. We can mobilize the energies and genius of the world and maybe dodge the catastrophe. We might not succeed but it will be much better to die trying than to give in to the holocaust.
Dude,
You clearly don't understand positive feedback loops. (PFLs) The pfl's from declining energy supply, economic disintegration, climate change, bad political decisions, war, etc. are going to produce a progressively worse clusterfuck that is going to keep a lot if not the majority those low grade hydrocarbons, uranium, etc. . . in the ground.
Example: mexico's oil production drops which leads to social chaos in mexico leading to further falls in production.
Then, the immigrants flood into southern and central California, creating more economic and social chaos, further stress on the electric grid, etc.
This happens just as KSA's oil production is falling as STuart has explained.
Rolling blackouts or fuel rationing/hoarding are insituted and at first they don't seem so bad. But pretty soon criminals and desperate people figure out how to take advantage of the blackouts and fuel shortages. . . so each one gets worse and worse and worse . . . .
You really think we're going to be buidling a fleet of brand new high tech cars that will at best put things off by a couple years in this environment? Come on. With people saving no money and their home prices falling like rocks where the hell are people going to get the money to even buy some brand news $30,000 plugh in hybird super duper thing-a-mah-jikey?
[blockquote]
Any realistic scenario for a massive short term die-off would be such a tremendous catastrophe for the world that no one should welcome it.
[/blockquote]
Nobody here is welcoming a die-off. Implying that I am welcoming it has more to do with your inability to downplay or disprove the scenario I foresee than anything else.
Strawman. I know of almost no one who would welcome this scenario, including myself. But what we have here is simply a difference of opinion. Matt (The Chimp) believes that the combined storm of forces will be unstoppable by global civilization and that the best he can hope for is survival at some lower level of organization. You, however, appear to believe that we can solve all of this at our current level of organization and maintain that level of complexity at the same time.
You are entitled to this opinion but history is not kind to such opinions. You can, of course, point out that we've never been in this specific situation previously and that's true. But homo sapiens has depleted other large regional resource basins before and essentially destroyed them leading to the collapse of the civilization within that region. Mesopotamia, Egypt, sub-Saharan Africa, Greece, even Rome all suffered from resource depletion issues. But none of them suffered from as many resource issues as we have right now on the scale that we have right now. In other words, the current global civilization encompasses more and bigger problems than homo sapiens has ever faced before. Almost never has homo sapiens successfully weathered such resource storms in the past with existing social structures. On what basis do you assume that we will suddenly, miraculously even, do what none of our predecessors ever did while facing problems that dwarf any that they faced?
Believe me, I do not want to see what I believe is coming but I am also not going to kid myself. The train is racing ahead full speed on a track that goes nowhere, no one is at the controls, and there is no spiderman in real life to rescue this runaway train. Your choice is simple - get off now while you have a chance or try to stop the train before it crashes.
You have chosen to try to stop the train. I wish you and everyone who has made that choice the best of luck in your efforts. You will need it. I truly do not think you really understand the scope of your problem. It's not just peak oil at all. Peak oil is one tiny part of the overall mess. But march on and good luck!
Ghawar Is Dying
The greatest shortcoming of the human race is our inability to understand the exponential function. - Dr. Albert Bartlett
Look at the 100 Years War in Europe. Agriculture switched to below ground crops as they could not be burned or easily pillaged.
High oil prices are good for the dollar as long as other importing countries must obtain increasing amounts of dollars to pay for their oil. China, for example, must run a $150M surplus every day ($60B/y) simply to pay for their oil imports, and they also import many other commodities. Japan is similar. From may thru oct, during the period when oil went to a record, the dollar was steady, not falling until nov, in tardy sympathy with oil. Dollar holders are uneasy, but as long as these nations can exchange dollars for oil, they will not bolt because of their continuing need for oil.
The us has enormous capacity to reduce oil consumption without a large change in standard of living. Most oil goes for motor fuels, and car pooling will become popular when price is high enough, say 150/b. Eventually, prius type vehicles will predominate, followed by plug in hybrids. Of course there will be pain... detroit will go under. However, the recession will also help reduce consumption during the transition. and, there will be bright spots, eg our own oil patch, which is fairly extensive.
The Editors and Staff of The Oil Drum looking for a sign of peak oil in the desert
To summarise some of the points I've made in this thread:
A combination of Iraqi and Azeri production amounting some 1.4 million barrels per day preceded / coincided with falls in Saudi production. Somewhat miraculously maintaining a global balance of supply and demand.
Stuart's model of Saudi production being driven by supply side constraints since late 2004 is not robust in my opinion. The Qatif - Abu Sa'fah data don't really fit at all - and here Stuart seems to agree that strained production may have been rested - is it still resting? The Haradh feature is in my opinion also ambiguous.
The declines implied by the structure of the Saudi production profiles are very high - just under 17% - and are in my opinion too high to be considered natural - leaving the conclusion that they are voluntary. Once you concede that some production is withheld then you have to ask how much? - only the Saudis know the answer to that.
Trying to match Saudi production with changes in price, inventories etc is fraught with difficulty as there are time lags and events going on else where that play a significant roll.
For those not familiar with the scene in my picture it is from the Monty Python film Life of Brian where the discovery of sandal was interpretted as a sign that Brian was the Messiah. http://en.wikipedia.org/wiki/Monty_Python's_Life_of_Brian
One of my favorite movies. However, I'm now "out of the picture".
I will just re-post this excerpt from my story Angola Joins OPEC, and then go away.
alluding to the move to ramp up output in 2004 after the
aborted cut. "People don't know the trouble we go to, to
balance the market," Mr. [Ali al-] Naimi said. "Without us,
the oil market would be chaotic."
From OPEC's Cut Aims to Prop Up Prices
Didn't mean to interrupt, everyone can just go on with the "End of the World" talk as if I had said nothing at all.
The only production data we have for Texas are annual.
So, comparing apples to apples--looking at average production for 2006 versus 2005--the year over year Saudi decline rate was 4.3% (EIA, C+C).
This is quite close to the long term decline rate in Texas production, about 4%.
I seem to recall that they already thought he was the Messiah, and that this was a precious relic... btw, did you see the discovery channel docudrama, 'lost tomb of jesus'? We've got the dna, can cloning be far behind?
Since most others seems to have peeked they probably are at the correct place. They have not found anything that convince me but the price is still high and i have not heard about anything that will make it come down.
Hi Stuart,
Very thorough analysis!!!
I agree with you that Saudi Arabia is probably supply constrained and is not a swing producer now. Consequently, my forecasts below assume that Saudi Arabia has no surplus production capacity.
Your analysis of Saudi production rising when oil prices left the OPEC price band is very significant – it indicates that their production will continue to decline from their recent 2005 peak of 9.5 Mb/d. It also shows that if Saudi does have surplus capacity, it is likely to be at most 1 Mb/d rather than about 2 Mb/d.
Saudi Arabia’s future production volumes of crude oil/lease condensate (C&C) and natural gas liquids (NGLs) are critical to the timing of peak oil and the associated price shocks.
Peak Oil, Saudi Arabia & Upcoming Oil Price Shocks
The following graph forecasts a total liquids peak of 87.5 Mb/d on July 2009. The total liquids supply forecast is calculated from bottom up forecasts of C&C, NGLs, Ethanol/XTL and processing gains (see four graphs below). This peak could be earlier if Saudi’s Khursaniyah (0.50 Mb/d) and Shaybah I (0.25 Mb/d) do not deliver their promised production on time.
In the short term, the graph also shows that oil price shocks are likely to be greatest during 2007Q4/2008Q1 and 2008Q4/2009Q1.
The total liquids peak lags the C&C peak, 74.2 Mb/d on May 2005, by just over four years. C&C production is forecast to decline at -0.5%/yr.
NGLs are increasing, but not fast enough to offset C&C decline. The NGL increase assumes that Saudi’s Khursaniyah NGL (0.25 Mb/d) and Hawiyah NGL (0.30 Mb/d) will deliver.
The production from ethanol and XTL is forecast to increase at a high rate but still not fast enough to offset C&C decline. XTL means biomass (BTL), coal (CTL) and gas (GTL) being converted into liquids. Ethanol/BTL production would be seriously threatened if government subsidies were removed.
This last graph shows forecast processing gains which could be called double counting but production is measured in volume not energy. Both IEA and EIA include this item to measure total liquids.
1/3 of ethanol production should be deducted because ethanol's energy content is lower, so total liquids should be shown as 350k/d lower than actual. This has notthing to do with EROEI, or how much diesel is used in process or transport, simply trying to get all liquids on an equal energy content footing. If this correction was included, total liquids would be slightly declining instead of slightly rising.
Meanwhile, I seriously doubt projected increases; corn is now up to $4/bushel, and farmers can now get more for the corn than for the ethanol. FOr production to increase, the subsidy must increase.
I agree with robert that stocks matter... the days of supply from eia in stuart's post shows that we are now substantially lower than at nearly any point over the past two years, and further that eia expects demand to exceed supply beginning around may/jun, leading to further sharp drawdowns thru year end. Naturally this will challenge sa, but ignoring this, the market will not be happy with declining stocks from this point, and imo the stage is well set for sharp price increases beginning no later than mid year. WIth china still booming, and us expanding consumption, imo we will see record prices this year, possibly endangering robert's bet. BTW, are you using opec basket? NYMEX peaked at 78.
And contract held at $69.
Yes, Stuart used hybrid pricing, not Spot. He mentioned it early on but I forgot. I owe him an apology as I see one of my comments was inappropriate as it inferred he was using spot. Sorry.
As a member of Portland's Peak Oil Task Force, I'm proud to announce that Yesterday our city passed a resolution to reduce our Oil & Natural gas use by 50% by 2030.
While that is a great goal, my fear is that we will see economic collapse waaaaaaaaaaaaaaaay before that time and it won't matter. I would love to see more discussion on the Oil Drum regarding currency collapse and what that means.
www.lawnstogardens.com
"As a member of Portland's Peak Oil Task Force, I'm proud to announce that Yesterday our city passed a resolution to reduce our Oil & Natural gas use by 50% by 2030."
I think this is a fundamental misunderstanding of the peak oil issue. You won't have to even decide to reduce oil and natural gas usage. The most pro-suv anti-environmentalist city in the country will have reduced natural gas and oil usage by more than 50% whether they like it or not by 2030.
A better way to think about the peak oil issue is what can we do to keep the town running when our oil supplies get cut in half. How do we switch to electrified rail to deliver food to grocery stores? How do we prepare to re-localize agriculture?
You need to go out to the farmers, the agricultural suppliers, the retailers, the logistics people, the railroads, etc.
You don't tell them : "We don't like that you're using fossil fuels, they pollute and cause global warming, we want to tax you, shut you down, make you use ethanol, etc."
You tell them : "You're not going to be able to continue as a going concern due to astronomical oil prices in the near future if you don't take any steps you can think of to make your infrastructure function without oil and natural gas. We would like to help you write up contingency plans and help you develop ways to operate without oil and take appropriate legislative steps to grant easements and right of ways for your non-oil based logistics infrastructure.
POB, check out Matt Savinar's site (the link is at the top of the page on the right under "Peak Oil Primers"). Matt hosts discussions of macroeconomics/investment as well as many others.
Isn't it funny how the preparations of the most progressive, PO-aware city in the nation can be made to seem inadequate on this board? I happen to agree, they may be inadequate, but at least they are aware and trying to mitigate the problem, unlike my city, which is doing absolutely nothing (oh, wait, I forgot, free parking downtown for hybrids).
SD,
The people in Portland, I hate to say, are fooling themselves. They will do great, or at least better than most, when gas is $4-$5 a gallon. Some of the folks organizing might manage to gain a bit of control over the city council in the short term. That's too bad for them and their kin as this means they will probably be staying in Portland. "Hey look at the great things our city is doing!!!" Famous last words, unfortunately.
Once the REAL problems show up they are all crispy-fried bupkis:
http://www.ki4u.com/nuclearsurvival/states/or.htm
Look at the carryng capacity versus population density of california, oregon, etc. Even prior to the nuclear war any preps Portland makes will be wiped out by "the law of attraction." Not the law of attraction as explained in type "The Secret" but the real one people from the more devastated areas will simply migrate to Portland thereby overwhelming whatever preps they made.
Anybody on the PPO task force reading this: Could you:
1. list the preps you've made
2. guesstimate what will happen if the population of your city doubles from refugess flooding in from all the areas that havent' preped
3. tell us if you think being in such a situation is really a wise idea?
(I say this as somebody who until recently had considered portland on my short list of relocation options. I even bought some literature analyzing the various neighborhoods with an eye towards which ones might do better than others)
In a way the Portland Peak OIl taskforce is doing themselves a major disservice by convincing themselves that being are "the most PO aware city" is going to matter one bit once the real problems show up. I doubt any of the people who parrot this line are going to move out of Portland. Thus, ironcially, they are worst off then the person who lives in Los Angeles and has realized most all big cities are going to be completely lacking in human dignity in the future - even if they had an active "peak oil taskforce" in the early days of the unraveling.
BEst,
Matt
TOD has a lot of people who know about oil and energy -- I don't think it has so many people who know so much about currency collapse. But even I can say one thing: read about the Weimar Republic if you want to know what it might be like.
Wheelbarrows of reichmarks? More likely there will be nothing to buy and people will be using it to wipe their asses as there will be no toilet paper.
SA must be rapidly losing clout within opec, regardless of why their production is declining. If voluntary, as suggested by some, then opec sees them as the patsy, allowing all others to produce flat out as they stoically cut to maintain prices. If not voluntary then they are going down, and will continue to do so, so why give them more than polite attention? Places like Angola, with potential to increase, are now moving to center stage.
Meanwhile, attention is bound to turn to russia. IMO their steady production increase does not look like collapse is around the corner... this may be a place where HL has missed the boat, or at least a few billion barrels. Perhaps production would have gone to a higher first peak had ussr not been in the process of collapse? Still, exports are, as WT points out, declining, and this trend seems very likely to continue even if they do manage a bit more production, as seems likely (trends continue until they stop).
Well done Stuart and Euan, both posts casting some light into a gloomy but critically important subject. I for one really do appreciate what evidently is a lot of work.
If Saudi production drops another million barrels this year we will know definitively that they are past peak. Added to 300-500k lost from Canterell, the same amount again from the North Sea and other losses, the 4m or so addition capacity being added this year is beginning to look decidely minimal.
So the trends should start becoming clearer, even in the next few months. It will be interesting to see how the BP statistical review, due out mid year or so, handles Saudi.
World oil demand growth set to double says this article in the arabian times that just came out.
The Organization of the Petroleum Exporting Countries, source of more than a third of the world's oil, pledged to reduce supply by 500,000 bpd from Feb. 1, in addition to a 1.2 million bpd cut that took effect in November.
Oilcanboyd
Stuart,fantastic discussion....gross production information is vital but as many of us live in oil importing nations I would sure like to see graph(s)of export production levels,country by country and world totals for say the past 5 years...can you point out where this information might be and again thanks for all of your work
The BP report is a pretty good place to start.
Try here.
Hello TODers,
At 9pm Arizona time, the sitemeter pegged close to 23,000 visits--far above average--well done! I thank those that helped get the TOD word out.
BTW, has anyone checked to see how CERA's newsblog is doing? Last I heard, Bart from EnergyBulletin is still looking for them to include articles from EB & TOD. =)
Bob Shaw in Phx,Az Are Humans Smarter than Yeast?
It seems the average number of hits from youtube about p.o is between 25-30000. Could this indicate the number of people that are aware of peak oil?
Fantastic post by Stuart and great discussion.
This has certainly made me think more about SA, although I still tend towards the view that the cuts are voluntary.
Putting myself in the shoes of SA prodction controllers, I believe their greatest concern is stability and income. I would assume that they are very familiar with peak oil and probably have better data than us here at TOD. If the peak is coming soon (or already here), my goal would be maintain near flat world production for as long as possible at the highest oil price that would maintain moderate economic growth (stability). The past few years have shown that moderate growth can be maintained at $50-$70 oil, so I would target the price in that range. Their adjustments to production have served to do this which has maintained both stability and income. From a peak oil view, a long plateau with slowly rising prices serves SA (and the world) best, and that would be my goal.
That has been their goal for years, and they will probably continue to strive for this objective as long as they can.
higher growth rates from various organizations imply we need more production, and the agencies seem to be getting a little worried...
EIA projection for future oecd storage is consistent with the above and unusually pessimistic, showing another 150Mb draw on stocks by year end...
I have no idea how many miles the Chinese drive or what their average mileage is, but if you assume 10,000 miles per year and 25 mpg, the one year increase in vehicle sales in China, about 8 million vehicles, would consume about one Gb of petroleum in 12 years (based on the above assumptions).
As we have discussed several times, because of rising consumption flat production = declining exports, but we are not seeing flat production, we are seeing declining production, which probably means double digit declines in exports in many exporting countries.
I think that we are about to see some explosive increases in oil and petroleum product prices.
Yes, but probably not until next year, and who knows, we may be in recession by then. sa/mexico decline will probably be covered by new projects elsewhere - I expect us to hold on to the plateau this year, sliding off next year, hopefully gently. Flat production is not imo sufficient to raise prices to 100 in the absence of a crisis.
But just consider the combined increases in consumption in the two biggest exporters, Saudi Arabia and Russia, and the two biggest importers, US and China--it's probably running at close to 2.0 mbpd per year right now, Total Liquids. Probably about 1.7 mbpd, C+C.
YOur latter value is consistent with eia demand projections, which I was not considering... probably sa demand will be down some because of their (stock) market crash, but some others are up. So, looking at the total picture, I tend to agree... chris' 4Mb/d new projects, less 1.4Mb/d sa/mexico, less maybe 2.5-3Mb/d rest of world decline is about in balance, so maybe the net effect is around what you suggest. PRices might indeed surge to a new record as stocks are drawn down, as projected in the eia chart in stuart's original post.
euan/robert/lv:
Imagine the following...
SA production declines around 100kb/m throughout the year, or until their next major project comes on line, due end 07/early 08.
Oil price is at least stable throughout the period.
OECD stock draws follow the EIA projection shown in the original post.
Would you, at any point, conclude that sa is probably past peak? If so, at what month?
Thx for this info - I'm awestruck ..
This article is just up there - and if the assumptions hold true throughout the year - it will enter the classics on the issue of peak-oil.
Can one get Nobel prizes for such analyzis ?
I wonder....
What I see between here and Stuart's prior post is this: Stuart has taken data, assessed that raw data, found strong mathematical correlations, then attempted to construct a theory that fits the data and the correlations that also contains falsifiable theses (so that it may be tested). This is known as science.
I am still waiting for some reality based contrarian position rather than "expert opinion", "secret" data, and Monty Python sideshows. The lack of such a well-formulated position, and the presence of so many poorly conceived opinions without any demonstrated statistical basis is troubling here on TOD, especially given who is doing the whining. In fact, the lack of such a well-formulated reply after nearly a week now strongly suggests that there is not going to be such a reply.
Of course, I will continue to await such a reply but after the demonstration here of pure contrarian opinion without substantial statistical backing, I am no longer planning to hold my breath while waiting.
Ghawar Is Dying
The greatest shortcoming of the human race is our inability to understand the exponential function. - Dr. Albert Bartlett
Stuart
You graph looks out of scale for the manifa 900k startup.
I think a straight line is too pessimistic. Even if ghawar is going down at 20%/y, and other fields are declining at a historically consistent rate, say 6%? production would not get so low in the time frame you show. It would be interesting to see a graph that includes both the new projects and existing field decline rates that are consistent with ghawar going down at a high rate while other fields decline more slowly.
Fabulous work.
Assuming ghawar is now 4.5M and declines 1.5%/month, balance 4M declines at .5%/month, new projects come on line as scheduled, achieving full production just as the next project is due to start, at which point they themselves begin to decline at the lower rate:
SA might just get back to 8Mb/d with the Khurais resurrection, but only if it achieves full planned production and then only briefly. Average production through the period would be around 7.6Mb/d, the same as might be expected at the end of this year:
Ghawar The Rest Increase
0.985/m 0.995/m
m 4500000 4000000 8500000
10 3868787 3804441 7673228
12 3227079 4082348 500000 7309427
4 3037767 4251311 250000 7289079
9 2651433 5263784 1200000 7915217
15 2113606 5082523 200000 7196129
10 1817131 5734039 900000 7551170
60 avg 7590000
Stuart, great analysis. I'm surprised that so many other contributors here seem to prefer to argue their own alternate hypotheses, rather than address your arguments. That's a form of denial, surely?
Unfortunately, you spoilt your analysis with
Surely you are not suggesting that global peak will be followed by a 1% annual decline, for ever? With so many precipitous declines that we hear about (e.g. Cantarell and the North Sea) surely declines will be much higher than 1% (indeed, 5% seems to be the most assumed figure). So how can you say that auto efficiency will adequately cope with a continuous 5% decline (or even a continuous 1% decline, come to that), especially as it takes over a decade to turn over the car fleet?
I think he is just distancing himself from the pessimistic crowd so he will not be dismissed off hand.
Stuart,
Fabulous post . . . .
The data and arguments of this and other recent posts are truly well presented, and create a compelling argument. However, I tend to believe that there are political and market complexities that cannot easily be captured in by looking at a single sector or country, although it may be the best anyone can do with the data available.
One such complexity: because SA has been so helpful to George W. and this administration by bumping up production during the Iraq invasion and just before the 2004 elections, could one speculate that, at the request of the Bush administration, SA may be reserving capacity to compensate for a possible upcoming attack on Iran?
It would certainly be in the adminstration's interest to keep oil at $60/bbl by having plenty of excess SA capacity available, rather than have oil spike to $150/bbl if much of Iran's oil capacity were to be temorarily shut down.
Piccolo
This is my first post to the oil drum. I've read this site on and off for about a year with great interest. I bought Simmons' Twilight in the Desert last week and am just starting it. I have a question: inside the front cover of the paperback there is a color map of the Persian Gulf. Is there an online version of that map anywhere? I looked at Simmons' Int'l. website and didn't immediately see it. I'd like to have a copy of it on my computer, in a larger size if possible. I could always plop it on my scanner but I'd like to avoid severely creasing the cover.
Thanks in advance and I hope to participate in discussions here going forward. I hope this request isn't too off-topic for this area. There doesn't seem to be an "open thread" area for general comments, or if there is I don't see it.