| DrumBeat: November 13, 2006 | The Oil Drum | TOD:UK to become TOD:Europe (and...anyone know anything about wikis?) |
Why We (Really) May Have Entered an Oil Production Plateau
Posted by Sam Foucher on November 13, 2006 - 11:45am
We know that some countries (around 56) have seen their production peaked (also called type III depletion). The remaining group consists of 17 countries that have the potential to grow or maintain their current production (the type II group). I propose to apply the HL technique only on the total production from the the type III group and try to assess the future production decline coming from that group. My observations are the following:
- The type III group (~56 countries) seems to have peaked around 1999 at 40 mbpd with an URR around 1.0Tb and a cumulative production of 600 Gb in 2005.
- The decline rate in the group III is currently around 1% per year but will accelerate with time and possibility reach 2% after 2010
- When a high case scenario for the production derived from the Canadian Tar Sands is included, the decline rate will be reduced around 0.5% per year until 2010.
- In order to satisfy a relatively moderate demand growth at 1.5%/year, the supply coming from the type II group should be around 3.5-4.0%/year and reach a production level of 56-59 mbpd in 2010 (from 40 mbpd in 2005).
- The total production from Russia and Saudi Arabia that are leading the type II group, is almost flat since mid-2004 despite record oil prices.
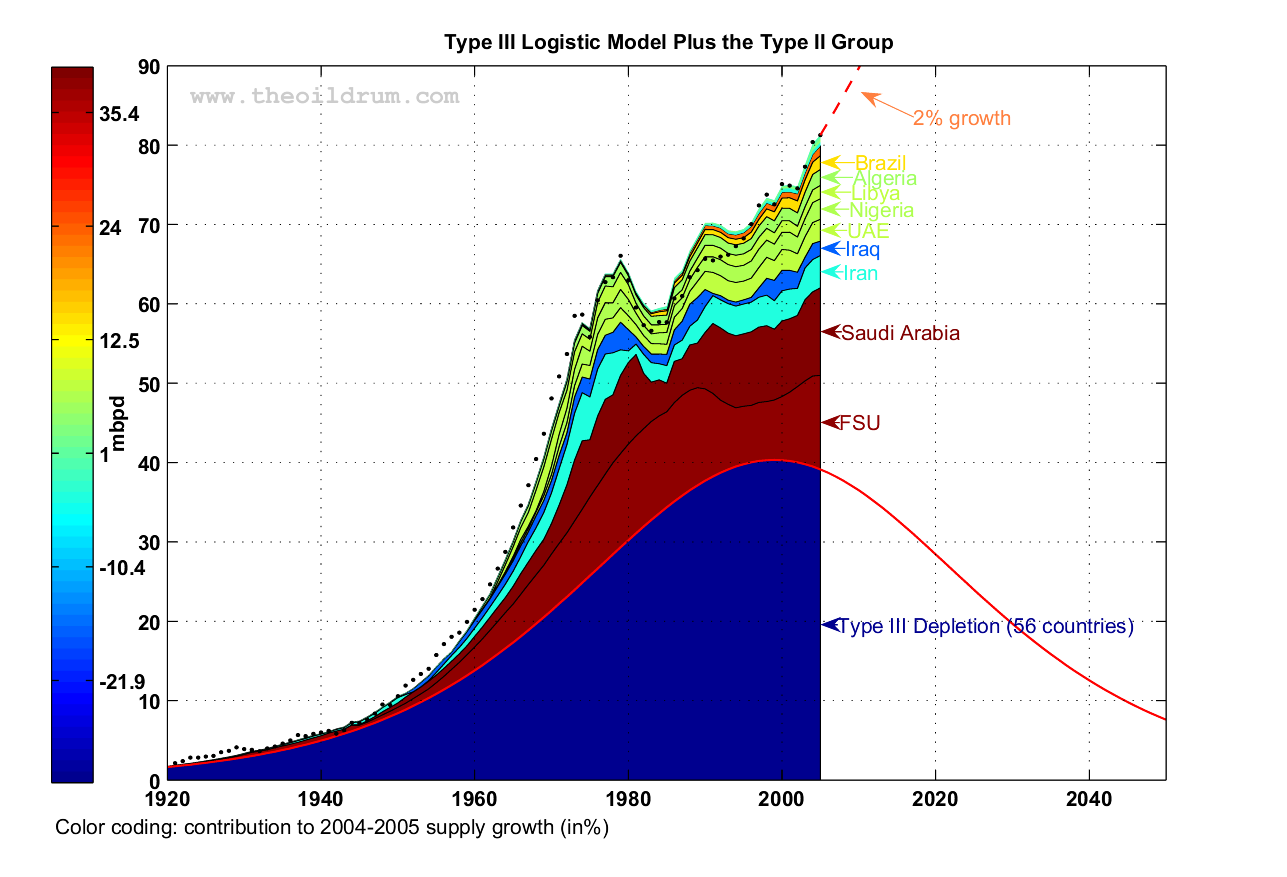
Production from the type II group added to the logistic curve modeling the production coming from the type III group. The dots represents the actual values for the world production of crude oil + NGL.
Cautionary note: In this story, I'm talking strictly about production of Crude Oil plus Condensate and NGPL (CO+NGL in short).
- mbpd= Millions of barrels per day
- Gb= Billions of barrels (109)
- Tb= Trillions of barrels (1012)
- NGPL= Natural Gas Plant Liquids
- NGL= Natural Gas Liquids (lease condensate + NGPL)
- URR= Ultimate Recoverable Resource
Production per Countries
The production data for 73 countries are composed of the following datasets (Contribution of Jean Lahèrrere, Stuart Staniford and put together by Roberto Canogar):- 1857-1958: from "API Facts and Figures Centennial edition 1959" (thanks to Jean Lahèrrere and Stuart Staniford)
- 1959-1964: from "Twentieth Century Petroleum Statistics2004" of DeGolyer & MacNaughton.
- 1965-2005: BP Statistical Review of World Energy.
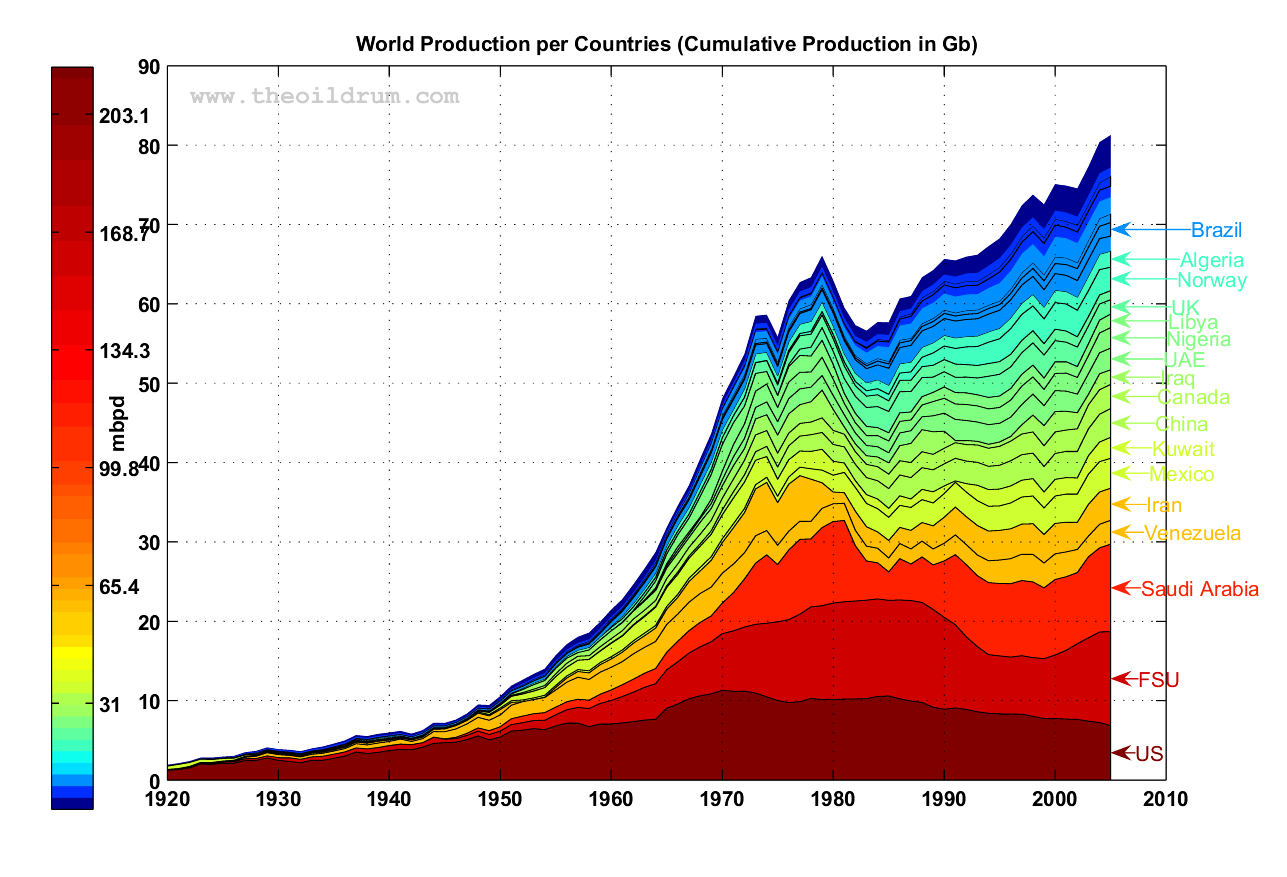
Fig. 1- World production of Crude oil plus NGL (CO+NGL). Color function of the cumulative production in Gb.
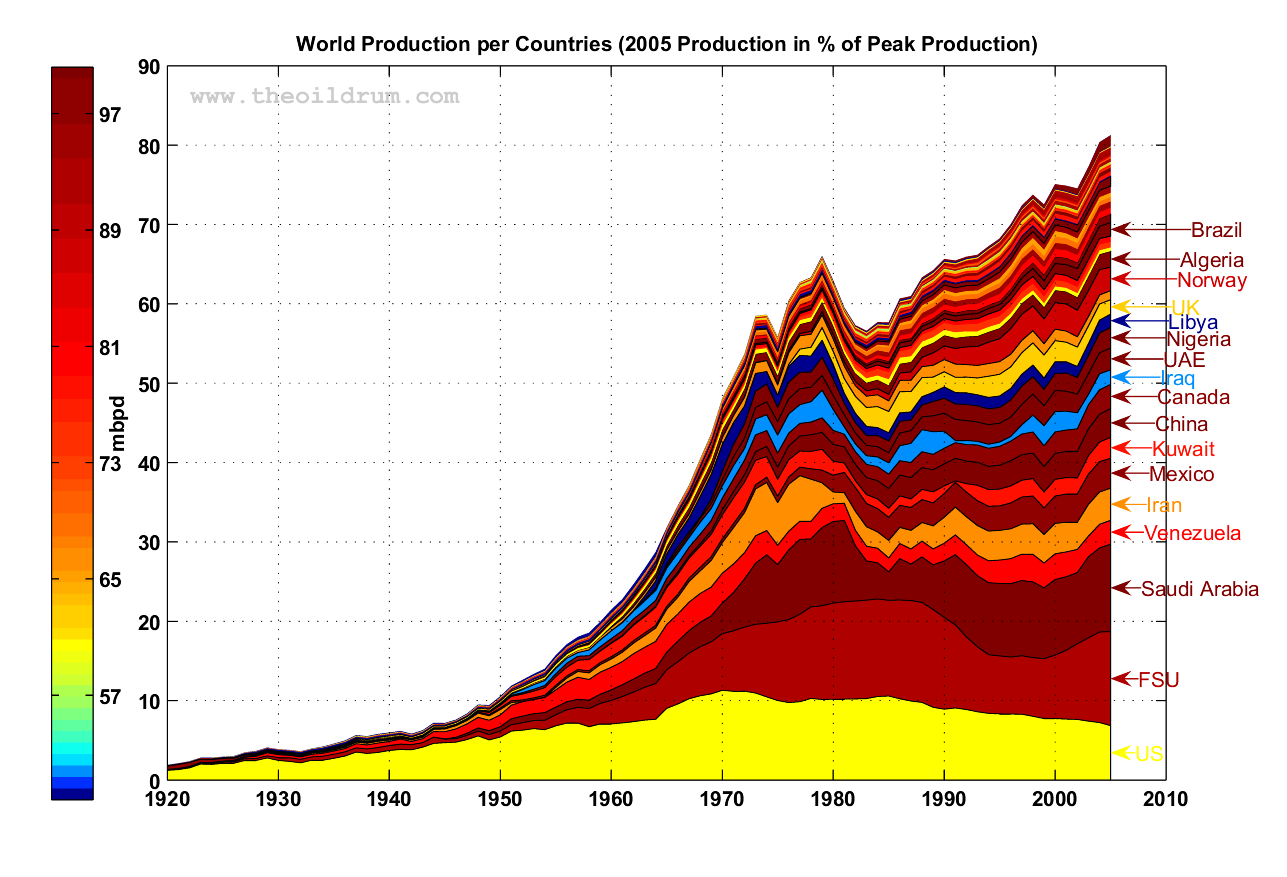
Fig. 2- World production of Crude oil plus NGL (CO+NGL). Color function of the 2005 production in % of the maximum production.
The Type III Group
The Type III depletion is when a country or region can no longer maintain or increase its total production, I quote Chris Skrebowski:
Type III depletion is when a country produces less oil in a year than it did in the previous year. This can be identified quite readily from public production databases (see Petroleum Review, August 2004 and August 2005). Type III depletion will increase as additional countries move into decline, but will reduce as the volumes produced by the countries in decline decreases. In 2003, Type III depletion was running at around 1.1mn b/d, but in 2004 it fell back to around 900,000 b/d (significant revisions to production data tend to confuse the picture). Over the next few years a number of countries are likely to move into decline - Denmark, China, Malaysia, Mexico, Brunei and India are the obvious candidates and account for over 12% of global production - so a reasonable working assumption is that Type III depletion will increase, although with something of a saw-tooth profile. Recent statements by oil companies (Petroleum Review, August 2005) have tended to indicate that overall depletion (Types I, II and III) is running at between 4% and 6%. Analysis of recent company production (see p24) tends to confirm that using a 5% figure is a reasonable approximation. Demand growth is subject to quite rapid swings, but appears to average around 2%/y.
I chose to include 56 countries (see Table I) that have peaked or that are believed to peak within the next two years (the ASPO Newsletter #59 contains also a table with the average decline per countries for regular oil).
| Country | 2005 Prod. (mbpd) | Peak Prod. | Cumulative Prod. (Gb) | P/Q (%) |
|---|---|---|---|---|
| US | 6.83 ( 60.46%) | 11.30 (1970) | 216.90 | 1.15 |
| Venezuela | 3.01 ( 80.10%) | 3.75 (1970) | 59.70 | 1.84 |
| Mexico | 3.76 ( 98.30%) | 3.82 (2004) | 37.51 | 3.66 |
| Kuwait | 2.64 ( 79.16%) | 3.34 (1972) | 37.23 | 2.59 |
| China | 3.63 (100.00%) | 3.63 (2005) | 33.06 | 4.00 |
| Canada | 3.05 ( 98.77%) | 3.09 (2004) | 32.22 | 3.45 |
| UK | 1.81 ( 62.15%) | 2.91 (1999) | 23.75 | 2.78 |
| Indonesia | 1.14 ( 67.42%) | 1.69 (1977) | 22.49 | 1.84 |
| Norway | 2.97 ( 86.86%) | 3.42 (2001) | 20.56 | 5.27 |
| other Europe | 0.46 ( 60.76%) | 0.76 (1986) | 10.10 | 1.67 |
| Egypt | 0.70 ( 74.00%) | 0.94 (1993) | 9.58 | 2.65 |
| Argentina | 0.72 ( 81.46%) | 0.89 (1998) | 9.51 | 2.78 |
| Qatar | 1.10 (100.00%) | 1.10 (2005) | 8.38 | 4.78 |
| Oman | 0.78 ( 81.17%) | 0.96 (2001) | 8.00 | 3.56 |
| India | 0.78 ( 96.07%) | 0.82 (2004) | 7.58 | 3.77 |
| Australia | 0.55 ( 68.48%) | 0.81 (2000) | 7.22 | 2.80 |
| Colombia | 0.55 ( 65.51%) | 0.84 (1999) | 6.47 | 3.10 |
| Malaysia | 0.83 ( 96.50%) | 0.86 (2004) | 6.41 | 4.71 |
| Rumania | 0.11 ( 36.31%) | 0.31 (1976) | 5.59 | 0.74 |
| Syria | 0.47 ( 78.63%) | 0.60 (1995) | 4.46 | 3.84 |
| Ecuador | 0.54 (100.00%) | 0.54 (2005) | 3.85 | 5.13 |
| Trinidad | 0.17 ( 74.35%) | 0.23 (1978) | 3.35 | 1.86 |
| Brunei | 0.21 ( 78.93%) | 0.26 (1979) | 3.35 | 2.24 |
| Gabon | 0.23 ( 64.29%) | 0.36 (1996) | 3.20 | 2.67 |
| Peru | 0.11 ( 56.63%) | 0.20 (1980) | 2.43 | 1.67 |
| Yemen | 0.43 ( 93.30%) | 0.46 (2002) | 2.20 | 7.07 |
| other Asia | 0.20 ( 71.97%) | 0.28 (1993) | 2.19 | 3.32 |
| Rep. of Congo | 0.25 ( 86.42%) | 0.29 (1999) | 1.83 | 5.06 |
| Denmark | 0.38 ( 96.67%) | 0.39 (2004) | 1.74 | 7.90 |
| Other S. & Cent. America | 0.14 ( 92.98%) | 0.15 (2003) | 1.52 | 3.41 |
| Tunisia | 0.07 ( 62.63%) | 0.12 (1980) | 1.32 | 2.05 |
| Italy | 0.12 (100.00%) | 0.12 (2005) | 1.04 | 4.12 |
| Sudan | 0.38 (100.00%) | 0.38 (2005) | 0.61 | 22.67 |
| Germany | 0.00 ( 0.00%) | 0.15 (1964) | 0.56 | 0.00 |
| Austria | 0.00 ( 0.00%) | 0.07 (1955) | 0.34 | 0.00 |
| Bahrain | 0.00 ( 0.00%) | 0.05 (1964) | 0.31 | 0.00 |
| Poland | 0.00 ( 0.00%) | 0.04 (1909) | 0.30 | 0.00 |
| Hungary | 0.00 ( 0.00%) | 0.04 (1964) | 0.16 | 0.00 |
| Netherlands | 0.00 ( 0.00%) | 0.04 (1964) | 0.16 | 0.00 |
| France | 0.00 ( 0.00%) | 0.06 (1964) | 0.16 | 0.00 |
| Japan | 0.00 ( 0.00%) | 0.02 (1963) | 0.14 | 0.00 |
| Burma | 0.00 ( 0.00%) | 0.02 (1939) | 0.11 | 0.00 |
| Chile | 0.00 ( 0.00%) | 0.04 (1964) | 0.08 | 0.00 |
| Neutral Zone | 0.00 ( 0.00%) | 0.08 (1958) | 0.08 | 0.00 |
| Yugoslavia | 0.00 ( 0.00%) | 0.04 (1964) | 0.07 | 0.00 |
| Albania | 0.00 ( 0.00%) | 0.01 (1962) | 0.06 | 0.00 |
| Bolivia | 0.00 ( 0.00%) | 0.01 (1957) | 0.04 | 0.00 |
| Pakistan | 0.00 ( 0.00%) | 0.01 (1964) | 0.04 | 0.00 |
| Turkey | 0.00 ( 0.00%) | 0.02 (1964) | 0.03 | 0.00 |
| New Guinea | 0.00 ( 0.00%) | 0.01 (1954) | 0.02 | 0.00 |
| Czechoslovakia | 0.00 ( 0.00%) | 0.00 (1953) | 0.02 | 0.00 |
| Bulgeria | 0.00 ( 0.00%) | 0.01 (1958) | 0.02 | 0.00 |
| Morocco | 0.00 ( 0.00%) | 0.00 (1963) | 0.01 | 0.00 |
| Israel | 0.00 ( 0.00%) | 0.00 (1964) | 0.01 | 0.00 |
| Cuba | 0.00 ( 0.00%) | 0.00 (1956) | 0.00 | 0.00 |
| Formosa | 0.00 ( 0.00%) | 0.00 (1941) | 0.00 | 0.00 |
The inclusion of some countries in this group can be questioned:
- Venezuela: regular oil production has peaked but an increase in the Orinoco oil sands production is not impossible.
- Canada: conventional production has peaked but syncrude production derived from tar sands is planned to reach almost 3.5+ mbpd in 2020. This point is further discussed in the section below.
- Kuwait has not peaked yet but his largest field (Burgan) is in decline and Kuwait has admited to have inflated its reserves.
- China: the ASPO is saying that this country is about to peak but it is not showing in the data yet.
I then perform a Hubbert Linearization on the total production from these 56 countries. We can see that the fit is quite good and gives an URR around 1.0 Tb with a logistic growth rate at 5.8%. The peak date is obtain by matching cumulative production values and gives 1999 as the peak year. Cumulative production for this group is about 600 Gb (60% of the URR).

Fig. 3- Hubbert linearization for the total production from the type III group.

Fig. 4- Corresponding logistic curve (or Hubbert curve) with a peak production in 1999.
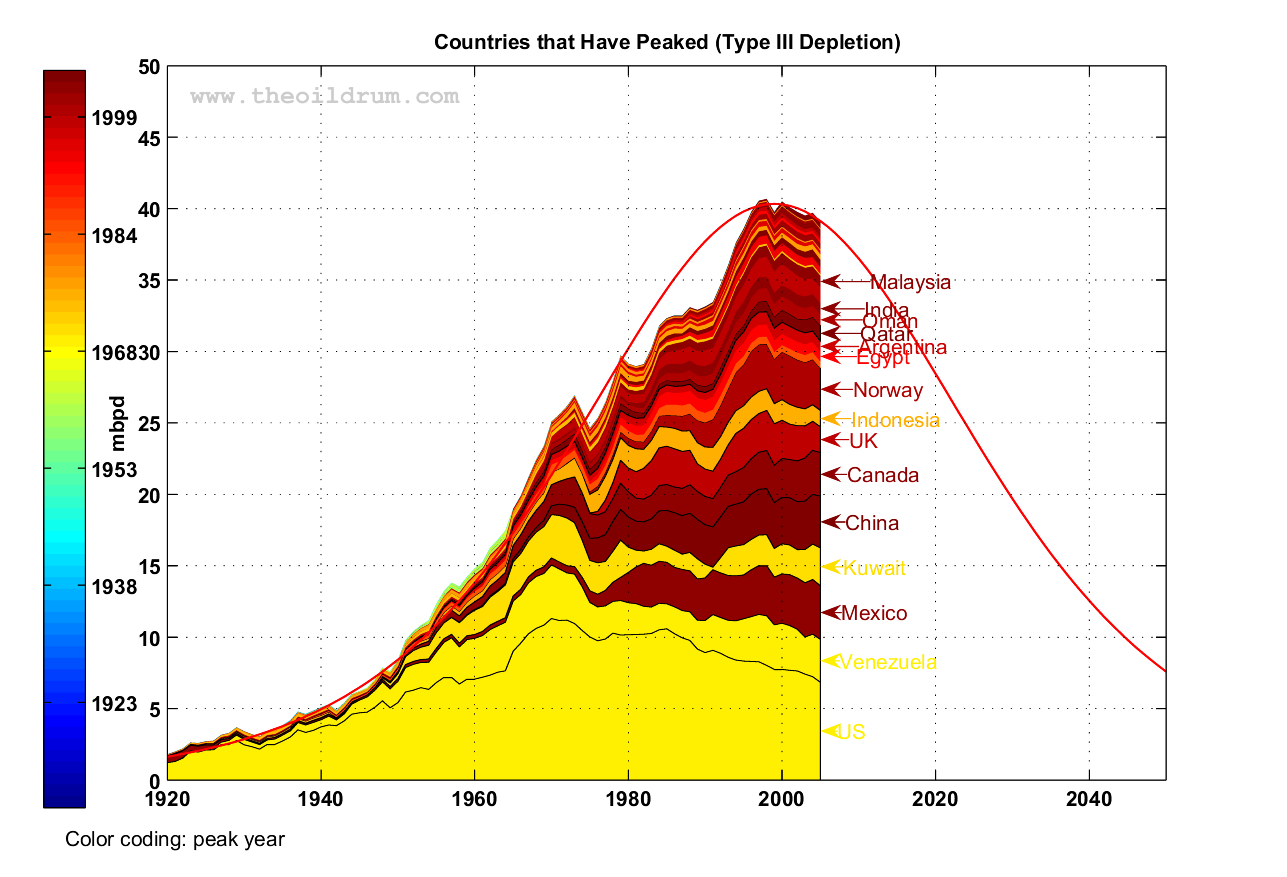
Fig. 5- Logistic curve with production profiles from the countries in the type III group.
What About the Canadian Tar Sands?
Synthetic Crude Oil (SCO) production derived from the Canadian Tar Sands is projected to grow by 2.5+ mbpd in 2020 (see the Canadian Oil Sands Production Update for details). I added one the most optimistic forecast (from CERI) to the group III logistic model as shown on Figure 6 below. I assumed that the level of production post-2020 will stay constant. The strong increase in syncrude production could slow down the group III decline until 2012-2015.
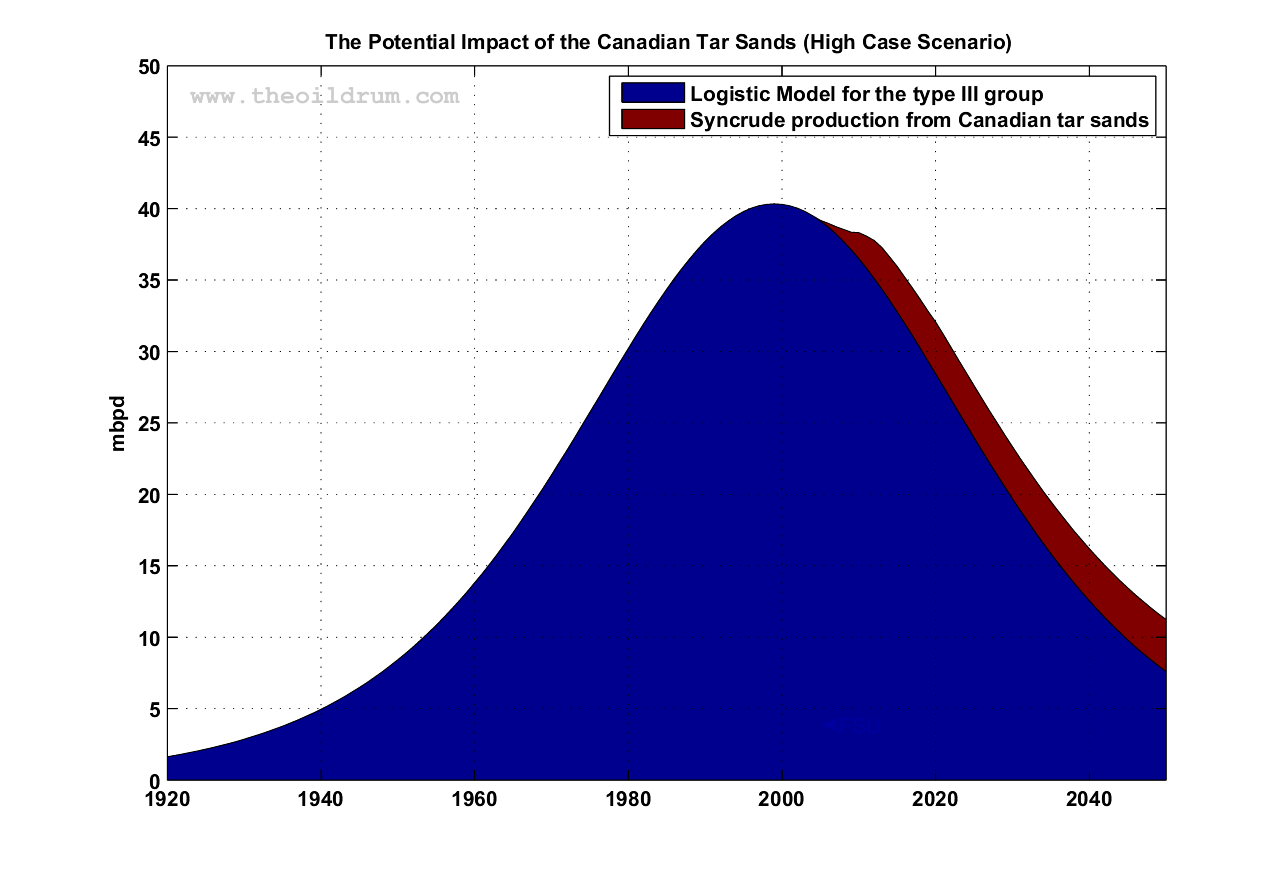
Fig. 6- Logistic model for the group III on which a syncrude from the Canadian tar sands forecast has been added.
What's Left?
The remaining group of countries is what I call the type II group which are believed to be capable of increasing or at least maintaining production levels for the coming years (see table II). As we can see on Figure 7, this group is dominated by the FSU (Former Soviet Union which includes Russia, Azerbaijan, Turkmenistan, Kazakhstan and Uzbekistan) and Saudi Arabia. In particular, the FSU was the main source for the strong supply increase that has been observed since 2000.| Country | 2005 Prod. (mbpd) | Peak Prod. | Cumulative Prod. (Gb) | P/Q (%) |
|---|---|---|---|---|
| FSU | 11.84 ( 93.59%) | 12.66 (1987) | 161.26 | 2.68 |
| Saudi Arabia | 11.04 (100.00%) | 11.04 (2005) | 116.17 | 3.47 |
| Iran | 4.05 ( 66.82%) | 6.06 (1974) | 59.14 | 2.50 |
| Iraq | 1.82 ( 52.18%) | 3.49 (1979) | 29.89 | 2.22 |
| UAE | 2.75 (100.00%) | 2.75 (2005) | 26.88 | 3.74 |
| Nigeria | 2.58 (100.00%) | 2.58 (2005) | 25.69 | 3.67 |
| Libya | 1.70 ( 50.70%) | 3.36 (1970) | 25.07 | 2.48 |
| Algeria | 2.02 (100.00%) | 2.02 (2005) | 19.36 | 3.80 |
| Brazil | 1.72 (100.00%) | 1.72 (2005) | 8.84 | 7.09 |
| Angola | 1.24 (100.00%) | 1.24 (2005) | 5.78 | 7.85 |
| Vietnam | 0.39 ( 91.83%) | 0.43 (2004) | 1.41 | 10.16 |
| Other ME | 0.05 ( 61.18%) | 0.08 (1970) | 1.20 | 1.46 |
| Cameroon | 0.06 ( 32.17%) | 0.18 (1985) | 1.11 | 1.91 |
| Tailand | 0.28 (100.00%) | 0.28 (2005) | 0.91 | 11.06 |
| Equatorial Guinea | 0.35 (100.00%) | 0.35 (2005) | 0.62 | 20.92 |
| other Africa | 0.07 ( 96.87%) | 0.07 (2004) | 0.53 | 4.95 |
| Chad | 0.17 (100.00%) | 0.17 (2005) | 0.13 | 47.40 |
Table II. Countries in the Type II group.
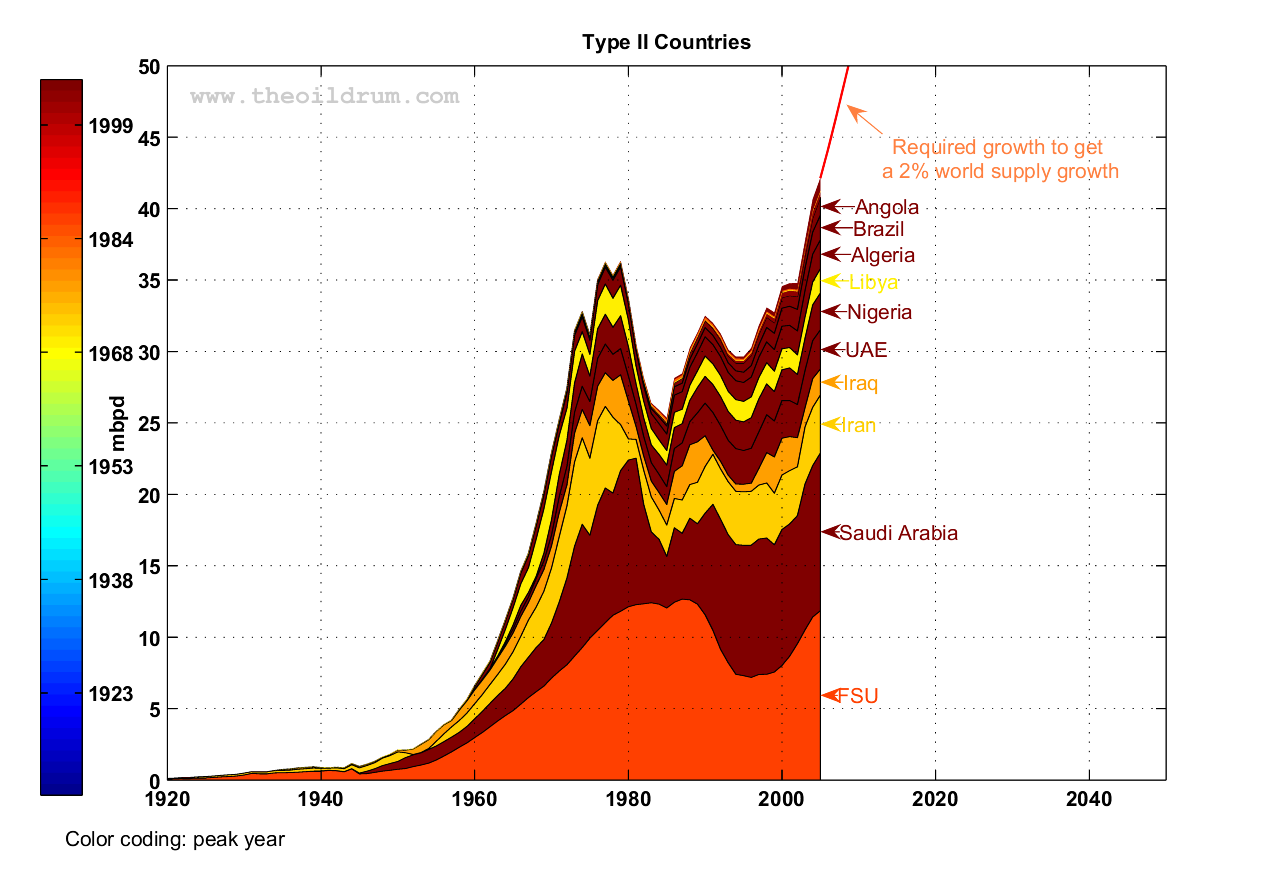
Fig. 7- Production from the type II group. The red line is the projected production required to satisfy a world supply growth at 2%/year and a logistic decline for the type III group.
When the Hubbert Linearization is applied on the group II (Figure 8), we can see that the Logistic curve fit is not very good compared to the group II and cannot follow the recent production increase. One explanation is that the oil production from this group has been altered by many oil shocks and production quotas. In addition, the production is relatively immature with a cumulative production (484 Gb) only at 34.7% of the URR. For now, I choose not to retain this model.
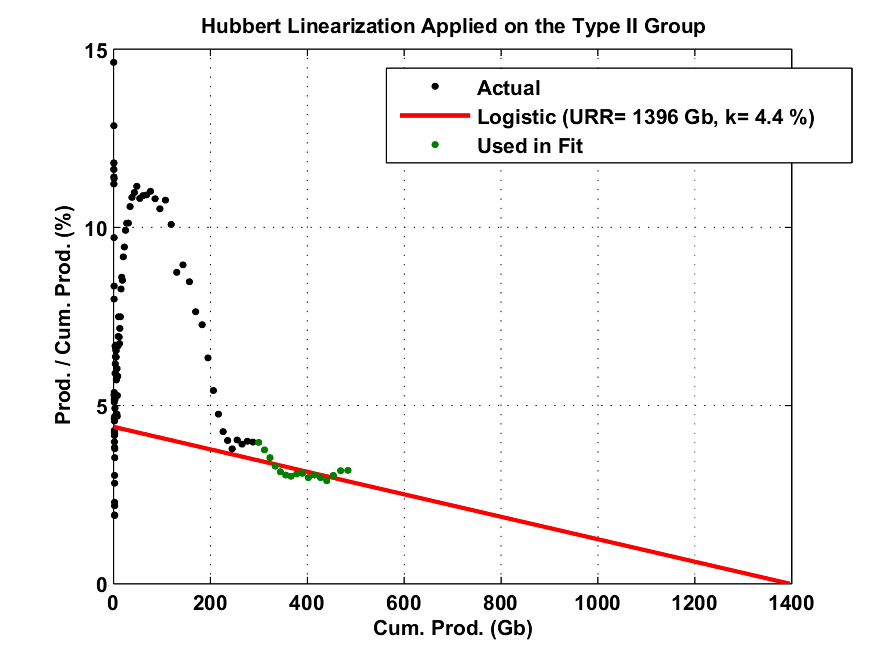

Fig. 8- Hubbert linearization for the total production from the type II group and corresponding logistic curve (or Hubbert curve) with a peak production in 2019.
Fig. 9- Production from the type II group added to the logistic curve modeling the production coming from the type III group. The dots represents the actual values for the world production of crude oil + NGL.
How Challenging Will be Future Production Growth?
Figures 10 and 11 below are summarizing the challenges we are facing in the coming years:
- The Type III group is pulling down world production by 0.4 mbpd/year but the production loss may reach 0.7 mbpd/year in 2012.
- In order to maintain a world supply growth around 1.5%/year and compensate for the group III decline, production by the type II group has to grow by more than 2.0 mbpd per year (or 4%/year, i.e. doubling of the production every 17 years!).
- In 2005, we lost nearly 0.6 mbpd from the group III and got only 1.5 mbpd of new supply from the type II group (see Figure 11 below).
- In 2006, preliminary estimates are showing a weak growth for Russia (+0.94%) and a decline for Saudi Arabia (-2.0%). Most forecasts are predicting a flat production for Saudi Arabia around 10 mbpd. Russia will probably have a weak growth for the next few years (see Dave's excellent post and Ray Leonard's presentation).
- A strong growth in the production of synthetic crude oil from the Canadian Tar sands may slow down the decline in the group III and create a kind of plateau until 2012-2015.
- Future production from Iraq could be a key element but unfortunately this country will probably remains in turmoil for years.
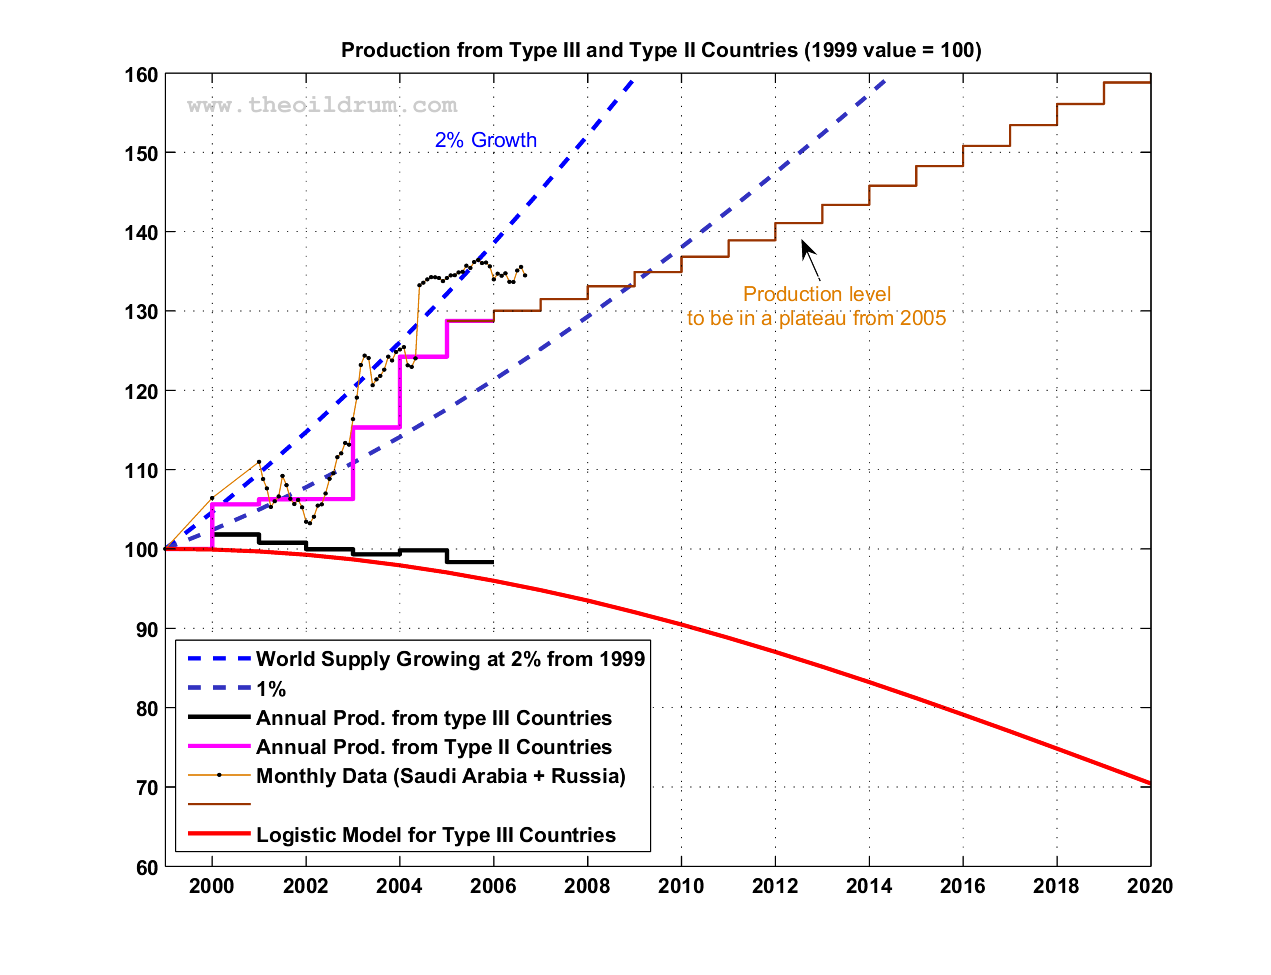
Fig. 10- Production growth and decline within group II and III. The two dotted blue lines represents the new supply from the type II group that is required to meet the world demand growth.
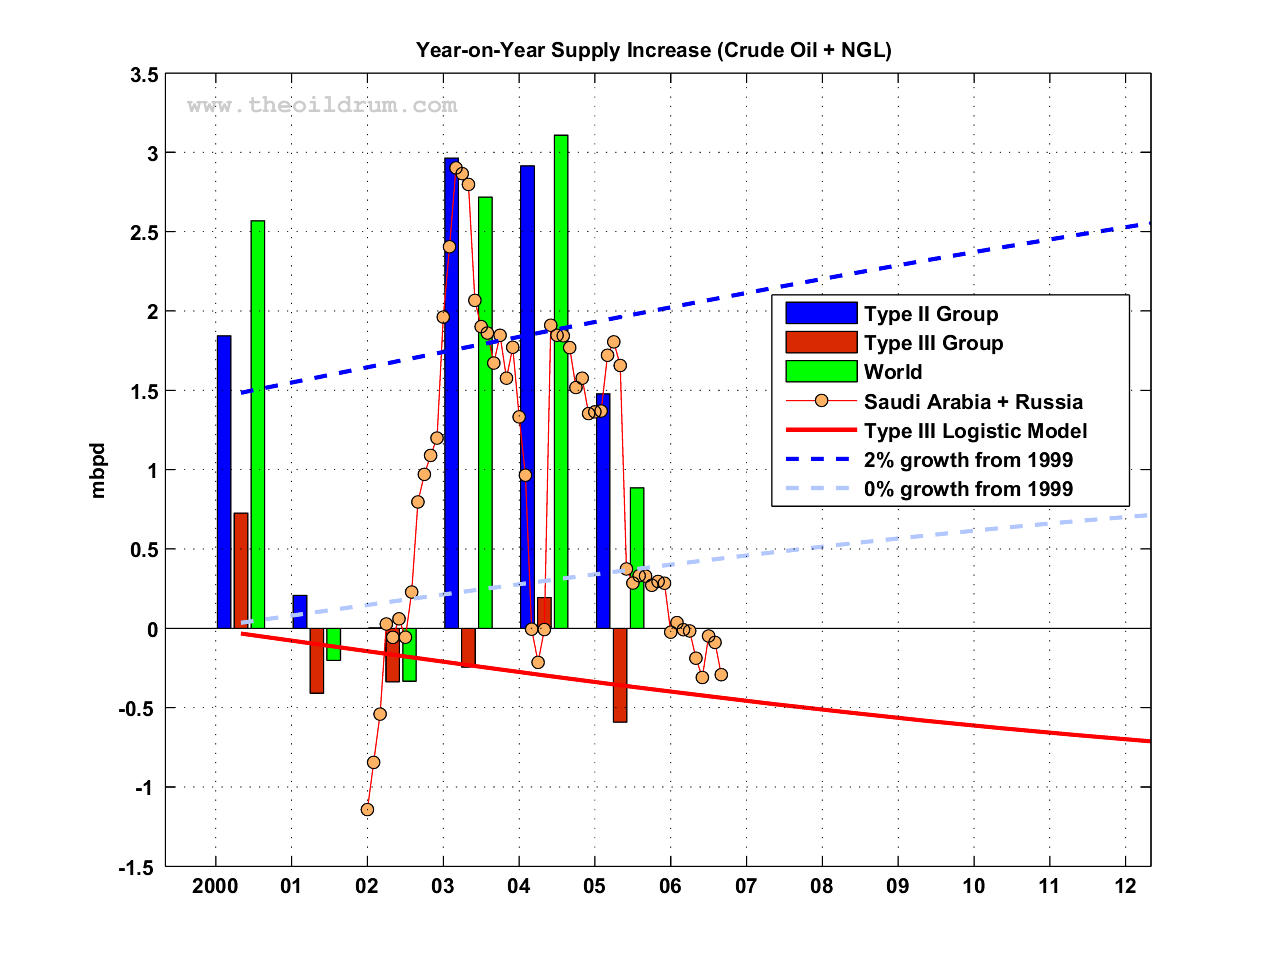
Fig. 11- Yearly supply fluctuations in mbpd. The two dotted blue lines represents the new supply from the type II group that is necessary to meet the world demand growth.
| 1999 | 2005 | 2006 | 2007 | 2010 | 2012 | 2015 | 2020 | |
|---|---|---|---|---|---|---|---|---|
| Group III (Observed) | 39.78 | 39.11 | ||||||
| -2.20% | -1.49% | |||||||
| Logistic Group III | 40.32 | 39.12 | 38.70 | 38.23 | 36.48 | 35.10 | 32.76 | 28.43 |
| + 0.08% | -0.91% | -1.07% | -1.23% | -1.70% | -1.99% | -2.41% | -3.04% | |
| Logistic Group III+Canadian Tar Sands | 40.32 | 39.17 | 38.97 | 38.73 | 38.31 | 37.76 | 35.93 | 32.07 |
| + 0.08% | -0.80% | -0.52% | -0.61% | -0.11% | -0.80% | -1.84% | -2.29% | |
| World CO + NGPL (Observed) | 72.50 | 81.25 | 81.20* | |||||
| -1.68% | +1.10% | -0.06%* | ||||||
| CO + NGPL (1.5% Growth from 1999) | 72.50 | 79.28 | 80.47 | 81.68 | 85.41 | 87.99 | 92.01 | 99.12 |
| +1.50% | + 1.50% | +1.50% | +1.50% | +1.50% | +1.50% | + 1.50% | ||
| Group II (Observed) | 32.72 | 42.13 | ||||||
| -1.04% | +3.63% | |||||||
| Group II (Requirement1) | 32.18 | 40.15 | 41.76 | 43.45 | 48.92 | 52.89 | 59.25 | 70.69 |
| +3.97% | +4.01% | +4.03% | +4.02% | +3.96% | +3.80% | +3.45% | ||
| Group II + Tar Sands (Requirement1) | 32.18 | 40.11 | 41.50 | 42.95 | 47.10 | 50.23 | 56.08 | 67.05 |
| + 3.85% | +3.47% | +3.48% | + 2.85% | +3.30% | +3.76% | +3.42% | ||
| Russia (Observed2) | 6.31 | 9.50 | 9.59* | |||||
| +2.59% | +0.94% | |||||||
| Saudi Arabia (Observed2) | 8.84 | 11.01 | 10.79* | |||||
| +5.76% | -2.02% |
Table III - Observed and projected production values (in mbpd) for Crude Oil + NGL. The second row for each category gives the decline rate (or growth rate) in percent for the considered year.1in order to satisfy the target of 1.5% annual growth for the world production. 2Data taken from the last International Petroleum Monthly (EIA). *Early estimates (8 months).
Khebab
Khebab@theoildrum.com
Contact
- Content: editors at theoildrum dot com
- Tech support: support at theoildrum dot com
License

This work is licensed under a Creative Commons Attribution-Share Alike 3.0 United States License.
Yes, fellow TODers--Hit those tipjars please!!!
My Reddit post:
-----------------------------------
IF the world is in a plateau--How long can it be sustained? Is world oil production like a cheetah with a high speed, but only a short plateaued burst? Or is the plateau more like a giraffe with long legs and a lasting trot? Khebab does an outstanding job and everyone needs to study these charts.
-----------------------------------
What I find disturbing is that many country charts have a late-date small hitch up attributed by many experts to Extreme Oil Recovery methods [EOR]. This has been discussed before by TODer DuncanK and notable others with the comparisons to the fast-collapse of the Yibal field in Oman, but it leads me to think the plateau will be more like a cheetah instead of the lasting plod of a giraffe.
Therefore, is there any way to characterwise what percentage of Type II production is EOR to help determine the possible duration period of the plateau? In short Khebab: what is the confidence %'s going forward?
Bob Shaw in Phx,Az Are Humans Smarter than Yeast?
Just to help prod this
cheetah vs giraffe plateau comparisonalong, consider Leanan's Drumbeat toplink post today [as usual, kudos to Leanan!]: Peak oil on the agenda: Notes from the Australian Institute of Energy annual forum-----------------------
James' report below contains some minor bombshells, for instance Lloyd Taylor, former Chairman of Shell NZ, claiming that even based on the USGS data, there is a 60% chance of peak oil by 2015.
----------------------
Don't most experts consider the USGS a bit optimistic? Therefore, is a 7-9 year plateau a pipedream? The production treadmill the Type II Red Queen is pacing is not only going faster, but the ramp incline is jacking up, too.
Pemex has already admitted to a $2 billion shortfall, Gazprom is twiddling it's thumbs to extract the maximum Euro, and KSA is punching holes as fast as they can, wearing out the rigs faster than the industry can build replacements.
Bob Shaw in Phx,Az Are Humans Smarter than Yeast?
I have noticed the tendency of analyses like these to be "conservative" in the sense that the potentials for future projects to come online in time, depletion rates to remain low, etc. are given the benefit of the doubt.
What I would like to see is a "conservative" analysis in the sense of "what if things don't go according to plan?" What does it look like if "another Saudia Arabia" doesn't manifest from the Type II countries?
How fast is the global depletion rate likely to be and when does it become very noticable?
I don't believe total predictive ability, just want a set of scenarios we can consider realistic considering Murphy's Law. What we have here is a kind of "best case" scenario, what would be a "not so great case," in other words?
Khebab's excellent post demonstrates what we should consider a best case scenario. Political, military and environmental factors can do nothing but provide setbacks to production.
It's hard to tell, There are so many things that can go wrong! The worst case scenario is SA or Russia going south. Another issue is the likely overestimation of Middle-East reserves. You have to read my post also in light of Stuart's analysis (Why peak oil is probably about now):
There is also the result of the HL on Saudi Arabia which is worriesome (Texas and US Lower 48 oil production as a model for Saudi Arabia and the world):
I think one thing we forget is the size of the curve. The base could be said to start in 1930 (or even go back to spindletop) and end in 2070 (perhaps dragging on in small volumes further). Given a base of 140 - 200 years, a 10 year plateau/peak does not seem unreasonable - even for a perfect Hubbert curve.
At this point, we may speed up towards the end of the Plateau due mainly to protectionism (nationalist hording of resources - i.e. what I think Russia is currently doing). If this gets out of hand, then this period of "suspended stability" could end sooner than later.
-PoP
This is the type of information that makes the TOD such a great place to visit.
Data, Analysis, Charts & Debate.
-C.
One slight inaccuracy-Cuba now has some production.
Ouestion: What are Type 1 countries?
Also, why is bitumen production from tar sands included in oil rather than have a separate category? My personal definition of oil is that oil has to flow naturally at 70 degrees farenheight. Since tar has to be either heated ir hydrogenated to flow and costs so much more to produce and refine, shouldn't it be considered either alternative energy like syncrude from coal or perhaps have its own category or one including bitumen from shale too. I think its really just noise on your figures.
I quote :
I join everybody in the many thanks to Khebab for this data.
Ouestion: What are Type 1 countries?
Type I is when an oil field is in decline so all the countries are in fact type I. Type II is when the decline is not showing up on the country total production.
About tar sands, I believe that it should be included (and modeled) as a separated category. Also, the syncrude production figures should be used, not the raw bitumen which is not the final product (there is 10-20% loss in the upgrading process).
Excellent isn't a number.
How appropriate.
This latest by Khebab hopefully starts arguments among the staff, headed by ex-CEO Reilly, working on the Energy Report coming out soon. It will be fascinating comparing their output to Khebab's.
Bob Shaw in Phx,Az Are Humans Smarter than Yeast?
Spot oil has fallen twenty bucks. Avg USA oil contracts are fifty bucks today. The Peakist scare campaign of a past peak or a plateau has again been exposed. The genie is out-of-the-bottle. The emperor has no clothes. The media won't come near this issue any longer. They have moved on to the global warming hoax. When the scare tactics of that one are likewise released, they will move on again to the next story...
Quick question: has anyone here at TOD or elsewhere done a similar comprehensive study on the consumption side?
The demand side of the equation is absolutely critical (I suggested a simplistic model which inputted for example the effects of various recessionary outcomes on oil demand etc), and I suspect we really need someone who is very hot on economics to look at this.
One could develop more complex models that allowed for demand destruction as prices went up etc.
The nearest we seem to have come to looking at this question relates to the posts made by westexas et al looking at how consumption in oil producers is rising and how this can put a dint in exports.
I believe it modelling the demand side which is the next 'jump' TOD has to make - it looks to me that the data accumulated on the supply side is looking more and more robust - is there that much more to add? No doubt about it though, the consumption/demand side will be far far harder to analyse - its worth having a go at IMO, as presently all we seem to have are IEA and EIA guestimates as to future consumption. Since as a community we seem to be better at assessing future supply side than them and see no reason why we cant make a fair go at assessing demand too.
And demand does not get "destroyed" by high prices alone: when we enter a recession demand drops for fundamental economic reasons (i.e. less output of goods and services requires less energy).
Anyway, what I was asking for was not so much econometric modeling of the future, which is very difficult to do, but past data on consumption presented and analyzed in the same way as Khebab has admirably done for production; i.e. on a country by country basis.
I have seen a study by Luis de Sousa here on TOD about the domestic consumption of oil exporters - could this be expanded to include all countries? I think it would be extremely valuable and the comparative study between production and consumption analyses even more so.
Many thanks
Also the main graph seems not to include this expected contribution at all. Indeed the use of an idealised Type III curve, rather than the real data in your main graph serves to hide global effects on all producers.
It would be interesting to see a graph that included the expected paths of TypeII countries + canada tar sands, and put SA and FSU as the top layers of the curve cake. By eye it seems that increases here dominate your model - thus uncertainty in these two areas are key to assessing the production plateau hypothosis.
Be careful, the vertical scale is 5 mbpd (Click on the Figure to get a high resolution version). Here are the values I used for the read area on Fig. 6:
2012: +2.46 mbpd
>2020: +2.82 mbpd
However, I noticed an error in the application of my bitumen to syncrude loss factor (0.88). I divided the values instead of multiplying them by that factor! so the values should be:
2012: +1.9242 mbpd
>2020: +2.21 mbpd
Consequently, the red area is 30% too optimistic!
This is a work in progress, I'm planning a follow-up on that post that will consider different forecasts for SA/FSU/Tar Sands.I say this because both are, at the moment, a conversion of ng to liquid fuels. In addition, both have external constraints not normal to crude production... limited water, environmental degradation and co2 production for tar sands, limited available land and increasing grain prices for ethanol (at some point farmers would sell their crops for the grain price and eschew the ethanol subsidies.)
Thanks for bringing the numbers and separating those countries that can increase production from those that can't (or at least haven't) Now I can see the picture of how much those few exporting countries must increase just to keep us in plateau.
I just can't resist it:
56 Countries
56 Different discovery cycles
56 Different production cycles
And it stills follows the damned curve! What else can skeptics ask for? The Hubbert Curve is growing stronger by every drop of oil we burn.
Khebab some comments:
Your assessment for Qatar is quite different from that of ASPO's (Colin Campbell + Uppsala), to whom the country is still in the upslope (see Newsletter 58)
And as for this:
Maybe in this case it'll probably be useful to draw apart the countries with a strong deep offshore cycle from those without it. Angola, Nigeria, Brasil, etc present very recent cycles and should probably fit better their own curve.
About Qatar, according to the ASPO database (regular oil):
Cum. Prod.: 7.32 Gb
URR: 12 Gb
Depletion midpoint: 1998
Qatar is at 60% of its URR, that's why I put it in the group III.
That's a good idea, there are many variants possible.Great work, much appreciated.
That was my initial point anyway.
In Fig 3, the HL for Type 111, are you able to make any comments about the reasons behind the gradient changes, especailly the dog leg at around 400 Gb?
Do you think the Candian Tar sands will be scalable? What I heard in Boston were problems with water, not enough gas and not enough light crude for blending.
Do you still trust your loglet peak at 2012 - cos that's what I have chosen to believe as God's honest truth.
CW
That's the big question, so far the observed production numbers are in agreement with most forecasts. I also noticed a slight upward trend in the recent forecasts that are getting more bullish on Canadian tar sands.
Unless a bombshell (e.g. war with Iran, a big revision in a Middle-East country reserve, etc.), 2012 seems likely. We have to watch closely the production numbers from FSU and SA.
Do you mind sharing your opinion...do you think a Peak now or a Peak in 2012 is that much difference, especially considering any margin of error inherent in the stats? If the Peak is really just 5 years out, shouldn't we act like it is now?
I keep seeing arguements between those that believe we are at the Plateau now vs. those that still think we have time.
If we do have 5 years, what do we have time to do about it?
You're right in saying that the error margin is pretty large (at least five years). Note that 2012-5= 2007, so we are pretty much in the same estimation interval. Conversely, if PO is now, any statistical analysis to confirm that a peak has occurred will require a least five more years to have some statistical significance. A plateau can make a big difference if it translates in relatively high prices for a significant time period so that alternatives can be developed and take roots in our economy. I you look at the Hirsch report, we need at least ten years to prepare ourself.
I think Hirsch's ten years prep is also pretty unrealistic. No one really knows how long it would take to adjust the world to "really" expensive fuel prices.
What it boils down to for me is that talking about Peak now vs. five years out is really almost splitting hairs. We should react in the same way.
Unfortunately, we will drag our feet kicking and screaming until its past the point of staving off disaster.
First of all thanks for a more mellow post(s). Here's my problem: Everything that is being suggested is based upon a continuation of the current growth paradigm. To me, it seems intuative that, with declining resources, application of alternatives to fend off serious economic change now will only result in a later and greater societal crash. This is sort of (but not quite) the essence of the Hirsch report.
Darwinian/Ron has argued this for a long time and I agree with him. Maybe you could offer your thoughts on how to have it both ways, i.e., economic growth with declining resources.
Todd
Note: I am a BIG fan of electricity for our transportation needs. We can produce electricity from literally hundreds of different and sustainable methods such as wind, solar, hydro, thermal, geothermal, universal geothermal, thorium nuclear fuel cycles, and biofuels just to name a few.
When we run up against another limit to growth, such as peak copper 'an example' then we will either need to halt our growth and go in reverse or find another way around this limiting factor 'carbon composites'.
Peak oil is 'generally' nothing more then a liquid fuel crisis. We can sustainably provide all the petrol we need for construction, asphalt, fertalizers, etc if we were not devoting 80% of our FF usage to transportation. Note, by sustainable, I mean that the resource depletion time period becomes a multi-generational one, so that in effect it is renewable.
An example of this is coal: at current consumption rates, some have stated that we have 3000 years left. Obviously it will run out at some point, but at such a distant time frame that its is renewable from our perspective. And NO, I am NOT advocating we switch to coal power.
As it stands, it is virtually impossible to produce enough biofuels to provide all our transportation needs AND feed 6.5 billion people. But we DO have enough wiggle room to fill a limited niche, such as jet fuel, heavy construction fuel, etc. Because of this limit, our growth obviously can not continue forever unless we find a way around the problem 'electrification'.
Of course, if you want a REALLY far reaching perspective, the human race only needs to find substitutes for our resources until we can economically bring in these resources from other sources, such as asteroids or other planetary bodies. But that obviously wont happen if we destroy ourselves through war, environmental decay, famine/disease, etc.
Simply put, knowing what human beings are capable of doing now, peak oil doesn't scare me. Peak Energy does. And please stop confusing Peak Oil with Peak Energy, they are vastly different issues.
I think that you are factually wrong, as I posted before a while back.
Home heating oil is often included with #2 diesel (chemically similar, lower quality control on home heating fuel).
Untaxed gasoline and diesel cannot be used for transportation off-site. Tractors plowing, combines harvesting, bulldozers shoving dirt around are significant oil users but are non-transportation uses.
I believe that a couple of years ago 67.x% of US oil use was for transportation and 32.x% for non-transportation uses. An area that I once invited you to collaborate on but you apparently chose not to do so.
IMO, We cannot deal with post-Peak Oil Exports and ignore non-transportation oil use !
Best Hopes,
Alan
If you take out the heating oil concept entirely, your left again with 80% of our FFs being used primarily in transportation. If we eliminated this sizable chunk of our FF usage, we would only need 17 million bpd at present.
Khebab, how long would our reserves last at that rate of depletion?
Massive, unaffordable price increases may induce some to heat 250 sq ft (or zero) as was done in the UK in the past; but most modern homes are simply not designed for limited heating.
You are handwaving at an intractable problem that will take at least a decade to affect even a decent % of oil use. IT WILL NOT BE QUICK OR EASY or likely soon enough for post-Peak Oil Exports.
Alan
Electricity is great for communications and motors, but it is not the best way to heat your home or your food. If it were really that abundant, fine, but between grid dependency and Coal/Nuclear dependency, we can do a lot better.
Thats just ridiculous. Simply ridiculous. You can not possibly rationalize that line of thought. Oh noez! The gas is shut off this winter! We're DOOOOOOOOOOOOMED...
Or maybe not. I'm going to borrow a page from a favorite site and show you some technological 'solutions' to NG usage. First, I introduce you to...
THE SPACE HEATER!!!

This bad boy, a modern of technology and science all rolled into one will cost you a whopping $30 at your local home depot. You plug it in, sit it next to where your working at and BAM! Instant heat for minimal power usage. Some space heaters have multiple settings, like 100 watt, 250 watt, 500 watt, 800 watt, and so on. Turn this bad boy on and you will be nice and toasty in less then 15 minutes. And if your home is even marginally insulated, this heat will last for an hour or more.
But lets not stop there. The next INCREDIBLE technological advance is the nice, the cozy, the MOST FAMOUS....
THICK BLANKETS!!!

Think of how warm thats going to be. Turn off your ultra unaffordable 'rolls eyes' space heater at night and sleep warm and cozy under these thick blankets until its time to wake up and start a new doom filled day!
And lets not forget this marvel of technology, seen for the first time in the west. Amaze your neighbors. Wow your friends. Feel the awe of using...
THE MICROWAVE!!!

Not only is this mystical machine vastly more efficient then NG for cooking food, you can set some ULTRA advanced models to cook various foods. You can cook pizzas, boil water for vegetables, warm up some cheese toast, or even make yourself a nice cup of tea. This marvelous machine can do it all! And you will spend less buying one of these and paying for the electricity to run it all winter then you will on paying for NG over 2 weeks!
OH THE HORROR!!!
"/Sarcasm OFF"
Come on guys. Things are not all that super scary without your NG. Try thinking 'outside' the box for once. "chortle"
Per reports, 40% of NE electricity comes from NG. So figure blackouts 75%-90+% of the time during a -20F blizzard (if the lines stay up) without NG.
75% to over 90% off because EVERYONE has their heaters on full blast when the power does come on. So the non-NG 60% can serve only a few at a time.
Alan
And your example is unlikely for most Americans.
You are pushing a square peg into a round hole IMO.
I advised a friend in Peabody MA to put in a small geothermal heat pump and a small condensing gas furnace to replace her 1960s gas furnance. Alao add insulation in attic and caulk.
Alan
Alan
Generally, German systems circulate hot water through radiators (air vents for heating/cooling as in America are essentially unknown in residential/small scale commercial settings, in part because air conditioning remains somewhat rare), and do not use much in the way of hot water storage - that is, when a room is heated, the water circulating to the radiator is heated at that point, there is no storage. For hot water in terms of household use, there is often a small tank which is kept warm, so as to provide hot water in the time that it takes for the heater to provide enough warmth to heat water after that point - that is, you can run the hot water for hours if you wish, but the amount of energy 'wasted' is about 20 liters of preheated water, and the remaining 20 liters after you are done.
There are also German systems available since at least 1982 which allow wood or natural gas to fire the boiler, but according to the heating person I know, such systems are not really that good as the compromises required reduce their efficiency, though at first glance they look attractive. And of course, using wood to heat household water is not realistic. This is where both you and Alan tend to talk past each other - the amount of energy required to heat water is very well known, and very high compared to warming space for human habitation/survival. Of course, as the technician noted, you don't need warm water to live, so possibly, you both are actually discussing basics, and not what most Americans consider essential, such as showering daily.
The weak point of a German system is the circulation pump, which does require about a kilowatt to circulate the water through two stories and a number of radiators in the only case I really know concretely.
"ratings ranging from 92.7% to 96.6% AFUE (Annual Fuel Utilization Efficiency)"
http://www.francisfuels.com/html/carrier_infinity_96_mvp.htm
Steam from combustion is condensed back to water to extract the last bit of heat. Exhaust is a PVC pipe (low efficiency = problems) so it HAS TO BE Efficient !
Alan
Admittedly, I can see reasons for this (water in the exhaust is hard on stainless steel, and worse on brick/mortar), but that would be the typical German reaction, I think - Germans have a very different standard of fire safety than Americans, and in any context where burning is involved, the standards are very strict. Where accidents in general are concerned, the standards are low - yes, a number of German families I know still place lighted candles in their Christmas trees on Christmas Eve - and the number of such trees burning seems much lower than in the U.S. (Though it makes me real, real nervous anyways.) And another concrete difference between Germany and the U.S. is in the building code - though the amount of time it takes people to escape a burning building is no problem under either building code, the German code encompasses the idea that other living space should remain undamaged - much German housing is row housing or multi-apartment. I watched a house lose its top floor (3 year old torched off a down blanket, closed the door to the room, and informed her parents) and roof, but the people in the apartments on the lower two floors moved back in after a couple of weeks (at most), and their property was never in any real danger from the fire, since there was no real way for the fire to spread - wood is rare here, and there are no airways between different parts of the house. Obviously, German codes are based on previous experience in what fire does to living space.
What may not have been completely clear is that I was referring to the checks of the furnace that are made on a regular cycle by the district chimney sweep. It is not only only manufacturer information which is used, it is real time collected information, which is then noted, pasted on the furnance, and I believe sent along to the proper agency - air quality is considered important, as is efficiency.
Germany is a very organized place, obviously, but much of that organization is for concrete goals, such as clean water or air. However, as with any human institution, after a while, things get out of balance. A couple of classic examples from memory was the still collected tax on Sekt (champagne) which was originally designed to pay for the Kaiser's navy, and another tax on the illumination of light bulbs - a 100 watt bulb had a higher tax than a 40 watt one.
This problem with balance and adapting to present conditions is part of the debate in the background here, with a number of different perspectives.
For example, in Germany, natural gas replaced oil and coal - a good trade off in many ways, as even if the gas becomes unavailable for many in 15 years, the generation of cleaner air was worth the price, along with the continuing investment in infrastructure to reduce the amount of heating needed to start with. Long term planning isn't that hard, really, it is just that such planning makes it hard to get rich quick, or get something for nothing, but now, I am Kunstler's area of expertise.
Actually fairly neat looking :-)
And a well engineered, quality system that can stack up against the best of Germany. Carrier 58 MVP models.
Alan
In terms of life span, I assume it is a draw.
The exhaust of this house's gas furnance house is probably over 110° F or so, but it is at least 10 years old.
condensing boilers achive up to 96% of the higher heating value (see http://en.wikipedia.org/wiki/Higher_Heating_Value) of the gas you put in. It's their nominal efficiency and a friend of mine has actually proven it by meticulously measuring all energy flows in his house for years.
Micro CHP is utter nonsense - capital cost has to be borne by end user, maintenance effort is multiplied a million times, market penetration takes ages, there is no way to fuel it by something else than its specified fuel, there is no way to sequester the CO2.
Big oder medium CHP plants are much better: Capital cost is borne by organisations with access to low-cost capital, maintenance is centralized and gets done regularly, a single installation improves heating efficiency for a huge number of households, you can potentially fire the steam generation by arbitrary fuel an if it ever proves to be safe and practical and the CO2 could be sequestered.
District heating, which uses the "waste" heat from electricity generation, achieves about 400% "thermodynamic" efficieny on the basis of energetic loss in electricity generation which is caused by the less steep temperature gradient between turbine and district heating network (as compared to the energy gradient to a cooling tower).
District heating is widely used in Europe (e.g. 30% of Berlin, Germany are heated this way) and a fully proven technology that can and is being rolled out today.
Cheers,
Davidyson
No, I can't cite any references- Just trust me. Can't cost you anything.?
HOWEVER. nothing works unless we cut the energy/person and the number of persons.
Sure, burns fuel, creates CO2, etc. But so does that plain old heating furnace, so why not get some juice out of it as well? Otherwise, as Amory Lovins likes to remind us, using high availability fuel to do nothing but heat a low temp space is like cutting butter with a chain saw--and using electricity to do it is like cutting butter with a laser beam.
May I invite you to comment on my reasoning?
Cheers,
Davidyson
On the bright side, global warming may fix the winter heating problem. :-P
I attended the Boston Conference. I was amazed at the lack of discussion of the economic and financial implications of a peak in the availability of liquid fuels in the U.S. If this should come to pass the effects on the dollar, the stock market, the real estate market, the banking system... would be brutal. In Boston, Roger Bazdak said that "demand destruction" was a "euphamism for a deprression". During the Great Depression there was no shortage of Oil - there was a shortage of money. The coming shortage of Oil could impale the dollar, to much the same effect as the lack of money had on the U.S. in the 1930's. In dollar terms oil prices would certainly rise significantly, the cost of financing our deficits would become nearly unmanagable (giving further incentive to debase the currency) which would send interest rates soaring, while at the same time setting off a "not your father's" inflation spiral.
Any planning for the future - environmental issues, peak oil mitigation issues - will be flung out the window as policy makers attempt to right the ship.
These issues are probably closer and will result in more hardship sooner than the real decline in oil availability during the next decade.
Still, I enjoyed th pictures and the sarcasm!
You can't use a space heater when an ice storm has brought down the power lines.
Also, electricity generation is primarily dependent on Natural Gas.(although Coal Generation is an option if we disregard Global Roasting)
A wood stove is useless after you've burned the last book and table leg.
Solar power is only efficient when there is sufficient sunlight
Hydropower requires moving water
Modern Agriculture is dependent on oil -- biofuels are not a good option
Modern Industry shuts down when energy costs make production no longer cost-effective.
The price of food is dependent on transportation AND production costs.
Political Action NEVER takes place until it is WAY too late. (Although they will TALK continuously until it IS way too late.)
It doesn't matter if Peak was yesterday or 5 years from now. It DOES matter when when the PRICE of oil drives products and food off the shelves and people out of work.
The important question is... When will the price/availability of oil begin to shut down the economies of the world?
#2 is Oil, not NG, as Alan was talking about NE's use of Oil as well.
Yes, electricity sure does work as a heating source.. just takes a lot of it. (And Microwave is a notably efficient exception).. but people who are heating with oil up are already choosing between heat and prescriptions, heat and food, heat and doctors visits. The grid, for largely Rural Maine, would be a disastrous way to hope for dependable heating. People lose power from wind and ice, just when they would be needing their heat, and are screwed.
Luckily, we have lots of wood, but we also have lots of housefires, we have lots of old, crumbling chimneys, and lots of people who can't afford to replace them with a pile of space heaters and the accompanying monthly 'Economic ReCentralization Deposit'
So snark on.. dude, Snark on and Prosper!
Take my house for instance. I can put up a single thermal blanket and corner off my bedroom, bathroom, and a tiny work area to live in if needed. I measured it out to be approximately 270 square feet of living area. Add a tiny refrigerator/freezer, a space heater and a microwave and I can live indefinitely in this small area. Additionally, my thermostat AND hot water heater are located in this area, so my heating and cooling needs would be limited if I shut off the vents to the remainder of the house.
And I HIGHLY doubt this would tax the northeastern electrical grid. A limited living area means a limited number of appliances that are functioning. This means drastically reduced electrical needs. The two would offset each other nicely, and likely not require additional NG plants to be brought online.
But the point is mute. Americans that can afford to heat their homes generally will do so. Your example will simply not be followed by the vast majority of Americans (see Prius sales).
Alan
How do you induce them to live that way ?
Alan
Come now, you cant possibly be suggesting that a little cold air is going to cause your house to fall apart in a few years, are you? Look at some of the Japanese houses. They intentionally 'fence' off large portions of their homes using 'fusuma' and 'shoji' panels so that they only have to heat or cool small portions of their houses. I haven't heard about them deteriorating at an unusual rate.
Most space heating is done with Kerosene heater though, not electric (electric heaters are too wimpy compared to kerosene).
But than again Tokyo winters are very mild. It rarely gets below freezing here. Even then no central heating can really suck. (I don't know how they do it up north)
I think Alenfrombigeasy's point was not that these things can't be done, its just that its unrealistic.
Good luck convincing Joe Preppy to close off half of his McMansion, and use a sleeping bag. As long as they can heat their homes they will. When they can't, well I guess the its hit the fan by then.
so Hothgar, I agree with you. Its very much possible for Americans to drastically reduce their energy usage (ie live like Japanese).
But Alen is right, its wishful thinking. Aint gonna happen.
It's sad were so short sighted.
And their lies the problem.
And that's what worries me.
Its not that we can't avoid a brutal economic shock. Its that we are just going to run right into it.
You are right that EV are much more efficient than IC vehicles. You are right that we waste tremendous ammounts of energy heating our homes.
But people are not going to give up their SUVs for a crappy EV. OR use a sleeping bag when they can just crank up their heat.
We are not building light rail.
We are not moving freight to heavy rail.
You keep posting again and again that PO is a liquid fuel problem only, and we can just switch to electricity.
Even if that's true it aint happening, and it aint gonna happen till its too late.
Nor is anyone investing the money needed to take new tech we need from the lab to the road.
Allen called your solution wishful thinking and I agree.
If you have a way to get people to make these changes I'm al l ears.
Modern Americna housing is non-biodegradeable but it does degrade.
Best Hopes,
Alan
Let's say we were able to remove 10 million commuters, out of 100 million, and have them work from home. Great idea, right? Less traffic, less gasoline consumed, better for the environment. The unintended consequences? 10 million people use 250 sq ft each at work - and one parking space. What do we do with the 2.5 Bill sq ft of office space now vacant? Do we tear them down? Not to mention the highway workers that won't be needed, dry cleaners, car repair shops, mom and pop this, that, and the other thing. Will the mortgage debtors be held to account on the vacant properties? What about the bank that holds the note?
All of these issues, and many more, must be addressed in an organized fashion prior to the policy of removing the 10 million commuters or the policy will fail and will only be sorted out by the geology.
Entropy applys here, too.
Remember 1950 to 1970 ? Almost every downtown in the US died, much (most ?) of our pre-WW II housing was trashed, massive losses as gov't policy created the suburbs.
Now, just throw that process in reverse.
Boarded up suburbia, strip shopping centers closed and torn down, etc.
The pre-WW II commercial & residential buildings were well built and often aesthetic. Modern stuff is neither, it will fall apart in a few years regardless. So not much of a loss overall.
Best Hopes,
Alan
I think your being way to optimistic on production declines.
The tar sand projects face real technical limitations.
And its not clear FSU/KSA will increase production.
I did not see that you modeled the collapse of Mexican production.
We stand a good chance of facing 5% decline rates in late 2007-2008.
Basically if you take your work and integrate it with WestTexas export land model and assume collapse of the large oil fields/ increased internal consumption. You get a much less rosy picture.
It would be nice to see such a unified worst case scenario model.
The reason for a worst case model is it allows us to move on and focus on defining various leading indicators of decline.
Oil price and gasoline supply are probably the least dependable indicators.
We would be looking for souring/heavy increases in oil supply. The use of more advanced refining processes resulting in a shortage of fuel oil and asphalt by products.
Obvious demand destruction in third world countries.
So far 2007 is looking to be a very bad year. We can only hope the wine will be good.
I think they are going flat. Production should grow at least by 3.0%-4.0% to satisfy a 2% demand growth! growth in the group II will be very challenging in the next few years.
That's in my plans. This post is a first draft.
Im signing up for the diggit icons just because of this article. My fav's is the country layers on the first graph that points out the obivous country by country! Great work!
A question about tar sand poduction> I realize it must be heated via steam-nat. gas fired at this time(?). Q? - Does the 'tar'(bimuten (sp?)) also need to be mixed w/nat. gas to dilute it into diesel or gasoline? I think you have mentioned that there is coming constraint in North American nat. gas supplies. At some point there is some very hard trade offs that will have to happen if this is correct.
You, westexas, leanan, etc. really have me worried this amy show up in a much more obvious way in the not to distant future of 3-5 yrs for us here in the US. Are we really running that blind into this? Any comments?
Obviously fom my word choices I'm not a petro guy forgive my lack of understanding.
I'm not a petro guy either! :)
Natural gas is used in the in-situ extraction process (ex: SAGD) and in the raw crude bitumen upgrading.
Re: Are we really running that blind into this?
I believe so, the results from the present post got me more worried than I used to be on PO.
The figures I've seen says it costs $500,000 per barrel a day of product plus the costs of refining the product are something north of $20/bbl. This means that the bitumen production operations probably won't make a profit for well over five years, which is considered non-economic in regular oil production.
DelusionaL asks, " Are we really running that blind into this? Any comments?"
Interesting that you should use that phrase, "running that blind"....as my fellow TOD posters know, you don't want to get me started on this....
Comments? Yes, the absolute blindness and lack of reliable information is a crisis in itself, even exceeding the possibility of immediate peak oil. It is simply impossible to get investment and to promote real decisive effort and implementation in an environment where underlying assumptions are nothing but guesses. The statistics and graphs of Khebab, Standiford and Westexas are better and more involved than anything we get from EIA, IEA, USGS, OPEC and CERA, the normally accepted "authorities" in the oil information business.
But, we have to be VERY honest here. The statisticians here at TOD do begin with a framework, i.e., a belief in the absoluate validity of Hubbert Linearization, and a belief in Peak Oil soon. The statistical picture seems to bear them out, and we know that Hubbert beat the USGS once before, in the debate concerning U.S. peak. Let's also be honest, the accepted authorities listed above find the idea of world peak followed by decline too hard to easily accept. The implications are just too great to easily factor into a conservative organization evolution not revolution mindset.
What we see is a statistical picture of a plateau, and no easy explanation of how world oil production can possibly rise at the rates needed to match the projected demand, as given by the accepted authorities.
What we CANNOT see is equally or even more important: What exactly is causing the "plateau", and the motivations and information known only by the producers.
I ask, no, I BEG anyone looking at khebab's excellent and hugely informative charts and graphs,
http://www.theoildrum.com/uploads/28/LogisticAndTypeII.png
( I am saving those for future reference, great work and need more time to ponder!) to look back at the 1978 to 1982 "big valley". I know, I know, I hate to have to be the one to bring this up again, but it proves once more that, how can I say this politely, o.k., no caps, but: Production tells us nothing about geological peak!! It just doesn't!!
We are seeing a plateau, yes, but nothing like what we have seen before.
We simply must (a) get more information about why we are seeing a plateau and what the real geological production situation is, and (b) diversify and "case harden" our energy situation NOW. Given the lack of information and the complete blindness we are running in, we have to assume that the absolute worst is possible. We must confront the fact that there are few "good" scenarios. Either we are seeing the real onset of geological peak soon, or we are now completely subjegated to forces capable of controlling, abusing, and manipulating the energy supply to the effect of disruption/destruction of the economies of the modern industrial nations. Either way, reduction of crude oil/natural gas consumption and development of storage, alternatives, backup systems, and distributed and diversified energy production methods and renewable energy becomes the absolute priority item for the continuence of our national security, prosperity and dignity.
This could be the "real" catastrophe, the peak. Or it could be 1978 all over again, and we are being misled and controlled, only now to an even greater and darker purpose.
It doesn't matter, in the grand scheme of things. The fossil fuel age is coming to an end, because, whether there is plenty of fossil fuel out there or not (again, we can't know) it simply MUST come to an end.
Soon, the National Petroleum Council is to release a major report on the energy situation. This report will be one last chance for the energy industry and the so called "experts" in the field to deliver REAL and VALID information and to come clean about what we know and where we stand. It will be interesting to see if they can deliver the kind of involved and informative work that Khebab, Standiford, Westexas and others have delivered here, and give us the forward visability we need to make decisions ad progress along the road of national security and prosperity. This report must NOT by a thin whitewash, or the credibility of the NPC, built over many decades, and the energy industry will be destroyed completely and finally. The very future of the United States relies on this.
Thank you. Roger Conner known to you as ThatsItImout
Hothgar's right about this one, we need a replacement for the internal combustion engine burning fossil fuels, and electricity looks like the winner for transportation. Alan Drake's plan is too conservative in its reach and estimates if anything-I believe we could painlessly replace a much larger portion of our transportation energy with electricity, and transportation makes up about 80% of the useage.
And the underlying reason for ceilings in use of any natural resource is population. My grandparents were born in a world with 800,000,000-1 billion humans. Its 6 1/2 billion now, expected to reach a peak of 9 billion by 2050. So folks, use contraceptives! I had a vasectomy after 1 child, and I'm sure glad ! I can afford him, and he's going to be a prosperous person unless the world totally collapses.
So now I'm done preaching to the choir.
Bob Ebersole
When is that NPC report coming out? I want to make sure and see all the comments here that day.
http://www.npc.org/NPC_pres_v26-102606.pdf
I agree with almost all of your post. My biggest worry is not that there is no path forward in an energy depleting world. My fear is that not enough people are willing to choose one of the few paths available. We as a nation and species are being consciously bull headed and childish in our inability to face reality. The time to change behavior is before a looming catastrophe, not afterwards when you have no choice.
Smart people take shelter from the storm when it is approaching. They don't stand outside debating if it will turn at the last moment, or not rain on their heads, or knock a tree down onto them. They see the storm recognize the dangers and take action to minimize those impacts, even if those dangers don't happen each time.
We are not doing any of these actions with respect to peak oil or climate change. We are just figuratively standing in the field looking up at a tornado saying "gee I wonder what might happen?". I don't think most of us are smarter than yeast.
Anyone aware of a study that takes into account the EROROI
(I know I got the acronym wrong!). Basically, as I understand it, post-peak production does not include the increased oil used to get that production, so the "net free oil" is falling off even faster.. Any thoughts/comments?
Flakmeister
Gas is different. Its used for heater treaters and occasionally for pumps, reinjection and gas lift for oil wells. But, Khebab is modeling oil and condensate production in this post and gas is irrelevant.
Welcome to the site!
Thanks as always for the hard work. A serious question about the use of the Hubbert-type curve for the Type III countries, though. It seems to me that you are substantially over-estimating the remaining production for these countries using the HL method. Your approach "stacks" the high depletion countries, most of which have just recently peaked, near the present time. If you consider the net HL curve for the Type III countries to be a sum over individual Hubbert curves whose widths are getting narrower with time, the summed curve will be asymmetric, with the downside much steeper than the upslope.
To see hints of this, first note that the type III Hubbert curve of yours predicts 400 billion bbls left to produce. Yet, if you go through the ASPO archives and add up their predicted remaining to produce for the countries that make up 75% of the type III current production (US, Venezuela, Mexico, Kuwait, China, Canada (conventional), UK, Indonesia, Norway), ASPO's predicted yet-to-produce is under 200 billion barrels. I can't imagine that the small producers that make up the remaining 25% have 200 billion barrels left - they are already past peak! More likely, the have less than 50 billion.
Alternatively, and more directly, the sum of your URRs (countries that have yet to peak + countries that have peaked) is 2.4 trillion barrels, but the HL prediction for all countries together remains in the 2 billion barrel range.
In short, you're too darn optimistic. The type III countries will deplete much faster than your Hubbert approach suggests...
However, the converse is observed, the upslope seems steeper (see Fig. 5).
Re: Yet, if you go through the ASPO archives and add up their predicted remaining to produce for the countries that make up 75% of the type III current production (US, Venezuela, Mexico, Kuwait, China, Canada (conventional), UK, Indonesia, Norway), ASPO's predicted yet-to-produce is under 200 billion barrels
Don't forget that I used CO+NGL, the ASPO definition of regular oil does not include NGPL hence some of the observed difference.
Re: the sum of your URRs (countries that have yet to peak + countries that have peaked) is 2.4 trillion barrels, but the HL prediction for all countries together remains in the 2 billion barrel range
It's more than 2.0Tb for CO+NGL, Stuart's estimate:
URR is 2250 ± 260gb
Therefore, I'm within the upper range of his confidence interval.
Now, my question:
How you estimate URR for TypeIII group?
It seems like you came up with your own numbers and not based on others or did I miss something?
- We are now adding more small fields, since our recent finds tend to be small. These small fields deplete faster than the huge fields.
- Horizontal drilling and other recent techniques seem to keep up production longer, but once the water level reaches the level of the horizontal drilling, or other limits of the new tecnique are reached, there is a precipitous drop off.
If we are not getting symmetric production curves in the North Sea and in Cantrell (and quite a few other places), I don't think we can expect the overall production curve to be symmetric. I think the model can give us a false sense of security regarding the relative slowness of the drop-off in production post-peak.IEA data is showing OECD Europe production off -8.2% compared to a year ago, through August 2006, and OECD Pacific (primarily Australia) off -7.6%. US production is off -4.5% through August in the IEA data. These declines are a lot higher than the -1% or -2% the model is forecasting.
However, a few years after that, as the youngest fields are flat and all but the youngest are in decline, the fall-off can be sharp.
Alan
World demand has in the past increased around 2%/year, as you say, a bit less in the us or around 1.6%/year. However, demand is a little elastic, and meanwhile the world does not demand more than is supplied, so the price rise over the past couple of years has depressed demand in many coutries, not least the us, up only .3% in 05, and actually down 1.5% through the first 7 months of 06, in spite of good gdp growth plus 1%/a population growth. (Naturally the rest of the world will do what it must to accommodate rapid growth in china, where much energy must be consumed to fabricate the world's products.)
My point is that most of the world has so far managed ok with a plateau and rising fuel prices, and may therefore do ok with a gentle decline in production. Note that the sharp political cuts in the seventies came without warning and followed a period of very rapid incrases in consumption. The present epoch has many people talking about (many denying) po. If the peak is in fact here it is plateuish rather than spiking down, prices are directing thoughts to substitutes, and substantial substitutes are already in production, eg canadian and venezuela tar sands and ethanol, just as any self-respecting economist would predict. True, these might not be scaleable and eroei is anyway poor, but much else is happening in the energy world. Imagine talk of nukes by environmentalists and solar by investors! (Nukes for base load and solar for a/c peak load is a perfect combination.) The hidden hand holds hands with necessity, mother of invention...
As an aside, there was little technological progress before the industrial revolution, powered not just by cheap energy but also the patent office.
Ignoring CO2 in the air, wars for oil, pollution, fish stocks going down....yup the world did fine on the way up. I'm sure the world will do just fine on the way down with fiat currencies, CO2 in the air, wars, fish stocks collaping, pollution and the accetance of a declining lifestyle as measured by energy onsumption.
Actually our "fiat currencies" are a real issue as we face first no growth then negative growth in the World Economy.
They are quite tied to growth with relatively short periods of debt unwinding. I've seen nothing to indicate our current monetary system is up to the task of dealing with a ever slowing economy.
In fact my interest in Peak Oil is only to determine when we hit this long down slope and its steepness. I don't think you need to run off and live in the woods today but once we are for sure spiraling down it will be time to decide where to hole up fore a few decades at least.
If you read back on how some Jews in Germany dealt with WWII is obvious that you need a some money and you need to decide when to jump before things get too bad.
I think its time to be prudent, sometime after peak oil we will suffer a major financial crisis as the world adjusts to the lack of growth. This crisis is the real danger of peak oil.
Finally remember the vast majority of us don't live by definition in the places that will be the best place to be post peak so chances are you should have several exit strategies in place depending on how the economy moves.
I don't think this is doomer speak just we have every indication that in the next 20 years will will probably face the worst set of crisis to hit in the 20th century.
1.) Population growing
2.) Food production declining
3.) Potable water declining
4.) Oil declining
5.) Globalization wrecking local economies
6.) Crumbling infrastructure
7.) Concentration of wealth and declining middle class
8.) Radical Islam
9.) Ugly resource depletion politics
10.) Global Warming
On the plus side we have.
1.) Maybe someday cheap solar cells
2.) Maybe someday high energy density capacitors/batteries
3.) Window power
So at best its 3-10 and the three is dubious.
Electrification of transportation is already feasible, and cost-effective through rail now, and through battery electric vehicles at oil prices above $100 (and dropping). In turn, the question is how quickly electrification of transportation, through rail and EV's, can be accomplished.
GM just embraced EV's, at least at a PR level. Toyota is gradually electrifying it's whole fleet via hybridization. It remains to be seen how quickly the industry will convert, but it seems clear that it could be done quickly (in well under 10 years) in a WWII kind of effort.
The sooner we start, the easier, cheaper and less painful it will be.
Alan
Thanks,
Mike
However, I suspect the picture isn't quite as dire as WT tried to paint it to be. But its easy to be selective about your presentation to make a point. His point is that oil production peaked last year, my point is that oil production wont peak until 2012 before a very gradual decline sets in over the rest of the decade.
"Your point" is not supported by any VALID data that I have seen. Wishful thinking supported by troll-like behavior seems to be the source of your estimate.
OTOH, Robert Rapier has a slightly closer in date range than you and he uses the same basic database as WT. The mutually acknowledged flaws in the public database allow for a range of estimates. Those two had some epic debates on TOD that were educational for all.
Your lack of respect on TOD does not come from your conclusions but from your methods, including a lack of civility and an unwillingness to learn (three times you have used re-injected natural gas, much of it in Alaska, to "prove" that US Natural Gas production has just recently peaked).
I have found flaws in his analysis (which he noted and accepted) but I did so in a manner befitting TOD. He asked me to contribute to his Dallas Morning News editorial after I critiqued his work so there certainly no hard feelings.
You managed to chase off WesTexas, who has contributed several important concepts. ELP as the best personal survival strategy, the Iron Triangle to explain institutional support of PO denial, Export Land as a model for when Peak Oil will begin to bite our society are all his ideas.
A major loss for TOD :-((
Alan
I offered you a chance to make a significant contribution to TOD and the overall study of Peak Oil; dealing with non-transportation oil uses. A nearly virgin field AFAIK.
However, promoting your wishful thinking agenda was apparently more important.
This is a professional grade site, with standards that exceed most "think tanks". The peer review is brutal but civil if one is making an honest effort. WT tried multiple times to help you upgrade your analysis; but that was not to be.
Good night.
What? Tell me you're joking. Do you know for a fact westexas is really gone because of Hothgor's posting?
Say it aint so westexas!!!!
I am also not sure what we need better batteries for. We will never store significant amounts of energy in batteries. On a massive scale hydroelectric dams are by far better. And we can make large amounts of hydrogen with thermal hydrolysis. Inform yourself.
Your example of Jews in Germany is tasteless and ignorant, at best. The problem to those people was not "when to jump" but that they had no place to jump to. The US wouldn't take them, neither would Switzerland or any other country. People were looking away and ignoring the problem.
Shame on you for this poorly chosen example.
I am old enough to have heard this claim over a dozen times. I pay as much attention to such claims as I do other scam artist claims. "Albert Drake died leaving $6 million without any relatives or a will in Nigeria. Please help me ..." = "Small company makes MAJOR breakthrough in solar cells that will drop price to cheaper than ..."
Alan
And its even better then the new CIGS panels that are touted in silicon valley these days. It's smaller, more efficient and cheaper to boot!
Alan
Hothgor is giving is a formidable demonstation of:
(Bogus info/assumptions) + (well-articulated, internally consistent reasoning) = Bogus conclusion
Particularly in exchanges with credible contributors such as westexas and AlanFromBigEasy.
westexas has departed becuase of this it seems. I cannot read Hothgor's postings as anything but malicious intent to mislead and disrupt.
A couple years ago, a poster, "mc" as I recall, was using PO and TOD as a sounding board for anti-semitic remarks. If he's gone because the Editors blocked him, I think it's high time the same was done for Hothgor.
The energy crisis has been cancelled! Close TOD. Everybdy go home.
And, if one figures the amortized price of, say a $30,000 system vs the ~0.10/kwh price of electricity from the power company, the system will never pay for itself since the interest more than eats up any advantages.
Solar and wind may 'already be here' but they remain insignificant to the overall energy system and especially to the average Joe who wants his own energy producing system.
I agree - our fiat currencies are a major issue, as oil production begins to decline. It is hard to believe the currencies will hold up, once there is a major drop off in the growth rates of economies.
Also,once banks and other lenders realize there will be a long-term decline in energy resources, lenders will be reluctant to make long-term loans, including mortgages. This, by itself, will be a major disruption to economies.
Looks like nobody picked up on it so I will.
Don't know where you been for the last six years but I've been in the 21st century. -:)
A tin foil hat comment is a pretty reasonable reaction to the term "fiat currencies" since this has been a Goldbug obcession since the demonetisation of gold by Roosevelt in 1932.
An occasional joke or slight degression really doesn't hurt anyone, and we're addressing a rather dry topic with mind-numbing graphs and calculations, at least to this mathematicially challenged landman.
I hadn't realized "fiat currency" had been added to the "must not dispute list".
Usually it means that certain commenters are absolutely certain something is true, even if they can't actually prove, or sometimes even define, it.
GDP is a notional number that has been totally defaced by economists. It had troubles from the beginning because it was designed as a stopgap set of indexes to measure "output" during wartime. It is not double column accounting because it does not substract asset losses (For example, a barrel extracted in TX goes to the plus column but it is never taken away in the minus column since when the measures were designed Crude was considered virtually inexhaustible and is considered categorically as "rent" from land. Credit is added to the asset column without ever having a chance to visit the minus column unless somebody goes broke. enormous amounts of credit are channeled to non-productive consumption and therefore should not be counted as pluses... i could go on but i would summarize:
GDP = Bogus numbers.
That is not any different in corporate accounting. Loans are counted as positive cash flow and increase valuation. And is some sense that is actually correct because one assumes that ALL cash flow will (and should) be used to re-invest into the business to grow it. Succesful corporations demonstrate that this is a correct strategy.
Apart from that, GDP has some problems that go far beyond accounting. For one thing, GDP corrected for labor cost or Purchasing Power Parity (PPP) is far more important than GDP alone. One can see that in China which has a rather mediocre GDP but is only second to the US in PPP. And since PPP is so high in China, it can build complete modern cities from scratch and talk about flying to the moon without overstretching its financial limits. How powerful a nation is, is far more a matter of PPP than GDP. And in that sense, China has three legs up. Or some 1.4 billion....
re. our good gdp growth
If "The GDP of a country is defined as the market value of all final goods and services produced within a country in a given period of time. It is also considered the sum of value added at every stage of production of all final goods and services produced within a country in a given period of time." (Wikipedia definition)
GDP will rise even if the net transfer of physical goods or services is constant because of inflation.
I guess I'm trying to say that the USA can have a positive GDP number even when the real economy is contracting if inflation isn't accounted for.
I'm not an expert on GDP or how inflation is accounted for in the government statistics so if I misunderstand it I welcome anyone to set me straight.
Regards,
Gunga
"real GDP": Value of goods+services after "inflation"
Inflation: Decrease of purchasing power of Dollar
Measure of inflation: Here it gets tricky, very tricky...
Please consult the following link to get an idea of what we are dealing with:
http://mwhodges.home.att.net/inflation.htm
Looking at the 06 post winter months of april thru aug, US consumption is down 1.75% yoy. So, it looks as if the reduction is accelerating but not winter related... or was, before the recent crude price decline.
So, I stay with the thought that the US can tolerate the prices that will reduce consumption ~2%/year without going into recession. The US has enromous potential to reduce consumption, and will do so when the price is right.
Separately, the following shows that the rest of the oecd is also accommodating chinese and other emerging markets' increased demands. Many think the rich countries will outbid the poor ones... actually, it is the fast growing countries that are outbidding the slower growth ones.
2005 2006 Mb/d Change
Q1 Q2 Q1 Q2
OECD
US 20.85 20.65 20.38 20.51 -0.305 -0.015
US Te.0.35 0.37 0.38 0.37 0.014 0.039
Can 2.36 2.24 2.18 2.15 -0.135 -0.059
Mex 2.04 2.11 2.08 2.01 -0.032 -0.015
Aus/NZ1.04 1.06 1.06 1.06 0.010 0.010
Japan 6.00 4.94 5.96 4.78 -0.098 -0.018
Korea 2.40 2.07 2.28 2.03 -0.083 -0.037
OECD Eur
Fra 2.11 1.93 2.10 1.89 -0.023 -0.012
Germ2.54 2.55 2.56 2.55 0.011 0.004
Ita 1.77 1.69 1.86 1.63 0.015 0.009
UK 1.83 1.77 1.85 1.83 0.038 0.021
Oth. oecd7.34 7.21 7.35 7.14 -0.028 -0.004
OECD eur15.59 15.15 15.72 15.04 0.013 0.001
Tot OECD50.63 48.57 50.03 47.93 -0.615 -0.012
Non-OECD
USSR 4.30 3.81 4.40 3.90 0.090 0.022
Europe0.74 0.69 0.74 0.69 0.004 0.006
China 6.62 6.89 7.15 7.34 0.490 0.073
Oth Asi8.34 8.71 8.43 8.81 0.092 0.011
Oth 13.83 13.90 14.41 14.48 0.574 0.041
Tot 33.84 34.01 35.13 35.21 1.249 0.037
Tot Wor 84.47 82.58 85.16 83.15 0.634 0.008
Note that this shows the world increased consumption while other eia data shows the world produced less in 1H06 than 1H05. So, in the first half the world was drawing down stocks (explaining teh surge in prices), apparently reversed jul/aug when total liquids soared just past 85Mb/d (explaining the fall in prices). Hopefully, OPEC will fix this.
High prices are not only enough to stop the secular increase in oil consumption but reverse it without a declibe in economic activity.
Longer time periods than a year will give still higher price elasticity of demand. I need to "data mine" the other OECD data.
Thanks Again !
Alan
That is to say, if KSA is losing 800,000 bpd annually, then they have to first come up with 4.8 mbpd total new production annually by 2012 just to stay where they are in 2006.
If we assume a 4% decline rate in existing field, the group II is losing around 1.6 mbpd per year due to the type I decline. It means that a 10mbpd net production increase by 2012 is in fact a 20+ mbpd gross increase!
Basically we have hit the point that without discovery of new super giant field we can't continue to grow the oil supply.
The shear amount of oil we pump today and the underlying geology is the problem. Even if you don't consider peak oil as a serious issue the need to add a new KSA every ten years ensures we are at peak production. And best we have reached a steady state.
Its like a Ice Age at some point despite the vast size of the ice fields the forces adding ice and those removing ice reach a quasi balance. Upsetting this balance requires a major climate shift. We are pumping such a large volume of oil now that we have reached this sort of geologic balance.
To extend the anology furth the big question now is how fast will it melt ?
No correlation as far as I can tell, but ironic nonetheless:
In Khebab's fig. 7 chart, Production from the type II group, if you backtrack extend the future projected 2% growth Red line, by my eyeballs: it appears to hit the x-axis about mid-eighties when Russian output was highest and OPEC was temporarily lowest.
As M. Simmons's said at the ASPO Conf: "Watch Russia!"
Bob Shaw in Phx,Az Are Humans Smarter than Yeast?
Water may be the big show stopper before gas.
My bet though is that sooner than later one of the huge holding ponds will fail or some other major ecological mess will happen. I think this will cause Canadians to move against
the tar sands. Fueld I suspect by a unification of naturalists and anti NAFTA instrests.
On the ecology side that mess is a ticking time bomb.
Many interesting comments to this great job. I am looking for a peak oil indicator, and do not find any in the comments, nor in the rest of TOD.
I tried to find one in the rest of the net, and could not find anything interesting : this article talks about indicators but does not provide any proper one. Could someone point me in the right direction ? Thanks.
My pet indicators are the cheapest products of the "old oil" industry of simple refineries and sweet oil.
With the sour heavy oil's and tar sands NG is used to upgrade the oils and other processing methods such as coking result in a much lower yield of asphalt and fuel oil.
My best bet is that the first real shortages will occur in these cheap products.
There is not much in these lovely numbers and graphs that I find useful to differentiate between a belated peak and a local economic downturn driven by high prices.
My best guess is that we will know perfectly well in hindsight which effort to raise production was the last succesful one. But I dare to challenge the idea that the peak can be forecast from production alone.
I think what can be said looking at this analysis is that we won't have to wait for too long. And for all practical purposes that is a good enough answer. After all, we kept it in our libraries for 50 years.
Any thoughts about Coal-to-Liquids?
CTL is supply side and electrification of transportation is demand side, so I see them happening in parallel. Even with large project size I think CTL's growth is likely to be constrained only by uncertainty about oil prices (now ebbing), and by CO2 restrictions.
It would be great to have someone do a CTL analysis.
In one of my ealier post I showed that building briges today is at best twice as fast as 100 years ago.
I'm sure someone could contribute the rate we can drill oil wells today compared to say 30 years ago. I suspect the time has not changed much.
Technology has not in many cases greatly increased the speed that large projects can be completed so we are not a lot better of than our ancestors.
Effective CTL even ignoring the C02 issue is a massive project. If you compare CTL vs adding more coal fired plants to support electric transport then its a no brainer.
Even with this adding enouh coal fired plants to offest NG declines over the next few years will be dicey at best.
Now I'm not condoning coal fired electric plants but I think at we are to the point we will have no choice but to use them. All we can hope is at least some C02 sequestration will happen.
Wind is ahead of coal for new generation, at the moment, and with a little luck and good public policy will stay ahead.
http://www.prosefights.org/oil/oil.htm
http://www.walmart.com/catalog/product.do?product_id=759906
Most of the countries that you list with 0.00 bbl production have actually a current production of >0.01 Mbl/d, a few quite significant above that:
(All data pulled from either the CIA Factbook http://www.cia.gov/cia/publications/factbook/index.html or the eia website http://www.eia.doe.gov/emeu/cabs/contents.html )
Germany: 162000 bbl/d (60% NGL)
Japan: 120000 bbl/d
Netherlands: 95000 bbl/d
Visegrad (Poland, Czech, Slovakia, Hungary): around 100000 bbl/d combined
Bahrain: 75000 bbl/d
Cuba: 72000 bbl/d
Pakistan: 62000 bbl/d
New Guinea: 50000 bbl/d
Turkey: 43000 bbl/d
Bolivia: 42000 bbl/d
Balkans: 41000 bbl/d
France: 21000 bbl/d
Burma: 18500 bbl/d
Austria: 18000 bbl/d
Chile: 15000 bbl/d
The rest seems indeed below the 0.01 Mbl/d threshold.
(Data are either from 2003,2004 or 2005)
Together these countries still produce over 900.000 bbl/d Crude Oil + NGL, certainly a too large number to be completely ignored.
recent speech that world energy demand will
incease 70% by 2030. Andrew Mckillop pointed
out in a recent article in Petroleumworld that
the earth added 75 million cars along with 75
million people in 2005. In the short documentary
called Oil, Smoke, and Mirrors,(available on the
net) Richard Heinberg posits that 9-11 may
indeed have been an inside job to foment hatred
towards the people whose nations are in the
unfortunate situation of sitting on top of our
resources.
I've never posted here before, and have much
admiration for those dedicated to getting to
the truth on the supply side. It's ominous.
The demand side is stupidity.
This article is fantastic in it's depth and the graphs look really cool (!)
I'm doing a lot of reading on this subject and it all seems a bit depressing. On the one side there are people projecting Chinas growth as a world power in 30 years and hundreds of millions of new SUV cars on their roads and on the other we have gloom and doom. These are polarized views: BAU vs Peak Oil has happened or is about to.
I'm afraid that people won't make any changes in their lives or the policies that they will tolerate from their elected governments until they have been hit squarely between the eyes with an effect of sorts.
Therefore even though the graphs may show a production decline and the globe may be gripped by a strong recession people will still not accept the peak oil thing as it's just too shocking. It's only going to be the 2nd or 3rd major recession in quick succesion that will make people realize what is happening -it's then the panick may set in.
Has anyone done any work on 'Peak Oil' in terms of an S-Curve for the publics recognition? It has taken Global Warming, what 20+ years to become 'mainstream' -to bridge the gap between inner circle gossip and we have to do something about it. Even now there are die hards who don't believe it.
Great Site, Nick.
Sharon Epperson at the NYMEX has less knowledge about the energy markets than my freshman in college son. She is a total embarrasment to the reporting biz all she does everyday is try and jawbone the markets down. She sounds like a freaking parrot. Highest Inventories in 5 years.. Highest inventories in 5 years...
Everyone knows what is going on but the stalwart camp of denialists at TOD...
OTHO, thru aug, eia thinks 06 prod is down around 130k/d from 05... Well, now, that sums to 36Mb, or maybe $2,000M... wouldn't somebody have wanted to produce and sell some of this?
WOuld you care to make a prediction of your own? You go quiet when production is down, loudly trumpet higher production, and are clearly in the post 2010 camp. So, do you think that 06 will produce more than 05? Too close to call? As an aside, would it mean anything if 06 is in fact lower in the face of record prices that have been steadily rising for six years? Would it change your views?
Well, then, how about 07 vs. 06? You really won't earn many points by posting past data that conforms with your views. OTOH, if you publish your views of the future, which is essentially here, you might amass great credit...
This renewed speculaton is occuring at at time when USA winter temps 'til April are forecast to be far above normal ... partly thanx to el nino. This indicates a surplus in heating oil.
Prices in the 50's will be with us most of this Winter. With Q3 data at hand, it is inconceivable that 2006 supply would be lower than 2005. Your comment that i "go quiet when production is down" is ludicrous. Production has not gone down since 2002.
Further, i "am clearly in the post 2010 camp" because the Depletion Scenarios that we publish at TrendLines have all 12 Modelers currently showing that outlook.
http://trendlines.ca/economic.htm
Spot oil fell another two bucks today. The ridiculous notion of a peak prior to 2010 has lost its lustre under scrutiny. In light of the bottom-up studies, i would consider any downturn in 2006 or 2007 a mere hiccup on the way to 100-mbd. We have has nine others and nobody got concerned except Hubbert, Campbell & the misinformed...
Over time I have realised that it just is not going to pan out like that. It will be a long slow affair in which alternatives (renewable and non-renewable) are found and in which conservation plays a big part, all driven by market forces. Sure, we will hit peak and eventually run out entirely. It just isn't going to happen as quickly or as dramatically as the PO community thinks.
If you look at the (excellent) graphs in this article, but ignore all the detail and the explanations and instead just concentrate on the general shape of the global production graph what do you get? I get a bell-shaped curve which peaks around 2030 at about 95bopd. I completely fail to understand how anyone can make a case that a graph that has been rising sharply just about every year since 1980 is suddenly going to go flat, never mind decline.
A case can be made for a 2010 Peak, but not beyond that.
Alan
Don't get me wrong - I think the human race is in deep shit for all sorts of reasons, mostly summed up by the artificial increases in carrying capacity made possible by fossil fuels. We are heading for a sticky end one way or another and the sooner we have to face up to it the better.
I also don't see peak oil as the big turning point, because CTL and GTL will keep liquid fuels flowing in a way that won't greatly impact the global economy. BUT, these technologies are much more carbon-intensive and will progressively accelerate our CO2 emission problems.
What happens if you add Chris S's numbers for planned oil projects? Seems like you could predict the supply increases for the next five years.