The Auto Efficiency Wedge
Posted by Stuart Staniford on February 11, 2007 - 10:28am
ED by PG: This article was originally posted December 20, 2006. Note that it has been resubmitted to reddit and digg this morning, so do help spread the word and give Stuart some more readers if you are so inclined. Send the link to someone today.
I'll be reasoning mainly by looking at what we did in the 1970s, which was the last time we faced severe energy constraints that bled through into requiring a demand side response.
To begin with, let's refresh our memories about the history of oil prices, which tells the story of the oil shocks quite well.
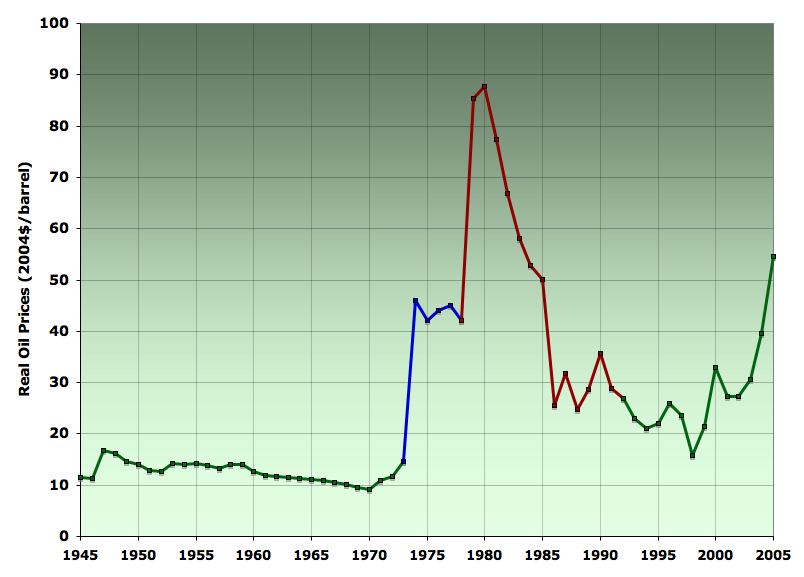
In this graph, like most in this piece, I've adopted the convention of coloring 1973-1978 in blue. 1973 was the Arab oil embargo: the first oil shock. From shortly after the end of the second world war (in 1945 when the graph starts) until the early 1970s, prices were low, stable, and declining in real terms. The Arab oil embargo in '73 caused a very rapid quadrupling of prices, and they have never been anything like as low or stable since then.
I've also colored the period 1978-1992 in red. 1979 brought the Iranian revolution, shortly followed by the Iran-Iraq war. Prices doubled again from the mid-seventies values, and stayed high, though steadily declining, through about 1985. By 1986, prices entered a new regime of fluctuating in the $20s and $30s until the runup in price of the last few years (which I believed to be probably caused by the onset of a plateau in global production).
As we'll discuss below, 1992 was when the period of rapid fuel economy increases initiated by the oil shocks ended.
Let's now look at how total gasoline used in the US evolved in response to this history.
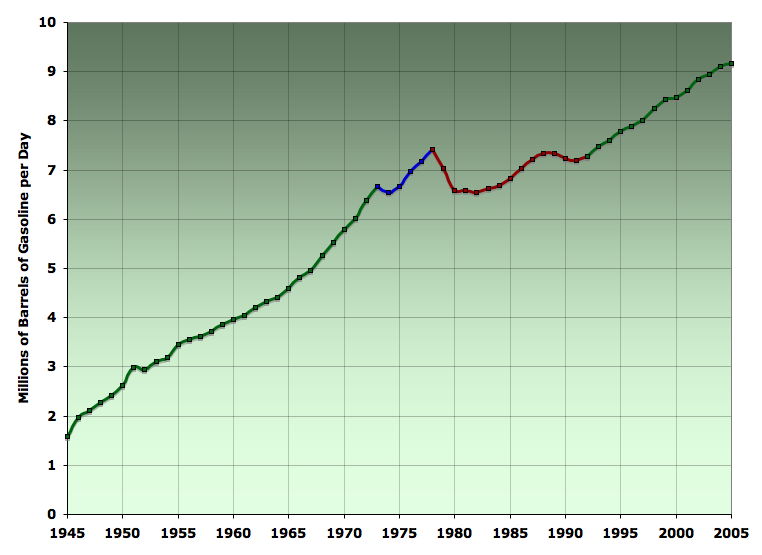
We see strong and steady growth prior to 1973. 1973 saw only a minor blip downwards, but growth rapidly resumed. However, following the Iranian revolution, gasoline usage dropped sharply, and then began growing again only very slowly and hesitantly, and did not exceed the 1978 value until the 1990s. Since 1992, gasoline usage has been steadily increasing, though at a slower pace than in the 1950s and 1960s.
It's useful to decompose gasoline usage as a product of two things: the total amount of miles driven, and the fuel efficiency of the vehicles doing the driving. Miles driven is mainly a function of the physical layout of society (where houses, schools, offices, factories etc are located, and thus how far people have to drive to get to them), and human behavior (how often people decide to go to a particular destination, and whether they choose to go alone, share a ride, or to take some form of transportation other than driving). Fuel efficiency is mainly a function of vehicle technology, with a small component of driving behavior mixed in (we'll see an example of how small below).
Here is the total number of miles driven (expressed in billions of miles/day) in the US on all roads by all vehicles. Again we are looking from the end of WWII until last year.
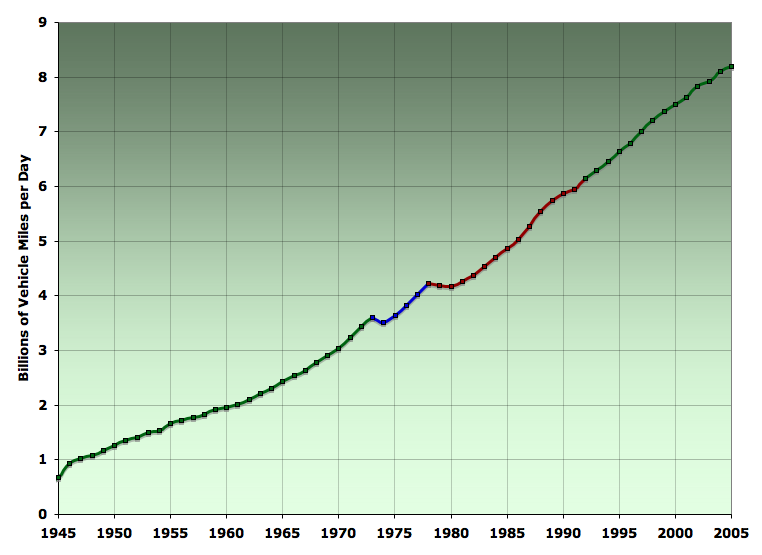
The oil shocks made rather less impact on the human behavior and land use components. VMT only dipped down very slightly, following each increase in price, and then resumed growth quickly, even when prices stayed high. We can see this more clearly by looking at the changes in VMT on a year on year basis.
As you can see, the effect of the Arab oil embargo was essentially gone after 1974: growth in VMT resumed at about 5% per year in the mid seventies, much as it had been in the fifties and sixties. This is despite the fact that prices did not go down again in 1974, but stayed at the $40 level ($2004) through 1978. However, 1978 caused a more profound transformation - miles only actually shrank in two years (1979 and 1980), but growth was depressed for several more years after than, and didn't reach the 5% mark again until the late eighties. It has been consistently lower than that since (which I discuss below). Anyway, the second '70s oil shock drove the point home more strongly than the events of 1973 and caused a multi-year shaving of VMT growth (but very little and brief actual reduction in the absolute level of driving).
The fuel efficiency response to the oil shocks was much stronger than the VMT response. The next graph is an approximate estimate of gasoline vehicle fuel efficiency derived by taking total gasoline supplied numbers from the EIA, and dividing them into VMT statistics (corrected for non-gasoline vehicles1). Note that this is not the fuel efficiency of new vehicles supplied, but rather the achieved fuel efficiency of the entire gasoline fleet in actual use that year.
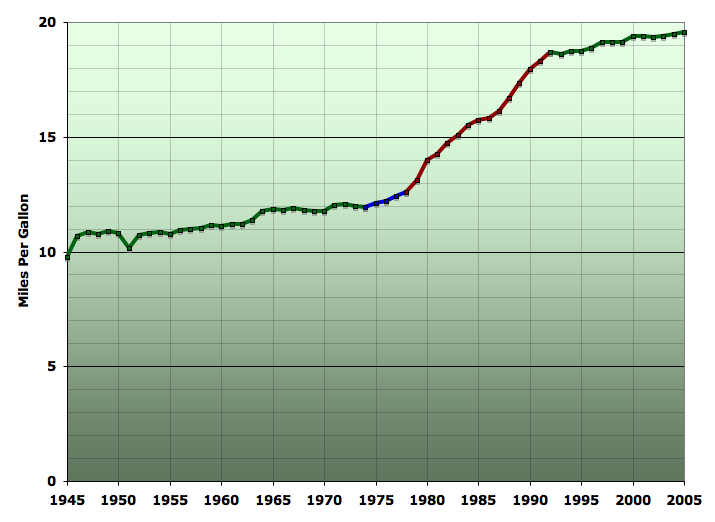
Fuel efficiency was trending up very slowly from 1945, but had only reached 12mpg by 1973. It starts up slightly faster in the blue region between 1973 and 1978, but then really starts to take off after 1978, climbing to almost 19mpg by 1992. Since then it has resumed a very slow rise, similar to the pre 1973 years. It never went down again. Thus the oil shocks clearly caused a large and permanent change in the fuel efficiency of the US vehicle fleet.
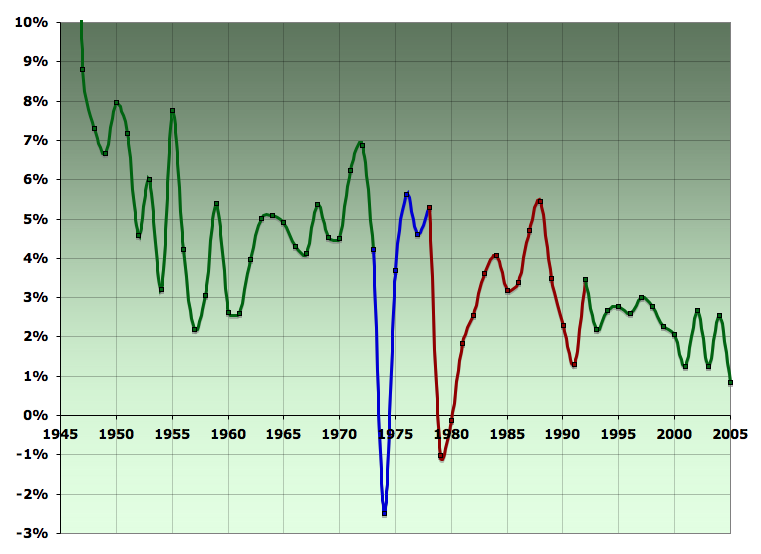
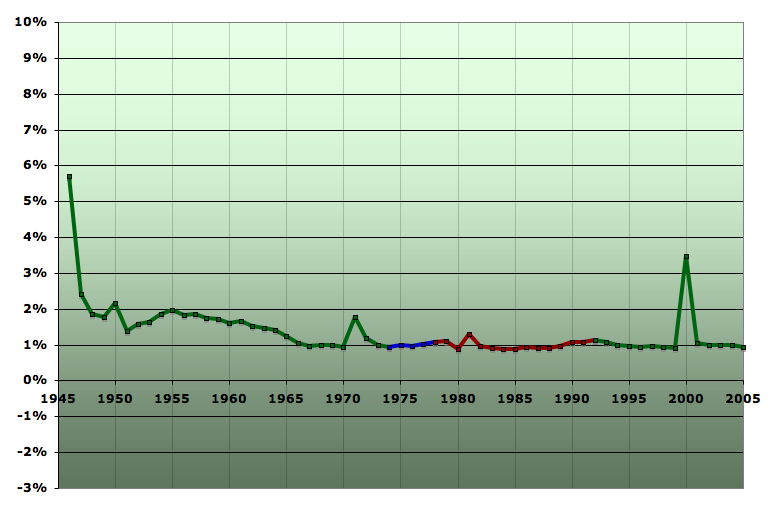
We can see this in more detail if we look at a graph of year-on-year percentage changes throughout this period:
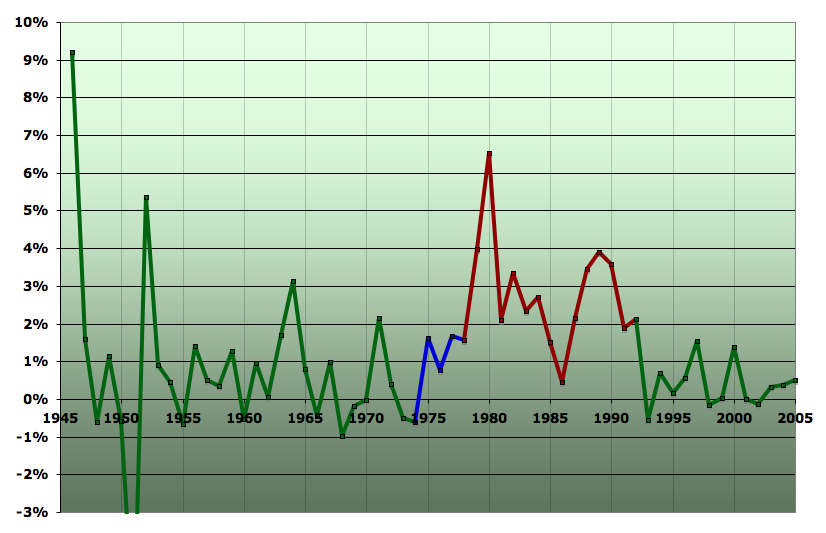
Prior to 1973, percentage increases oscillate generally in the 0%-1% band. Overall, from 1945 to 1973, the compound annual growth rate in fuel efficiency was 0.7%/year. After 1978, increases are much higher, fluctuating mostly over 2%, and reaching a high of a 6.5% gain from 1979 to 1980. On average, from 1978 to 1992, fuel economy grow at a compound annual growth rate of 2.8%/year - a major contribution to the situation. From 1992-2005, however, progress has stalled, with average annual growth of only 0.3%/year.
One thing that struck me as very surprising is the lack of impact of the 55mph speed limit. This was adopted in 1973, and one might have expected it to make an abrupt and significant contribution to the solution. However, fuel economy increases between 1974 and 1977 were only very slightly higher than those of earlier years and it is rather hard to discern a major effect (eg a big spike up in the fuel economy growth rate in 1974 is not evident at all - there is not even a modest response until 1975). Nor is there any sign of a decline in fuel economy when the policy ended in 1995. Overall, I find very little evidence that the 55mph speed limit had much effect at all - presumably compliance was too poor for the theoretical benefits to emerge in practice.
In thinking about the post-peak future, then, it seems clear that the 2.8%/year average growth in fuel economy achieved 1978-1992 has to be taken as a lower bound on what the economy could do in response to high fuel prices. Obviously, the response faded away, but that is clearly not because we are anywhere close to the technical limits of fuel economy, but rather because the price stimulus faded away. There are 50mpg vehicles on the road now that are acceptable to at least some current consumers, and the next generation Prius (available in 2008) is rumored to achieve close to 100mpg while improving acceleration from the present version. While not everyone will drive a Prius, the mix of cars does shift towards compacts and subcompacts when oil gets expensive. And of course, the 2008 Prius is very unlikely to be the end of auto-engineer's ingenuity when sparked by high gas prices. All in all, there seems no reason to suppose that the gasoline powered fleet could not run four or five times more efficiently than the current approximately 20mpg fleet, and probably more eventually. It's just a matter of how quickly we can/will get there.
It is tempting to take the 6.5%+ annual improvement in fuel economy achieved from 1979 to 1980 as a best case for the annual improvement in fuel economy that could be achieved on a sustained basis if we really, really had to. There are some significant uncertainties however that make me uncomfortable with this. Let me outline both those uncertainties before giving my rationale for my eventual choice. With the available data, it's hard to understand in detail how the adaptation that year was achieved - it's a stunningly high figure given that in recent years only 8% of the auto fleet has been sold annually (that is sales of new cars is 8% of the size of the fleet, roughly).
Let's review the summary data. Here's the overall size of the fleet of both cars and light trucks (ie SUVs, minivans, and pickups):
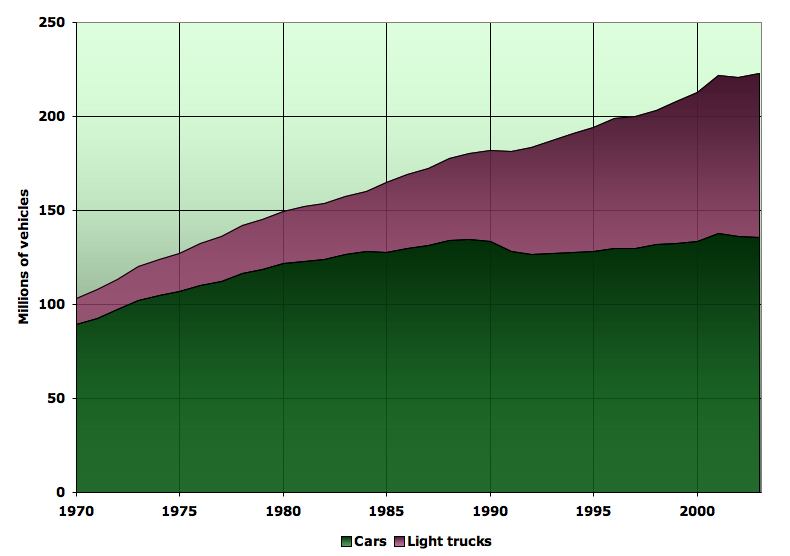
Clearly visible is the gradual secular trend towards light trucks and away from cars. The oil shocks are not a profound feature of that trend. Now, however, let's look at sales, expressed here as a percentage of the fleet size in the year of sales:
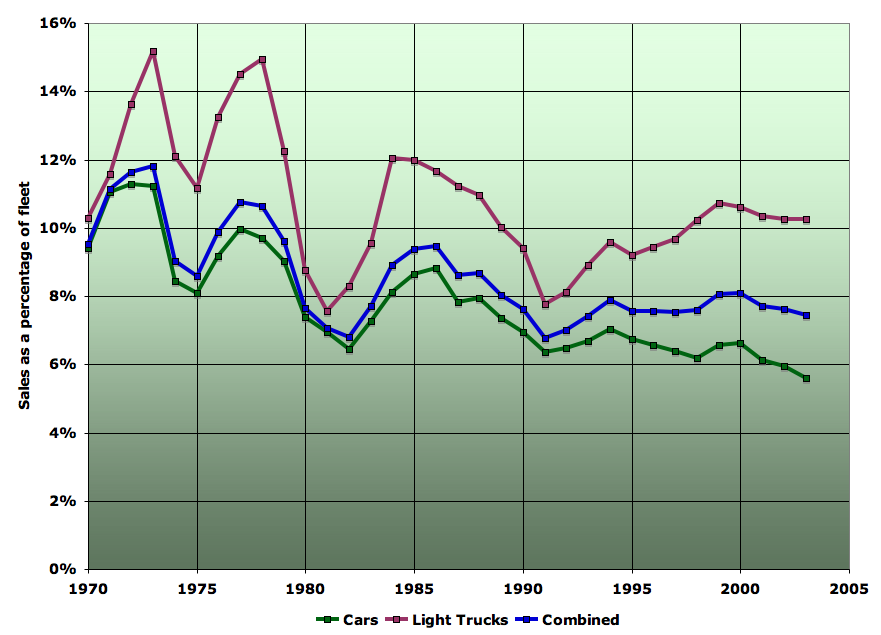
Three things stand out. Firstly, the light truck sales/fleet ratio is higher than that of automobiles, reflecting mainly the fact that the light truck fleet is growing faster. The "combined" line is closer to the car line (since there are more cars in the population). Secondly, in the past, the sales/fleet ratio was typically higher (with the combined ratio being around 10%-12%, versus the 8% in more recent years). Probably this is because cars last longer these days. Thirdly, the oil shocks are clearly visible as sharp drops of several percentage points in the sales/fleet ratio (reflecting the fact that the oil shocks triggered or worsened serious recessions, and car sales go down in recessions).
Since in 1979-1980 the sales to fleet ratio was down at around 7.5%, it's very hard to see how substitution of old vehicles with new could have given rise to a 6.5% rise in fuel economy. To get a better lock on this, we need to understand how many sales went to fleet replacement, versus fleet growth. By looking at year on year changes in fleet size, as well as sales, I came up with the following breakdown into the proportion of the fleet that gets replaced each year, and the proportion that is involved in growing the fleet:
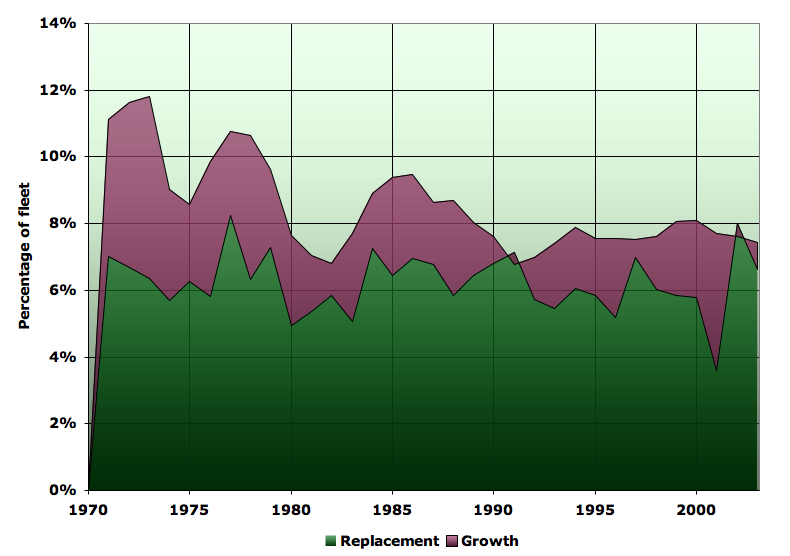
Note that the couple of times the "growth" number went negative is because the fleet shrank slightly in those years. As you can see, the "replacement" proportion is much more stable at around 6% of the fleet (give or take a percentage point), with most of the volatility in the growth line.
Still, this makes the 6.5% fuel economy gain in 1980 all the more interesting, since only about 5-6% of the fleet was replaced in 1979 and 1980. There are two possibilities that I can think of. One is that scrappage mainly affects vehicles that are much worse than the average fuel economy, while new cars bought during an oil shock are much better than the average fuel economy. However, we know the new fuel economy stats, and there's no way to explain all the fuel economy gain this way. So perhaps there must also be internal rearrangement of the fleet. That is to say, high mileage drivers sell gas-guzzlers to low-mileage users, and/or pick the highest-mileage vehicle available to them for longer trips.
All in all, I feel that I don't understand this number well enough to assume it could be sustained. However, I note that in 1979 there was a 4% improvement in deployed fuel economy, and then again in 1989 there was a 3.9% increase. Plus several other years achieved improvents in fuel economy over 3.5%. Therefore, I feel that 4%/year is a reasonable estimate for the economy's sustained ability to improve fuel economy when it's under very great pricing pressure to do so.
Some might argue that there is a case for assuming the post peak-oil the economy will be very different and capable of much larger responses. However, I notice that the replacement rate for the vehicle fleet has been pretty stable at around 6% for several decades and in oil shocks changed only slightly (and that down, rather than up). Thus I think the case for assuming that we can improve fuel economy faster than that after peak oil is poor. (Not that it definitely couldn't happen - the uncertainties are considerable - but it seems unwise to plan on it).
In short, then, after lots of detailed analysis, my best guess for the potential size of the fuel efficiency wedge remains the same as my first SWAG of 4%/year.
To make clearer what that would look like, suppose hypothetically that we began increasing fuel economy at 4%/year starting in 2007 over 2006. Here's the picture:
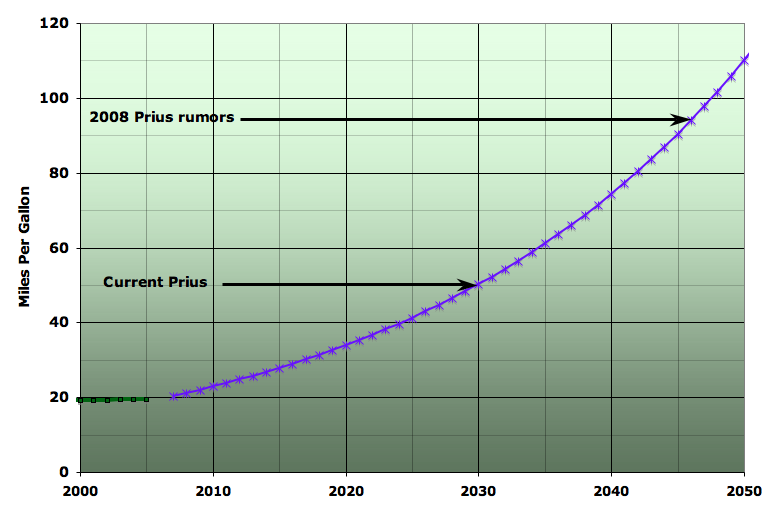
Clearly, it would take sustained major pricing pressure to make people do this. However, I have also put the current nominal fuel efficiency of the current model Prius, and the rumored efficiency of the 2008 Prius on the chart. We wouldn't reach the former level as a fleet average until about 2030, and the latter level wouldn't be reached until after 2040. So clearly, there is no technical barrier whatsoever to a number of decades of 4% fuel economy growth. And that ought to be long enough to solve the large-scale plugin hybrid problem. So I'm quite willing to assume sustained 4%/year increases out past mid-century.
To achieve higher than around 4%/year gains, it seems to me that it is likely market mechanisms would not suffice. The key to going faster would be retiring more old inefficient vehicles and replacing them with new highly efficient ones. Gas taxes would be one method, but I suspect that what might be a lot more politically acceptable is something like a government tax break for people who retire an inefficient vehicle and replace it with one that's at least X% more fuel-efficient (this would create more benefit than the current hybrid tax-break, since it would encourage retirement of bad vehicles, as well as purchase of good ones). However, I cannot currently estimate how cost-effective such a program would be. A more muscular approach would be to create sunset dates for low fuel-efficiency vehicles enforced through the existing smog-testing infrastructure. All vehicles that failed the current fuel economy bar would be forcibly retired, and the bar would be raised each year. It would require considerable political will to create the conditions under which such legislation would be passed.
Next, I'd like to make some more analysis of what is the business-as-usual case from which one should be deducting this as a wedge. For this, we need to go back to the VMT statistics. I would like to now break VMT down into a product of two factors, both growing. The first is the US population, and the second is the VMT/capita.
Let's take population first. It has the merit of being very boring in its behavior:
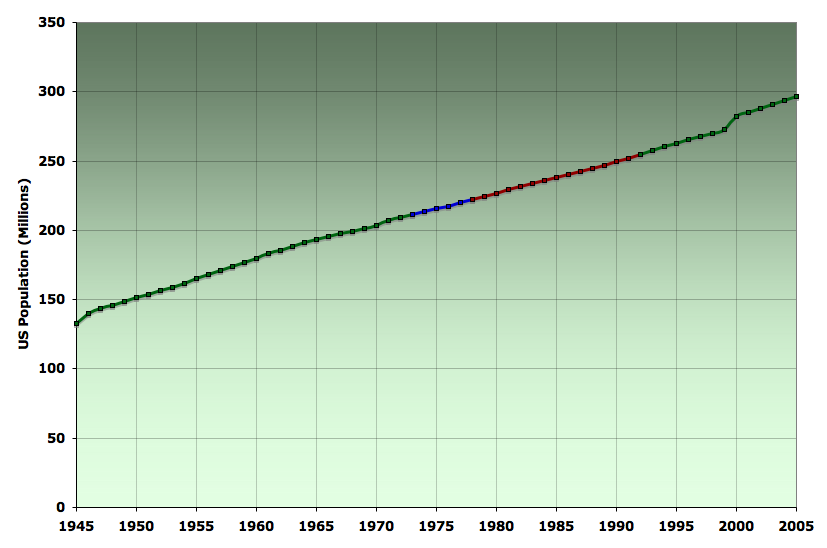
As you can see, with the exception of a couple of anomalies, most notably in 2000, the growth has been very smooth and linear. I have not been able to track down what happened in 2000, but my guess is that there was some change in the Census Bureau's estimation methodology, rather than an actual sudden step in population. Henceforth I will treat that year as an outlier to be ignored.
We can get a more precise sense of past growth by looking at the year-on-prior-year percentage change in population.
Population growth dropped to 1%/year about forty years ago, and has been very stable there ever since. The 1970s oil shocks had no impact at all on population growth, and nor has much of anything else that's happened since about 1965. It seems, then, that any projection other than "about 1%/year" going forward would be rather hard to justify. The demographers at the Census Bureau believe it will drop gradually to about 0.8%/year over coming decades, but the difference seems small enough that I will stick with the numerically more convenient 1%.
If we now divide the population out of the VMT growth, we get the following graph for VMT per person (this is all vehicle miles by all vehicles on any road in the US, divided by every man, woman, mewling infant, etc).
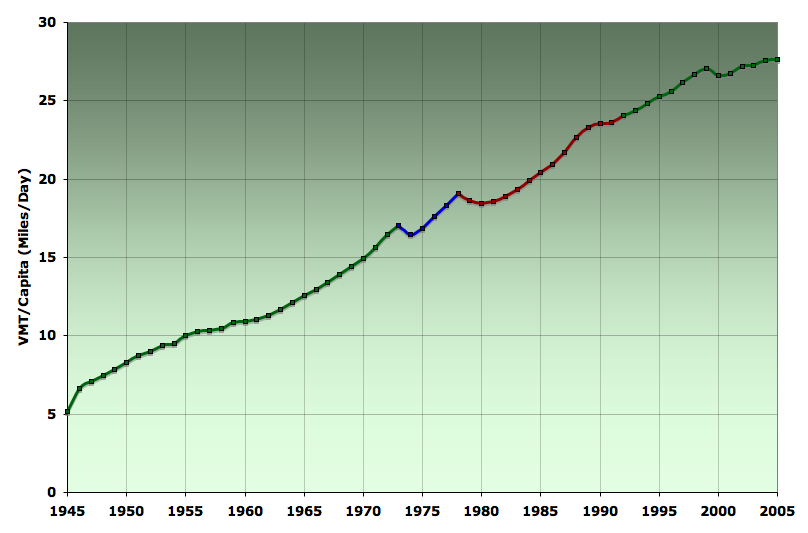
Back in the late 40s, we managed on less than 10 miles of daily vehicle movement per person. Now it's up over 25 miles per person. It was climbing until the last year when high oil prices (presumably) have caused it to level out. The oil shocks in the 1970s loom a little larger in the per-capita signal than in the overall total (not surprising in light of the fact that population growth was completely unpeturbed by oil shocks, so all the effect on VMT comes from the per-capita factor, rather than the population multiplier). Let's look more closely at the year-to-year changes:
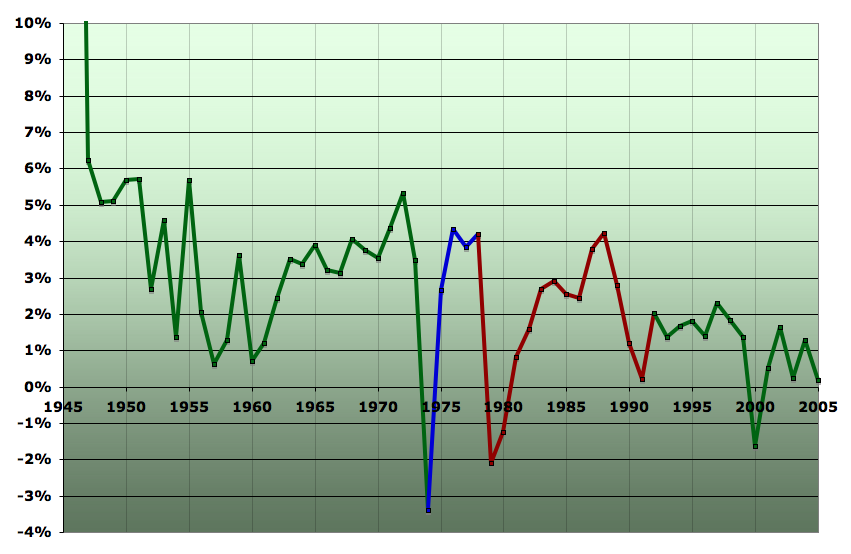
Hmmm. The oil shocks are very visible, but as we noted before, did not have very long-lived effects on VMT growth. The 73 shock (which apparently mostly just primed people to respond to the 79 shock), causes a dip in the curve that is really over by 1975. However, the 79 shock takes several years, to overcome, with VMT/capita growth not back to normal until 1983.
However, there's another interesting and important thing expressed in this picture, and that is that VMT per capita growth was significantly lower in the 1990s than it was in the 1980s, and also in the 1950s and 1960s. To quantify the issue, here are the compound annual growth rates for a couple of regions of the graph:
| Years | Growth |
| 1950-1973 | 3.2%/yr |
| 1973-1983 | 1.7%/yr |
| 1983-1993 | 2.3%/yr |
| 1993-2003 | 1.1%/yr |
What's going on here? The growth in VMT/capita was lower in the 90s even than in the period 1973-1983 when there were oil shocks. This matters because we want to know if this decline would continue in the future even if we had no oil supply/carbon emission problems, or if it would rebound.
Here is likely one piece of the explanation. The next graph shows the ratio of people to housing units in the US. This is, roughly, the average number of people in a household, but also incorporates the effects of empty units, vacation homes, etc:
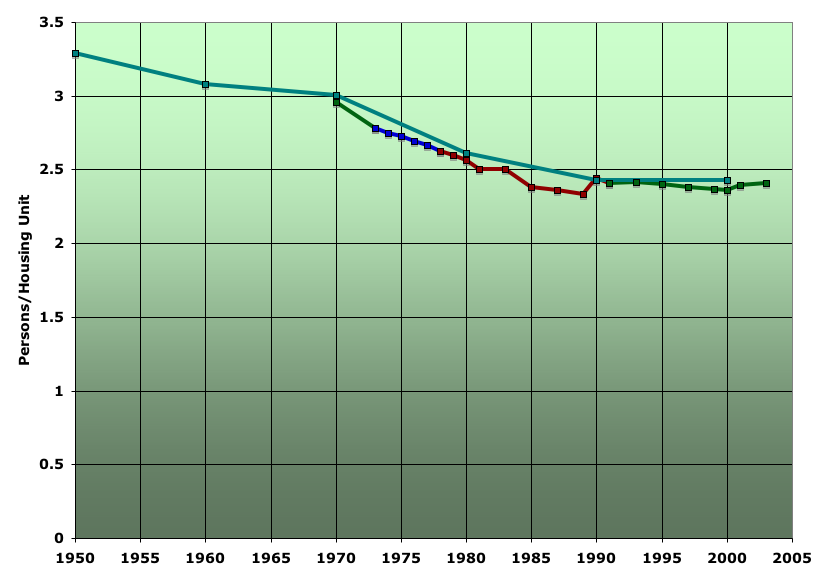
As you can see, people/unit declined steadily from the end of the second world war through the end of the 1980s. This probably primarily reflects the increasing trend towards divorce and the demise of the extended family as a living unit. However, it also no doubt got an assist from more vacation homes. Likely, demographic factors also played a role (from 1945 through much of the 1960s, the baby boomers were kids at home, and after that they moved out). Obviously, to the extent people are spreading out into more housing units, they are going to tend to use more VMT each, though it's not a linear matter (Eg consider a couple with two kids who divorce and get 50% custody. The two kids still only need to be taken to school once each. However, the two small households are likely to make nearly twice as many grocery runs as the one big household. The number of jobs held is likely to go up also, on average).
In the 1990s, people/unit stabilized and has been pretty much flat ever since. This could have a lot to do with the slowing in the growth of VMT/capita. To the extent this is a permanent social change, then VMT/capita might continue to grow at a lower rate in the future (even in the absence of oil/carbon constraints). Another possibility to consider is that people/household might actually start to go up again in the future, especially in the face of a tighter economy; adult children might be slower to leave home, aging relatives might be more likely to live with family as nursing home expenses continue to escalate, divorce may seem less economically feasible, etc. However, given that the seventies oil shocks caused no densification whatsoever, it is probably unrealistic to expect anything more than an extremely gradual rise.
Besides people/unit, another likely factor in the 1990s is congestion. As the FHWA describes the matter:
During this period, growth in highway and mass transit systems in the United States did not expand at the same pace as the growth in travel demand. In the case of highways, total mileage in lane miles increased only 0.2 percent nationally during the entire period, from 8.11 million miles in 1992 to 8.25 million miles in 2000. As a result, travel per lane mile increased on all systems and, in particular, at faster rates on rural routes. While most travel now occurs in urban areas, approximately 77 percent of lane miles are on rural, local-owned highways.Without getting into the debate over whether this reflects a lack of political will to build highways, or the impossibility of solving the problem by building more highways, the effect was that congestion went up:
Presumably, this has a deterrent effect on traveling and has contributed to the slower growth in VMT/capita.
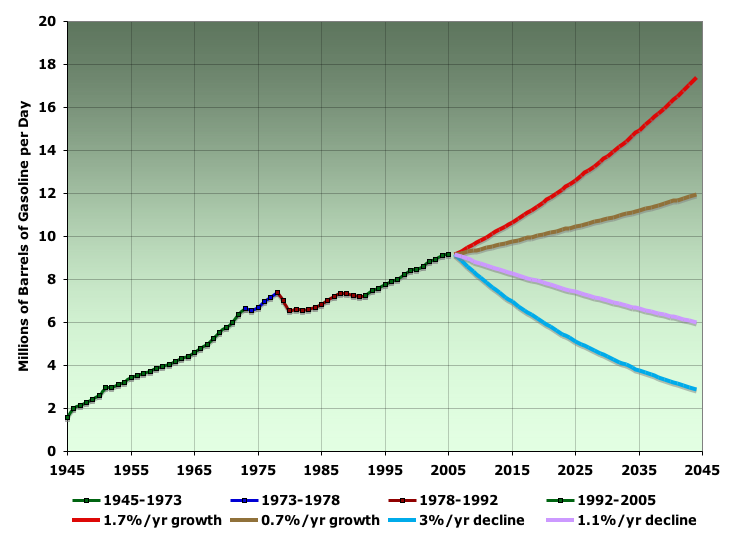
For my purposes here, I am going to assume that "business-as-usual" going forward, in the absence of energy issues, would have been continued 1%/year growth in VMT/capita (cf the 1.1%/yr growth in this quantity from 1993-2003). Combining this with the 1%/yr growth in population, we would anticipate 2%/year growth in VMT. Since, as above, fuel economy has been increasing at 0.3%/year since 1992, our overall business-as-usual in gasoline usage would be 1.7%/year growth.
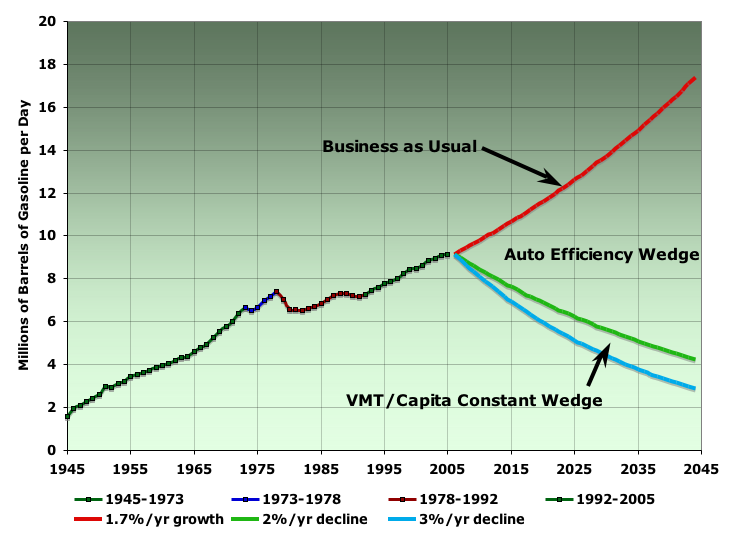
This next graph shows that 1.7% growth in gasoline usage out through 2045 (the end of my expected lifetime :-). I also show what would happen if VMT growth was identical, but fuel economy increases by 4%/year instead of only 0.3%/year.
As you can see, it makes an enormously dramatic difference. The most aggressive scenario on the graph shows what would happen if, in addition to improving fuel economy by 4%/year, we also could hold VMT/capita constant from here on out (instead of it growing at 1%/year as under the business as usual scenario). That's better still, but stabilizing VMT/capita is not nearly as useful as getting fuel economy moving upward as fast as possible.
Finally, to aid your intuition for growth and decline processes a little further, my last graph shows the business as usual and 3% decline scenarios with two different ones in-between. The 0.7%/year growth is what you'd get if you just capped VMT/capita growth but only continued the recent history of 0.3% fuel efficiency. The 1.1%/year decline would come from business-as-usual VMT/capita growth together with 2.8%/year annual increases in fuel efficiency (the same as was actually achieved on average from 1978 to 1992).
Footnotes
- The approximation comes in that it is not straightforward to allocate vehicle miles between gasoline vehicles and diesel vehicles from the available statistics. My approach from 1966 on is to assume that all passenger cars and all "two axle four wheel trucks" run on gasoline, and larger trucks and buses run on other fuels. Prior to 1996, the "two axle four wheel" trucks are not broken out from other trucks, and I linearly interpolated that post 1966 data backward to estimate the proportion of larger trucks. My procedure is unlikely to be perfect (some cars and light trucks run on diesel and some larger trucks burn gasoline), but the error is probably modest, and probably fairly stable over time. In recent years, FHWA has made their own estimate of deployed fleet fuel economy via methods they don't document enough to reproduce. Their estimates are about 1/2mpg higher than mine. Theirs may well be more accurate, but are not available throughout the period of interest.
- There is some uncertainty in the allocation of this quantities between neighbouring years, since it is not clear whether the fleet totals in the TEDB are for the beginning or end of the year, or an average. Here it is assumed that they are end of the year totals.
Contact
- Content: editors at theoildrum dot com
- Tech support: support at theoildrum dot com
License

This work is licensed under a Creative Commons Attribution-Share Alike 3.0 United States License.
The conventional wisdom, reinforced by Yergin et al, is that we can continue with an exponential increase in imports for years to come.
As I said before, IMO we are now facing a collision between the expectation of exponentially increasing imports and the new reality of exponentially declining exports--led by the Saudi's estimated 13% decline in exports from 12/05 to 12/06.
For US imports to just stay constant, we have to reduce our consumption by a volume of oil that is equal to our annual volumetric decline in production. And we have to reduce our consumption by the same amount--matching domestic decline--every year going forward, just to keep imports constant. Note the key challenge here--this would only keep our imports flat year over year, while world net export capacity is now declining (whether this trend will be reversed is the key question; I think not).
It sounds like your saying we could have a price shock as early as next year ?
The Saudis have reportedly told some Asian refiners that they can only have 92% of the crude in January that they wanted to buy, down from 95% in December. Voluntary? Right.
IMO, the export crisis is upon us.
From my reading the data on gasoline usage, recessions don't even show up on fuel consumption so for now I don't think anything outside a world wide depression will cause a significant drop in fuel usage.
Hmm I figured a spike late next summer based on to many negative factors causing a run on the market I did not consider any actual shortages for quite a bit longer 2009 at the earliest.
My opinion is still only a price spike in 2007 since I think KSA is filling storage and we still have the SPR that can be drawn down. Plus I think they have idled some production it may be heavy oil but I still think its happened.
So if you consider these factors we won't see shortages in 2007 and probably not 2008. 2009 is looking like a really bad year maybe 2008 but I think we will squeeze through 2007 with just one price spike and limp into 2008 with oil under 100.
Of course this depends on the decline rates of the big fields but I'd have to guess we have one more year at least where excess capacity and stockpiles will prevent outright shortages and all we see are price swings with on big spike.
We just have to wait and see what KSA does when oil passes 70. If their production does not come back up for 6 months or more we know the party is over. So I guess we will know exactly where the world is at in 2007.
One thing about them claiming cuts and proclaiming a floor at 60 is it will soon be obvious where KSA is at as prices move well above this floor price.
If KSA says they are now comfortable with 70 next year ....
¿Maybe a reduction on available fuel?
I do not care what some vice president says about something being non negotiable. If something gets too expensive, people will cut down. Witness medical insurance.
I did not say it would be pretty.
I dunno I thought the same the facts seem to indicate that economic recession at least on the scale we are used to does not have a major impact on fuel usage. If you think about it for modern countries your talking about a real change of maybe 3-4% in the economy from slightly positive to slightly negative. Fuel usage would be a % of this so say at worst 1% ?
So you would have to reach depression level economic slow downs to have a significant impact on oil. Put it this way to reduce overall oil demand by say 5% your probably talking a 20% reduction in economic activity. Note a lot of the economy is powered by electricity coal/NG so oil prices does not have a direct impact on the core economy. If you can find evidence that this is wrong please show me.
Now with that said shortages on the other hand especially chronic ones are a different ball game altogether and simple conservation probably won't solve those types of problems.
Whew, that was easy.
I still wonder if prolonged and worsening fuel shortages will, over time, change the value map of real estate. I would anticipate that given high enough fuel prices, locations proximate to both jobs and goods and services will start to increase in value vis a vis locations that require longer travel distances to reach same. I wonder, however, how high gas prices would have to get for this to be the case, as they represent only one component of the cost of using an automobile for travel.
Regardless, my city is seeing a growing number of development applications involving mixed-use formats, intensification of older centers (not just the downtown, but around malls) and infill in established neighborhoods, all of which increase proximity. The market is already trending to some extent in this direction, even with current low prices.
I suggest that you revisit this conclusion one year from now.
IMO, the decline in net oil exports is going to hit so hard and so fast that we will have no choice but to abandon large swaths of Suburbia.
IMO, this will be virtually the only "growth" areas that we will see--especially along mass transit lines.
There would then be a sharp decrease in the use of petroleum and a subsequent glut in supplies.
IMO, this makes no sense - the peak/plateau/whatever you believe will happen will play out much slower than this.
You are absolutely correct about aggregate world oil production, which I predict will show a net decline rate of about 2% per year going forward.
However, I think that you are absolutely wrong about net oil exports. For example, Saudi Arabia's production is down by about 7% from 12/05 to 12/06, but I estimate that their exports are down by 13% from 12/05 to 12/06.
Your "conventional wisdom" view is why, IMO, the net export crisis is going to hit so hard and so fast. We simply assume a continued exponential increase in imports, while the mathematical models--correctly so far--are predicting rapid declines in net export capacity.
I was roundly criticized in January for predicting that Saudi Arabia and Russia would join Norway in showing lower exports this year. We can argue "why," but the Saudi and Russian governments have both now admitted to lower exports.
If you can believe the information about the looming nat. gas shortages (which is being reported by more than one source)and estimates are that we need to import 1.5x our current oil to make up the difference, we are in for a world of hurt.
SEATTLE-
Had 62 people in the hospitals who had carbon monoxide poisoning, trying to stay warm in the recient power outage. Sadly, we may get Kunstlers die off easier than we think.
BTW currently in day 6 of power outage here in NW Oregon. Running generator 24 hrs a day keeping greenhouses warm...can you say expensive...
But we don't know what might happen after the peak. We are just assuming that because the US for example has undergone a gentle descent after it peaked that this effect will apply to the world situation. Forgetting that the US having been geopolitically and economically stable, and almost completely accessible to new drilling and further exploration up until now. I fear the world scene will, within a short space of time, be anything but orderly to make for a long-term gentle decline. Especially when you consider the knock-on effects that unsustainable economic practices and population growth is, or soon shall be, delivering to us, one after the other.
Yes but it will take time for all this to unwind. In a earlier post I mentioned the use of the SPR to calm markets etc.
So the first reaction is its a spike and we should see a small rise in exports as any excess capacity is brought online.
So I still think overall its just a price spike next year with a new floor price at 70-80. It just takes time for all this to unravel I'm guessing a year or two say 2008-2009.
And of course you have even more demand destruction in the third and now second world lowering usage. And you might get just a little bit of economizing hear in the US as we did during the last crisis.
I could bring in more factors but they all point to a price spike and drop next year with SHTF type stuff happening later. Two or three years is not a lot of time IMHO.
Looking at how our car fleet changes over time its pretty obvious we will be caught between a rock and a hard place well before we could adjust to peak oil.
None of those allow us enough time to make sufficient changes, and the impacts will be be uneven for sure, harder in poorer areas or more debt burdened areas.
IMO, it won't play out over 15 or 20 years. And any of the other possibilities above are too fast for a soft landing.
========It's all about population!
I agree I don't see how we have time now for the slow conversion Stuart is proposing. Its realistc.
On the same hand the world will not end tomorrow. Even if oil went to 150-200 a lot of people can still afford to drive and car pooling and public transportation can help those that can't. And of course fuel efficient cars would be purchased by those that can afford them. At the minimum you would see America approach Europe/Japan in efficiency.
The only thing I see ending is Americas crazy suburban life style and outdated work conditions i.e everyone doing 9-5.
So at least in America the big looser is the suburban lifestyle and the ponzi scheme supporting it will unravel.
For example Stuart is not considering the cost of roads under expensive oil conditions. Suburbia has a lot of hidden costs.
Now with all this said these changes would be occurring during the first five years of peak oil but I can't see how we will be changing fast enough to prevent repeated shocks to our country and the result creation of a slum class common throughout our world.
Now of course third-second world countries would suffer a lot more and political instability their is probably a bigger issue along with the creation of our own internal third world country.
Dyslexia and spell checker colliding sorry
Funny though :)
I agree with your land export model. However, I don't see a rapid abandonment of suburbia, only because people have to have someplace to live.
Let's assume some people can no longer afford to drive and then lose their jobs. (or they just lose their jobs). Sometime in the near future (6-12 months), they lose their suburban home. Most shelters are in the cities, so they head for the cities. Now, the cities become home for large numbers of homeless former suburbanites. Part of the growth of the cities has been their ability to "clean up" downtown, moving trash and homeless people off the streets so the wealthy could have a pleasant living experience. What happens to that experience when it is spent stepping over the homeless?
Again, figuring that some people lose their suburban homes. The banks or mortgage companies or individuals who own mortgage backed securities, now own the houses. What are they going to do with them? After accumulating huge numbers of houses, who will they sell them to and when do they stop gathering them in? Do they write them down and accept lower payments? I don't know.
Do the remaining suburbanites gather politically around homesteading relief to save the American dream?
Let's say the US cannot import as much oil as before and domestic production is falling? How does the oil get allocated? Yes, defense and policing get theirs. But eventually, there is a market for what's left. So the price rises and some folks don't get any. Who loses out first?
In most cases, the poor with gas guzzlers get hit first. The price rise eats into their existence until they have to drive less. They don't have the resources to buy a prius, so they are screwed. They also work physical jobs which cannot be relegated to telecommuting, so they have to go to work. They give up their car and black-market taxi service begins, kind of underground car-pooling. Some guy with a mini-van will stop by your block and you can get a ride to a location close to work. Poor folks already use cabs, some legally and some not. This helps reduce vehicle miles traveled per capita and fuel needed.
The folks in suburbia get hit too, just differently. For some, the increase in fuel costs forces a reduction in miles traveled. For some it doesn't reduce miles traveled, but reduces the discretionary funds available for flat-screen TVs, etc. Again, for some, it puts them over the top and they lose their house.
I wonder how the age of a suburb will matter. Older houses cost more to heat and cool. Older houses have older residents who, may be more apt to leave the large house since their kids are gone anyway. On the other hand, older houses with older residents are already paid for and don't face peril from missed mortgage payments.
Let's assume that the suburbs collapse and everyone wants to move into renovated or new urban housing. If they lose their shirts on their suburban home, where do they get the money to buy the urban home? Builders don't have to build, they'll just lay off their workers.
I think suburban growth is going to stop. However, the only way people don't live in the suburbs is if we reduce the population or we build a ton of new housing. I think our debt burden limits the latter.
I agree suburban asset values will get hammered. I just don't know where folks would go.
Sure, foreclosures and homelessness will rise, even sky rocket initially. But isn't the system itself vulnerable to failure as to eventually preclude the possibility of widespread eviction/foreclosures carried out with cooperation of a fully functioning local government? I've got to think there is a break point in there somewhere. Just dont know what level it is.
They will buy a Prius, of course. There will be no recession, only a dying breed of they-never-learn managers at Ford and GM and record sales at Honda and Toyota.
I think the general rule would be more like, "people want the roomiest, highest status, best (perceived) quality product they can afford." I don't think we can leave out the "they can afford" part of the rule.
Yes, people still believe in the better school district myth. The factors which most effect student performance are the education level of the parents and the size of the school. The smaller the school the better the students do.
A school district is considered better only because it has fewer black kids. It is just pure racism that makes people look for "better" schools.
I know several people, including myself which have purposefully selected a home that is closer to work. A lot of them site the steady rise of gas prices as being a motivator along with the frustration of losing 2 extra hours of their day doing a long commute.
Its anecdoctal, but I think changes are begininning to occur, and I think another summer of some price discomfort will push more change. A slow squeeze I think ultimately may be the best outcome in providing motivation for change, as well as providing time for change.
Other people have two jobs or they change jobs frequently.
In general, I think the planning/land-use stuff matters over a long timeframe. There's not much you guys can do to make a difference over a decade or two, but you are critical over the century timescale. The land-use approach of the last 50 years is going to cause us problems for a very long time.
With regards to changing land use, here's some speculation as to how it might occur quicker than you think. The U.S. is experiencing significant population growth, and much of that is occurring in sunbelt cities like mine, which is adding about 5,500 units and 12,000 people per year, mostly in a suburban pattern. Even if no existing housing is abandoned, where these new people end up could have a dramatic impact in densifying established neighborhoods and corridors.
If the value map does change significantly, all manner of passed over sites will start to look attractive. One large source of underutilized land can be found in existing shopping strips with oversized parking fields and generally inefficient layouts. As income gets diverted from retail shopping to energy costs, many of these may become fully or partially abandoned. Infill development on these lands would put additional density not only close to shopping and jobs, but also along corridors that one day might see increased transit (I know, I read the earlier posts, but I think peok oil will bring at least some increased demand for transit).
Will people move into multifamily units in redeveloped shopping malls and strips? In fact, its already happening. I predict in many parts of the country, the barrier will be regulatory, not market-derived, as people cling to existing development patterns. Hopefully that obstacle will fade away when the seriousness of the situation becomes apparent.
http://www.vividpicture.net/documents/sustainable_food_system.html
If your talking about putting up 50 story towers then basically anywhere outside the heart of the largest cities is viable for redevelopment.
In all its just a matter of when it becomes economically viable. Once it does I see no reason that the value of our current properties and suburbia won't fall. It happened after WWII and it can happen again. Once you have livable cities in the US I think the tide will turn quite rapidly.
Also consider that the recent housing boom coupled with the retirement of the baby boomers will basically wipe-out demand for suburban housing for the next 10 years at least if not forever.
A lot of people who bought homes over the last 5 years will probably loose them over the next several years. A lot of baby boomers will opt to move out of their old suburban house in exchange for condos which will be cheap because of the initial glut and they can still make a decent profit of their home. So you have a influx of renters and condo buyers that will be interested in living close to work. The condo won't go for anywhere near the price that they are at now but their will be demand once the price drops back down to something reasonable.
Remember you just need enough to reach critical density once the number of people living in town grows large enough you will get back your shops/restaurants etc causing more growth.
If it goes like I think it will with suburban home prices falling every year and growth moving towards the cities powered by people that are not in the housing market either because they are retired or lost a home it will continue as apartments/condos actually become more desirable because of oil shocks.
So once you add the above with oil price issues you have a suburban areas never recovering and thus no reason to try and maintain them. Remember suburban regions are very sensitive to what I call loss of face. Once you get enough empty homes and rentals that are not maintained value drops like a rock resulting in further flight into renewed downtown areas.
Finally we have to build something in the US and it looks like suburban houses won't be viable and it is possible to build nice high density apartments/condos at reasonable prices so I think the builders will build them. They basically have to build something and as long is their is demand high rise condos/apartments are simply cheaper to build and thus cheaper to buy.
This is the same idea that Le Corbusier proposed in 1922-25. He called it "The Radiant City" and it became known as the "towers in the park" model.
Just one thing -- Le Corbusier didn't anticipate the requirements of mass automobile ownership. So "towers in the park" became "towers in the parking lot" connected by large freeways -- see Houston, etc.
Even in a car-free society, isolated towers incur prohibitive costs of stringing infrastructure out to distant locations -- water, sewer, gas & electric, roadways -- and the prohibitive costs of servicing that sprawling infrastructure.
Singapore has this model they have a lot of parks and open spaces in the city. Also a lot of European cities contain parks. As far as infrastructure goes. I'd assume the main thing would be rail. Cars would be controlled via massive fees for limited parking along with huge use taxes esp city entrance fees etc.
Quality of life is vastly improved in the city with the addition of some green space. Next the assumption is these towers would not be on the edge of the city but say within 5 miles of the city center. That's a lot of land but you still can have density high enough to keep supporting services cost low. I think one thing that has prevented a lot of Americans from moving into the city is the lack of nice parks in American cities even if its private parks. And they don't have to be large.
In any case the isolated towers can themselves form part of mini cities as we see happening in Japan for example.
A huge amount of literature exists on how to make dense cities that are both easy to walk pleasant and beautiful.
Huge highways, not pedestrian friendly at all.
In fact, aren't walking tours very popular?
The consumeristic focus of Singaporean society is a bit disturbing, but the quality of life is suprisingly high, given the extreme population density
The simple reason being government taxes and quota. For example, a Honda Civic Hybrid costs slightly more than USD50,000 and a Toyota Prius would cost USD55,000.
98 Octane gasoline costs around USD4.40 per gallon before loyalty discount.
If you drive through the congested roads at peak hours, you might have to pay up to USD6 per day.
:-)
sounds like you haven't seen much.
within 10 minutes walk i can access 3 supermarkets, library, the church, shops, 2 out door markets, food places (macdonalds too), banks, post office. very pedestrian friendly but also high density living. point google earth. the resolution is sufficiently good to make out the high density places.
i would certainly love to have a house with a two car garage like i used to live while in the usa - cheap cars, cheap petrol, beautiful outdoors. but come crunch time i foresee an urban enviroment being a comparatively advantageous place to be in terms of transport cost and access to amenities.
to give you an idea. not many people own cars ( cars are around 3 times what you'd pay and petrol is probably double. not only that, you only have the right to drive the car you bought for 10 years, after that it goes to the scrap yard or has to be reexported out of the country). public transport by taxi, bus or subway is cheap by comparison to cars. round trip cost to work about $1.
finally its just a matter of adjusting to a different environment. i'm sure americans will be able to do that when the time comes. eg i've got a colleague from LA whose been here for 10 years and only takes public transport. he can't tolerate the commute by car.
Back at university, we got a kick out of the landing strips and helipads on top of the buildings.
Another problem is that while Corb's buildings were designed around natural light and ventilation, our blocks depend on mechanical ventilation and artificial light.
With the expected decline in natural gas, and the problems in importing it, we need to plan as if at least parts of the country will be seeing frequent power outages in the next few years.
Look... no large city will work at all with intermittent power supply. And no large city will ever have intermittent power supply. GW non withstanding we can build any number of coal fired power plants. The coal is there. But so are the sunlight and the wind. The choice is not between energy and no energy. It is between dirty energy and clean energy.
Barring a local surplus in construction and electrical energy sources, I don't see this a viable option, even if it dramatically reduces VMT
Let's do the math: 1 person weighing 200lbs has to be moved to the 50th floor. The potential energy is W=m*g*h=100kg*10m/s^2*150m=150kJ. You do that ten times a day, you need 1500kJ. 1kWh is 3600kJ, i.e. the elevator needs 0.4kWh/person/day. Electricity consumption in the US is a whopping 11000kWh/year/capita or 30kWh/day. In other words, the elevator to the 50th floor adds at best 1.3% to an inhabitants electricity consumption. You get similar numbers for pumping water.
On the other hand, an everage citizen living in a place with tall apartment buildings like in Singapore takes the bus or train to work, i.e. we save the gas for the car!
The bigger problem I see is in their constrution. Towers require significant quantities of steel and concrete. Both are very energy intensive to manufacture and transport. Given a severe enough shortage of transportation and manufacturing energy (oil and natural gas) we simply aren't going to be able to continue to manufacture huge amounts of both to build skyscrapers.
Small structures on the other hand will remain relatively easy to construct in comparison
In other words: reality proves you wrong. Electricity use in the city is not the problem. And the solution to the mentioned blackouts in case of an energy emergency (which will not happen) would be simple: the federal government will turn off the lights in the countryside where it will not lead to riots etc. and keep them on in the city where any breakdown of infrastructure would be a major catastrophy. It is as simple as that...
By the way... if you come out to the West, I will show you all the empty roof space we have. We drive around for an hour and I will point out enough roof area to you to produce several GW peak... and close to the whole energy consumption of the place on average.
:-)
I'm a planner and have been involved in energy planning for some time (worked for utility, then local government). The folks responsible for keeping the lights on that I talked to do not inspire confidence over the long haul absent a wholesale change in political priorities.
As for my construction related concerns, you havent addressed them. How are we going to build these structures in the future? The ones we have now, they represent energetic investments already paid for and as long as the lights stay on, a great way to minimize overall energy consumption (esp transportation consumption). But going forward--I dont know if it will pencil out.
I suspect that after peak oil, we will see very few new units constructed. Instead, we will see more people moving together into existing housing stock, because of the high cost of heating and cooling space and the high cost of transportation. Some units that are in undesirable locations will be left vacant - or perhaps dismantled for replacement parts for other homes.
Once peak oil is known, I expect the world will change dramatically. The availability of loans for building apartments and for purchasing houses will disappear, because lenders will realize they have little chance of getting their money back. The monetary system as we know it may not continue, or there may be hyperinflation.
Governments will stop building new roads, and may need to cut back on the amount of roads that they can continue to maintain, because of the lack of asphalt.
After the first year or two, I think declines in the amount of available fuel will be much larger than Stuart uses in his examples, for a lot of reasons. A few of these include
1 . Exporting countries will tend to satisfy their needs first, leaving less for export.
This seems to imply that "after peak" prices will reach out of bounds, and not fall back as a result of (a) efficiency, (b) conservation, or (c) economic contraction.
From "cheap" to "too expensive" in one great leap?
Take transportation. China, it appears at the moment, is well situated to absorb an increasing proportion of total liquids production, and at a higher price than they are currently paying. North America, on the other hand, appears only to have the conservation option open, especially as productivity seems set to fall in any case, as the quality of our energy mix declines. Are there efficiencies which we can achieve which would allow us to outstrip the loss of productivity implicit in a poorer energy mix? Are these and or other efficiencies only go to be available to us?
With all its problems, our transportation system is very economically efficient. As for externalities, while we pay for congestion, we manage to share the cost of climate change. The marginal barrel of oil is not doing much to improve the transportation component of our labour market, of our production markets, our distribution markets or our consumption markets. But additional oil can make huge contributions to the productivity of all these markets in China. It has been doing so ever since China adopted the market system. They are turning their oil imports into profits, while US imports, on a wide margin, are converted into debt.
Unable to put the marginal barrel of oil to work as productively as can occur in China (and elsewhere), we will not be able to compete on price. It's simply irrelevant how many dollars we can print. Real purchasing power has to be earned. So, forcibly we will need to conserve.
It is far from evident that even the most aggressive gains in efficiency will allow us to increase our economic productivity. I expect we will become less productive, per capita. Done properly, it's an attractive option.
No one with any strong grounding in oil production (and "large project") data has called an abrupt and steep drop.
The recurring theme is "undulating plateau" with later, consistent year-over-year declines coming some time post-peak.
Europe has grown into a large EU with better geographic access to oil and natural gas than North America. Its export markets have become less dependent on the US to the extent that Germany's exports amount to only 8.8% of total exports. Europe also presents a significant growing market for China. Even though Europe will remain subject to the usual manipulations by commodity exporting nations, there is good reason to believe adjustments can be made over the long term.
It may transpire that the economic block of "the old world" can very well go it alone. It looks as if South America is positioning itself to go it alone as well.
Here in North America we talk of significantly rising prices in the oil market over the past few years. But relative to the Euro, the increases have been fairly moderate. That may not be a coincidence.
North America finds itself in a somewhat awkward position when compared to Europe. The US current account along with significant other sectors of the economy is terribly out of balance. While it still has as strong an export market as Europe, it is heavily weighted towards services as opposed to goods, and its imports are something on an order of magnitude greater relative to other major economies.
North America is facing a looming natural gas problem that doesn't appear to be getting sufficient focus. A tipping point problem I'm sure. The market for LNG has not been liberalized and probably will not be; the infrastructure for LNG will likely grow far too slowly to meet shortfalls; and the US only owns twelve ships. In some sense, it isn't the natural gas that is stranded, it is North America. North America could soon be living off the kindness of strangers.
These differences may combine to cause significant differences in the relative price of oil between Europe and North America. Oil producers are clearly not going to give their oil away, we all can agree on that. But oil may remain reasonably affordable in Euro terms while it becomes very dear in Dollar terms. Economics and politics will determine how that plays out with oil and natural gas playing supporting the supporting role as "The Spoiler."
Between world wide peak oil, and North American peak debt, and peak natural gas, the undulating plateau period is likely have significantly different impacts on the two regions, particularly as it effects the relative affordability, and even access to, fossil fuels.
Could it be that life could turn out to be like a giant game of Monopoly and North America, in spite of its recent significant lead, could find itself out of the game?
We are trading scenarios, and possible worlds, without knowing which one of them (if any we name!) will ever shake out.
Returning to your post ... I think we are waiting for the shoe to drop. We want to know what the response will be if/when an actual oil or gas shortage becomes apparent.
National Geographic reminded me that 1967's gas prices adjust to $2.00/gal in 2005 dollars.
We haven't really hit the break point. We are trading these scenarios based on indirect signals. This is inductive reasoning, and often only weak induction at that.
I definitly agree with you that the effects of Peak Oil can not be evaluated continent by continent, or even country by country. It's my opinion that the globalization of the world markets will peak with peak oil, at which point we will begin a long slow shift back to regional and even local scales of economy.
I personally don't buy into the theory of the AMERO. If anything I think there will be a fractalization of the current large countries by geographical regions. Certainly if the value of the federal dollar weakens considerably I expect the individual states to become a lot more self governing.
Let me tell you something: start using what you have efficiently and you can kick European and Chinese ass. Keep wasting like in the past and you will be left in the dust like every other egotist mirred in his self-pity.
However, I agree with your observation that resources have been wasted or used inefficiently.
For what is worth, I'm from a nation that is a net energy exporter, but I imagine we will continue to sink or swim with the US. I can't imagine us pulling the plug on them any time soon.
I think I got mostly upset about the sentence:
"Europe has grown into a large EU with better geographic access to oil and natural gas than North America."
The growth of the EU is hardly a plus. It has become a lot less managable and most of the new EU countries will need two or three decades to get up to average EU level. Few of them have essential geological resources and most of them come with vast unemployed labor forces who are entering the "wealthy labor markets" of the western states, thus creating a lot of social tensions. As we all know, the gas and oil reserves in Russia are not only in an economically but also politically far from stable region. Renewable resources in the Southwest of the US outgun the EU by an order of magnitude, yet go completely wasted.
If I had to make a more comparative statement, the US and the EU are like two families building a house. The US builds this huge mansion with many rooms and enormous pomp but without an architect. Many of the edges are rough and unrefined, other rooms are full with treasures but few of them are being used properly or diplayed in a tasteful fashion. In the EU there are many architects at work who are trying to build a much more refined, elegant and functional place. A place where everybody can feel at home and be proud of the premises. The lot the EU is buidling on is much smaller and it needs to take care of more inhabitants. It also has a much smaller loan from the bank than the US. Now, both are looking across the fence to the other side and both are jealous. The EU has a lot to be jealous about, the size of the lot, that quarry the stones come from etc.. The US is keenly aware that its neighbour has the better architects and contractors. The response to that is, IMHO, not always graceous. That is true for either side.
I would like the US to build a really solid house for itself. One that is a little bit more refined, like the one in Europe. Maybe PO will help us to get to such a mindset... who knows?
Even skipping the 20 million or so Mexicans (10 million legal, 10 million illegal) the whole key to the US economy is that the labour force can move around in search of better opportunities.
Read 'The Grapes of Wrath' by John Steinbeck if you think that hasn't caused social tensions in the past. Or any right wing shock jock on the Mexican immigration question now.
Europe is nowhere near this ideal, which is one of the reasons why convergence will take so long.
Right wingers always play the immigration and hate card. Go to Europe if you want to see how it is really done. Compared to that the US is harmless.
I agree that the EU is nowhere nearly as well integrated as the US. It probably never will be. It also does not have to be. The EU is not meant to be a clone of the US. The sooner Americans understand that, the sooner they can develop working diplomatic relations with the EU, again. Same for Asia... China is not a capimmunist clone of the US. Never will be... they have a 3000+ year administrative history over there. They culturally just laugh about a lot of things going on in the US.
Europe has 'gas' but has to compete with expanding economies and populations in Russia, North Africa and China for that gas.
Europe has little or no oil.
Europe is clearly a much more energy efficient society than the US, but therefore the US can make big savings relatively easily, whereas for Europe it is a long, slow grind.
The US has access to Canadian oil sands. There is gas in the Arctic and the US has more than abundant coal (which is a global warming problem of very serious dimension).
We have good public transport, but our goods and freight move by road whereas US long distance transport is often by rail. We are very dependent on short and medium haul airlines for communication.
Our economies are full of protected and subsidised niches, one reason why unemployment is so high (if it's hard to fire anyone, it is hard to hire them). And we have serious demographic problems: pensions are becoming an insuperable burden.
We have far more barriers to the movement of people to the jobs. If part of the USA is booming, people will move there to work. In Europe, we actually legally restrict that right of movement (ask any Bulgarian or Romanian!).
When exports dry up, currency strength and logisital advantages aren't going to mean much. Thus in the medium term I think Europe is in a weaker position.
Internally, Europe in is in a far worse position than North America when it comes to fossil energy reserves. See this comment here. I know that chart included with it has been presented here before. North America also has far greater potential for wind and solar production.
There are clear qualitative differences, but despite America's poor suburban infrastructure I think I'd rather be here than in Europe when things get bad. We can cut consumption dramatically and live poorly off our remaining fossil supplies. Europe, on the other hand, will have to live hand to mouth off of Russia and Central Asia's fossil energy reserves. The natural gas situation in north America can be handled by wearing heavier clothes and using electric heaters, dryers and stoves - essentially moving the NG burden to coal and a bit of nuclear.
Non-market action to obtain the barrel will make it disappear the next day.
I believe that my co-citizen, John McFadden, is arguing convincingly that Europe is positioned to use the marginal barrel more productively than the US. I concur and also believe that China is better positioned than both.
The US should be in a better comparative position to conserve, but effective conservation (which I define here as that which is most beneficial from an economic perspective) requires public investment. A lot of public investment.
Unfortunately for the US, and for those of us in Canada with the US anchor rope wound around our feet, public investment in effective conservation is playing second fiddle while Iraq burns. Even more unfortunately the US cannot now let go of Iraq because the game has become 'double or nothing'. Leave and the civil war could spill into the oilfields exacerbating the trend revealed by the export land model. Should have never kicked the tar baby.
Oh well, as the US elite fulfills its blood lust in Mesopotamia, the people of meso america are able to enjoy a period of respite.
This will only be true if oil remains a fungible commodity, a questionable proposition once the world is conscious of the implications of peak oil. I have no doubt that those who control and sell the oil will follow the principle you have outlined, but when, for example, poor people in Russia have their natural gas turned off because the people of Europe are willing to pay more money for the gas they are not going to sit idly by while they freeze to death. They will revolt, destroy energy infrastructure, and/or engage in political revolution to install leaders who will keep their fossil fuel production domestic. Once that activity is underway around the world, oil will cease to be a commodity with control of distribution largely shifting to governments. Because of this likely friction we're in for a long age of extremely repressive governments throughout most of the world, I think. I also think the chaos will prevent the world economy from functioning in the fluid manner we have been accustomed to since post WW2 anyway irregardless of the energy situation.
Yes, poor Canada, why won't someone play a small violin for our horrible plight. Canada suffers from the same suburban sprawl and mass transit underinvestment as America and Canadians use as much gasoline per capita as Americans. Also, to hell with the Kyoto protocols, there is money to be made in them there tar sands. If it will make you feel better you can brag about gay marriage rights and the low murder rate.
It just happens to live next to a country full of nutters ;-).
I was particularly struck by InfinitePossibilities' analogy of the architects. I've traveled extensively in the world and the first thing I notice is North America's lack of a sense of history or permanence. Compared with Europe there is a real sense that nothing should last more than a few years, from roads to buildings to the products we use every day. It really leaves the impression that we live in a "cardboard society."
The US and Canada are not as homogenious as might appear from afar. Both Canada and the US were built on their transportation and communications systems, with Confederation, in particular, being entered into suspiciously and cautiously as the railroads extended east and west from Montreal.
Within Canada, during the time of confederation there was wide spread economic disparity and special tariffs, the Crows Nest Rate in particular, were put in place to protect relative advantages. There are still more barriers to east/west trade than there are north/south trade.
Today, new economic disparities are showing up with the west having the upper hand. Onario's historically powerful manufacturing base is weakening substantially, while the west's energy and access to the Pacific is providing renewed interest in going it alone. Politically, Quebec's on again, off again interest in separation resulted in the recent Clarity Act. Quebec can separate if a clear majority answer a clear question. But the Clarity Act, while put in place for Quebec, holds equally for all Provinces.
The tar sands construction boom is taking a toll on Canada's labour market. Mobility in Canada isn't what it might seem as trade certification is a Provincial jurisdiction. An electrician licensed in Ontario is unqualified in Alberta. The same holds true many professions.
The recent and relatively unknown TILMA agreement between British Columbia and Alberta breaks down inter-provincial barriers, amongst other things. Ontario is hoping to gain manufacturing contracts in Alberta at the same time that Alberta is entering into contracts with China for heavy machine manufacturing. Any concessions that Ontario or Quebec may gain will certainly require them to enter into TILMA, which will make it easier for Alberta to lure away skilled trades and professions.
Newfoundland and the Maritimes have never enjoyed the economic prosperity of Confederation and have been the recipients of transfer payments from other parts of Canada. Newfoundland only joined Confederation in 1947, so Canada as a whole really is a very young country.
The US has similar regional inequities and barriers to mobility. The historically coal rich Appalations are the poorest and ecologically devastated region in the US. West Virginia has a literacy rate on par with third world nations.
Both countries have citizens who are equally comfortable in NYC or Los Angeles and own homes in both places, along with a summer home in Tuscany. But the vast majority of citizens feel tied to the land and regional values. A young francophone nephew of mine was tempted by a tar sands salary of $125,000 for driving a truck, but his wife refused to leave her roots. Paris is closer to Moscow than Montreal is to Athabasca.
There is slowly growing public awareness of the relatively secretive Security and Prosperity Pact, or North American Union, and the NAFTA superhighway. Tied in with that, in ways that are not clear, is the Amero, a new North American currency first proposed by the Canadian somewhat right of center Fraser Institute. The average North American citizen is virtually unaware of the SPP/NAU and the Amero, and what it means. However, the window of opportunity for both the US and Canadian governments to unilaterally (eg without legislative review) impose the NAU closes in June, 2007.
In terms of north/south mobility, ever since the enactment of NAFTA, I (holding the "right" kind of university degree) can go work indefinitely in the US simply by paying a $35 fee at the border crossing. NAFTA resulted in a "brain drain" into the US from Canada. I don't see the NAU being an invitation for the jobless and unskilled to flood into the US. Given the size of the US economy, the NAU is likely to be somewhat asymetric.
So you can see, there is a great deal of political and economic uncertainty in North America and there are growing regional imbalances. Canada, the US, and Mexico are in some very real sense, too large, nations joined together and held together by their transportation and communication systems. They are pulled apart by distinct differences in economics and value systems. To the extent that the average Canadian may wish to separate themselves from other Canadians, or distance themselves from the US, the Security and Prosperity Pact will certainly include provisions allowing the US to protect us from ourselves.
So while there are an infinite number of possibilities and future scenarios, and I'm not advocating or proposing any particular scenario, it isn't inconceivable that the nations of Canada, the US, and Mexico could splinter, perhaps violently, in the face of scarcity. If it does, it will be our youthful lack of common purpose and permanence, and our complete lack of a meaningful sense of history and community, that will drive the process.
These are interesting times.
Not a great novel, and certainly not one of his best, but his vision of a fragmented North America is interesting.
(someone told me he was born in Alberta, but I haven't been able to substantiate that)
Also, in a lighter vein, Connie Willis' 'Light Raid' which is about a war between East and West North America (fought with orbital lasers).
That's the fun of it.
And of course all you have to do to disprove it is put forward "[someone] with any strong grounding in oil production (and 'large project') data has called an abrupt and steep drop."
Clipping one line from a Simmons power-point (as has been done) doesn't do it, in my view. I'd like to see an honest and full estimate, for "abrupt" or "steep" drop.
Not at all. When I write of a poorer energy mix, I am referring to the impending ongoing decline and impending descent in natural gas supply among other factors.
I believe that North America is poorly placed to compete for oil going forward and that our real oil purchasing power is declining in relation to other economies, and will decline even more rapidly as peak energy-available-to-the-non-energy-producing-economy plays out.
That was the bit to which I was originally responding.
Like this?
2. Now you can choose the size of the picture you want (small medium large etc).
3.
Scroll down a bit and you'll see
"To link to this photo on other websites you can either:"
4. Select and copy all the text from Box 2
5. in your post write
<img src="paste URL here">
6. paste the url from box two into the image tage (replace paste url here, but keep the quotes)
7. double check with the preview button
That should do it
OR
You can copy all the text from box 1 into your post. But you have to delete title="Photo Sharing" because TOD chokes on that.
For anyone who is interested this chart is from here: http://www.vtpi.org/railcrit.pdf which is in itself a very worthwhile read for people involved in the public transit debate, and particularly discussions relating to rail transit vs other modes. Lots of information and good argument.
This particular chart I believe provides partial support of my contention upthread that the US economy is not well situated to compete for the marginal barrel of oil. Of course, more support could be provided by a similar picture of the return on investment for new roads in China, and elsewhere. But I anticipate that the return on investment in roads in China today is close to that of the US around 1960. There are other uses for oil that require examination, but since oil is primarily a fuel for transportation, I think this chart provides an important hint.
Back in the 80s, developers turned all sorts of aging, post-war apartment blocks into condos. Eventually these buildings needed serious repairs, and I read that condo owners found that their condo fees were approaching their mortgages. I could see that happening again as even shoddier new construction gets carved up for tiny flats and condos (read slums).
EROEI is going down for Oil & Gas, but not for other sources of electrical generation.
:-)
In addition to that, exporting countries may begin to see oil in the ground as a more valuable asset than dollars or euros or anything else. At that point, their incentives will change completely--saving the stuff will be better than producing all-out, because it will appreciate faster than other assets.
Mark Folsom
He (Toll) gave an interview in the Wall Street Journal last week. Unfortunately, a paid subscription is required to follow the link, and I could not find a free source.
Mr. Toll Turns to Towers
Coming down the 400 there is that sign 'welcome to Toronto, population 2.1 million'. That number hasn't changed since the early 1970s: the smaller average household size offsets the number of new units built.
The Greater Toronto Area has expanded hugely of course-- now as many as 6 million people I think. But I would say the majority (but not the overwhelming majority) of the housing units built are single family dwellings. That may be changing as land prices keep rising and there are mushrooming centres outside of the Metro (eg Vaughan).
So yes there are condos in downtown Toronto, (the previous big buildup of multiple unit housing was rental apartments from about 1948-62, those units are now in need of regeneration), but GTA remains predominantly a place of detached single family dwellings.
And it sprawls. I would say 60 miles by 60 miles, at least.
What I remember as open fields from the 70s, all the way to Barrie, have been muchly built over.
The City, my man, ends at Lawrence Avenue (or rather just before Hog's Hollow)-- beyond that is North York, which is Mel Lastman, suburban dream land! Etobicoke, Scarberia, North York-- phaughh, suburbs ;-).
In places like Post Road, they actually have a minimum lot size to keep the riff-raff from building $1million homes, which would cheapen a neighbourhood of $5million homes. Let them live in Rosedale, I say.
I grew up in a quadrangle bounded by Bathurst, Bayview, Lawrence and the Lakeshore-- for the first 26 years of my life, I never spent more than 2 weeks at a time outside of it.
Seriously though, although I hated Harris for a lot of reasons, the abolition of the burough governments had a point, which was that Toronto is now about Metro-not-Metro, not about Scarborough arguing with York re transport funds.
The Yonge-Sheppard corridor is really depressing. They have built the condos, but somehow the area just has no sense of life.
Why it took place is the subject of some discussion (1) but the effect has been to lead to a recolonisation of New York by the middle classes. Which has then led to their being driven out by the astronomical housing prices (and the poor quality of the schools, for those of family-building age).
(1)
Theories abound, depending on your left/ right wingedness of views:
- legalisation of abortion leading to a fall in the number of 18 year olds from the 'most vulnerable' (to criminality) categories (Stephen Levitt 'Freakonomics')
- abolition of lead containing petrol leading to a decline in attention deficit disorder and a rise in IQ amongst children
- 'hard core' policing methods such as zero tolerance, increase in incarceration rates etc.
- turfing the homeless off the island of Manhattan eg by closing the welfare hotels
- fall in the number of 18 year olds (the biggest committers of street crime)
- the crack epidemic burning itself out
Whilst I think the Levitt thesis (and the leaded petrol one) may have a lot of explanatory power, particularly when looking at the US as a whole, in the case of New York I think we have to credit the big increase in numbers of police on the street (begun under Mayor Dinkins) and the rigorous emphasis on reducing crime statistics, block by block, using preventative policing (especially eg arresting transit fare evaders, who often turned out to have concealed weapons and/or to be on the way to commit other crimes-- a form of self selection), using the COMPSTAT database and new police management tools (Police Chief William Bratton, and Mayor Rudi Giuliani).To some extent Bratton invented it, and Giuliani took the credit, but actually making the police police (rather than sitting in cars or in the office filling out reports) (2) and then allowing them to make arrests, and putting the perpetrators behind bars (so there was a real cost to a potential perp), seems to me to have been a huge factor in cleaning up NYC.
(2) a GE axiom of management. That which you can measure, and you do measure, and hold people accountable for, they will address and seek to do.
How hardened is your town/cities economy against peak oil.
For example you can figure that cities along the Mississippi drainage will probably do okay since they would have barge traffic and of course its all fertile farmland. The same for cities with good ports. World trade is not going to come to a standstill overnight.
Otherwise I think we have a lot of cities in America at least that may not make economic sense in a post peak world.
For example Tulsa Ok sure still navigable. Wichita Kansas ?
Maybe not. Along with a lot of cities west of the Mississippi.
You can assume that cities in fertile river valleys with navigable rivers will continue along with any port cities but once you move past these its debatable.
Note this is important once you go with high density housing since it makes a lot more sense to invest in infrastructure for a city of 3-6 million than one of a few hundred thousand or for many US cities less.
For rounding sake assume a dense Asian style city with a population of 10 million. This would mean 30 cities for the US at 5 million its 60 cities.
Thus once automobiles are not viable and your living in and apartment it makes sense for most people to move into the largest cities. This is the pattern throughout the world outside of the US.
I'd assume that we will at some point simply abandon the car and small towns and cities and move to these new metroplexes as they expand their rail/trolley/subway system.
I think once the demand exists this conversion could be quite rapid.
It is one thing to cringe at $5 or $6/gal gasoline and another thing entirely to try doing without.
Actually... you could do that right now... if you really wanted to.
The problem with that argument is, if you think about the place in the US which is most unsuitable for regular living in a peak-oil world, it is Hawaii, and Hawaii's real estate has gone bonkers since 2002 (even as it languished during the cheap-oil 1990s). It has thus far exhibited no relationship whatsoever to the oil price.
The fact that outlying areas ("exurbs") are selling off now ahead of central areas is more easily explained by the general observation that when a housing bubble pops, the least desirable areas sell off first.
It will be some years still before oil prices seriously impact residential real estate in a way that can be distinguished from the general trends expected when a real estate bubble pops.
We really should be trying to cut our GHG emissions by ca. 90% over the next 30 years, and working on long-term sequestration too.
About a third of kids nowadays would be expected to get diabetes given the current diets and built environment. (Not that I expect current diets to remain stable). About half of adults are obese.
How much more land is required to grow food without petrochemical inputs? How long does it take to convert land from non-organic to organic farming methods? How much more efficient is it to have that food come from nearby where people live?
From a long-term, systems perpective, I don't think big cities are viable, though over the short-term they may have some economic advantages during a liquid fuels crisis.
Certainly their form and function will shift under peak fuels, but Rome existed without 1 kilowatt or barrel of oil.
If the latest natgas analysis is true, and then added to rising gasoline prices: those locations hit hard by this combo of skyrocketing heating & electricity costs + transport costs will do more to change the real-estate value map faster than your city can probably adapt.
I am still amazed that when blackouts occur that gas-stations have to close.Every city should legally mandate that gas-station pumps be designed so that human lever or pedaling action can still pump gasoline when the electricity goes down. Every city planner or consultant should have this near the top of their priority list.Bob Shaw in Phx,Az Are Humans Smarter than Yeast?
BTW, I just moved back south to an old bungalow after 9 years of apartment living in the Northeast. I have read alarming comments about energy use in hot climates, but so far my gas heating bill has been nearly twice my total electric bill during the peak month of a hot summer--and this has been a mild fall and winter. It apparently takes less energy to cool 95 degree air by 15 degrees than it does to warm 40 degree air by 30 degrees.
All in all, it's much easier to use insulation, solar heating, and waste heat from the numerous non-negotiable appliances to heat a building than to cool it.
There are several variables that determine the amount of energy an ideally designed building uses for climate control.
Scenario A: Room temperature is above daytime high
Superinsulate the house, seal all crevices, make doors multi-port, make windows triple-pane. You have a kilowatt of heat in appliances and human body heat, you have sweaters, you can build solar thermal concentrators on your roof hooked up to radiators/baseboards/radiantfloors to bring the temperature to whatever you want it at.
Scenario B: Room temperature is between daytime high and below nighttime low
Layers is the key. Ventillation at the right times and appropriate use of thermal mass can keep the house at any given temperature between high and low.
Scenario C: Room temperature is below nighttime low
You're screwed, energy-wise. You can save a lot of energy by trapping nighttime air / cooling a thermal store and then using active cooling on top of that, or sweating it through. If you have significant water resources and the air is dry, you can use evaporative cooling to great effect (see the Iranian windcatcher/qanat system). You can minimize solar irradiation. But you're relegated to the removal of kilowatts of waste heat using an active system, which will in itself require kilowatts of waste heat.
A seasonal thermal store (read: big insulated tank of water with pumps + heat exchangers both indoors and outdoors) is possible if you have a lot of land, in order to harvest heat in the summer and give it up in the winter, or harvest cold in the winter and give it up in the summer.
http://www.energystar.gov/index.cfm?c=airsrc_heat.pr_as_heat_pumps
http://www.eere.energy.gov/consumer/your_home/space_heating_cooling/index.cfm/mytopic=12620
Ground Source Heat Pumps (Geo Exchange Heat Pumps) require expensive investments in drilling and pipe laying.
Air Source do not. They don't work well in really cold temperatures.
Depending on the ratio of your gas costs to your power costs, an ASHP may be a really good idea.
Alan from Big Easy is your poster here with great expertise in this area.
Note this assumes you have already done everything you can to improve insulation!
Not at all. Some time ago, I had written about this topic before suggesting that gas-stations should form a fund to pool some money to store generators on trailers that could be moved around from station to station when blackouts occur. Failing this, they should store some kind of human powered mechanism that could pump gas.
Whatever solution they prefer is acceptable to me as long as they have a solution. When electricity and gasoline become scarce, like in a weather-induced blackout, the most inefficient thing to do is to have people driving around all over the place trying to find a functioning station, then queuing up for long periods of idling along in a very slowly moving long line.
Bob Shaw in Phx,Az Are Humans Smarter than YEast?
Sounds like a great opportunity to steal fuel: cut power to a station at midnight, and pump away.
unfortunately, for him, he wasnt so ingenious with a getaway
I am seeing that too, and a number of market studies confirm a significant share of the current market -- perhaps around one-third -- is seeking that type of development. The demographers and analysts are forecasting that demand to increase simply due to existing trends. Peak oil, global warming and related cultural shifts will impact those trends, although no one can say exactly what scenario will happen. For more background info on this, see this post that summarizes many market studies and forecasts.
Sprawl is driven by the availability of personal transport: hence the 'streetcar suburbs' pre 1945, and the automobile suburbs post 1945.
We have now reached the logical extremes:
- 'ruburbs' where suburb and countryside blur (eg local towns, within commuting distance of urban megalopolises, that themselves become significant centres; suburban houses on 5 acre lots etc.)
- 'Edge Cities' which are defined by big box stores, mcmansions, and the intersections of major highways rather than historic villages or towns. Often the inhabitants live in planned, 'gated communities', a reversion to 19th century form.
First the people move out to the Edge City, then the office parks and the shopping follows.I would say Edge Cities are really a 1980s and 1990s phenomena, so the Energy Crisis did not put paid to them.
As to infill, I suspect it has less to do with energy costs (cost per mile has not grown faster than incomes) than with congestion and other costs. As a city grows bigger, the bits centrewards can become more valuable.
So the suburban strip mall becomes valuable in another usage. The streetcar suburb begins to acquire 12 story office buildings. The shopping mall, killed by the 'Big Box' standalone stores on a value-for-money basis, has to reinvent itself as a services-and-entertainment destination.
The big challenge is zoning. Ed Gleaser at Harvard has shown that the US cities which have experienced population growth are those that don't put constraints on change of land use, and allow sprawl: think Phoenix, Dallas Metroplex, etc.
By contrast, older, coastal cities (NYC, Boston, Southern California) have imposed tough zoning laws to 'preserve' neighbourhoods. The result has been housing prices rising much faster than incomes, and migration to the 'new cities' of the Southwest.
The strategic response of the 'old cities' has to be to increase density around the transport nodes. Affordable condominiums may not be the American Dream, but they meet the lifestyles needs of many who either do not wish to, or cannot, afford single family dwellings (think retired people, divorces, young immigrant couples with limited or no savings, 20-somethings buying their first home whilst still carrying student debt, etc.).
http://www.mintomidtown.com/home/home.htm
is a Toronto example of same. A 30 storey and a 50 storey building plonked down in a neighbourhood of 10 storey apartment buildings, 2 storey stores/ offices and single family dwellings: a typical 1920s suburban development.
At some point price will goad people into carpooling. This is not really a fate worse than death, though many think so, and has enormous potential to reduce the number of people on the road. And, a follow on effect is that getting 10% off the road will reduce congestion, increasing energy use and reducing transit time.
with regards to the temporary changes brought about by price hikes, could it be that people respond to price changes more than absolute price? (ie, would it be possible to plot change in price vs change in miles traveled? )
Andrew
--
the early bird gets the worm, but the second mouse gets the cheese
I think the reality is that people are pretty non-linear and complex in the way they respond to stuff. The response is to a mixture of the change (sudden large changes inspire a stronger emotional response and thus inspire more action than gradual changes), the absolute level (if gas prices are high enough, some people just can't afford to do some things regardless of how they might feel about it), the history (the first price spike you might ignore, but it primes you to pay more attention to the issue and thus on the second one you take action), and perceptions of the meaning of the change (if you are convinced the changes are temporary, you are less likely to take action than if you believe them to be lasting). No simple quantitative formula is going to capture this very precisely (and any complex formula will have too many parameters to be of much use in prediction).
Stuart, you have to allow for other factors, especially the recession that followed the latter price jump.
Why does a commuter choose to commute in a vehicle 25 to 30 times their own weight? Because that was the road to maximum profits for Detroit and Big Oil.
The biofuel initiative is an example of a policy success that could offset 3-5 mmbpd of crude w/w fairly quickly.
If "personal vehicle" fuel taxes in the US,China and OPEC exporters were phased in to Euro levels, the effect on consumption would be breathtaking - but, many argue,less so than the political fallout.
The alternative is a few more years of "transition 1" before the crisis managers are called in.
:-)
I was always looking for a QUANTITATIVE explanation for this statement. Living through both of these recessions it never struck me that the price of gas or energy in general was such a problem. In Europe the main concern was the price of labor. There were a lot of rather troublesome and economically very disruptive developments like strikes and unpaid shutdowns and not once did the parties, industry leaders and unions in my memory fret much about energy prices. They did fret a lot about working conditions, the 40 hour work week, insurance and retirement contributions. And my Dad always went to the gas station and filled her up right. Not once did we have to walk because the car had no gas.
So what is the evidence that a future sticker shock at the pump will lead to a recession?
Well... I don't.
:-)
Price elasticity is almost always negative. Increase the price of gasoline, people will consume less. Short term estimates are around 10% I believe (50% increase in the price of gasoline, 5% decrease in gasoline consumption). Long term estimates range 0.30 to 0.5 ie 50% increase in the price of gasoline leads to a 15-25% decrease in gasoline consumption.
Whether gasoline consumption reduction is achieved by buying more efficient vehicles, moving closer to work, driving more economically etc. is unclear from the data.
Income elasticity is almost always positive. So over time, GDP rises, and so does the amount of driving, and the consumption of gasoline. This offsets increases in efficiency.
This is the problem with CAFE-type restrictions as opposed to price increases. Cars become more efficient, so people find it affordable to live further away from work, and to drive more.
The real brake on VMT is congestion, as Stuart points out. Traffic congestion grows more or less in line with GDP.
New roads tend not to reduce traffic congestion, because of a phenomenon called 'generated traffic'. The existence of a new road, over the long term, increases the number of facilities and people who want to make use of that road. If congestion drops, people will take more trips.
That doesn't mean a new road is always a bad idea (there is utility created in those new trips ie people are better off) but it does mean you can't solve traffic congestion problems just by building roads.
I think you might rather have written: 'Assuming continuing growth in GDP, a real brake on VMT is increasing congestion.' I say 'a' brake, because there are others. Public policy can increase congestion by limiting the amount of new traffic capacity; it can also brake VMT by limiting parking (or raising its cost), introducing road pricing, etc. But these all pale in shockvalue to a phenomenon that I anticipate: declining road capacity; i.e. closed lanes and roads.
The whole issue of Peak Oil is inseparable from the issues arising from declining energy quality (more coal, bio-fuels, degraded oil, less natural gas, and so on). In the center is the impact of declining quality on economic productivity. I think it is improbable that North America can overcome the downward pressure on productivity arising from declining energy quality, at the same as it experiences a declining quantity of transportation fuel.
Moreover, there is the problem of replacing deteriorating infrastructure, as well as those roads and bridges crumbling under the weight of nature's wrath.
All of this is occurring in the context of high public debt and household exhaustion. The infrastructure deficit grows as taxpayers refuse to provide the taxes needed to overcome it.
I don't expect 100 mpg cars, electric cars, and the like, to be anything other than marginal efforts in response to rising transportation fuel costs. Instead, I expect to see more people in each car and the slow and steady removal of road capacity. I also expect the cars to travel more slowly as they wend their way over rougher roads.
The economic logic of electrified and other other rail based transportation will impose itself.
You can open up choke points like bridges, but fundamentally traffic rises until the roads are jammed.
Agree that if GDP is not rising, then the issues are very different.
Colour me a 'moderate sceptic' re Peak Oil (but a strong believer in anthropogenic Global Warming). So I don't expect to see the effects you describe for some time. (although Oil is an exhaustible resource, therefore at some point it will exhaust).
The point is not just about peak oil (likely now or soon) or peak NA natural gas (past), but about the quality of the remaining energy and its eroei (two related but not identical attributes).
GW is the elephant in a house whose foundations are being consumed by termites.
An interested sidelight to the CAFE requirements is that they were advocated on the basis of increased energy independence. In a sense, that is correct, for we would be importing even more than we are now, but it is important to point out that we are importing more now than ever.
Stuart, I've enjoyed your recent posts, for they point to serious shortcomings to some of the alternatives such as increased public transportation. The one thing that seems clear to me is that to fix this problem, we need to move private transportation off of oil-based fuel, and to another method, i.e. electricity, and work on improving that. Any comments?
Efficiency gains will be slow at 4% since the vehicles already on the road are not going to get to be 4% more efficient every year by themselves.
Ain't it?
Another factor to think about. During the first oil shock, the low mpg cars replaced were quite likely the older cars on the road. The low mpg portion of our fleet is now composed of late model, expensive SUV's, which are much less likely to be replaced at the same rate as the low mpg cars of the past.
When you see a shrinkage of the american economy is that based on a particular oil price (or timeframe)?
Another issue, related to the monetary issue, is what impact oil prices have on money supply and wealth in this country, compared to the 1970's. During the first oil shocks, we were a net creditor nation, and we only imported about 25% of our oil. This meant that most of the money spent on gasoline never left the country, and the money which did leave the country came back in the form of foreign purchases of american exports. So, even though gas prices were high, I would argue that it had essentially zero impact on the finances of our country.
This situation now is much different. Most of the money spent on oil immediately leaves the country. A portion of that money stays outside the country in the form of foreign reserves. The portion the does come back is likely in the form of purchases of goverment debt, corporate stock and assets of the United States. I would argue that this money basically never trickles down back into the pockets of the average american, as it probably would have in the 1970s.
Our dependence on foreign oil results in a steady drain of money from lower and middle class class americans, and into the pockets of foreign governments, foreign countries and the wealthy class of this country. The higher the price, the faster the drain. The faster the drain, the faster our economy collapses from the bottom up.
No one has ever, in the history of man, been able to call what will happen to that degree (other than through pure blind luck).
An "articulate" but irrational prediction is still ... well I hope you see the problem.
I did not say, however, that we will have a collapse of the dollar. I simply said that there was a probability of that happening.
Now, reading elsewhere on the Internets this morning I read:
Did you do that? Did you assign reasonable probabilities over all your possible worlds?
Because I have a bad feeling that a people here at TOD are simply picking outcomes that they find appealing (in their gloom) and feeding the group-reaction they generate.
You are right, a lot of the talk on TOD belongs into the psychiatrist's office. It is people expressing their fears of the future and trying to deal with it in an irrational manner.
Unfortunately, PO has its bad name mostly because of these people.
(Theoreticians sometimes work beyond available measurement.)
There are plenty of examples of theoreticians seemingly pulling the rabbit out of the hat. But even I was very surprised to learn from science historians that in most cases the hat, the rabbit and the other utensils of the "trick" were very often around for decades... but nobody had a clue how to put them together. That is certainly true for much of physics. And it never stops to give me great pleasure to discover that even the smartest of people only cook with water... they just cook much better than I do.
:-)
"It is people expressingtheir fears of the future and trying to deal with it in an irrational manner."
Or, trying to deal with it in a rational manner, which some term "irrational".
"Best hopes" for a New Year...
The Upside of Down sets out a theory of the growth, crisis, and renewal of societies. Today's converging energy, environmental, and political-economic stresses could cause a breakdown of national and global order. Yet there are things we can do now to keep such a breakdown from being catastrophic. And some kinds of breakdown could even open up extraordinary opportunities for creative, bold reform of our societies, if we're prepared to exploit these opportunities when they arise.
The chance that improved vehicle fuel economy will be enough without investments in Urban Rail, geothermal heat pumps, etc. suburbia continues as is, and we do not have to resort to the most effective short term oil savings (recession/depression) are in the 1% range IMO.
The path downward is quite unlikely to be smooth, consumer behavior is unlikely to be completely rational, the rate of decline is unknown (even if it is smooth), and there is VERY little elasticity in the system today. (Germans, French and most Europeans have an alternative non-oil transportation system that they can easily switch to and it will take another 12 minutes or so to get to work. Few Americans have a non-oil alternative, hence our low elasticity of demand).
I find your optimism unwarranted and "it's incredibly frustrating".
We face a series of unknowns but we can guess as to the range. As an example, annual declines in global convential oil production will likely be between 1% & 9% (average over two decades). World oil exports are likely to decline 1% to 5% faster than world oil production.
History suggests that that moderate oil supply interruptions of ~1 million b/day will occur every few years and larger ones every decade or so.
I concentrate my efforts on actions that CAN MAKE A DIFFERENCE and not bemoaning the future. But that does not mean I ignore the risks. Perhaps all that I can do is turn a horrifying future into a merely terrible one. That is worth doing !
Best Hopes for Active, Rational Planning,
Alan
I don't believe we know enough to seriously exclude, or to seriously assign confidence, to those worlds.
A key factor is our ability to provide things of value (currency or actual stuff) in return for oil, at global market prices.
Peak Oil could contribute as a cause to a dollar collapse.
But a dollar collapse could push back Peak Oil.
I think.
The new economy of America, which basically consists of the financial sector, healthcare, and service jobs, exists only because of massive influx of energy into the country from other countries. This allows us to support a massive infrastructure/lifestyle that otherwise could not be supported. Other countries only send us this excess energy because they have considered the US dollar to be of value equal to the energy/goods sent to us, and because there has been a global surplus of energy. Once that stops, our GDP will drop to a value equivalent to our internal energy production, or about half of the current level.
Odograph, try not to get hung up on my use of the word will. If you disagree with my premise, please let me know your thoughts/theories as to how the dollar can maintain its value when there is not an equivalent output of the most fundemental requirement for life, energy.
I could see the trouble building, and was amazed at how long it could go on. Now we have had two corrections in that time, but neither one was the crash predicted (for the ongoing one, knock wood).
So it's like, who am I to know when a correction will be hard or soft, or what the landing will look like? Can anyone tell me what the final percentage loss will be for southern California homes in the current downturn?
If no one can tell me that, why do they want to move on to grander questions, like the economic outcome for the entire world?
I didn't leverage, or bet my future, on those two outcomes.
(I believe the market is deciding now if it is going to stay mild or go bad.)
There are some big surprises. Like that housing prices rise by 0.8% pa (real)-- that's all, despite all the radical changes in population and GDP the US has undergone in the last 110 years. Of course the regional variations are huge (a house in Buffalo doesn't now cost more than it did in 1960 in real terms, whereas Boston and California are another matter).
One of the CEOs of a really big homebuilder said something really clever, along the lines that housing slumps usually last 8-9 quarters, and this one peaked in July 2005. ie Q4 2007 to bottom out.
Commentators calling the turn now are way too early, there is another year of pain to be taken if this is a normal housing slump. Right now I think the US is in the phase where the sellers can't believe that prices have dropped, and the buyers won't pay the prices because they expect them to go lower. So relatively few transactions.
As many as 1 in 4 new mortgages in the last 3 years, AFAIK, were sub prime lending. This is the recipe for a complete collapse, (ie a 30%+ price drop), as that starts to unwind and those houses get liquidated.
Like you, I am a devotee of the Calculated Risk blog-- the guy really knows what he is talking about.
FWIW, a friend of mine has a house on the market. He is being treated so badly by prospective buyers (low-balls 25% below already lowered asking price) that I can see this is not the end. Buyers are taking their time, and grinding the sellers.
If you look at the Bureau of Economic Analysis website, and get this spreadsheet:
http://bea.gov/bea/newsrelarchive/2006/trad1006.xls
You'll have plenty of info, but I'll point out that services exports, total, where $380 billion in 2005, and imports were $315. On the other hand, manufacturing imports were $1,667 billion, and exports were only $894 billion. $229 billion (look at exhibit 9) of this deficit was petroleum, which means that 763 - 229 = 534 was still, by and large, manufactured goods, so it's not just a question of energy.
The main problem is that services, by and large, are those activities that people do once they have manufactured goods. For example, retail (like Walmart) retails manufactured goods, airline services use jets, the health indutry uses machines and drugs, etc., so it's very difficult, unless you are Bermuda and you can make your money from tourism, to support yourself with services.
So eventually the dollar will crash, and stay there, until and unless our manufacturing base recovers, and for the purposes of this discussion, that means that the price of gasoline will go through the roof.
As I recall, he made a number of points about our energy situation, one being that we would 'export' about 320 billion bucks on imported petroleum in 2006. While some of this goes to produtive uses, much goes into nonproductive transportation frivolities.
He also made the point about the hidden external costs in a gallon of gas that actually push the price of a gallon from the Persian Gulf up to about $3.68. Those hidden costs are, of course, tied to our military expetitionary forces in you know where.
I believe that the original document can be found on the energybulletin.net
No he didn't and if we did, why didn't someone give me some of that $450 Billion:).... Oh, maybe my sister will give me a bottle of (imported) Scotch
"Our HOME-GROWN dependence on foreign oil results in a steady VOLUNTARY drain of money from lower and middle class class americans, and into the pockets of foreign governments, foreign countries and the wealthy class of this country."
All you really have to do is to decide to stop this and the problem goes away. Not magically... but deliberately.
For what it's worth, I can agree that many things in national and international commerce are worrying. I can even say that I see trouble brewing.
It's just that I think I'd be kidding myself if I claimed an outcome based on those fears, vibes, whatever.
No one is that smart.
Maybe I am :->
Since many people I know simply lease their cars/ get it through a company scheme, and then trade it in after 4 years for a new car, the only way they see the depreciation is in a higher monthly payment (the leasing company adjusts by the predicted residual value).
And often that means they only see it when they pay the tax on their company car allowance.
So they are paying that cost, but it's not obvious to them.
That said, SUV sales are down in the UK, the constant attacks appear to have had an impact on the trendiness of same. Sometimes unfairly: a Honda CRV has better fuel economy than a Lexus sedan.
Not before time, I might add, though.
What would happen is exactly what happened with the gas guzzlers in the 1980s. Remember those old Chevy Impalas with the 454 cubic inch engines?
They become second (or third or fourth) family cars, cars driven by low mileage users, cars driven by teenagers, students etc. People keep them for weekend camping trips, and buy fuel efficient cars for daily commuting and trips to the mall.
In market terms, the SUVs turn out to have very high depreciation rates (just like the gas guzzlers of the 1970s). You'll find Hispanic immigrants driving them to work in 7 years time.
One of the reasons US productivity growth dropped so much in the 1970s was probably because of the need to switch the US economy over to lower energy consuming activities. Factories had to retool (or close), commercial and private vehicles had to become more efficient, oil fired power plants had to close, etc. All of that reinvestment activity had an economic cost.
The concern with the US now, and with modern China, is that capital equipment can have a 50 year life span (a coal fired plant built in 1955 is still chugging away now). So if either side 'locks in' to energy inefficient cars, buildings, power plants etc, it will be a big cost to prematurely scrap that in the future.
Granted the production machinery will have been almost entirely replaced or renewed. But the plant structure will still be there.
Nuclear plants are, of course, an even more extreme example-- 60 year operating lives are being planned for.
Oil fired plants my father built in North America in the 70s are still running in the Middle East now.
Gas turbines shipped to Middle Eastern and Mexican oil producers in the 70s, are still a lucrative market for spare parts now- -especially places like Iran and Iraq.
Jet planes of course famously fly for 40 years- -again their engines have been replaced or overhauled.
I can show you 30 year old steel mills which were dissassembled in Germany, and shipped lock stock and barrel to Manchuria in China, and set up and run again. The original owner may not be using the equipment but it is still out there.
Not necessarily. If other ways of producing energy will be cheaper, they will simply shut it down. To write an investment of once is cheaper than to hemorrhage money all the time.
"Nuclear plants are, of course, an even more extreme example-- 60 year operating lives are being planned for."
Again it does not matter what they planned for in the past. If the realities of the energy market change, so will operations. Nuclear power is fine with me, but we need to solve the waste problem. Not technically but politically. So far that has not happened, yet.
"Jet planes of course famously fly for 40 years- -again their engines have been replaced or overhauled."
I think a plane is practically being rebuilt every 20 years. The only thing that stays the same is the airframe. And even that might be cheaper to get rid off in the future if a new design has vastly reduced operating cost. Not to mention customer value. The 777 and 787 are selling very well because customers demand the comfort the new planes offer. I always make a conscious effort to fly a better plane when I pick my fligths. I know a lot of people who do that, too. We might not always get what we want but in an industry that depends so extremely on load balancing as the airlines do, the little perks of a silent cabin, larger windows and higher ceilings do make a difference.
"I can show you 30 year old steel mills which were dissassembled in Germany, and shipped lock stock and barrel to Manchuria in China, and set up and run again."
So were German breweries which went to China. The reason is simple: in cheaper labor markets, near the source of iron ore and coal etc. these factories might be profitable to operate, even if they are not in the US or Europe. One man's scrap is another man's future. But all of these movements are accelerating. Where 50 years where typical in the past we are now looking at 30 years and 30 years in the past mean 15 years today. China used to buy a lot of second hand equipment. Today they are buying the best and latest.
A few percent efficiency difference pay for the cost of the new equipment in ten years time or five if energy is expensive enough.
Obviously if you tax the CO2, then the picture is completely different.
Once the capital cost is paid, the marginal (operating) cost of a lot of this equipment is so low it tends to stick around. This is also true of those steel mills shipped to China.
Which is the danger of allowing new pulverised bed coal plants to be built. We will almost certainly be faced with a difficult choice in 20 years time: whether to scrap them prematurely for environmental reasons, or not.
I think the cost of scrapping plants built today 20 years from now will be marginal. We will be able to live with it.
China is already learning the lesson that human lung capacity for aerial pollutants is limited. I think we will see very tough envirnomental regulations being imposed shortly. They have very good ways of dealing with people who do not follow the rules, too: they shoot them and send the bill for the bullets to the relatives.
Obviously that sets them up for a catch-22. If demand will be met, why change the fleet? If prices will be under control, why should hybrids penetrate the market any faster than they are now.
What I read into Stuart's 70's stories is that different conditions can lead to very different retirement and replacement rates.
But this is what I called this morning "a prediction horizon beyond which we cannot reasonably foretell."
We don't know the conditions, that will create the mood, that will create the reaction.
It's amazing how many people are sure though, who think they know how it will break out.
But I suuppose you know how to use the word so thats ok.
Taken far enough we would all have to stop speaking or expressing viewpoints on this site. We would be constricted in what words are ok and which are not. We would all have to hire attorneys to tell us what we can and cannot state.
Aren't you pushing it just a tad too far into the ridiculous area?
I could parse all of your sentences and find ambiguity in each one.
For instance: 'We dont' know...yada yada::: Are you speaking for everyone here? How do you know what WE think? etc etc
on and on and on...
Say we are doomed, collect a virtual high-five from someone like minded, repeat. It might all be fun, if you don't take it too seriously.
But one thing is that we will certainly have learned what others think, as opposed to sitting alone cogitating upon our own navels...and then finding a website to post them on ...
Not implying this is your activity..just speaking in general terms.
However I believe that those who have had valuable experiences or knowledge that exceeds the others that it is needful that they share that knowledge for the betterment of us all.
Lots of smarmy platitudes above...sorry.
For all its warts(very few) I am grateful that this site is here and functioning even though it causes me a lot of sleepless nights.
http://www.mnforsustain.org/oil_peaking_of_world_oil_production_partIII.htm
It suggests that half the car stock is replaced every 10-15 years. That is a pretty good clip, actually, representing a turnover rate of 5% to 7%.
They can and will be written off.
The problem with your post is that you link shrinking energy demand with a collapsing economy. There is absolutely no logical link in the real world. Energy is a minor fraction of the economy. The US has a GDP of $12.3 trillion. Oil imports were roughly $300 billion or 2.4% of that... Per capita that is $1000. If we would spend $1000 per capita and year on conservation, we could reduce our oil imports easily by 5% per year and be energy independent in a few decades. The $300 billion in spending would, by the way, mostly stay in the US and ADD to our GDP and prosperity.
Think about it...
The US has plenty of renewables. It just hasn't made much use of any of them. The problem is not technological. It is political and sociological. But politics in general has a tendency to adjust to realities rather fast once the pressure becomes too large. And one can expect the pricing pressure to become enormous the day PO hits for real. People will wake up, smell the roses and politicians will make a 180 turn on the spot and claim that they were always for conservation and that that gas tax has been on either parties list since the 1970s and that it was the other party which always held it up. It will be fun to watch the stones fall...
:-)
Our economy is not set up to deal with shrinking resources - it assumes growing resources, so as to cover the interest charges associated with repayment of debt. Once the situation changes, the monetary system as we know it will be in trouble. The system may fail altogether, or there may be hyperinflation.
There are lots of examples of collapes - the recent one in Argentina, and the one in the early 90s in Russia come to mind. If a society doesn't have money, or if a person's saving suddenly buys virtually nothing, the world is very different. Your comments about writing off the cost of building lots of new vehicles becomes meaningless in the context of a collapse.
While I'm glad IP and I were able to find common ground, for at least heading in the right direction in the short term will be a good thing, where IP and I differ is in the longer, broader scale. I'm all for renewables. But we're presently consuming 40-50% of the biotic production of the planet, subsidized by the huge amount of fossil fuels we burn. As the ffs necessarily subside, we'll turn ever more to the biosphere for energy. The portion we're using now is already exterminating species left and right (200 a day by some estimates) and stressing nutrient cycles beyond their limits, both terrestrial and marine. 6+ billion of us will not - can not - live sustainably on this planet.
But that is the mean car life.
I don't know what the median is, but I find it hard to believe that half the cars I see on the road are more than 16 years old.
So I suspect a degree of skewness, at least in which cars are driven-- the curve would favour younger cars.
In a North American winter climate, cars just don't last that long, even with modern rustproofing, etc.
:-)
I mean, I know plenty of people who buy cars, maintain them reasonably well, and drive them into the ground - and they generally don't last 20 years before they have repair issues that exceed the cost of buying another used car in better repair.
Perhaps the insurance industry has some data for us?
Average age for US cars: 9 years (2001). Median Age 8.1 years (2001). median 8.9 years (2005). Table 3
Interestingly both numbers have been rising steadily since 1970 from 5.6 average and 4.9 median-- a sign of the greater durability of cars, and also magnifying the problem of replacing them. It might also be a sign that individual cars are driven less (households own more cars, drive each one less, total mileage is greater).
Now this is not inconsistent with the average car lasting 16 years (ie except for a very few models, most are scrap by their 16th birthday).
If the US car market averages about 14 million new cars a year, and this is about 6% of all cars in the 'park', then in 8 years, about 48% of cars would have been produced ie 48% of cars would be 8 years old or younger.
So now we gotten around two years without doing anything to the fleet. But wait... we could actually share commutes. That just doubles the efficiency for everyone who does it. 10% of all commuters share a ride and we get another year or two at 4%. We still haven't done anything to the fleet.
You could buy a Prius. That cuts average consumption in half. 4% decreases a year amount to 66% reduction over 10 years... So if you buy a Prius, you are good for at least another 10-12 years.
Add all of these savings up and you are looking at a 20 year timescale before the problem starts to be serious. But wait... 20 years from now we can build 120mpg hybrids and EV powered by solar energy...
I guess the problem is not as severe, after all...
The vehicles that put on the most miles tend to be the newest. Somewhere in another thread I think it was estimated that we could replace the vehicles that drive about 50% of the miles, in five years.
Using figures from http://aqp.engr.ucdavis.edu/Documents/sensitivity.pdf, the 50% point is about 9.5 years. But that's California; other states may age vehicles more quickly.
The data on page 15 suggest that 8 years of sales accounts for 49.0% of total VMT (cumulative total of %'s in 4th data column).
The same data indicates that the median life of CA vehicles is 16.6 years (total vehicle population divided by last year sales), while the same figure for the country as a whole is 12.4 years (210M divided by 17M). So, apparently California is not representative.
The same ratio (8 to 16.6) applied to the national figure of 12.4 gives 6.0 years, fairly close to the 5 year estimate.
Amory Lovins (et al.), a technological optimist who I have been surprised to see not much discussed at TOD, argues in Winning the Oil Endgame (March 2005) that reducing vehicle weight, not improving engine efficiency, is the surest way toward much more energy efficient transportation, especially cars <http://www.oilendgame.com>, pp. 77 ff. Available as free download for personal use.
I think the reduction in vehicle weight was a bigger factor in the changes you outline for the 1970s than you acknowledge. I remember the Honda Accord as perhaps the defining vehicle of the 1970s; introduced in 1976, its sales went through the roof in the following years <http://www.edmunds.com/insideline/do/Features/articleId=46009>.
In the early 70s, my family drove an Olds 98. Big as a small bedroom, it could carry a family of 7. In 1977, being on the cutting edge, we got a Honda Accord (which were very light cars in those days). It had double the mileage, but could no longer carry a family of 7. Thus, we would often have to take two cars.
The point is that changing the problem to be solved, such as how many people are traveling in a vehicle of what size (and how much performance) plays a much bigger role than technology improvements on the status quo. In light of that, I believe your estimates of potential savings from additional efficiency improvements are overstated.This document from the Center for Sustainable Systems (U Mich.) has some interesting data as well:
So clearly, there is no technical barrier whatsoever to a number of decades of 4% fuel economy growth.
Huh? What about rolling resistance and air resistance at high speeds? You still need to accelerate a certain amount of mass to driving speed--and you will not get it all back in regenerative braking.
There is an upper limit here--it's called 100%. And the closer you get, the more difficult and expensive it is to get the next 4%.
Thxs for your detailed post! A very quick & cheap way to raise avg mpg is too discourage the one person/multiton vehicle commute as much as possible. A rapid gas price shock will make many choose cheap scooters and motorcycles, yet retain their bigger vehicles for when they need to haul larger loads or passenger groups.
Used scooters and motorcycles are very cheap relative to even used cars, and the same financial savings are comparable to new two-wheel rides vs new 4-wheel vehicles.
Personal mobility is still retained, just as with bicycles: which I believe is more important to the vast majority of people in my Asphalt Wonderland than becoming time-dependent upon car-pools, bus schedules, or non-existent mass-transit.The ever-increasing urban road congestion and time spent idling in traffic, or barely moving, represents a tremendous waste in fuel. An idling 125-600cc scooter motor will use much less fuel than an idling 4,300-7,400cc V8 engine running the interior A/C or heat, radio, cellphone charging, and DVD player. Even an idling, or barely moving 1,400cc 4-cylinder compact car wastes tremendous amounts of fuel versus the scooter if there is only one person inside the car. If my Asphalt Wonderland had the foresight to allow two-wheeled riders to lane-split, as is allowed in California, then even less fuel and time would be wasted by two-wheeled riders having to idle in traffic.
Years ago, the Phx Megaburb was split in two by our normally dry Salt River being flooded for months: there was only two bridges spanning the riverbed and the traffic jams were legendary, yet people would just sit there for hours just inching along. My solution was to bicycle my 20-mile roundtrip, and I would literally pedal past miles of practically stalled traffic. I was simply amazed that so few people were willing to try this solution.
Just shows how attached people are to their 'personal mobility' even if they aren't really going anywhere.The motorcyclists, to their credit, would at least turn their engines off, and then push their rides till traffic flow speeded up, but they really wanted permission to legally lane-split. No-go.The recent postings of gasoline queue fistfights in the Northwest does not cheer me up-- I would think that with all the downed trees obstructing traffic that the simple task of lifting a bicycle over a tree, or going around it, would be much less stressful than traffic jams and fistfights.
People seem to have a very hard time thinking outside the box.Bob Shaw in Phx,Az Are Humans Smarter than Yeast?
People seem to have a hard time thinking in general when it comes to transportation. (TOD readers excluded of course)
Scooters and motorcycles work in some cases: good weather.
Who is willing to risk their lives and comfort riding one for commuting 25 miles each way in rain and snow?
Considering that much of the US population growth has happened in the sun belt states, Snow and Rain are not that much of an issue. If there is a sudden spurt in Oil prices, we could afford to outbid Indians and Chinese to import a half a million of these in short order.
Another concept is Free Public Transport, maybe even privately run, or by Charitable organizations, Free transport, aka websites that run on Ad dollars alone.
Wasn't there some proposal in Western Australia for Free public transport? It was also tried in CA on smoggy days I think.
I have a question about manufacturing.
You estimated a fleet turnover of 6% and then assumed that entire 6% will get Prius or better mileage.
But as I understand it, Prius's are hard to get even now. Toyota can't make enough of them. And they only account for a small percentage of new cars.
If most/alot of manufacturing is dedicated to SUV/trucks, will that manufacturing capacity be able to output Prius level vehicles?
So improvements in milage might be limited by the ability to manufacture newer technology hybrid type vehicles. You can't make enough of them fast enough to get 4% improvement in mileage.
I guess you could make it up with scooters, econo cars and what not.
Just a thought.
One caveat, though--what is the environmental and energy impact of accelerating vehicle turnover? I ran across a reference to a study of the life-cycle impacts of automobiles undertaken in Germany by the Environment and Forecasting Institute in Heidelberg. That study estimated that the environmental cost of manfacturing a new car is equivalent to the same car being driven 35,000 miles. Further impacts occur during the disposal process.
Perhaps its better to keep some of those older vehicles on the road for a while longer.
Sure, I don't really see a problem in re tooling assembly lines from one vehicle to another. Car manufacturers do this from time to time now.
I was thinking more along the lines of the hi tech parts that make up a Prius or other hybrids. Ie the electric motors, the batteries and what not.
Is there manufacturing capacity for a sudden increase in demand for these parts? How quickly could capacity be brought on line. Are there any naturally limiting aspects of manufacturing (ie copper for the motors)?
Realistically can we get enough of these vehicles on the road quickly enough to get Stuarts 4% increase?
And in a used car market your Honda civic will bring much more than an Escalade, someday.
I am glad to see city planners at TOD. IMO city planning is of the utmost importance in dealing with the challenges of PO. Unfortunately, it is a more difficult and slow process than even changing the vehicle fleet.
These are things that I have thought about:
--Needs of the increasing percentages of poor/unemployed populations which will migrate to be nearer to their services. They'll be the first to be without transportation, and need assistance in food, housing, medicine, and heating/cooling.
--Bike paths, and more bike paths.
--Making travel safer for mopeds, electric bikes, scooters and small electric vehicles.
--Encouraging incentives for bringing back the corner grocery and hardware stores.
--Mandates for energy efficiency in all buildings.
City planners do see the results of some of their efforts within the next few years, as a wave of mortgage foreclosures strikes suburbia - and people move farther out or closer in to town.
50 MPG?
I couldn't find the numbers for a 98 model, but a 2000 Civic get 35mpg highway according to the EPA.
If you are getting 50 on a 8 year old vehicle, that's pretty amazing.
You sure you don't mean 40? Which is still very good.
My father's 2001 civic rarely beats 30 mpg, a big disapointment to him. However, he has airbags, more steel, larger interior and an automatic.
I think they also have now upsized the Civic, so it is really what the Accord used to be.
Does that mean the Jazz is the new Civic?
I love Hondas: a German style ride and handling, with Japanese reliability. Toyotas are mushy in ride and steering by comparison (I think the Japanese consumer prefers them that way).
So real world driving is anything up to 30% less efficient.
Half of the new cars sold in Western Europe are diesel.
Cost is typically c. $2000 more per vehicle.
All of the auto majors now have access to good diesels. The French actually make some of the best (government policy encouraged diesel fuel after the energy crisis). The Japanese were slow off the mark, but seem now to offer pretty fuel diesel ranges.
Problems for the North American market:
- only the very latest diesels meet the environmental standards
- diesels have poor market acceptance, after GM completely botched it in the late 70s with some awful engines
- diesels have a reputation for being smelly and dirty, which is not true of the new engines, but still hampers them. And the latest, cleanest Mercedes diesel injects urea (read urine) into the exhaust to clean it up-- you can imagine what the popular press will do with that!
- low sulphur diesel fuel only just becoming available
- European diesel engines may not be big enough for US market requirements
I am surprised when I see predictions that diesels and hybrids will only be 10% of the US market in 2015. I would have thought it could be 50%.The answer to that is simple:
By NHTSA and EPA decree (at direction of US President) allow cars which meet modern EU safety & fuel economy standards be allowed in US without change.
It may be hard to get enough hybrids quickly. It wouldn't be as hard to get enough 2.0L Diesel compacts, and they'd get 35-40 US MPG.
The problem in Europe and Japan is much harder---they're already using efficient vehicles.
Given that hybrids are complex, and Diesels comparatively simple it seems that improving the essential thermodynamics of the motor (going to Diesel-powered) first and then adding hybrid tech to that seems more generally reasonable.
When TSHTF, pollution concerns will unfortunately be tossed aside.
Current price of gas is about 86p/ litre.
The largest cost is depreciation (cars cost more here). Fuel is number 2. Insurance is number 3. Road Tax is number 4.
The real cost of motoring in the UK has fallen by about 10% since 1971. And real incomes have more or less doubled in that time period.
I want you to take a look at something....
http://www.vectrix.com/default.aspx?portal=1&page=61
That's a DC motor. It is some 20KW at 3000 RPM, with a 6000 RPM redline.
It is designed for a motorcycle, these motorcycles in fact:
http://www.vectrix.com/default.aspx?portal=1&page=107
What that means is that this little motor would be able to function in outdoor, rough environments in the hub of the wheel, where they are designed to go in the motorcyle. Why should you care, you ask? Well, think about this as an automotive motor. So you say, "20KW isn't enough for that....but what if you had one in each wheel? Now you talking a 4 wheel drive car, with regenerative brakes so you could say bye bye to the heavy annoying hydraulic brakes...all you need is a good battery pack...
http://www.vectrix.com/default.aspx?portal=1&page=63
Or the advanced lead acid battery by Firefly...
http://www.fireflyenergy.com/main/index.php?option=com_content&task=view&id=49&Itemid=65
(download the technical whitepaper, you will be astounded by the level of work, but this is a spin off firm from Caterpiller, so high quality is expected...
So now you have an 80 KW 4 wheel drive electric, or even better, why not add a very small LPG piston or micro turbine engine for charging batteries and climate control, and have the be all plug hybrid...somewhat like the PML Flightlink Mini, all wheel drive, massive performance, massive fuel efficiency hybrid
http://www.pmlflightlink.com/archive/news_mini.html
Now, why don't we see any of these on the road? Because the manufacturers feel that the risk is just not worth it, unless fuel gets MUCH HIGHER. And the component makers won't even sell in small volume to home builders so they could build for themselves (I have known hot rodders who could have these components together and running in less than a month if you would sell to them, they build kit cars, dragsters, and pulling tractors out of the junkyards that can stand 500 plus KW, this would seem like a kiddie car project) So here we are, knowing what HAS to be done, knowing what CAN be done, but not quite able to get `er done....and don't tell me how no suburbanite is going to be able to afford it and instead will walk away from his half million dollar home....does that make sense? He could have a 100 plus mile per gallon all wheel drive car, and it wouldn't cost much more than his bassboat and matching pair jet ski's for his show off brats....does anyone on this board realize how many vehicles, how many Kilo watts are already in the garages of most suburban homes? This little trinket of an electric mobile would fit in one corner....the only suburbanites I see leaving the suburbs are when their brats grow up and go off to college, and the middle aged parents want back in the swinging downtown scene....it seldom has anything to do with energy.....
But, our time is coming....they can't keep these components off the shelf forever....we are on the edge of a change folks, but not the kind a lot of the "dark and brooding" are expecting....
RC known to you as ThatsItImout
150mph Mini with 0-60 in 4.5 seconds and 1000 mile range?
These things would fly off the forecourts with the right price. Forget the eco angle, the ability to drive in London CC-free AND out-accelerate a Ferrari would sell these by the bucket load.
Stop talking, start building.
"If I took an x-crank and connected it to a fly-hub and built it into a wheezle-whop, I could make a goble-garbler in 2 days time for $134 and sell it and be rich and famous by next August."
And then nothing happens. And then ten years later you read that someone actually built the goble-garbler with a thousand engineers and technitians and spent $3 billion in design and prototyping cost and they are now selling them for $37,000 a piece and are marginally succesful.
One man's engineering wet dream is an international corporation's future business.
/.-)
http://www.cree.ch/
Cute.. If only I could get one in the US.
Could someone build one with a wheel motor?
The same effect of increased efficiency can, by the way, be gotten with a diesel, i.e. high compression ratio engine. Those have been invented over a century ago...
Magic is mostly a function of how well you are informed. One man's magic is another man's dayjob in the engineering department.
I think that is an overstatement. Toyota is making as many of them as there is demand for. If they made more, management would be stupid. Once they will see demand for hybrids rise, they will open another factory. You can be sure they have a couple in the planning.
There was a short demand spike for hybdrids during the height of the gas prices but it has lessened to the point where hybrid sales are great but not phenomenal. People who need a penis enlargement still feel the pain more between their legs than in their vallet.
Please keep in mind that even if 2006 was the PO year, it will take at least 4-5 years before we drop off the flats and into the really steep decline part of the curve. So that makes 2010, earliest. Toyota will come out with a new model in 2008 or 2009 with much higher efficiency. Other manufacturers will increase efficiencies in their cars and you always have the option to go with the model with the smaller engine and save 10-20% on ANY model. There is a lot of flexibility here.
The big selling point with the Prius is it's allowed into carpool lanes. Carpool lanes are a failure, people will do almost anything rather than actually carpool, including buy a $25k gadgetmobile. Carpool lanes have increased congestion, and I'm agin 'em. Which is why my Prius doesn't have the stickers on it, stupid non-move since they'd add at least a couple grand to the value of the car.
Other selling points various parking perks etc like the City of San Jose which allows free parking for Prii bought in the city. Huge perk if you work downtown there. In London you have to pay a hefty fee to take an SUV into the city, a smaller but not inconsiderable fee for a car, and nothing for a hybrid.
Down at the very tail end of people's Reasons To Buy A Prius you find people like me, who simply think the car will last a long time, is great for carrying stuff since it's essentially a small wagon, and will hold its resale value well.
(US gallon, an Imperial gallon, 100mpg might be possible)
Peugeot-Citroen has an 80mpg diesel-electric hybrid, but they say they cannot make it price competitive: hybrid adds $4-6k of cost, diesel adds another $2k or so (plus sales tax, etc.).
Plug in hybrid will do it (100mpg) but the problem of cycling the battery pack, AFAIK, has not been solved.
Now take places where house prices are already higher, such as the east and west coast cities, and you're going to see some insane demand for housing closer in to the city core if prices rise too much.
A big fraction of jobs, now, are outside the city core. Think Redmond Washington, which is probably Seattle's largest employer (Microsoft).
Look in other countries. There are construction workers and plumbers and delivery trucks there, and yet very very few traditional "Ford/Chevy/Dodge" trucks.
Lots of people who NEED light trucks for their jobs would get by just fine with a compact-sized truck (toyota tacoma size) with a 4 cylinder Diesel engine and manual transmission, like whateverybody else in the world uses when they choose based on rational economic criteria, not emotional machismo criteria.
Long haul trucking will be hurt heavily by expensive oil, similar to commercial aviation, as they are already much more efficient and closer to ultimate limits.
if you wanted to make 300 plugin hybrids a day I think that is equivalent to about 0.25 mbpd of energy. Instead of which we are joyriding around in our clunkers.
All in all, looking at the efficiency plot, without any other information, I would say it is asymtotically approaching 20MPG. I would say that a car fleet 20 years from now, will be getting 20MPG....omitting all other information.
In the early 80's mileage increased dramatically because it was easy to increase it.
I worry that all the easy improvements have already been made. Law of diminishing return and all that. How much more efficient can cars become before we hit a ceiling?
Even today's gas guzzling SUV's get equal or better mileage than the 12mpg 1970's average.
Europe has about 40mpg and Japan about 45mpg. It lists the US as 25mpg.
Why are Europe and Japan at only 40-45? Is this the practical limit to fuel efficiency. They have tiny cars, tiny motors everything a conservationist would dream of.
I can't image the US's fleet approaching that of Japan or Europe. The conditions just don't allow it.
So are we going to get a nice creaming curve that cuts out at 30-35mpg? Can we expect to keep getting 4% improvement year after year?
However, all of these factors have limits that are reasonably well understood and explored (if not in the USA). If you define a 'car' as something that 4 people can sit upright in, along with some stuff, and that can cruise at 60 mph, I think it is very unlikely that such a vehicle will ever achieve 100 mpg (e.g., upright single-person scooters don't even get 100 mpg).
Of course, maybe a 'car' will be redefined as a low-slung roach-like vehicle (like the caltech solar car) that a single person reclines in with road bike tires and that tops out at 40 mph...
Regardless of what the EPA says, I get better mileage in my Prius on the highway, essentially it's the reverse of their city/highway figures, and lower both a little.
A/C, headlights, fan, even the radio will eat some juice. I don't think the testers are using any of those.
The Prius is pretty much in the direction you're talking about: Tallish, roomy but very "aero", will hold 4 adults comfortably (although be careful, the paylod of a Prius is 850 lbs or as I think of it, 4 Japanese and their luggage or 2 Americans and their luggage).
Last year, a set of Prius enthusiasts set a record of sorts for mpg using a Prius (article here). How did they do it? They only went about 35mph, they avoided using the electrical system altogether, and used a pulse and glide acceleration system. "Pulse and glide" is another way of saying accelerate smoothly and slowly up to 40mph, then put everything in neutral (removing engine friction drag) to coast to 30mph, accelerate to 40mph again, and coast again.
This isn't the new Prius, but you can see that most of the impressive mileage was due to low speed and good aerodynamics. I can (and sometimes do) duplicate the same "coast and glide" scheme in my station wagon. Speed up to 5th gear and 40mph, hit the clutch and take my foot off the accelerator, at 30mph re-engage the clutch and ease on the accelerator back up to 40, repeat. We usually get about 28mpg combined, I bet I could push it to 50+mpg or so like that. Of course, I would also get a ticket for impeding traffic. Maybe we could add a "pulse and glide" setting for cruise control systems?
IMO the issue is really not technical solutions.
I think that if there are customers, the bike- car concepts are there already. here is an example (of many).
90 mpg(US) for a 3 wheeler is really not a problem. So 100+mpg(US) should not be either
http://www.bath.ac.uk/news/articles/archive/clever-car250406.html
A secure bike also no problem and recently airbags for bikes have been tested.
Here the BMW C1 scooter. I saw it recently in the congested Bruxelles morning traffic- a guy in pinstripe & briefcase doing slalom along the immobile cars.
http://www.bikez.com/motorcycles/bmw_c1_200_2002.php
So the solutions for low energy use could be there already. Maybe the will to produce- and use them is the problem:-)
Kind regards And1
I completely agree. Bicycles, tricycles, low speed electric scooters, and tiny cars are the future. Even heavy loads can be transported, slowly, by a human-powered tricycle (though a battery assist sure helps with hills and wind).
My point was only to inject some physical reality into Stuart's idea of a 4% year-on-year increase in mpg for several decades. The 2030 'car' in Stuart's graph is not going to be a 60 mph 4-seater. This discussion is a little analogous to that surrounding the ever-changing, ever-growing 'all liquids'. First there was crude squirting out of wells at 3500 psi, then lease condensates (e.g., pentane) get tossed in, then natural gas plant liquids (e.g., butane, propane), then ethanol, then coal-to-liquids. The later additions are not equivalent to 1960's crude oil in EROEI.
A 15 mph one-person bicycle is a 100 watt device but a 60 mph standard car is a 100,000 watt device (a small car needs only 10,000 watts to cruise at highway speeds, but it needs a lot more to accelerate reasonably). Amory Lovins isn't going to reduce wind resistance and tire/pavement resistance without fundamentally changing the concept of what a 'car' is.
That's fine with me, but it takes a little wind out of the idea underlying Stuart's presentation -- that we can't contemplate US-ians ever changing their basic habits (e.g., middle class people taking public transportation outside a few major cities). Driving to grannie's in something with the form factor of a 3-wheel Sparrow is not going to be much less challenging than biking to a light rail station.
Take the VW Jetta (Golf) as the best selling European car (it was for about 25 years, a stable 2% or so of the new car market and sometimes as much as 5%).
So we are not going all out for fuel economy.
The big wins have been in lighter materials (but they cost more! aluminium costs a lot more than steel for example) a la the aerospace industry (carbon fibre), more finely tuned engines, and lower drag coefficients (cars as crafted bars of soap).
I agree though, without significant changes in power plant, there is likely decreasing returns to scale on fuel economy.
They don't have hybrids, yet. Neither do they have electric cars. So, no, this is not the practical limit. A Prius is a rather large vehicle for European standards and gets better milage than European average.
60mpg for the fleet is probably closer to reality, with typical 100+mpg for non-electric commuter cars being tghe future norm.
As far as future electric commuter vehicles are concerned... they can easily be "fueled" with the solar arrays that will fit on the owner's garage plus the parking lot space required for them.
Maybe 40-45 is not a technical limit. Perhaps there are other limits ie people just don't want to make further concessions?
BTW Japan does have hybrids, I see Prius's on the streets here all the time.
I also wonder if you underestimate the engineering challenges involved with Plug in hybrids, Electric cars, and Photovoltaics. You keep throwing those ideas out there like they are a given. I'm not so sure.
EV and even hybrid adoption is probably driven more by the geek factor than anything else. I would certainly buy an affordable and practical EV just for that reason. Others will buy a BMW or a Corvette to stick out. Geeks will probably drive and EV. Same reason... it satisfies a psychological need. First adopters are not rational. The industry knows that and caters to them.
I don't think I underestimate the challenges, personally. PV is here. It works. Hybrids are here. They work. Plug in hybrids will be here shortly, although I don't see much of a penetration potential, yet, or much of an upside until PV adn wind energy become ubiquitous. Electricity does not grow in trees. Currently it is mostly made by burning coal. Therefor the upside of plug-in hybrids in terms of carbon budget is marginal, in terms of cost it is non-existent.
At best plug-in hybrids a-la Prius++ have a short life of a decade or two, depending on the advances in battery devlopment and probably fuel cells. Fuels cells are still a technology of the future, so is hydrogen. I don't see either. What I do see are rapid charge batteries and inductive charge loops... e.g. at red lights and parking lots to top off commuter cars with relatively low battery capacity.
I am an engineer and a physicist. I do not just throw out ideas as if they are a given. When I talk about PV, I do it on the background of reality, which is pretty good, already. If you ask me how to change personal transportation for the foreseeable future, I will tell you that commuter shuttles and rid-sharing are a far more effective means of changing things in the short run then either PV or EVs would be.
I meant more along the lines of I am much more skeptical about some of these technolgical advances.
Yes, PV is here. Yes we have Hybrids. But both suffer from severe limitations and widespread adoption for both technologies is not likely in the near term (both for completly different reasons). High oil prices make this adoption more difficult in the future.
But we shall see. I hope I am wrong about this.
If prices go up more, then there will be further shifts:
Europe has an average gas milage of 40mpg already. Your argument is, at best, uninformed, at worst, laughable.
But like you said... you just have to omit all other information and then it is easy to make up anything you like.
They measured their mileage using the AC and again with the windows open. The increased drag from the open windows offset the savings of not using the AC. They concluded it was a tie, running the AC vs open windows.
As far as drag is concerned... there is very little aerodynamic drag if you drive at 35mph on a scenic route. You know... Yosemite in summer is really pretty, but you don't get to see much if you drive at 60mph, with windows closed, AC running at full speed and your sound system drumming away at 130dB... that is not how to use a car right...
I said according to that show, opening your windows costs you the same amount of energy as running the AC.
You're sounding like Hothgor.
When I wrote "I haven't seen it" I meant I haven't seen the episode of Myth Busters, not people driving with windows down.
I believe you misunderstood what I wrote.
It's interesting to think about other nations facing the fuel economy issue. After "An Inconvenient Truth," this chart of fuel efficiency trends is pretty well known. Japan and Europe have twice the fleet efficiency as the U.S., and the energy consumption per capita of the more efficient European nations is 30-50% that of the U.S.
So Japan and the efficient European nations have less change to undertake, but they also have less room for improvement. For the U.S., change will have to be more wrenching. And most of our political/industrial establishment is still resisting the most elementary efficiency measures with all their might.
Cars and light trucks make up about 43% of annual U.S. oil consumption. It's going to be harder to get the same efficiency gains for heavy trucks and aircraft, which together consume 22% of U.S. oil.
Then there's the industrial sector, which consumes 25% of U.S. oil. That sector has been seeing a steady increase in efficiency so that even as the sector has grown, consumption has remained relatively flat. However, it seems to be an open question whether the sector can reduce absolute petroleum consumption. Some say the low hanging fruit has been taken, others say there's lots more yet to harvest.
The industrial sector is not heavily dependent on oil. Oil used for heating can be replaced in many cases with more efficient heating systems and saved altogether with conservation efforts. Products which actually make use of the chemicals in oil are usually so high priced that, if necessary, they will completely out-compete any other use of oil in the market. Fine chemicals like drugs and certain plastics are by far more valuable than the energy contained in them or used for their production.
That shift is already underway. The more immediate concern is short and medium distance hauls. The rail freight infrastructure would have to be comprehensively rebuilt to replace trucks. I'm sure the Teamsters would have something to say about that.
According to Pimentel, there are still efficiency gains possible in the industrial sector. Efficiency measures for industry could reduce U.S. oil consumption by 28% in ten years. It would require the government to undertake an aggressive efficiency program of technology transfer, retiring outmoded plants, removing subsidies, instituting recycling standards, and other measures. Based on this interview with Sen. John Dingell, I see little prospect that any of those necessary government actions will get done.
Correction: Efficiency measures for the entire U.S. economy could reduce U.S. energy consumption by 28% in ten years.
Efficiency measures for the industrial sector could reduce its energy consumption by 42% over the next 10 years, which is equal to 10-11% of U.S. energy consumption.
We have so much waste going on that it is hard to imagine NOT to save energy by investment in any new infrastructure.
At 30,000 feet, those jet contrails can be a potent greenhouse gas.
During the 'no fly' period after 9-11, there was a striking fall in nighttime air temperatures: the hypothesis is it was the absence of contrails.
However, a few concerns:
We should remember that these are funny numbers, even more than current mileage estimates are funny numbers. A plug-in hybrid gets a kick from charging at home, and uses it in the first few miles you drive. The shorter your trips, the higher percentage of your driving that is done with "home power."
The times I've looked, the 100 mpg etc for a plug-in was calculated on a very specific use pattern.
fwiw, my prius was scoring 50 mpg on every tank for a year ... until I took a job only 8 miles from home. now the engine spends a higher percentage of its time warming up, and my mpg has dropped to 45. the use pattern matters in hybrids much more than regular cars.
The move from 40 to 100 only saves a further 180 gallons.
The vehicle weight vs. drivetrain efficiency question is closely related to this topic. It's going to be a lot cheaper to manufacture a 150 mpg scooter than a 150 mpg SUV.
I'm surprised too. I clearly remember the general speed of freeway traffic staying at about 10 mph over the speed limit, i.e. dropping from about 80 to about 65. However, I was in Oregon, so perhaps we were atypical.
There was a change in the estimation procedure for those not reached by the standard methods. I don't recall details but it involved sampling and much increased attempts to identify some portion of the uncounted.
Finally, on decreases in VMT per capita and housing units per capita: In the last few weeks there was an article (probably no longer online) in the Atlanta Journal-Constitution about the one group for which car-pooling is on the rise: recent immigrants, who of course also tend to share housing. I wonder how much of the trend you noted is due to immigration.
FWIW, the USDOT estimated the fuel savings was about 1%.
withold federal highway funds to get states to adopt the 55 mph limit i believe it was reagan who pushed the change to 65 mph and then thanks to the '94 contract on america congress the speed limit was raised to 75 mph in some backwards states (like nebraska)
The 55 mile per hour speed limit can save fuel, but in some places, it is hard to bear.
A couple of points:
Through the 1960's on-farm use of gasoline was very high. Farm energy use peaked in 1978 at 2.2 quads, declining to 1.7 quads by 1998, for all uses including fertilizers. The farm use of gasoline was 42% of total farm-use energy in 1965, declining to 8% in 1998. In 1965, something shy of .66 quads were used on-farm in the form of gasoline, or about 7% of total gasoline consumed that year. By 1978, farm use of gasoline had dropped to about 3.2% of all gasoline used, and by the late 80's, to something around 1.3%. Some of this would be on-road use, but not a lot. It doesn't include fuel used for personal travel.
http://www.ers.usda.gov/publications/arei/ah705/AREI3-3.PDF
Heavy trucks were using gasoline into the 1970's (I drove a gasoline powered tanker in 1974), though the use was falling quickly in that decade. There is still some use of gasoline by straight trucks >10,000 lbs gvw, perhaps enough to equal the passenger car use of deisel. Sorry, I can't locate any good data, but I'm sure that there was considerable use of gasoline for on-road freight transport into the 1960's.
I do know that 1965 truck ton-miles were 26% larger that 1960, though deisel consumption was only up 13% in this time. Ton-miles in 1975 were up by 10 per cent over 1970, but diesel consumption was up 12%. These numbers are contaminated because deisel consumption figures aren't broken out by other uses such as rail, off-road, stationary, efficiencies and so on. Nonetheless, they support the idea that in 1965 a lot of freight was still moving under the power of gasoline.
In any case, I think you have to allow more vehicle-miles for car/light-truck per gallon of gasoline prior to the mid-seventies. It is conceivable that the amount of gasoline consumed on-farm and in heavy truck transport in 1967 exceeded 10-20% of the total and by 1987 less than 5%. Maybe someone else has solid data on transport truck use through the fifties, sixties and seventies.
On another note, there are drivers of increased/decreased vmt that you might bring into your analysis including workforce participation per household, vehicle per capita, and age of the population.
Very happy to see you pursuing this line of inquiry.
One significant demographic shift that occured during the time period you analyze was the transition from one-income to two-income families, necessitating two commutes where before there was only one per family unit. Don't know how this might play into things but might be something you want to consider if there are available statistics on this.
To continue with the thread of solutions let me make an attempt at first defining the problem. The issue is the transition of energy production from fossil sources to renewable sources. Considering renewable sources there are two that I know of, geothermal and sun derived. Sun derived includes direct radiant energy and indirect wind, hydro and biomass sources. Of these the more important at this time is sun derived. It is somewhat humbling to consider the vast energy of the sun. If the sun were the size of a basketball and the earth the head of a pin, they would be separated by 100 feet. Perhaps the more math inclined might estimate what percent of an arc is covered by the earth. It has been written that if an hour and a half worth of the radiant energy impacting the earth were completely harassed it would cover the world's energy usage for a year. And this is a speck of what the sun is churning out in 360 degrees. All of the fossil fuel being burned, dismissing the abiotic theory of oil generation, was produced by living organisms transforming radiant solar energy into hydrocarbons. The problem is we are living off of long dead fossils and living beyond our means as it were.
Two separate types of energy are needed by society at this time. This nomenclature is mine and I welcome refinements but I would make a division between dispatchable energy, electricity, natural gas for heating, etc and storable energy, primarily gasoline and diesel. Yes natural gas might be used either to generate dispatchable electric energy or storable energy to power a bus and electricity might power a light bulb or a train but the needs from society are different. Of the two needs, the more pressing is storable energy. Dispatchable energy is a serious problem, but ignoring environmental concerns, one could quickly build a lot of coal or nuclear plants for all the dispatchable energy we currently need. Our storable energy is primarily imported from other places and we have no current alternative.
The solutions to each of these needs are likewise going to be different although there will be overlap and areas of synergy, such as lithium ion batteries which might both improve fuel efficiency in hybrid cars and provide electricity storage. Considering the, imo, less pressing problem first, there are any number of positive developments regarding dispatchable energy. Wind power shows potential and is growing rapidly, geothermal energy is again growing. Perhaps most importantly developments in solar energy, such as Nanosolar's attempt to commercialize the thin film solar technology pioneered by Stanford Ovshinsky and Stirling Energy Systems contract for a 500 megawatt solar power station, point towards a positive path. In any event, it seems unlikely that difficulties with dispatchable energy will lead to societal upheaval as new, hopefully renewable technologies, are refined and implemented.
Storable energy is a different can of worms. Bright people talk of hydrogen, and yes if I remember chemistry correctly it is the hydrogen atom which is the terminal electron acceptor in an oxidation reaction, whether burning biodiesel in a truck or digesting olive oil. Hydrogen however, 1) needs to come from somewhere and 2) reminds me of the Hindenburg. So, for now, I will stick with hydrated carbons as the storable fuel of choice. Biomass then must be the solution. The question is how to efficiently transform radiant sunlight into storable hydrocarbons. Soybeans and canola are not the answer, though they are a start. It is worth remembering that if 10% of the needs are met by these biofuels this is an oil well that will never run dry as long as the sun shines. Coupled with conservation, perhaps the most important intervention, especially in the US, though this post is getting far too long to start in on that, soybeans and canola can have an impact. Early stage companies like Changing World Technologies may have alternate means for deriving useful storable fuel from varied organic material streams. Algae, however, provides orders of magnitude greater yield per acre than corn, soybean or canola and may perhaps be the mitochondria for society going forward.
I will stop here, but would just mention that my outlook is that, very rarely is the technological problem the issue, it is almost always about the people. I'm not sure if this makes me optimistic or pessimistic going forward.
I think biomass is more useful for Non-transportation, as a storage medium to even out wind & solar.
Batteries are the way to go for ground transportation. They cost about $.20-$30 per mile for an all electric, versus $.10 fuel cost for conventional vehicles, which suggests that they'll clearly be cheaper (at the current state of the art) at around $6 gas. The difference in the total cost of ownership is less, battery prices are dropping, and gas prices are likely to rise, so sometime soon....
The importance of this is often exaggerated. Batteries just need to be light and small enough to fit, and powerful enough to give adequate range.
Energy density must be adjusted for energy quality: the energy in liquid fuels is used at roughly 15% effiency, vs 80% for electricity.
Batteries have much lower energy density than liquid fuels, but they have gotten "good enough".
I'm going to make a few comments about detail, more to see where they lead than to offer a critique. The big wedge for light vehicles is there and likely much as you've depicted it, but there's also another way to get savings.
I'm still not happy about your graph for fleet fuel economy, especially the early half, though I don't have a better version to offer. Here are some random mileage statistics for domestic vehicles:
1908-27 Model T Ford: 25 mpg (so much for new engine technology! but it weighed only 1200 lbs)
1928-31 Model A Ford: 20-30 mpg
1938 Studebaker: 12 mpg city, 19 mpg highway
1950 Cadillac: 10-18 mpg
1953 Plymouth: 18-20 mpg
1955 CAFE average for cars: 16.1 mpg
1960 CAFE average for cars: 16.1 mpg (the same)
1970 CAFE average for cars: 15.2 mpg (worse)
1975 CAFE average for cars: 15.9 mpg (still lower than in 1955)
The CAFE numbers come from the NHTSA and represent new passenger cars for that year. I have a hard time believing that the in-use fleet fuel efficiency from 1945 to 1975 was in the 10-12 mpg range. As you can see from the 1950 Cadillac, a far-from-average car, almost nothing got as little as 10 mpg. Most cars of that period saw around 15-20. I wonder if the VMT data captured rural traffic adequately then, a relatively more important factor in the 40s and 50s than today. VMTs probably don't capture minor gasoline usage: offroad, marine.
The period from the mid-late 1960s to the mid 1970s saw declines in fuel efficiency for a number of reasons: increasing weight, increasing engine size, and the onset of emission controls. The first two issues are still with us, while the third represented the industry's learning curve as it grappled with reducing emissions by adding control hardware to existing engines.
Aside from compliance, part of the reason is that less than 50% of the total VMTs were travelled on interstates, etc., where the lower speed limit was imposed.
There's at least a third uncertainty that always bedevils time series analysis: the precision, accuracy and interannual consistency of the data. Did some states change their way of calculating vmt's between 1979 and 1980. Were there other inconsistencies in data collection? In other words, how much of the 6.5% was real? As another example, how real are the changes around 1950?
That's one prong of a two-pronged approach. The other prong involves a behavioural change so is, perhaps, less likely. I want to repost a figure from Environment Canada that I posted a few days ago.
These are old data but they serve to make a valid point. Aside from the attractiveness of shifting seats from cars to buses and trains, look at the gains to be made by using up more of the seats in each car. CO2 emissions are directly related to fuel use. Simply (hah!) by filling all the seats in every automobile, we could improve per-capita fuel efficiency by around 60%.
One thing that's going on is that vmt's per capita grew faster before 1973 than after because in 1973 the number of vehicles registered exceeded the number of licensed drivers. In the period before 1973, vmt's per capita were increasing as more drivers obtained ready access to a vehicle.
Source: Wikipedia
Sorry for a long post. My main point is that that increasing vehicle capacity utilization offers another way of helping to realize a `big wedge' .
STUART STANDIFORD, YOU DA' MAN....at last, a look at the single most educational and useful period concerning oil shortage, shocks, and peak oil....AT LAST!
This is my pet area, so let me play along if I may....your first graph, we will come back to, because it doesn't really tell us much until we have seen the rest of your post, and the assumptions you build.
But that second graph....fascinating beyond words, ain't it? The first thing one should notice, but no one ever does, is at the front end of the graph, pre the 1971 U.S. peak in oil production...the price is going DOWN. Now, consider this for a moment: This was the jet age, the age of giant Olds 98's and big block Chevys, of 429 Cobra Jet engines in Mustangs, but even more gargantuan, in giant Torino's and Galaxy 500's (and if you are too young to recall this period, I beg you, get some books and film, or go to a drag strip where some still survive....it was an astounding epoch, so magical in it's way that some later automotive writers called the cars "Demigods of the power culture", they were titans of mythic proportion. And boats, dear Neptune, what boats! I once knew a guy that towed a giant big block Ford powered boat with a Cobra Jet big block Torino...NEVER missed a 48 mile drive into the country from Louisville on weekends, where he stormed over the lake all weekend! Sorry to engage in hyperbole, but, I am trying to set the stage.....because in the face of all this, in the face of the go go economy of the 1960's, and while carrying a war on our back in Vietnam, and the war on poverty....AND, unbeknownst to the American public, BEING WITHIN MONTHS OF THE PEAK OF U.S. PRODUCTION, GASOLINE PRICES WERE NEARING THE LOWEST POINT THEY HAD BEEN SINCE THE GREAT DEPRESSION!!!
SO, first lesson: The price signal GIVES NO WARNING about when peak will occur. This is not new news, it is the lesson of history. We could be within weeks of world peak, and see declining gasoline prices, and have a roaring economy and be on the cusp of peak oil. THERE WILL BE NO WARNING.
Then, the two sheer walls that were the 1970's. At the highest point, and don't let the revisionists lie to you know, NO ONE, NO ONE believed oil would ever come down. Plans were being laid for coal to liquid here in Kentucky, for giant concentrating solar systems in the southwest, for windmills that would have dwarfed ANY of these puny spinners we see today. Libraries were full of books and magazines on solar heat and solar hot water, and photovoltaic was "just around the corner". Chevrolet displayed Electric Chevettes that would be out in massive numbers by the "end of the decade" (the 1980's) as quick as the batteries improved, and they would. Briggs and Stratton built and showed a plug hybrid gas electric (YES, plug hybrid, that was the way the idea was originally concieved!), and Mother Earth News showed a hydraulic hybrid Volkswagen claimed to be able to get 80 miles per gallon.
Then, the collapse. Beginning in 1982, mirroring the sheer wall going up, the sheer wall going down was equally breathtaking. It was ASTOUNDING. Prices fell back to within spitting range of the pre U.S. peak! Investors in alternative energy were WIPED OUT. Young technicians who had given the best decade of their young careers were put out of work. Oil drillers, oil equipment manufacturers, oil service firms were WIPED OUT. For the nation, it was a boom time, as the freed up money poured into the stock market, into the tech sector in Silicon Valley, but for the energy industry, it was a CATASTROPHIC period they still have not forgotten, because most of the oil CEO's were young in their career right in this terrible storm. They are the survivors. They take word of a "peak" with A HUGE DOSE OF SALT, and will have to be convinced BEYOND ANY SHADOW OF A DOUBT before they fall for it again.
Let us move to your third chart. In red, from approx. 1978 to 1982, is what I often have called here "The Big Valley". For those who believe that oil consumption is "inelastic", LOOK. In only a half decade, a collapse in demand of some 1 million barrels per day! So great a drop and so well sustained, in 1990 the U.S. was consuming about what it was in 1978, a net zero percent increase for a full decade....it is stunning to look at even now. Of course, this MUST have caused a great recession, and terrible suffering, correct? To the contrary, it was a period of growth in the economy unlike any EVER KNOWN. The theory that massive drop in fuel consumption will destroy "the capitalist, western way of life" is put in grave doubt by this period. There is NO INDICATION THAT EFFICIENCY DAMAGES AN ECONOMY....QUITE THE CONTRARY. The money freed up by more efficient cars and less wasteful burning in the gas tank could be used for other things. My father, in the late 1970's, switched from an Oldsmobile 98 to a Volkswagen Rabbit Diesel....and in a year and a half, stopped renting and bought his first house. The savings in his commute cost to work were fantastic.
I will not repeat the text by Stuart concerning VMT (Vehicle Miles Traveled), except to say that they expose the complete myth that vehicle miles driven has changed greatly, although they have some, or that changing them has a great effect on national fuel consumption, and go IMMEDIATELY TO A GREAT REVELATION: Says Stuart,
" The fuel efficiency response to the oil shocks was much stronger than the VMT response." Indeed. To quote Stuart,
"Thus the oil shocks clearly caused a large and permanent change in the fuel efficiency of the US vehicle fleet."
From here on, and I don't want to sound as though I am flattering, anything I added to Stuart's analysis would be verbosity, so well put together, interesting, informative and educational is his work. What he exposes is, despite all manner of market turbulence, a surprisingly stable national market place, in other words, stay with the demographics, they work, and will tell you more than all the hyena howls from the fringes. If I had to bet my money, I would bet with the reasonably stable numbers as far as VMT, household size, economic trend, etc.
This leaves only ONE PLACE that real progress can be made, and that is through improvement in miles per gallon of the vehicles on the road. The technology is available now so that everyone who now drives, or wants to, CAN, but must do so with increasing efficiency. The advances were made LONG AGO. We have waited a quarter century for the market to want them. It requires NO breakthrough, but simply the will and the market conditions. Plug hybrid cars can achieve stellar efficiency, not thought possible only a few years ago. Hydraulic hybrid will scale up to school buses, trucks, RV's and motor homes, and when well designed, actually enhance the performance of the vehicle. Advanced road tractors, as proposed by (I know, you hate um, but sorry, they are right on this one) WalMart Corp. could achieve a 50% reduction in Diesel fuel use by 2015, the firms stated goal, and technically easily doable.
I have cursed and promised myself I would leave this TOD posting and reading, every time I come here and the board is filled with some "apocalyptic" deep green dream of the end of modern culture....or the discussion of energy turns into a xenophobic scream against whoever is on the shiit list that week, or somehow, a crisis in liquid fuel (not energy, but liquid fuel) is converted into a call for some type of police state population liquidation program....when the SIMPLEST AND MOST HONEST FIRST PLACE TO APPLY PRESSURE IS IN EFFICIENCY. WE WASTE SO MUCH!! I often want to shout to the heavens, "It's the waste, stupid! BEFORE YOU BURN THE CARS, try building them to get more mileage, just try it! Just to see....if it don't help, then you can start burning them!
It is often like talking to a closed door. Then, along comes Stuart with stats.....and I am suckered back in again.....great job, Stuart, keep up the honest work....(and it had to be a lot of work!)
In the meantime, I am still dreaming of when I can buy my nice plug hybrid Buick with li-ion batteries, charged at home on the new generation of thin film solar panels, and the tiny LPG turbine to charge the batteries and handle climate control, and drive to the Center for the Arts and listen to Copland's 3rd Symphony performed by the Louisville Orchestra....the lights will still be on, I will still be able to move about, like an American should, and my high school age nephew will be able to get a job in the technical professions he shows so much promise in....we'll need technicians with an open mind more than ever....I ain't givin' up on America yet, but we really need to get off our azz and start building this stuff, and show the kind of backbone it takes to sustain a nation.
After all, it doesn't have to turn out well. It's a choice. It's a calling. It's a reaon to hit the shops, the labs, and make it happen. Stuart, allow me to consider your post something a manifesto, one more proof that it can indeed be done, and that logic in the end will prevail over the rantings of the neo-Luddites. Thank you.
Roger Conner known to you as ThatsItImout
However that was then and this is now. A whole lot of difference in attitudes. This is generations apart from what we were then.
This is the conspicuous consumer generation. This is the age of the yuppies and genxers. Those whose attitudes and styles are completely foreign to me, a person who was involved in the lifestyles of the era you speak of.
What I think and what todays generation speak if absolutely foreign to each of us.
Its the mindset that matters. Can they change? When I mentioned in a post the era of the 'back to the land' generation I heard a lot of stuff about 'the counter culture'.
I don't think we have the engineering disciplines nor the industrial infrastructure to bootstrap ourselves up. We certainly are not turning them out in our schools and colleges IMO. Because there is NO WORK for them.
We used to be a great nationstate. We are not that anymore. We are pretty much down the wrong road in attitude and infrastructure.
We have offshored almost everything. We have no sinews left.
No Amurkan Dream. Who will fuel this new beginning? The soccer moms? The 'don't give a shit' youngsters of today?
Every time I talk to a younger person I come away disillusioned. The waste is enormous. The past to them means zip.
Only a very great deal of pain and suffering can jerk us back to reality. It ain't happening.
Yeah...I know...typical doomer talk. I hope I am wrong but my time is over. I am not going to make a difference. I am just on the sidelines watching for a few more decades, maybe not that long.
"Getting off our azz"?? I hope so but I am not optimistic.
I used to train some newbie programmers. Sad to say some of them were college grads and could not even write nor spell.
All they had was bullshit. Lots of shine and jive. Underneath they had nothing to contribute and as they migrated thru the company? It went straight to hell.
Again...I would love to see us get off our azzes...but it won't be my azz for I never sat it down. I drive semi's during harvest and spring planting. Many of the newer drivers are of the ilk I speak. They get a few dollars in their pockets and they don't show up next week. I have to do their driving. They just don't care. They can't fix shit. They don't know shit. They don't give a shit. They are toast.
I live in Ky as well. I have been to Lou'vile many times and lived there during some consulting gigs. Lived in Lexington and Midway. Thats what I observed.
Is the car culture sustainable ?
Sure having more fuel efficient cars would help in the short term ( maybe ) it depends on the decline rate. The problem with cars in general is if/when we have shortages the whole basis of the car culture unravels.
What happens when you can't get gasoline 2 days out of 5 ?
If you believe we will have shortages then cars are not relevant. Your making a lot of assumptions that the infrastructure can ensure a continuous supply of gasoline on the down slope of peak oil. I have my doubts.
memmel, you say,
"Your making a lot of assumptions that the infrastructure can ensure a continuous supply of gasoline on the down slope of peak oil. I have my doubts."
As I have said in several of my posts, right now, I have huge doubts that ANY assumption can be considered safe. But, we have to work first in the area of most possible benefit NOW. Before the long term comes the short term...
if we can't survive that, screw the long term!
On assumptions, you are correct that it is easy to build one assumption on the next on the next until you end up with a house of cards, which can come apart by any number of underlying assumptions being wrong....that is always a risk in a cmplicated system, and the "car culture" is about as complicated of one as can be imagined (one of the reasons I think pulling the "car" out of our culture would be possibly catastrophic, so we might want to back off the car culture as carefully as possible, seeing where each step led...
Speaking of assumptions, I notice a few in your post that may or may not be true, to wit:
#Does car culture have to mean "gasoline car culture". One can be different from the other, although historically, that has not been the case.
#"If you believe we will have shortages then cars are not relevant." Only if you assume the first assumption, that cars always mean gasoline cars or oil burning cars....
This strikes me as somethng we all need to work on....we seem to equate "car" with "gasoline", and "gasoline" with "oil" and oil" with "energy" to the point that a crisis in any one is given as a definitional crisis in all.
I think this makes our thinking very sloppy, and hurts our open mindedness when it comes to finding solutions...
Roger Conner known to you as ThatsItImout
Quality is very difficult to pinpoint statistically, but this may just be the explanation - and the Japanese vehicles were cheaper than Detroit's products, offering a further incentive to buy a fuel efficient vehicle. Of course, at the time, these lower prices were considered unfair competition - strange how you just can't improve how Americans live without their resisting it to the hilt.
I may add, this Japanese wave (what Detroit considered a tsunami) would have crested at about the point the Dodge Voyager first appeared - which also just coincidentally coincided with declining oil prices and the Voyager was able to exploit several regulatory loopholes, making it less expensive, less fuel efficient, less safe, and more polluting - no wonder it was such a big hit in the U.S.
Right now I feel that the UK / Europe should prioritise vehicle fuel conservation by way of imposing engine size / power / efficiency restructions on new vehicles together with a speed limit - say 60 mph on our "freeways" which quite soon will become "toll ways". However, I am unsure what size of savings this would make. I'm being lazy here - but do you know of a data source on the UK vehicle fleet regarding the distribution of engine sizes - I guess Ford / GM sales figures may be a starting point.
A few comments / questions - (at this stage figure numbers would be helpful) - on your chart of "vehicle efficiency" there was a step change between 1975 and 1990 - is that due to technilogy changes or to a change in the profile of engine sizes - more small engine Japanes cars for example. And also note that a step change took place and note on your other mpg chart (Prius) that you project continuous efficiency gains into the future. I guess in short, if everyone was forced to drive a Prius, and the transition was made over 10 years - there would not be a problem with fuel shortages for the foreseeable future.
Finally, is their any correlation between US driving habits, US oil consumption and recession? This is the most important question I have right now.
UK statistics-
here
http://www.cfit.gov.uk/plenaries/images/0501mf-04.gif
other details
http://hm-treasury.gov.uk/media/E2D/20/c5-4.gif
Size going up steadily
new car purchase intentions.
http://www.dft.gov.uk/stellent/groups/dft_roads/documents/graphic/dft_roads_027589-3.gif
And the trend is also seen in farming in Denmark as it should be.
http://www2.mst.dk/udgiv/publications/2006/87-7052-085-2/html/images/fig08.gif
and an interesting diagram on MC deaths as a function of engine size....
http://www.iihs.org/research/fatality_facts/images/motorcycles_chart3_2004.gif
And at last a sobering fact Big bangers cost bucks!
http://www.fuelsaver.govt.nz/gfx/euro-fc-chart.gif
Small can still be beautiful.
Regards And1
The reports (most)and graphics are here.
http://www.cfit.gov.uk/plenaries/0501mfp3.htm
http://www.dft.gov.uk/stellent/groups/dft_roads/documents/page/dft_roads_027589-03.hcsp
http://www.iihs.org/research/fatality_facts/motorcycles.html
http://www.fuelsaver.govt.nz/tips.html?
PHPSESSID=05365930601fc5f3072ce7023eaf28fa
As a bonus see this interesting report on historical development in energy consumption /emissions as a function af weight, age etc.
http://www.hm-treasury.gov.uk./media/FCF/14/climate_change__cousins.pdf
regards/And1
(courtsey of Calculated Risk). The housing market was weakening from mid 72 on, so the embargo in October 73 was the nail in the coffin, rather than the first act. However, the housing market in late 78 early '79 (when Iran started to come unglued) was still fine.
Obviously, in our present situation, we have had high and escalating oil prices and a bursting housing bubble at around the same time.
Don't know if this has been mentioned, but it might make sense to add recession bands on charts of US data spanning several decades. (redundant in the graph immediately above of course)
That should have read "recession bars", not bands.
How about the tax break policy shift? This makes sense on the face of it. Actually, the question is: why hasn't it been done up to now? Well, it has -- see The Energy Policy Act of 2005. But, it is very weak.
The tax credit is generally small and is phased out for manufacturers have sold 60,000 vehicles. The credit must be renewed by congress after 2007.We have encountered powerful resistance from the automobile industry and other affiliated lobbies in the past. The NHTSA has followed Bush adminstration policy as influenced by coporate interests. See Nine States, New York City and DC Sue NHTSA, Challenging Adequacy of CAFE Reform, for example. Or Political battles over passenger CAFE standards heating up.
For any of this to become a reality, a major political shift must occur. I have no faith that Democrats are somehow immune to corporate lobbying and campaign donations while Republicans are not. Generally speaking, Americans pay little attention to what the Executive & Congress do in this policy arena.
There are major political obstacles to come before a year-on-year 4% deployed fuel efficiency increase can be a reality. This is the major problem as I see it.
I would call for an immediate system of taxes (on low mpg cars) and rebates (on high mpg cars) to be put right on the window sticker. It uses both the carrot and the stick, and puts it right in front of prospective car buyers.
Doesn't stand a chance right now though. First because it interferes with the current sense of entitlement ("I deserve an SUV."), and second because it would push Ford/GM into Chapter 11.
Perhaps we'll get it later, if and when higher gas prices throw a scare into the population.
We could just pay for the car companies' retiree health cost: that would go to domestic companies, because transplant plants have young workers.
Easy.
Looking at things in that light, maybe those pieces of legislation were an attempt to protect the domestic industry and save autoworker jobs as much as possible while moving with the prevailing trend? This is like a parliamentary procedure situation where someone votes with the majority, and against their own position, in order to make important amendments or be able to revisit the decision in the future.
http://www.freep.com/apps/pbcs.dll/article?AID=/20061214/BUSINESS01/612140333
This idea has very broad support.
Suburbs are mainly the refuge of the white middle class and working class, at least here in Texas, although a few immigrants and upwardly mobile black people live there because of cheap, decent public education. Immigrants tend to be more sensible about living near work.
I'm sure most Americans are aware of the resurgence of nativist sentiments, a la Loud Lou Dobbs. This has a big social class component; the illegals that he rails against are mainly poor migrants from Central and South America There doesn't seem to be as much hostility towards educated immigrants and the illegals who just walk away from a tourist visa or student visa, or the legal immigrants who get professional or tech jobs.
I live in Galveston, approximately 50 miles from the center of Houston. We are already experiencing a more dense life style build-out. We are a city with a 60,000 population, yet have 5 multistory high rise apartment buildings being built currently. Its mainly because an ocean view is more desireable and as an island we have limited land. But we're a city, not a suburb- we are about 1/4th black, 1/4th Latino and the balance white, and have a lot of employment locally, American National Life Insurance, The University of Texas Medical Branch, which is the state public hospital, tourist trade, and the Port of Galveston. Lots of people commute though, and we have many second homes on the Island.The city has exprienced a lot of gentrification, and I expect to see more. We have excellent public transportation, busses and trollies, mainly diesel powered. From the early 1900's until the Second World War Galveston also had Interurban train service with Houston. I think we are going to be a desireable place to live post-peak, unlike about half of the Houston suburban sprawl.
if gas prices rise sharply, then the most inefficient cars in the fleet might be the first top be sidelined or replaced with high-mileage models.
this might move fleet MPG faster one would expect, based simply on the units sold, or the fraction of the fleet replaced.
presumably through the 90's, in a period of low gas prices, replacement was somewhat random with respect to mpg, and perhaps even negative, as people felt 'safe' to go with a lower mpg or higher performance car
i imagine (but do not 'know') that we started to see a selective replacement in the last few years. this is somewhat supported by the decline in largest-size SUV sales, and the recent up-tick in sales of the smallest sub-compacts.
In this sense , inefficiency in our fleet has a positive effect to it. It makes us more resilient against oil shocks. If we were as efficient as possible, then we would feel the full blow of an oil shock.
The US would be much better served by reducing its oil requirements by decreasing the number of people who need a car, rather than increasing the mileage of the cars.
Real per capita GDP is (something like) 60% higher than it was then. So you are talking a gasoline price closer to $6/gallon to have the same effect.
1978 - $22,500 per capita
2005 - $37,232 per capita
(YR 2000 dollars)
http://eh.net/hmit/gdp/
Note I have made the (heroic) assumption that income distribution is unchanged in that time, whereas median income has actually been relatively static.
Agree that we would have to dig out that data to nail it.
But that doesn't obviate my basic point: there is an income effect in gasoline consumption, as well as a price elasticity of substitution effect.
I wouldn't expect gasoline consumption to go back to the 1980 level, just because we had returned to the 1980 price.
This period (1950-70 or -73) is basically the period when the US revolutionized it's urban/suburban form. With a proper investment in Urban Rail plus the impact of post-Peak Oil, a counter-revolution is not only entirely possible but probable.
And needed.
With +0.9% population increase and -3.2% per capita VMT each year, US oil consumption (coupled with an annual 4% fuel economy increase) for private autos could make a very significant but still not completely adequate response to post-Peak Oil.
US gasoline use for private vehicles is slightly over 9 million out of roughly 21 million b/day, perhaps 45% of total US oil use. SOLVING THE PROBLEM OF US PRIVATE AUTO USE DOES NOT SOLVE THE POST-PEAK OIL PROBLEM
A reasonable plan would examine all of the segments of US oil use and figure reductions in all areas with some, such as personal VMT, dropping faster than others (say petrochemicals, Enhanced fuel economy will likely require more plastics/car. PVC may replace more copper pipes, etc.). A post-Peak Oil strategy that relies upon the bulk of the oil consumption savings (say 60%-65%) coming out of reduced use by private auto use seems reasonable to me.
It should be noted that about 300,000 b/day are used by light commercial vehicles servicing out current urban form. A more compact urban form would also see savings in this area. (Fuel economy for Plumber & UPS trucks is not easily improved given their cargo requirements). Also local heavy trucking from the local rail intermodal yard will likely be less for TOD development.
I am glad to see Stuart extend his planning horizon out to 38 years but his range of responses is still inadequate. And his one solution has very little elasticity when, as Stuart noted elsewhere, "we have to reduce consumption by 10% to 15% in a hurry". A million 100 mpg Priui (plural of Prius) will not suddenly multiple as the SPR is drained.
One additional thought, higher CAFE standards will, IMVHO, do little to improve average fleet economy. Any increases will be driven by market forces with, perhaps, an extra 10% improvement coming from gov't mandates.
What price levels for gasoline are needed for an annual 3.6% improvement in average fleet economy ? (The extra 0.4% coming from CAFE, the gov't cannot mandate much more than the market would demand in any case).
Improved vehicle fuel economy is one silver BB, reduced VMT is another, electrified freight railroads are another, etc.
Best Hopes for Comprehensive Planning,
Alan
However, the US sustained An AVERAGE VMT (per capita) annual increase of +3.2% for 23 years
Why ?
Cheaper real gasoline prices ? (Your supposed exclusive reason for VMT decrease is only higher prices).
No. Eisenhower's Interstate Highway gas tax increase of 5 cents/gallon early in the period offset other decreases.
The Interstate Highway system, non-existent in 1950, accounts for a large increase in VMT (from memory, 25% of VMT are driven on Interstate Highways). If there had been no new limited access highways, US VMT increases would have been much more moderate 1950-70 or -73.
The sustained and dramatic increase in VMT was tightly coupled with a revolution in US urban form.
It is entirely plausible that the carrot of Urban Rail and the iron pipe (not a stick) of post-Peak Oil will drive a change in social attitudes and hence Urban form, reversing post-PO the sprawl effect post-WW II.
Absent Urban Rail, high prices alone will not drive dramatic, sustained changes in VMT.
VMT is driven by changes in Urban form, not prices. The combination of Urban Rail SYSTEMS and ever higher oil prices will drive a change in Urban form, as did Interstate Highways & VA loans for new construction (+ white flight) drove an earlier change.
Motivation > Peak Oil = VA loans & "white flight"
Transportation Means to fulfill motivation > Urban Rail = Interstate Highways
Best Hopes for dropping VMT :-)
Alan
Our society has shown an ability to sustain a VMT change of 3.2% for 23 years (before running out of steam). I assume that with stronger motivation and incentives we can reverse the earlier pattern at roughly the same rate.
Prices alone will not do it (think of Urban form today without any limited access highways in the US). Build an Urban Rail equilavent, (= GNP %) to the Interstate Highway System + related highways & roads in the period 2008 - 2031, use other gov't incentives (VA loans only in TOD) and see a reverse in what happened before.
The "System" can sustain changes of 3.2% for two decades. Perhaps 6% but the evidence is weaker for that.
Best Hopes for Urban rail,
Alan
Jevon's paradox. The more America becomes efficient the more oil for China and India to grow. And even if everyone is three times more efficient what good will it do if we have three times more autos in the world?
There are now ~500 million cars in the world. http://hypertextbook.com/facts/2001/MarinaStasenko.shtml If China and India obtain cars at one fifth the ownership rate of the US (.133 cars per person * 2.3 billion) They will add ~306 million cars to the world. If this car use growth comes about it shows that even if the average world car doubled fuel efficiency we would still use more oil and continue to belt out green house gases.
If China and India get cars at one third the rate of Americans (.222 cars per person) that would add ~511 million cars to the planet, doubling the number of cars on the earth. So we would have to double auto fuel efficiency to stay in the same place. But of course we can't stay in the same place because by the time Chindia gets there we'll have less oil.
If China and India obtain cars at half the rate of the US (.333 cars per person) that would add 769 million cars to the world. If this could happen I would bet even Daniel Yergin would say we would have an oil crash.
But oil is finite and efficiency can only go so far. So when does Chindia's ability to expand due to America's future efficiency hit the wall? Or will Chindia's expansion up the oil price so much that even America's new efficiency will not bring down the easy motoring cost and America will hit the wall?
Would a 4% yearly efficiency increase make a difference world wide with expanding economies increased oil use?
Car efficiency is like magic that will turn our beer into whiskey. The whiskey is more expensive but we will not need as much to get drunk. But we will have a problem with other drunks buying up the supply at the store.
Without that, and if early conservation efforts were enough to bring prices back down, I could see a Jevons' style re-expansion of consumption ... but my gut says conservation will lag prices and that this will be less of a worry.
In the early years, it is -4% of about 45% of US demand (~1/4th world demand). Less than 0.5% of world demand in Year 1.
But the annual reductions in US auto use of gasoline will diminish in significance in just a half dozen years if there is not a broader impact in other segments OR if annual demand reductions do not increase to, say, -7% or -9% (a combination of improved fleet fuel economy, lowering VMT through TOD and "short range" EVs).
-4% of a 37% share of US oil consumption, which is 22.5% of world oil consumption is not as impressive as -4% of 45% of 25%. just to illustrate my point. -8% of 35% of 21% is more impressive though.
Other segments (I nominate heavy inter-city trucking for a -90% reduction, saving about 2 million b/day) will have to conserve over the longer term. Geothermal heat pumps driven by wind turbines replacing some % of oil & gas home heating (with a solar assist in some fraction). Finding other sources of electricity for Hawaii (forget nuke on crowded Oahu) will help some. Fewer roads demanding less asphalt is another potential savings. Oil use by barges and perhaps petrochemicals will increase so not all segments will or even can conserve equally.
IMHO, the US should plan on seeing our share of world oil consumption drop from 25% to the 20% to 22% range and perhaps lower within a decade. We do NOT have the exports to pay for what we want & need. Perhaps we have enough to pay for what we need, perhaps not. Moscow taxi drivers and Venezulan farmers will do better than US suburbanites when it comes to world access to oil products. All will not be free & fair markets.
In any case, the US share of world oil consumption will drop post-Peak Oil and likely post-Peak Exports.
Improved US fleet fuel economy is a silver BB and no more than that. It ain't enough !
Best Hopes for a Pocketfull of silver BBs !
Alan
Doubling average fuel economy (in the world) is one Socolow 'wedge' saving 1bn tonnes pa of Carbon (3.667bn tpa CO2) in 2050.
Halving miles driven per car is another 'wedge'. this wedge will require congestion charging and a massive increase in public transport.
Socolow assumes that total number of cars in the world increases 4-fold between now and 2050. Which is not unreasonable.
http://www.princeton.edu/~cmi/resources/CMI_Resources_new_files/CMI_Stab_Wedges_Movie.swf
They have identified 15 wedges in total. We won't fully implement all of them by 2050, but we need to have implemented at least 7-8 (so that the Business As Usual (BAU) scenario of 15bn tpa is replaced by stabilised CO2 emissions of 7bn tpa (about what we emit now).
A quite severe recession (as 1980 was) will drop VMT: unemployed people don't drive their cars to work every day.
Otherwise VMT rises with GDP, and will continue to do so until congestion becomes unsustainable.
If real energy prices rise, there may be long term structural effects about clustering closer together.
But I expect a much greater effect would be to drive more fuel efficient vehicles, the same number of miles.
Even the VW Lupo 3L achieved only 3 l/100 km - i.e. 94 miles per UK gallon on Diesel fuel (and on the test driving cycle). This is 78.6 miles per US gallon on Diesel, which (corrected for energy per gallon) would be equivalent to about 71 miles per US gallon on gasoline. Like all full hybrids, the Prius benefits from regenerative braking, worth say 20% improvement in real driving (as distinct from the test driving cycle), hence say 71 x 1.2 = 85 mpUSg. Then again, the Lupo 3L is a much smaller car, with lower mass and frontal area. So no Prius-size car will ever achieve 100 mpUSg in real driving. My guess would be more like 60 to 70 at best.
I am omitting Plug-in Hybrid and Battery Electric Vehicles, which are a whole different ballgame. They still need energy, and there are several inefficiencies in the energy chain. I am also omitting ultra-light vehicles, like Lovin's Hypercar, since this too is a whole different ballgame - replacing much of the steel in the car with reinforced plastic. I am very doubtful about it's feasibility and acceptability.
All too often overlooked is the fuel cost of heating and bad driving conditions in cold weather, and of air conditioning in hot weather. These effects are proportionately greater in high-economy vehicles. (They are particularly significant in PHEVs and BEVs, which carry little electrical energy, because the loads concerned are functions of time, rather than of distance. So congestion is very bad news). The 2004 Prius has neat features that address these issues - a 'Thermos' bottle that holds heat overnight, to give a faster warmup and thus lower regulated emissions (in the US market), and powering the 'inverter-drive' air conditioning from the traction battery. This last is not a free ride, but means that engine running is limited to high-efficiency operation.
Since many vehicles will be bigger and heavier than a Prius, I would expect a new light vehicle average of around 60 mpUSg at best. This means that - after these have replaced all existing vehicles in say 12 to 15 years - the fleet average would plateau at 60 mpUSg.
Why isn't the current efficiency of autos good enough? What makes us think that a different efficiency level will suffice? I see no reason to believe so.
The fate of man lies in his ability to restrain himself. The era began in August 1945, when the first atomic bomb was used as a weapon. Since then, we have managed to refrain from excerising nuclear warfare.
In 2007 and on, we will have to learn to restrain our consumption. Technology will never be a substitute for self-resstraint. It can only lessen the negative consequences of self-restraint. Our ability to consume is as limitless as our ability to destroy. The hybrid car will not change that fact.
Europe is halfway there. The US needs a three fold improvement. I think there are very promising drag reduction results from electronically locked vehicle trains on the highway. Ultimately traffic control can probably buy another 20% in efficiency over todays stop and go, which gets us closer to 100mpg. If we put two people in a commuter car, that amounts to 200mpgperson, a tenfold improvement for one third of all traffic over today and certainly way more practical for most US commuters than busses and trains.
http://www.mbta.com/schedules_and_maps/rail/
Our 11th largest Metro area. Note the Green, Blue, Red & Orange subway lines in the center.
Comparable can be built in the top 20 or so Metro areasand smaller elsewhere. And several more valuable lines can be added to the linked map.
Alan
One comment on the surprisingly fast fuel efficiency improvement during price spikes:
I'd guess that this is partially caused by families/businesses that own more than one vehicle using those with better mpg more often.
For example, my parents own two cars, one gets 26 mpg and the other 78 mpg (a Saab 95 Aero and a Audi A2). They currently use the bigger Saab that has all the amenities and four times the horse power for long trips, but I'd guess if gas prices went up a lot further they'd use the Audi more often.
Increased auto effiency and reduced marginal driving (likely aided by reduced economic activity) are the only short term responses to post-Peak Oil. In the medium term (5 to 12 years) these two factors will be still be very important, but their value decreases as one shifts to the long term (12+ years).
I personally think that reduced driving due to reduced economic activity will have the largest single short term reduction in US oil consumption.
I strongly disagree with Stuart about his metrics to say that Light Rail (and other Urban Rail) is not a viable medium and long term solution. We CAN start on the long term solution within 12 months !
I will repost a post from C2C - Day 2
This is the source of the indirect oil (and energy) savings that building Urban Rail creates. A substantial minority of people WANT the TOD (Transit Orientated Design) choice IF it is available today, even with low oil prices.
As we shift into post-Peak Oil that minority will grow. But we are FAR from satisfying the existing demand for Urban Rail served TOD today.
Best Hopes,
Alan
Still an excellent post, Stuart.
I'd just like to reiterate that a simple replacement model of 8%/year with 20 mpg avg fuel economy in the new vehicles more or less explains the increased economy.
Price can clearly affect VMT but I have yet to see any evidence that price changes leads to efficiency changes. (I'd love to be proven wrong on this one. Can anyone set me straight with actual data?) CAFE standards are the principal cause of the efficiency gains. In other words, this wedge idea will have to be legislated.
Increasing fuel efficiency will increase vehicle miles. This will always be the case. Perhaps the savings from better efficiency will 'win out', but you are still engaging in a policy that works against itself.
We would be better off regulating the number of cars. Less cars, less gas consumption...even less idling in traffic jams so better effciency too. We KNOW this policy would work.
Why would we choose to increase gas taxes if its results are questionable, when we could just do another policy that causes commensurate 'hardship' but would definietly alleviate the problem?
In other words, we don't need a whole lot of efficiency analysis to solve the problem. The solution is already at hand, why waste time looking a another solution that will never be as certain or simple as the one you already have?
The simple economic fact is that a (soft) limit on cars and a moderate required improvement in effciiency would be far more effective than solely requiring better auto efficiency.
I doubt many people will read this comment, but here goes. The big wedge for light vehicles is there, much as Stuart depicts, but there’s another way to get there.
I'm still not happy about Stuart’s graph for fleet fuel economy, especially the early half, though I don’t have a better version to offer. Here are some random mileage statistics for domestic vehicles:
1908-27 Model T Ford: 25 mpg (so much for new engine technology! but it weighed only 1200 lbs)
1928-31 Model A Ford: 20-30 mpg
1938 Studebaker: 12 mpg city, 19 mpg highway
1950 Cadillac: 10-18 mpg
1953 Plymouth: 18-20 mpg
1955 CAFE average for cars: 16.1 mpg
1960 CAFE average for cars: 16.1 mpg (the same)
1970 CAFE average for cars: 15.2 mpg (worse)
1975 CAFE average for cars: 15.9 mpg (still lower than in 1955)
The CAFE numbers come from the NHTSA and represent new passenger cars for that year. I have a hard time believing that the in-use fleet fuel efficiency from 1945 to 1975 was in the 10-12 mpg range. As you can see from the 1950 Cadillac figure, a far-from-average car, almost nothing got as little as 10 mpg. Most cars saw around 15-20. I wonder if the VMT data capture rural traffic adequately, a relatively more important factor in the 40s and 50s than today.
The period from the mid-late 1960s to the mid 1970s saw declines in fuel efficiency for a number of reasons: increasing weight, increasing engine size, and the onset of emission controls. The first two issues are still with us, while the third represented the industry's learning curve as it grappled with reducing emissions by adding control hardware to existing engines. Weight is the enemy of fuel economy. If manufacturers would make cars lighter, (i.e. smaller, with fewer gadgets), we’d do better.
Aside from incomplete compliance, part of the reason is that less than 50% of the total VMTs were travelled on interstates, etc., where the lower speed limit was imposed.
There’s at least a third uncertainty that always bedevils time series analysis: the precision, accuracy and interannual consistency of the data. There’s room for doubt here. Did some states change their way of calculating vmt’s between 1979 and 1980. Were there other inconsistencies in data collection? In other words, how much of the 6.5% was real? As another example, how real are the changes around 1950?
That’s one prong of a two-pronged approach. The other prong involves a behavioural change so is, perhaps, less likely. I want to repost a figure from Environment Canada .
These are old data but they serve to make a valid point. Aside from the attractiveness of shifting seats from cars to buses and trains, look at the gains to be made by using up more of the seats in each car. CO2 emissions are directly related to fuel use. Simply (hah!) by filling all the seats in every automobile, we could improve per-capita fuel efficiency by around 60%.
One thing that’s going on is that vmt’s per capita grew faster before 1973 than after because in 1973 the number of vehicles registered exceeded the number of licensed drivers. In the period before 1973, vmt’s per capita were increasing as more drivers obtained ready access to a vehicle.
Sorry for a long post. My main point is that increasing vehicle capacity utilization is another way of helping to realize a ‘big wedge’ .
I doubt many people will read this comment, but here goes. The big wedge for light vehicles is there, much as Stuart depicts, but there’s another way to get there.
I'm still not happy about Stuart’s graph for fleet fuel economy, especially the early half, though I don’t have a better version to offer. Here are some random mileage statistics for domestic vehicles:
1908-27 Model T Ford: 25 mpg (so much for new engine technology! but it weighed only 1200 lbs)
1928-31 Model A Ford: 20-30 mpg
1938 Studebaker: 12 mpg city, 19 mpg highway
1950 Cadillac: 10-18 mpg
1953 Plymouth: 18-20 mpg
1955 CAFE average for cars: 16.1 mpg
1960 CAFE average for cars: 16.1 mpg (the same)
1970 CAFE average for cars: 15.2 mpg (worse)
1975 CAFE average for cars: 15.9 mpg (still lower than in 1955)
The CAFE numbers come from the NHTSA and represent new passenger cars for that year. I have a hard time believing that the in-use fleet fuel efficiency from 1945 to 1975 was in the 10-12 mpg range. As you can see from the 1950 Cadillac figure, a far-from-average car, almost nothing got as little as 10 mpg. Most cars saw around 15-20. I wonder if the VMT data capture rural traffic adequately, a relatively more important factor in the 40s and 50s than today.
The period from the mid-late 1960s to the mid 1970s saw declines in fuel efficiency for a number of reasons: increasing weight, increasing engine size, and the onset of emission controls. The first two issues are still with us, while the third represented the industry's learning curve as it grappled with reducing emissions by adding control hardware to existing engines. Weight is the enemy of fuel economy. If manufacturers would make cars lighter, (i.e. smaller, with fewer gadgets), we’d do better.
Aside from incomplete compliance, part of the reason is that less than 50% of the total VMTs were travelled on interstates, etc., where the lower speed limit was imposed.
There’s at least a third uncertainty that always bedevils time series analysis: the precision, accuracy and interannual consistency of the data. There’s room for doubt here. Did some states change their way of calculating vmt’s between 1979 and 1980. Were there other inconsistencies in data collection? In other words, how much of the 6.5% was real? As another example, how real are the changes around 1950?
That’s one prong of a two-pronged approach. The other prong involves a behavioural change so is, perhaps, less likely. I want to repost a figure from Environment Canada.
These are old data but they serve to make a valid point. Aside from the attractiveness of shifting seats from cars to buses and trains, look at the gains to be made by using up more of the seats in each car. CO2 emissions are directly related to fuel use. Simply (hah!) by filling all the seats in every automobile, we could improve per-capita fuel efficiency by around 60%.
One thing that’s going on is that vmt’s per capita grew faster before 1973 than after because in 1973 the number of vehicles registered exceeded the number of licensed drivers. In the period before 1973, vmt’s per capita were increasing as more drivers obtained ready access to a vehicle.
Sorry for a long post. My main point is that increasing vehicle capacity utilization is another way of helping to realize a ‘big wedge’.
I doubt many people will read this comment, but here goes. The big wedge for light vehicles is there, much as Stuart depicts, but there’s another way to get there.
I'm still not happy about Stuart’s graph for fleet fuel economy, especially the early half, though I don’t have a better version to offer. Here are some random mileage statistics for domestic vehicles:
1908-27 Model T Ford: 25 mpg (so much for new engine technology! but it weighed only 1200 lbs)
1928-31 Model A Ford: 20-30 mpg
1938 Studebaker: 12 mpg city, 19 mpg highway
1950 Cadillac: 10-18 mpg
1953 Plymouth: 18-20 mpg
1955 CAFE average for cars: 16.1 mpg
1960 CAFE average for cars: 16.1 mpg (the same)
1970 CAFE average for cars: 15.2 mpg (worse)
1975 CAFE average for cars: 15.9 mpg (still lower than in 1955)
The CAFE numbers come from the NHTSA and represent new passenger cars for that year. I have a hard time believing that the in-use fleet fuel efficiency from 1945 to 1975 was in the 10-12 mpg range. As you can see from the 1950 Cadillac figure, a far-from-average car, almost nothing got as little as 10 mpg. Most cars saw around 15-20. I wonder if the VMT data capture rural traffic adequately, a relatively more important factor in the 40s and 50s than today.
The period from the mid-late 1960s to the mid 1970s saw declines in fuel efficiency for a number of reasons: increasing weight, increasing engine size, and the onset of emission controls. The first two issues are still with us, while the third represented the industry's learning curve as it grappled with reducing emissions by adding control hardware to existing engines. Weight is the enemy of fuel economy. If manufacturers would make cars lighter, (i.e. smaller, with fewer gadgets), we’d do better.
Aside from incomplete compliance, part of the reason is that less than 50% of the total VMTs were travelled on interstates, etc., where the lower speed limit was imposed.
There’s at least a third uncertainty that always bedevils time series analysis: the precision, accuracy and interannual consistency of the data. There’s room for doubt here. Did some states change their way of calculating vmt’s between 1979 and 1980. Were there other inconsistencies in data collection? In other words, how much of the 6.5% was real? As another example, how real are the changes around 1950?
That’s one prong of a two-pronged approach. The other prong involves a behavioural change so is, perhaps, less likely. I want to repost a figure from Environment Canada.
These are old data but they serve to make a valid point. Aside from the attractiveness of shifting seats from cars to buses and trains, look at the gains to be made by using up more of the seats in each car. CO2 emissions are directly related to fuel use. Simply (hah!) by filling all the seats in every automobile, we could improve per-capita fuel efficiency by around 60%.
One thing that’s going on is that vmt’s per capita grew faster before 1973 than after because in 1973 the number of vehicles registered exceeded the number of licensed drivers. In the period before 1973, vmt’s per capita were increasing as more drivers obtained ready access to a vehicle.
Sorry for a long post. My main point is that I think that increasing vehicle capacity utilization is another way of helping to realize a ‘big wedge’.