The Shock Model (Part II)
Posted by Sam Foucher on April 17, 2007 - 9:07am
I look also at the modelisation of reserve growth which is an important aspect of modern oil production that is often overlooked in the peak oil community.
The code in R language is provided at the end of this post.
Printer friendly version in pdf.
Unification of the Logistic Model and the Shock Model
The shock model can be summarized by the following equation:
For the logistic model, the extraction rate is proportional to the cumulative production and all the oil is available for extraction at time t0:

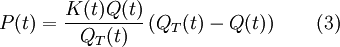
Is the relation (4) observed in reality? the response is yes as shown on Figure 1 for the years 1985-2006.
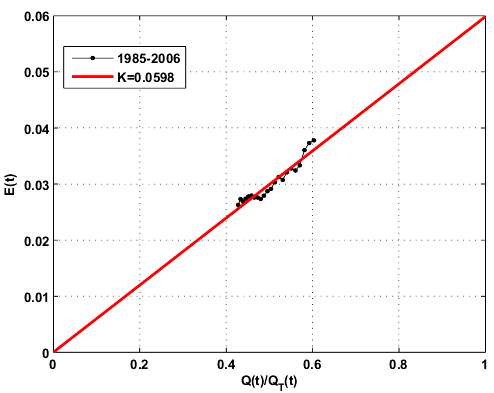
Fig 1. Estimated Shock function E(t) versus the cumulative production as a fraction of the cumulative gross reserve additions.
World production for crude oil + condensate from 1985 to 2006. The red line has a slope equals to K=0.0598.

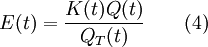
Fig 2. Comparison of the two models for different baselines.
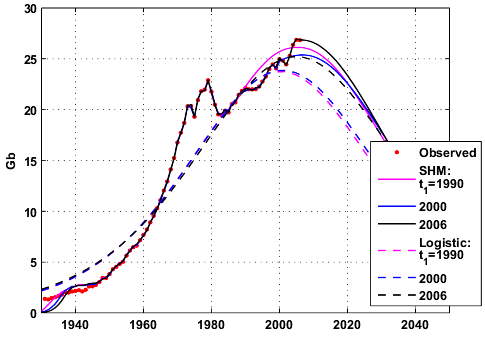
Fig 3. Comparison of the logistic curves and the HSM for different baselines.
On Figure 4, the estimated HSM shock function for the baseline 1900-2006 is close to the one given by the SM except in the predictive part where we can see clearly the convergence of E(t) toward K(t).
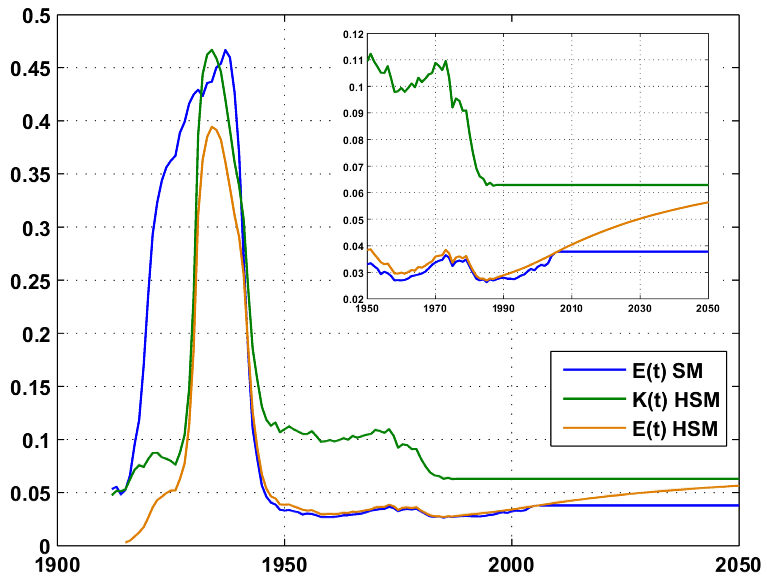
Fig 4. Estimated shock functions for the HSM and SM using the 1900-2006 baseline .
Modeling Reserve Growth
Reserve growth is probably one of the most contentious and complex aspect of peak oil (see Rembrandt's posts for a great overview). A quick definition from Verma et al. [2]:Reserve growth is a term used to refer to estimated increases in the total technically and economically recoverable petroleum reserves of a field that commonly occur through time because (1) additional reservoir and geologic information leads to increases in estimates of hydrocarbons in-place of existing reservoirs or pools; (2) new reservoirs or pools are discovered in existing fields; and (3) improvements take place in the hydrocarbon recovery factor owing to better understanding of reservoir characteristics and behavior through use of 3D/4D seismic interpretation, better geophysical logging tools, and improved reservoir simulation techniques. Additionally, application of horizontal-well drilling technology and enhanced recovery methods improve the hydrocarbon recovery factors significantly, resulting in increased estimates of reserves, particularly in oil reservoirs.

with α=1.75752 and β=0.30050 and t in the 1-95 years range (CGF=1 for t=0). This reserve growth model has also been observed on West Siberia by Vermak and Ulmishek [1] with the parameters α=1.56639 and β=0.36060. I'm proposing to model reserve growth using also a linear filtering derived from the above parabolic curve, the filter is the following:
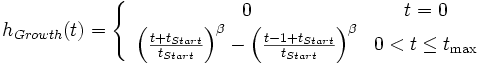
Fig 5. Proposed linear filter response (bottom) for the modeling of reserve growth derived from the empirical CGF function (top).
Because reserve growth is generally occurring as soon as the first producing well is put in place, the reserve growth G(t) is the result of the convolution of hFallow,hBuild and hGrowth:
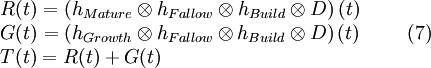

Fig 6. Effect of the reserve growth on the system impulsional response. The Modified Arrington CGF is used here.
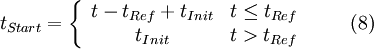
The tricky part is to find an appropriate value for tStart. It seems logical that tStart should depend on the discovery age because the discovery curve already includes an unknown amount of reserve growth. The chart below is taken from Robelius PhD thesis [3] and is showing how much reserve growth we have experienced in the 1994-2005 period and how it has affected the shape of the discovery curve. It's pretty obvious that reserve growth cannot be neglected and that a static view of oil production will underestimate future production levels. Also, there is no obvious correlation between discovery age and the amount of reserve growth. The amount of reserve growth between 1994 and 2005 is an astonishing 427 billion barrels (Gb). However, only 170-190 Gb seems to be genuine reserve growth (see Rembrandt post).
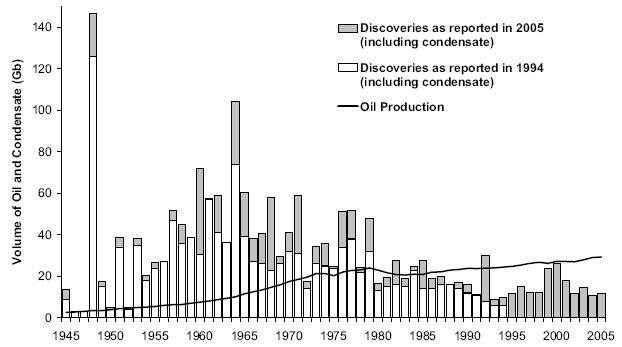
Fig 7. Global annual discoveries of both oil and condensate, as reported in
1994 and 2005, together with oil production in billion of barrels (Gb) The difference
reported discoveries is the reserve growth. Source: Based on data from IHS Energy,
ASPO and Oil & Gas Journal (from Robelius [3], page 71).
I assume the following model for tStart:
- The USGS is forecasting 612 billion barrels (mean estimate) for conventional oil between 1996 and 2025.
- Albrandt et al. (USGS) conclude that approximately 28% percent or 171 billion barrels of the forecasted 612 billion barrels for conventional oil had been added to the reserve pool between 1996 and 2003.
- 2005 resource growth in pre-2005 discoveries was only 8 Gb.
- discovery data is the ASPO backdated (1932-2004) so tRef =2004.
- pre-1932 total discovery is 30 Gb (mainly US)
- post-2004 discovery forecast is based on a logistic decline.
- lambda= 3 years.
| Peak | URR (Gb) | Total
Reserve Growth |
1996-2025 Reserve Growth |
1996-2003
Reserve Growth | 2005 Reserve Growth | Pre-2005 Reserve Growth |
|
|---|---|---|---|---|---|---|---|
| Logistic | 2005 @ 25.2 Gb | 2023 | 0 | 0 | 0 | 0 | 0 |
| SHM | 2005 @ 26.9 Gb | 1962 | 0 | 0 | 0 | 0 | 0 |
| Modified
Arrington tInit= 1 |
2036 @ 36.8 Gb | 3937 | 1976 | 704 | 146 | 21 | 427 |
| Modified
Arrington tInit= 15 |
2017 @ 28.7 Gb | 2616 | 655 | 230.8 | 59 | 7.7 | 236 |
| Modified
Arrington tInit= 20 |
2015 @ 28.1 Gb | 2500 | 538 | 191 | 50 | 6.5 | 204 |
| West Siberia Growth tInit= 1 |
2018 @ 29.3 Gb | 2603 | 640 | 293 | 40 | 10.6 | 144 |
The result of the SHM + Modified Arrington with tInit=1 year (third row in Table I) is shown on Figure 8 and replicates closely the rosy USGS/DOE/CERA view of future production with a large amount of reserve growth to come. We can see clearly the effect of the relation (8) with a ramp up of reserve growth prior to 2004 and a huge input of reserve growth on new discoveries post 2004. The SHM + Modified Arrington with tInit= 15 years and the SHM + Russian growth (tInit=1) give similar results with a peak in 2017-2018 and a URR around 2.6 trillion barrels. For the peak date to be before 2015, reserve growth should be around 6-7 Gb for 2006 and decrease afterward.
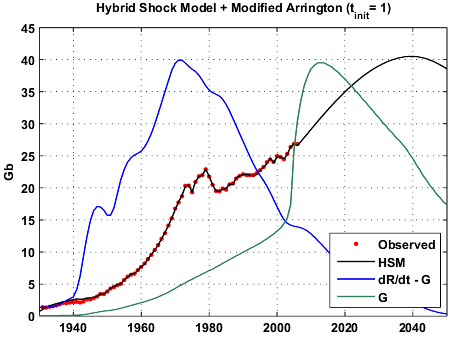
Fig 8. World producion forecast (C&C) produced by the HSM assuming the modified Arrington model for the reserve growth .
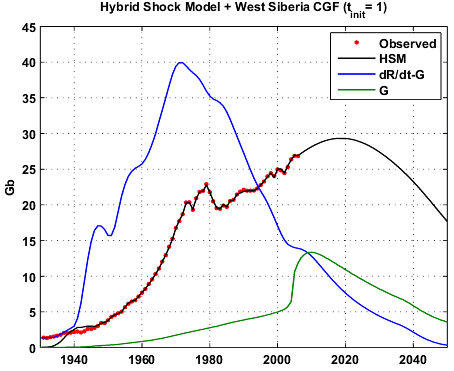
Fig 9.World producion forecast (C&C) produced by the HSM assuming Verma's model (West Siberia) for the reserve growth.
On Figure 10, we can see that the HSM + Modified Arrington (in orange) fits the proven reserves from BP but does not fit with the recent record prices. The HSM + West Siberia CGF (in green) is closed to the corrected BP reserve numbers except since 2001. However the green curve is going down precisely when prices started their climb which makes me think that the proven reserve increases for 2001 and 2002 are probably bogus.

Fig 10. Reserves to production ratio values. Proven reserves are from BP. The corrected reserves account for anomalous Middle-East reserve revisions.
HSM (US) and HSM (West Siberai) are the production curve shown on Figures 8 and 9.
Conclusions
About the Hybrid Shock Model:- The interest of the Shock Model approach resides in its capacity to exploit the discovery data, the production profile and the reserve growth models.
- The URR is not an output of the model as it is the case for the Hubbert Linearization but results directly from the discovery curves and the application of reserve growth models. The HSM is a nice way to inject prior information about the URR.
- The method can potentially deal with difficult multi-modal production profiles such as Saudi Arabia.
- The logistic case can be seen as a particular case of the HSM when the extraction of total resource (URR) is instantaneous.
- Using a fourth convolution function derived from empirical Cumulative Growth Factors, I was able to derive an estimate close to the USGS forecast on reserve growth.
- Note that we don't know how much true reserve growth is included in the 171 Gb figure. However, the reserve growth in 2005 for pre-2005 discoveries was only 8 Gb, it should have been 21.5 Gb (171/8). If we assume that 8 Gb per year is the true reserve annual addition we get 64 Gb for 1996-2003.
- In my opinion, peak oil proponents should pay more attention to reserve growth issues. Very often, the argument is only focus on new discoveries but reserve growth is poorly understood and may have a significant contribution especially within a high oil prices environment.
- Using the West Siberia reserve growth factor and a decreasing number of new discoveries, I estimate the peak to be at most in 2018 for conventional oil. The interesting thing is that it seems to match the 8 Gb in 2005. This result assumes that reserve growth related technologies will be applied aggressively and extensively. Also, the two CGFs that I used are for onshore fields and they are probably very different for offshore fields (new discoveries to come will be increasingly offshore). Therefore, I consider this result as being an upper bound on conventional production.
- It will be very important to watch reserve growth estimates for the year 2006 in order to confirm (or infirm) a decrease in reserve growth that was observed in 2005 (8 Gb). In particular, a collapse in reserve growth (2-3 Gb) could indicate that the peak for crude oil + condensate is likely to be in 2005-2006.
- It's important to note that the CGF model (5) is significantly different between large fields and small fields [1]. Because new discoveries are likely to be small fields, reserve growth post-2005 is likely to be smaller.
Of course, this is a work in progress and more tests are needed. The US, Norway and the UK should constitute a nice benchmark for the HSM (maybe in a part III). By the way, if anyone has discovery datasets, please contact me.
References:
[1] M. K. Verma and G. F. Ulmishek, Reserve growth in Oil fields of West Siberian Basin, Russia. Ulmishek of the United States Geological Survey. pdf.[2] M.K. Verma, Modified Arrington Method for Calculating Reserve Growth—A New Model for United States Oil and Gas Fields, U.S. Geological Survey Bulletin 2172-D, pdf.
[3] Giant oil fields and their importance for future oil production, Fredrik Robelius, PhD Thesis.
The data for the world production of crude oil + condensate is composed of:
- 1900-1959: API Facts and Figures Centennial edition 1959.
- 1960-2006: EIA data (includes tar sands production from Canada and Venezuela).
Code:
The code is available in R language, the windows version of R software is available here. You will need to install the Matlab package (go in "Packages/Install Package(s)" then choose a CRAN site and select Matlab from the package list). To execute the program, open the file (ShockModel_Part2.txt) and click on "Edit/Run all".Contact
- Content: editors at theoildrum dot com
- Tech support: support at theoildrum dot com
License

This work is licensed under a Creative Commons Attribution-Share Alike 3.0 United States License.
Khebab this is surelly precious stuff. While I’m still diggesting it tell me something, does that definition of reserve growth include discovery?
It seems to me that the definition of URR growth used by CERA, USGS, et al. includes what we call discovery. If so aren’t you including discovery twice in the model?
No, it's not included twice. Reserve growth does not include discoveries, reserve growth is measuring how your initial discovery estimate is changing over time (it's a growth factor). The final URR is the total discovery volume + reserve growth. The problem is that the ASPO discovery curve is including some amount of reserve growth. That's why I introduced the parameters t_start and t_init in order to better control when the reserve growth factor should start.
We have to watch out on these reserve growth laws however. In the case of parabolic growth, i.e. a square root of time growth dependence, the amount of reserve growth is infinite !!!!!
see here:
http://mobjectivist.blogspot.com/2006/12/conun-drum.html
It is easy to prove this as all you have to do is look at the growth value for Time = infinity. But the most amazing insight that you can see from this and Khebab's curves is that even though we have infinite reserve growth, we still see a peak in a few years! You read that right:
Even though we have infinite reserve growth, we will still see peak oil in a few years time. Has that sunk in?
No one that I know of is mentioning this mathematical reality that extraction and production can not keep up with reserve growth, even though there is an infinite supply.
But we know that the growth has to limit itself at some point in the future.

http://mobjectivist.blogspot.com/2006/01/self-limiting-parabolic-growth....
Which makes the infinite supply consideration a moot point anyways.
Well, Web, you may have actually done the undoable....prove that no matter how much oil there is....there is actually no oil! :-)
(that's a kick....I once had a math teacher who proved that the length of a coastline was always infinite! If you looked at it from space, you had one length, but as you moved closer you would be able to view more inlets and tiny curves and jagged edges you would see...the closer you got, the longer the coastline got, so the only thing limiting it's length was how close in the magnification was...in other words, how close you were looking....(!!)
(gee, I love the precision of mathematics...:-)
RC
Remember, we are only one cubic mile from freedom
Another coastline paradox often discussed in college science classes. How fast does an oblique wavefront propagate as it hits the shore at a more and more perpendicular attitude? It actually approaches an infinite speed at the limit. However, the professor would be smart to add that this is purely a phase speed that carries no information content whatsoever.
Likewise, your contribution adds absolutely no informational content to the discussion :-) :-) :-) :-) :-)
I know, but it was fun! :-)
RC
re: Even though we have infinite reserve growth, we will still see peak oil in a few years time. Has that sunk in?
Agreed. Reserve growth is great material for spin-doctors! you can actually claim to have a forever growing URR which of course is mostly irrelevant to the problem of increasing flow rates.
I have limited growth to a maximum of 95 years (see Figure 6) but you're self-limiting parabolic growth could be a good substitute.
It's not hard to analytically solve the power-law forms (unlimited growth) but the self-limited foms need numerical solutions. In lieu of solving numerically, I have had good success modeling this limiting behavior with two damped exponentials, which essentially mimics the hM(t) and hG(t) terms that you have in Eq. 7. The following is an impulse response to a delta discovery @ T=1900:
from http://mobjectivist.blogspot.com/2006/02/decomposing-reserve-growth.html
It looks like this when put on top of a real reserve growth curve:

Whether this is worth doing, and whether this is mathematically valid, I have to ponder a bit. But since you essentially came up with this idea independently of me, I think it is worth pursuing.
A couple of mistakes:
- Legend of Figure 3: should be "HSM" and not "SHM"
- Figure 10: it's not nominal prices but real prices in constant 2004 prices (i.e. inflation adjusted).
Hi
this is OT, but do you know if Chris Skrebowski (sp) has issued a revised megaprojects update?
I think we need a bottom up look as well
thanks
You show Figure 1 on a worldwide basis. How would it look if one excluded OPEC countries? For OPEC countries alone?
I would need the discovery curve for OPEC countries.
The danger of 'reserve growth' is the nice mathematical form of it. Fig 5 seems to show an nice asymtotic 0.01 factor on any field, of any age, continuing forever.
However I'd suggest its right to question that.
Certainly over the years we have got better at identifying new additional reserves in existing fields. At the same time we have got better at ecking out the last drop from each field. The question is, once we have given a reasonable time for some certainty to develop in the size and shape of a field, is it right to still expect further growth over time? A field discovered in 1995 will be measured, probed and described within an inch of its life. Would we be right in assuming that it will continue to grow 1% per year, every year, even in 2030?
If you were to tailor a growth factor that tended to zero after 10 years for newer discoveries, what would that do to the predictions?
I agree. There are a lot of statistical wizardry and assumptions behind the estimation of the cumulative growth factors. Note that the last estimation by Verma (Modified Arrington) is less optimistic than the original Attanasi & Root used by the USGS. Strong apparent growth observed in North America is probably due to the way initial reserves (1P) are booked. Robelius, in his PhD thesis, notes that because initial reserve estimates are now much more precises, reserve growth is likely to decrease considerably in the next few years.
Re: If you were to tailor a growth factor that tended to zero after 10 years for newer discoveries, what would that do to the predictions?
it can be simulated by changing t_max from 95 years to 10 years in the code.
Attanasi & Root applied a statistical technique to censored data without applying a correct survivability analysis to the complete data set:
http://mobjectivist.blogspot.com/2007/01/censored-data.html
This tends to overestimate reserve growth with assumptions on the improperly back-extrapolated data.
I have previously engaged in a heated debate over this issue at peakoil.com within the last year. This is basic "cooking the books" at the most egregious level. Bo-oh-boy, do the petroleum engineers get upset when you bring this subject up.
Alright, thats about the fifth time I've read this remark in various places and it exceeds my statistics background. Doh!
Any references to a good book or web site to brush up on censored data and survivability analysis? I prefer books ...
Thanks ...
I don't have a good ref handy, but you can get a start by applying a bit of common sense. Censored data is most commonly found in medical studies of lifespan, for example, how long people will on average live who take up tobacco smoking. The censoring comes about when we have limited time periods for the data collected; when this data is used beyond the censored region you generally run into problems. The tobacco studies would go on for 10 years or so, and the statisticians would collect enough data to try to project death rates in the future. The results become problematic when the extrapolator assumes a linear projection whereas in reality the actual data could vary non-linearly. You really can't go too far outside the censoring window, without having some pretty good assumptions to back the projections up.
This Wiki entry talks about discarding censored data properly in the context of a Kaplan-meier estimator for survivability analysis:
http://en.wikipedia.org/wiki/Kaplan-Meier_estimator
Censoring in reserve growth projections come about when a narrow window starting in the 1970's along with ongoing production data from wells discovered pre-1910 was used by Attanasi & Root to extrapolate reserve growth at the 80+ year mark. Even though they had no supporting data from reserve growth from 1910 to 1970, the spurts of reserve growth in the old wells during the 1970's allowed them to make cumulative reserve growths that appeared to keep tracking upward. But in reality those missing (i.e. censored) years could have shown any arbitrary amounts of growth -- including zero.
The only real way to deal with censored data is to get data from different periods of time, say from different experiments, and try to piece those together with any ingenious techniques you have at your disposal. Only then can you get a true empirical estimate of the growth. The problem with oil is we only have that window starting in the 1970's

From A&R, x-axis is the censored window, curves show raw reserve growth rates of USA oil regions of various vintage
Global warming researchers know how to piece together censored data. They can take recent CO2 samples, mix them with old ice core samples, and put together a fairly complete view of how CO2 varied over history. Oil people apparently don't have this kind of sophistication.
Looking at figure 7, it appears as if reserve growth has been proportionaly much smaller since 1980 than before.
That is a subtle effect as it takes a while to get the reserve growth to accumulate with time. Therefore the amount since 1980 looks smaller -- but it is also a lot less just because reserve growth amount is also proportional to the amount discovered and the amount discovered since 1980 has decreased substantially.
The big issue is how much reserve growth actually occurs. And we need to do a careful censored data analysis on the numbers, not the mumbo-jumbo that Attanasi & Root did for USA reserve growth estimates.
The censoring comes about since the sliding scale for extrapolation only goes back to 1970 or so (i.e. the censor date). Therefore, when you look at reserve growth additions for 1945, we have no idea what the reserve growth additions between 1945 and 1970 actually were. For all we know, these additions had been accumulating for quite a while before they got reported. This is the basic flaw with incorrectly using censored data.
I remember vaguely thinking that past discovery should somehow be an input to predictive models... fabulous that you have been able to produce formulae that incorporate this parameter.
A confounding difficulty is that future discoveries will be of smaller fields and/or fields in more difficult to recover locations. The 'productivity' of future discoveries will therefore be poor relative to past discoveries, with lower flow rates/unit discovery... usefully thickening/lengthening the tail but bringing forward peak production. A second and related issue is that our ability to throw resources at the problem is, like the oil, finite. Rapidly escelating deep water rig rates are indicative that there is a shortage of rigs, and this goes for every element in the productive chain except ships. So, production from small fields that will be discovered shortly may be delayed because not all of the bits needed to exploit the discovery are available. While the supply of rigs etc have always been finite, there has never been a situation in the past where shortages were so obvious... sa is a good case in point; they never previously needed as many rigs as they have in use today. IMO, they, and the rest of the world's producers, will find they continuously need more infrastructure/unit production, and that in many cases the costs of producing new oil climbs faster than the price of oil. Indeed, this has already happened; small e&p's that I follow are showing higher production/reserves but lower earnings on account of lower price since 8/06... volatile oil price will make many of the majors blink as they pencil out the cost of producing newly discovered fields.
On balance, these thought make me a little more optimistic about the down slope but not much more optimistic about when peak occurs. I continue to think we will hang on the plateau through 07/08, and now think we will hardly notice the descent, say until 2010, or about the time that sa runs out of projects.
That doesn't really sound like much of an improvement to me. 2010 is, after all, only 2 and 3/4 of a year away. I can barely plan a decent holiday in that time let alone a change of this magnitude!
As the man said,
"I would need the discovery curve for OPEC countries."
Smile when you say that pardner! :-)
It's amazing how the devil can lurk in the details....
All around though, EXCELLENT WORK, khebab...:-)
[although I am still laboring to understand all of the math....:-(
(I, the optimist, am still making that extra $3000 to $4000 dollar spare spot in my budget, just in case Diesel goes to $6.00 plus per gallon....(what ya' think the odds are? ;-)
[and how will a price like that affect 'reserve growth']
Roger Conner Jr.
Remember, we are only one cubic mile from freedom
I agree. Reserve growth will probably ease the down slope.
I am still a bit confused, but on a higher level.
Some say that leads down the path of enlightenment.
I think reserve growth is overweighted as you have it now.
Mainly because we know that the oil is much harder to extract as the field ages. So at least 50% or more of the reserve growth is going to extracted at a much lower production rate and higher cost.
The US is a prime example of this with growing reserves and dropping production rates. So overall reserve growth tends to unduly inflate projected production rates.
The intrinsic problem is that after we pass peak oil we still have a lot of oil to extract at lower and lower production rates for many years. Although this is true if your not careful you end up accounting for this expensive oil as easy to extract oil. Taking reserve growth numbers reported for fields that have been in production for some time leads to this bias.
In general you need only include reserve growth that occurs early in a fields production while growth from technical/prices changes does little to change the extraction rate profile instead leads to the long tail.
Consider methods used to keep the fields pressure up. They should be treated as primary extraction even if they are started later in the fields life so depending on how pressure is managed in a field you get two peak in production and generally a reported increase in reserves once secondary extraction is started. This second reserve growth term is the one I contend does not lead to any change in the production profile and indeed its not clear if the reserve growth is real.
The point is reserve growth in mature basins needs be heavily discounted. Whats nice is this model shows that a lot of the differences in predictions is caused by playing games with reserves not from discovery if that does not set off alarm bells then ...
Btw kick ass model kudos.
It just feels like its the right model :)
New fields tend to be small fields that exhaust quickly (9 years average lifespan from what I read elsewhere). Given this, is reserve growth even relevant? Further, because of the high costs of deepwater drilling and the desire to suck the field dry as fast as possible (to minimize costs and maximize profits), is reserve growth relevant to deepwater? Given the above and asking what percentage of new oil is small fields or deepwater (or both), is the reserve growth number skewed high by being predisposed to the giants and supergiants?
Ghawar Is Dying
The greatest shortcoming of the human race is our inability to understand the exponential function. - Dr. Albert Bartlett
According to one theory I read, light sweet crude peaked.
People were turning to heavy sour grades to try to make up the difference. The Khazak Caspian Sea stuff was full of acid, sour.
Next they will be trying to refine bitumen as this process has lower operating costs than coal to liquids. There are more than a trillion barrels of tar/bitumen in place around the world in reservoirs of different characteristics and in structures with or without good caprock.
Last time I checked sand can't flow good down a pipe. I believe alberta attracted investment dollars by saying they have as much oil as SA. Then once money flowed in, oh! we need nuke plants for therm heat extraction methods. Water is a hot button, and so is natural gas in the upgraders. So they flow 1.8 million down the pipe of upgraded crude.
alberta will satisfy the essential services sector for north america. That is they can keep the ambulances, police and fire trucks going only for the next 100yrs. Lets keep whats left of oil for this service only till something is rolled off the lines.
OCB
Good point that leads me to a mini-rant.
Nothing says that we can't apply this same model to coal or natural gas or uranium or tar reserves. The problem is that no one actually wants to do this analysis, preferring almost always to hold a rosy outlook.
Why, and how, with the billions of dollars invested in the fossil fuel industry does it take amateurs to decipher our reality-based future? The answer is that they don't want to know, and even if they did know they never wanted to teach it to the engineers and scientists studying this field. Considering how fundamental these mathematically-based rate theories that Khebab and I have been working on are (and the deductive anlysis that Stuart excels in), it borders on the criminal that this has been totally overlooked by people more "in the know".
I can come up with any number of analogies to hypothetically missing theories or laws in other engineering disciplines, but they would seem preposterous to imagine actually happening. Like what would happen if we built up our electronics industry without actually understanding Faraday's Law.
It hurts my brain to even think about it.
Hi WHT,
re: "Nothing says that we can't apply this same model to coal or natural gas or uranium or tar reserves."
Are you (could you) planning to do this?
And: "It hurts my brain to even think about it."
Yes. The value of what you (all) are doing is to fill the world's need for honesty and reality.
I have tried it on natural gas a few times.
First New Zealand
http://mobjectivist.blogspot.com/2005/11/new-zealand-natural-gas-peak-mo...
Then USA
http://mobjectivist.blogspot.com/2006/12/usa-ng-not-good.html
What's interesing is that these both go into a regime where the E(t) rises substantially.
Even more reason to take reserve growth with a grain of salt.
Especially since its measured differently. For public companies reserve growth early in the fields life is probably true for all other cases only original OIP estimates and recovery factors might be useful. In shot I don't consider reserver growth that useful. A HL like URR estimate is probably close but even then you need to weight the reserves between easy, hard and very hard when considering production rates. I think a calculated number makes more sense than reserve growth with reserve growth numbers used as a check if you have some reason to believe they are real.
The most important thing that comes out of this model is that games with reserve growth are the biggest factor confusing peak oil. A valid OIP/URR estimate is far more important than reserve growth. Basically I'd consider some very early revisions to reserves as simply discovery information obtained as the field is initially developed otherwise reserve growth is generally unreliable.
By treating this initial reserve growth as discovery I think
it brings the model into reality.
Memmel: The most important thing that comes out of this model is that games with reserve growth are the biggest factor confusing peak oil.
Agreed. This is where the masters of spin, such as Michael Lynch, excel at. Ultimately, gaming the argument to create huge potential reserves will also lead the gullible to the wacko theories like abiotic oil.
Memmel: By treating this initial reserve growth as discovery I think it brings the model into reality.
Nice way of phrasing it. We just have to model how this affects the depletion dynamics correctly. To first-order, I think we can add it as a backdated discovery, and then reserve growth just manifests itself as the Maturation phase lag. Khebab volunteered that we can add a parallel Growth phase. This is also potentially feasible but it violates some of the properties of a stationary stochastic process that are required to solve the Shock Model formally.
I think it's important to look at reserve growth. However, tracking how reserve growth predictions are verified in reality is really a difficult business. There is a lot of potential for number manipulations. Also, There is quite a significant standard deviations around parabolic CGF models and the statistical reliability of such models can be questioned:
You should be able to verify this growth for both the North Sea and Lower 48 using HL to see if they agree.
Reserve growth by national oil countries is very questionable.
My opinion is that the model would have to work without reserve growth. The data as suspect and its effect on the model seems to be large. The model seems to be intrinsically correct and if reserve growth numbers where reliable it would work outside that its a matter of picking which reserve numbers you believe and this gives you and answer.
Obviously I don't believe most reserve growth numbers. But from your graph it seems like their is some growth I'd consider real up too about 5 years into production. I do not believe most of the growth after 5 years is real.
The big growth at 10 years plus is probably a side effect of optimistic assumptions concerning the use of advanced technology.
Considering the nature of reserve growth its tough to believe a model that can be heavily influenced by reserve estimates. In general it should only be used to constrain some other estimation method. The only answer I can think of is checking reserve growth and URR for fields that are no longer in production or reduced to stripper wells. This will
tell if Reserve predictions are even close for real world cases. In general I would not be surprised to see the error at +/-30%
We still have the problem that the models are generally to rosy the lack of a realistic model that underestimates is a big issue.
Seems to me that you are using a constant rate of production efficiency, as an implicit assumption. What about a factor that includes decreasing production efficiency. In efect including EROEI. This would capture both tar sands issues and the above mentioned ever increasing rig count as costs in energy terms.
Thanks for a significant improvement in modeling.
SolarHouse
WHT or Khebab can correct me if I am wrong, but the efficiency of each individual well (and therefore of the global extraction process) appears to be inherent in that well's extraction rate (and therefore in the global extraction rate). In other words it gets captured in the extraction rate automatically.
Or perhaps I've misunderstood and they can shed more light.
Ghawar Is Dying
The greatest shortcoming of the human race is our inability to understand the exponential function. - Dr. Albert Bartlett
You're probably right. However, I'm not 100% sure on the extraction rate interpretation. Maybe WHT as more insights.
I would say there is a constant rate of efficiency in all the lag factors. For example, we still haven't improved much in how fast we can construct oil rigs. So as the oil gets harder to reach, i.e. deep-water oil, the improvements in technology get balanced by the huge logistics impediments to get at that oil.
As to having a "natural" extraction rate property per well, I can buy that insight. However, with the shock model the "natural" values become an ensemble average that equates basically to big regions producing more oil per year and smaller regions producing less per year. This leads to the extraction rate proportionality factor to remaining reserves. Am I interpreting GreyZone's question right?
Yes, that's how I understand it. And further, again from the original URR estimates, the rest of the infrastructure gets built out with that number in mind so that's another kind of natural limiting factor. You don't build a pipeline for 5 mbpd for a field that can pump 3000. URR drives lots of our decisions in the oil business.
Ghawar Is Dying
The greatest shortcoming of the human race is our inability to understand the exponential function. - Dr. Albert Bartlett
Capitalism has the curious effect of providing a proportional amount of funding to the size of the potential outcome. Strange how this works out, even in the dismal science of economics :)
And raising the first 100k for a business is ten times harder than the next million :) Vulture Capitol effect.
I'm glad you brought up logistics. I used bridge building as and example if you look at the time it took to construct bridges over the last 100 years we have generally barely doubled in how fast we can build a bridge. For oil field development its not clear we have even managed to do that thus logistic problems tend to be constant and almost impossible to speed up. New technology tends to increase logistic problems thus hurting the lowest and biggest factor in large developments.
If you include a logistic factor with a multiplier for new technology into EROI calculations for oil I suspect you will find we are already sliding down a very steep and slippery slope with EROI rapidly heading towards 1 for any energy source. A lot of people don't realize that by using so much ethanol for example in our current gasoline mixtures we have droped the EROI for gasoline as a fuel by quite a bit.
With gasoline at 10% and assuming a EROI of 1 we have and 10:1 for the oil part we have
10*.90 = 9
1*.10 = .1
9+0.1 = 9.1
So you see how low EROI additives to fuel drop the total.
And ten may be high now considering sulfur extraction etc.
Right now for gasoline production NG is generally used but you can see how the EROI on oil will drop like a rock in a few years as we begin to have NG issues.
Memmel, I have to quibble a bit here. Is EROEI really directly relevant to a model focused on reserves and extraction of those reserves? Yes, I am aware there is a slope and that beyond a certain point the product is not worth what you invest, but is that really relevant for right now and the largest part of the tail?
I am not meaning to dismiss this question as I think it is relevant to the overall picture but I am not sure that this is really relevant to a reserves/extraction model particularly.
In practice, what a poor EROEI means is that the tail gets chopped off at a certain point but that point appears to still be far downline from where we sit.
Ghawar Is Dying
The greatest shortcoming of the human race is our inability to understand the exponential function. - Dr. Albert Bartlett
I disagree our current energy infrastructure is full of positive feedback loops that trigger once energy supplies are constrained.
What happens when you don't have diesel to power the trucks delivering gasoline. Or enough fuel to keep a pipeline running. Or aviation fuel for a helicopter out to a offshore platform. Not to mention effects on the vast amount of parts and supplies needed to keep our aging infrastructure running.
Persistent spot shortages will quickly lead to delivery problems in a viscous self reinforcing cycle. Remember its a world wide industry today not like the 1970's.
As far as I can tell I see no reason that the energy infrastructure won't quickly crumble.
As far as I'm concerned to problem is to prove it won't crash quickly and spectacularly even a cursory review indicates we are in serious trouble quickly post peak.
It could be the forcing function that keeps increasing E(t) via the Q(t)/QT(t) coefficient that Khebab uses in the HST model. At some point, Q(t) keeps rising while QT(T) starts to stabilize. How this exactly happens I am not sure, but there could be a significant positive feedback loop to it, maybe mixed in with hysteresis or overshoot. The hysteresis might come about as the oil companies estimate a proportional extraction rate, stabilized against historical cumulative production over discovery levels (see Khebab's Fig 4), but then this ratio starts to shoot up as the bottom QT(t) begins to level off. They then overshoot in peak production and the bottom drops off.
I think you mean decrease E(t) ? I.e the extraction rate decreases. In anycase EROI/Shortage effects would I assume be a exponential function proportional to the time after peak.
It works I would think like a depletion term as fields and production is lost for technical reasons. Technically its already in force right now. This is one reason for the claim that we can produce more oil if we just invest billions of dollars. So you could model it as persistent and increasingly sever under investment in the oil infrastructure this would I think show as a exponential increase in the decline of the rate of production.
I think this is what Simmons had in mind when he warned about infrastructure issues but its a bit more problematic then I think he realizes since world peak should have a big effect.
I think the equation needed is one used to model famine.
As food becomes more scarce the ability to grow food drops of quickly leading to more famine.
Many of the conditions in North Korea would apply.
http://www.iie.com/publications/wp/99-2.pdf
Or infectious disease models which are probably similar.
http://www.cdc.gov/ncidod/eid/vol1no1/morse.htm
A big part in the defeat of both Germany and Japan was the lack of oil to power the war machines esp for Japan.
Of course both countries to extraordinary measures to keep the war machine supplied. But in all cases because the extraction rate depends on the extraction rate once you have world peak and no-one is increasing you initiate this externally driven exponential decay function.
It generally does not apply to regional declines unless the region is isolated. I don't know of and example for oil where the region was isolated but in all other known situation where a core resource required for the extraction of said resource started to decline the destruction was swift. Famine/Disease/Drought/Stock crashs/bubbles etc. And to job is in my opinion to prove that oil extraction would not follow one of these self reinforcing decline models once the world has peaked. I see absolutely no reason why it would not predominate and as I said we already have evidence that shortages and costs are slowing new and existing oil production and the ball is not even really rolling yet.
E(t) has to increase if you look at Fig.1. Remember that this extraction rate is applied to the amount of reserve left. As the amount left decreases, then E has to increase.
Maybe I'm saying it right this way.
E(t) in figure 4 the orange one would exponentially increase as cross K(t) well before all the oil is extracted. In other words most of the remaining oil would not be extracted.
Is that right ?
Its easier for me to say the rate of the decrease in the rate of decrease of production increases :)
Or the rate of decline in the production rate increase exponentially.
For world wide peak the rate of production post peak becomes decoupled quickly from the physical depletion since the above ground factors induce a famine like condition for oil extraction.
Note this condition only holds for world peak not for regional peaks. For each regions the current model is basically correct it just it won't hold for the world because of the numerous positive feedback conditions.
Here is a link that discusses some of this.
http://en.wikipedia.org/wiki/Malthusian_catastrophe#Application_to_energ...
Peak anything world wide causes the system to revert back to
how it used to work hundreds of years ago. We simply have not dealt with worldwide declines simply because we have to date been able to exploit resources in other parts of the world.
Once this is no longer true we deal with well know positive feedback conditions.
Just and example of how intricate the feed backs are.
Consider the case that shortages are occurring and oil tankers
are given priority for bunker fuel but lets say a ship containing critical spare parts for a oil field is bumped
and waits weeks to reach its destination thus delaying some
critical work. Next of course these sorts of problems and delays won't overlap so your going from one crisis to another and its almost impossible to ensure the oil industry is supplied first. Its like ensuring that the auto industry is supplied if their was a shortage of autos. In addition you have normal cost/EROI issues.
During war this was handled by general rationing on one hand and hoarding on the military production side you err on the side of oversupply. I cannot see these sorts of policies working for the oil industry during peace time conditions.
People that don't believe in Peak oil will target these obvious problems as the cause not the underlying geologic peak that precipitated the problem. But once the system start to degrade the geology problems will quickly become irrelevant. So of world peak the time that geology based constraints are in effect is actually quite short.
In fact and this is the interesting part the geology effect could easily no longer be the current driving force in the worlds oil supply. I happen to think that geology driven issues have already become secondary to this EROI/shortage spiral. If not this year for sure next year production capacity and production rate will continue to diverge much faster than geology caused depletion draws down the production rate. Sure the top possible rate or capacity decreases but soon the gulf will be so large that this is irrelevant. I'd be surprised if we are producing 20% of the amount we do now in 5 years if we have peaked.
I got you. Proportional extraction rate increases but absolute rate decreases.
It's like sucking furiously on a straw to get at the last of the milkshake. The last little bit is coming out relatively fast in relation to the amount left, but the absolute rate is not much.
Close but not quite.
Assume you have a whole group sucking on straws and someone is walking around cutting the straws forcing you to go wait in line for the straw dispenser which is broken most of the time and empty otherwise. Periodically you get a refill and the log jam breaks up and everyone can suck down their milkshakes many will find the milk shake empty as you say.
So what's important post peak for extraction rate is the fact that straws are getting cut not the actual amount left except
that the rate the straws get cut is coupled to the amount left.
The end result is you see things like we have now. Refineries are trying to upgrade to handle heavy oil leading to backlogs of oil in certain regions and supply shortages in others the underlying current or driver that initiated this problem was a few regions (milkshakes declined).
The milkshake makers start watching how full the milk shakes are and the fact your not using your straws and claim they don't have to make any more milkshakes. So the moment you get all your straws working at the same time your out of milkshakes. And the milkshake guys find he can't quite make as many milkshakes as before.
The system does for sure resonating and each time you have the milkshake producer making as many as he can but less than before cut straws become a bigger problem.
Replace milk shakes with oil and refineries and you will see the tug of war thats happened over the last few years. And generally the underlying geologic depletion is hidden for the most part. My assertion is once the milkshake maker is chronically short we will not only have cut straws but the milkshake machines themselves start breaking down.
So quickly after peak if you apply any of the models used for famine or contagious disease spread you will find that the supply of milk shake ingredients is no longer relevant.
Its the original cause and the reason you cannot recover but I doubt its important long simply because of the other problems.
I've said a few times I only care about peak oil up to the point we are about 4mdp down from current production past that point the amount of oil we could produce is not relevant since the geology is not the main driver of the situation. It simply prevents you from improving the situation esp since the milkshakes machines we can easily keep running are the ones with the most limited supply.
The US invading Iraq is a perfect example of someone breaking the milkshake machine in order to get more supplies. The underlying reason is lack of supplies but the absolute effect on production rate is caused by above ground issues. Not to mention the increased oil use by the military
to hold Iraq and continually rebuild its production. Few actually subtract this non trivial amount from Iraqi production for the real EROI.
Peak oil deniers will always look at the cut straws and broken milk shake machines and blame these.
My suggestion is that by including them in the model you would show the feed back between them in supplies insures that production will not only lag supplies but eventually and quickly drop to basically zero regardless of the remaining supplies. If we have peaked and it looks like we have our models are already irrelevant because of these issues. I'm keen to see what the shock model looks like with this effect I give us three years but I'm guessing.
But I think you will see that the geology gets suppressed or more correctly overridden most of the time and only becomes important the moment the system starts working correctly.
So we simply swing back and forth between being unable to use the oil and not having enough but unable to use will win in the end.
You have to give me some probabilities of occurences for me to add it to the shock model.
Hi WH,
Do you mean of specific event categories?
Anyway, seems you might just pick some probabilities (if you want) - examples for low and high.
Yes, it's a lot easier to setup the problem if you create a flow between probability states; the transitions between the states are the events (or event categories as you describe). Not that I can't try to decipher what Memmel is trying to convey through his narrative, it's just that it would be a lot easier if we had it in a convenient format.
Bottom line: Draw a data flow diagram. It helps a lot!
Maybe WT can help.
Lets consider recent history say post 2004.
We have the Iraqi invasion motivated it seems by oil since every other reason has proven false. This has lead too about a 2mpd cut. We have Nigeria with 300k-500k offline. We have drilling rig shortages that are decreasing production by X amount. We have project delays because of cost overuns. These can be contributed to oil. Production has decreased less than 1mpd and we have lost almost 3 times that over the last two years or so. Increased internal consumption has taken 2-3 mbpd ( WT ??? ). Venezuela has suffered lower production and increased internal consumption strictly from
peak oil/high price induced nationalism. Opec cuts because no one can really make up for their production has taken 1.5 mbpd off line either for real or for political reasons. This can be divided into say 1mpd for decline and 0.5 or so political in general we should use our least optimistic natural decline rates and figure out the additional above ground issues.
Offsetting this is recent increases from various fields online which should already be in the model. You have to be careful not to double count.
So if we focus on exports we are seeing geology induced depletion result in about a 5 times drop in exports. And this should be the export rate not just production.
Lets just assume the ratio is 2:1 right now 2 above ground barrels lost for each one depleted. And it doubles say every
3 years. So in three years it will be 6:1 then in six years 12:1. This is implying a invasion of Iran or other ME war effecting oil supplies within 6 years and note Iran won't be exporting as far as I know within 4-5 years anyway. You have to figure political upheaval will cut of the last few mpd of exports near the end same with Mexico. So each country in decline from now on out will have int own above ground doubling factor.
Of course this effect is on top of the absolute declines.
It would be nice to see it in the model your free to even say start it at 1:1 which seems for sure and underestimate.
So in three years its 2:1 and in six its 4:1 but in 6 years we will have 50% less oil because of depletion so this says we actually hit 12% instead of 50%. Which is about what I'm saying and thats using a fairly generous estimate what I think is real leaves us at about 4% of todays production in 6 years if we are past peak.
So I think you have good numbers to justify 1:1 or 2:1 drops for above ground reasons. The doubling time of 3 years is basically a WAG. I don't know how to get it but 3 years seems to be a magic number for oil production :)
I'm of the opinion it should be added roughly as I outlined then we can go back and think about the doubling time. Its easy enough to pretty much prove 1:1 is real so far as a initial condition. You can consider some oil production as safe or excluded Canada/North Sea/US but to be honest its not clear this is true under the above conditions.
Next assuming the doubling time is longer does not help a lot since the underlying depletion which forms the upper bound for this effect is still decreasing so even if you assume its 1:1 doubling in 5 years to 2:1 we end up at 25% instead of 50% so its twice as much of a lower amount.
A ten year doubling does not make sense since the underlying political economic factors must assert themselves faster than the real decline rate we have plenty of proof for this.
So to range the doubling time it looks like 3-5 years is a reasonable guess. I could easily make a good case for two years. And worst case is 1 year I see no sense in arguing this one even if it was true.
Hi m,
Thanks and this is just so painful to contemplate. I only got through your first full paragraph. (So far.)
Also, (IMHO) (and I know this is suggesting work for others) - this seems really worth filling out and writing up.
re: "We have the Iraqi invasion..."
So, just in oil terms, it's cost...
(so brutal.)
re: "Production has decreased less than 1mpd and we have lost almost 3 times that..."
By "writing up", I mean to clarify what you mean, say, here...geologic production has decreased...because of...and the military invasion caused an additional... - type of thing.
It does seem like it needs to be said, though.
Brutal I agree and its one reason you don't have to have a super good set of numbers for this. Once we reach world peak for every barrel less we pull out of the ground at least one more barrel is initially lost for export from a variety of factors.
1.) Military/Sectarian strife.
2.) Decreased investment because of costs.
3.) EROI costs
4.) Lower quality oil
5.) Increased internal usage
6.) Logistic problems (Shortages etc these snowball)
7.) Political withholding.
8.) Simple pillaging by the rulers in preparation to leave
so projects are canceled and monies diverted to private
accounts.
9.) Technology constraints limits on rigs/people and other goods and services.
10.) Generic infrastructure degradation both oil and in general as maintenance is delayed for a variety of reasons.
I'm sure their are more all of these feedback. Overall the problem is that post peak most responses lead to less overall oil available for useful work and they feedback.
Every time world production drops these effects are amplified.
And more. Many of these problems have existed for some time but as oil production was always either increasing or increasable they did not have the feedback component i.e these problems did not directly lead back to general problems producing oil since replacement oil could be found stopping the feedback loop or at the minimum dampening the effect.
Once you reach world peak these effects are no longer dampened but the feedback loop causes them to result in ever larger losses. Similar issues have destroyed civilizations for thousands of years we have no reason to believe we can escape these basic problems and the result. The impact of decreasing critical resources is well understood and generally the incorrect social response has a far worse effect than the original problem.
Hi memmel,
Thanks. It seems to me to be worth doing (still)...the concept of the oil cost, as opposed to the financial cost, drives home the point. Even as a strategy, the invasion to secure oil does not "work".
To me, the idea is to talk about the oil itself, apart from money. If you need to set a range of numbers, instead of specifics, that seems to be OK.
re: "The impact of decreasing critical resources is well understood and generally the incorrect social response has a far worse effect than the original problem."
See...here's where I want to go, OK, can we work on this? If "well understood" - it might be good to go ahead and state what's obvious - to you. May not be so to others.
The "social response" - being...?
If we can describe the impact you speak about, can we also describe the social response?
And put some thought to that?
It still seems like a worthwhile activities to take things the next step. Let's see...in case...
(Do you see what I mean?)
This is not directly related to the model, but more to the application of the model for drawing conclusions, esp. in the light of declining EROEI of oil production.
AFAIK, EROEI calculations so far include:
1) Increase cost (in Joules) of discovery & recovery
i.e. it takes more energy to get out of ground the same out of oil.
Also, some include the loss in energy output of the oil.
2) Decreasede emergy content of oil barrels as a function of depletion (lower quality oil, less J/l).
This takes care of the fact that as a resource, the pumped oil has less energy per volumetric unit than previously recovered higher quality oil.
However, I haven't seen discussion about:
3) Increased spending of energy in oil refining (out of various grades of crude, most of which are becoming heavier/dirtier) in order to make it into "Usable liquids" and "usable materials" (aka. feeds of fuel and raw materials that our existing petro-dependent processes can readily accommodate).
That is, there seems to be at least three components to declining oil eroei (I've written this into form where a comparison point in time "baseline eroei" is positive number X and eroei losses that accumulate after that point in time are substracted from that):
EROEI = BASELINE EROEI - (additional energy spent on recovery) - (reduction in energy/barrel in the crude) - (increase in refining energy expenditure to make useful feeds out of heavier crude)
Are these three real or are 2 and 3 more or less the same?
Can they be accounted for (estimated or analyzed through production/refining data from already depleted fields)?
How much does this combined EROEI loss (assuming it exists and is significant in magnitude) affect useful outputs from oil industry? What if Export decreases (as per export land model) actually reduce the amount of useful and available crude oil derivatives (gasoline, heating oil, petrochemical feeds, etc)?
Isn't this what matters in the end? Not various categories of crude oil per se (all clumped into barrels), but the actual petrochemical refined products that we use day-to-day?
I'm not saying looking at crude oil output (regardless of API) isn't important, but can we go further?
Has any one calculated this for oil ?
If we have even a reasonable estimate it would be useful.
Kudos to WebHubbleTelescope for creating the SM and Kebab for his analysis and extenstions (HSM)! I'm sure that there is a refereed paper in here if you want to take the time to publish it. Two thoughts ...
IMO, the most important aspect of the SM/HSM is that it is not based on a derived URR. This is one of WHT's main points, and it is what makes this model harder to refute out of hand. You can make a (simplified) elevator speech about how it works, and most people will get it. Don't mention the math. (And my own personal soap box, Hubbert didn't use a mathematically derived URR in 1956 either. He estimated it based on geology.)
Also, there has been several good ideas about how the model could be improved to capture more accurately the dynamics of real production. As a simulation guy, I like the idea. However, I'm concerned that additional model complexity would fail to bring greater fidelity due to the inaccuracies already inherent in the data.
"Measure with a micrometer, mark with chalk, cut with an ax."
The model could be refined but it would required more parameters (and more data) adding complexity and uncertainty. I like the fact that the HSM seems to be a good compromise between the logistic and the shock model. The HSM is physically grounded, is making use of both the discovery and the production data, can track the history of oil shocks and seems to have a more robust predictive ability. The next step will be to test the model on more datasets.
Khebab,
Taken in gross terms, are you comfortable with how this portrays the likely peak in oil production as being now?
BTW - Thank you for all the work you did. This took awhile huh?
It took me about three weeks of work.
I think that reserve growth is largely overestimated but I have no data to prove it. Estimates on reserve growth for 2006 will be very important. I think that PO for conventional oil (i.e. excluding tar sands) is probably about now. Growth in NGPL and tar sands may delay an all liquid peak for a few years.
The problem is that if their are large over estimates in the reserves which I believe exist and I'm talking 10-50GB or more worldwide. Next the effect of advanced extraction methods is not really in the historical data. So you still have a chance for a sharp decline post peak that cannot be eliminated.
So far we have not been able to rule out the worst case scenario. To me thats the most important thing the models could tell us.
Its important to know if we can expect a slow boil or not right now I'm my opinion the question is still open.
Hi m,
re: "So far we have not been able to rule out the worst case scenario. To me thats the most important thing the models could tell us."
Worst case in terms of date? Or, in terms of the compounding of problems you describe. (?) Or, do you mean in terms of decline rates?
So we get an alternative confirmation of Stuart's "Peak is Now" thoughts from about 18 months ago. Interesting.
And great work, Khebab. You and WHT are doing some amazing stuff here.
Ghawar Is Dying
The greatest shortcoming of the human race is our inability to understand the exponential function. - Dr. Albert Bartlett
Hi Khebab,
Great work!
Some comments on Fig 10.
You say that "the proven reserve increases for 2001 and 2002 are probably bogus". According to BP Statistical Review, from 2000 to 2001, Kazakhstan increased reserves a large amount from 25 Gb to 39.6 Gb; Russian Federation, 59.6 Gb to 63.2 Gb; and Nigeria, 29 Gb to 31.5 Gb.
Similarly, from 2001 to 2002, Iran increased from 99.1 Gb to 130.7 Gb; Angola, 6.5 Gb to 8.9 Gb; and Nigeria, 31.5 Gb to 34.4 Gb.
Some of the proven reserve increases for 2001 and 2002 may be bogus but some are probably genuine.
The bottom of Fig 10 says "The corrected reserves account for anomalous Middle-East reserve revisions". I assume that these anomalous reserve revisions refer to the upwards revisions in the 1980s. These upwards revisions are estimated to be Iran, 33 Gb; Iraq 40 Gb; Kuwait, 25 Gb; Saudi Arabia 90 Gb; and UAE, 60 Gb. This gives a total anomalous upward revision of 248 Gb which should explain the variance between BP proven reserves/production and corrected reserves/production.
What about other Middle East anomalies? Once the Middle East countries above suspiciously increased their reserves in the 1980s probably to increase their quotas as no fields were discovered, these same countries did not revise their reserves downwards as they were being produced. A case in point is Saudi Arabia, in 1987 their reserves (BP) were 169.6 Gb and in 1989 260.1 Gb. In 2005, Saudi reserves were still at the same level of 264.2 Gb. Saudi didn't find any new fields but they produced well over 50 Gb.
Another Middle East anomalous adjustment could be the amount of oil produced from the Middle East from 1980 to 2005. Using BP again, this amount is equal to 176 Gb.
Using a production of about 29 Gb for 2005 means that the corrected reserve (red circles) line drops by 176Gb/29Gb/yr=6yrs downwards to coincide with the HSM (West Siberia) reserves/production of 32 years.
If this additional anomalous adjustment is included then your Fig 10 shows a stronger downwards trend in reserves/production which provides strong evidence for declining world oil production.
But is this not the heart of the problem ?
Using reserve figures and deciding to keep or throw out certain estimates you can get any number you want. I think your on the right track but on the same hand the numbers are unreliable.
I think whats needed is to go back to a HL style URR prediction but with the use of discoveries and as I mentioned before documented reserve growth when a field is first developed since this is in a real sense discovery not reserve growth.
Other than that I just think that including reserve growth opens up a can of worms. This current work does a beautiful job of highlighting the problem but as a predictive tool it seems to me that reserve growth must be almost totally eliminated simply because the numbers are bogus.
But memmel, if you backdate discoveries to account for reserve growth, you are still accounting for it. And you do have to account for it. Reserve growth in many cases is real as technology improved or data about a field improved. In some cases it is a flat out falsehood, as in the OPEC nonsense so you have to account for it one way or another. Backdating it does nothing except obscure the situation, in my opinion.
In fact, the real problem is neither reserve growth nor backdating of reserves. The real problem is what Matthew Simmons pointed out - quality of data.
Ghawar Is Dying
The greatest shortcoming of the human race is our inability to understand the exponential function. - Dr. Albert Bartlett
To be specific changes in reserves early in production as real well data comes in from the field is in my opinion discovery.
Increases in reserves from technical advances etc are highly questionable. Esp later in a fields life. I'm of the camp that all they do is extract oil faster and increase the depletion rate.
Now I except that some fields could not be developed without horizontal wells but I've yet to see convincing evidence that if you keep the pressure up on a field any other technical changes actually lead to real reserve growth as apposed to simply changing the production profile.
Thus I simply don't believe most of the growth.
Reserve growth has some significance because I contend that even though it is phantom growth (rate limited by SEC rules against over-speculation) and may not really occur physically as you rightly say, it does exist as a business indicator. By this, it gives the oil producers incentive to add more wells over time, contributing to something akin to the Maturation phase in the Shock Model.
But I do agree that the distinctions between reserve growth and marking new reserves as new discoveries is a judgement call. For example, new reserves don't necessarily have to go through a Fallow and Construction phase as a new discovery would according to the model. Therefore, we can backdate the reserve growth number into the discovery date, and let the Maturation phase take care of how it comes on line.
The only issue with this is that Maturation is exponentially damped, while reserve growth exhibits a non-stationary power -law characteristic, which makes it hard to analyze in the Markovian shock model framework.
I guess this gets to the heart of the problem I think real reserve growth follows exponential decay overtime. The effect of SEC rules has to be balanced against the need for funding when making up reserve numbers and you can't be too far off. But little of the world oil is coming from fields effected by SEC rules if the first place so I think this line of reasoning is not valid for the world. Exponential decay in reserve growth makes a lot of sense to me.
Good comment.
I have only corrected for the most obvious revisions (in 1985, 1988 and 1990):
I have not looked into the details of recent increase as you did. Probably most of them are genuine. Also, BP numbers are including 1P reserve for tar sands (Canada + Venezuela) that should be excluded.
BTW, I just noticed a few bumps that I have not corrected:
Iran, 2002: ~30 Gb
Iraq, 1995: ~1-2 Gb
Qatar, 2000: ~1-2 Gb
Does anybody know if those revisions are related to new discoveries?
I don't know, but the reserve growth issue has got me thinking. I see several possibilities for how to add in reserve growth. The first possibility is how you did it, by adding a concurrent phase along with maturation that grows discovery by an amount set by the convolution of a reserve growth curve.
Another is to adjust the discovery curves with back extrapolated reserve growth numbers. But we don't really know how much of a factor that this should be since the discovery curves have been backdated to some extent already.
So a combination of the two posiibilities would mean we have to wipe out the backdated discoveries that have occurred and then add back in the reserve concurrently during the Maturation phase. The key is to avoid "double counting" of the reserve growth.
Re: The key is to avoid "double counting" of the reserve growth.
That's an issue, because we cannot deconvolved the backdated discovery we have no choice but to use a non stationary growth filter. That's the motivation behind the equation (8) where I tried to cut some amount of reserve growth according to how old is the discovery.
OK, that makes a lot of sense. I didn't quite make out why you used a windowed growth function.
The obvious next question: do you think that both the hybrid model AND a reserve growth model needs to be applied simultaneously? For example, do you think that sufficient reserve growth will swamp out the logistic (Q/QT) behavior? It seems that the two may be hard to disentangle near the peak.
The problem is the reserve growth is generally a large number and its not clear that its real. Some of the earlier reserve growth makes sense as what I consider the last stages of discovery as well data is used to better map the reservoir.
But how much of the rest is paper barrels ? Or oil that will actually have much higher extraction costs than projected later in the fields life.
Lets say 40% of the oil produced from a field is produced at a low production rate in the long tail. I question using reserve growth at all since the model equally distributed oil from reserve growth on both the pre and post peak sides of the curve while most of this oil is oil that might be produced in the long tail. So your getting artificially high production rates at peak and a delayed peak compared to reality.
The lower 48 are a special case since extraction technology evolved primarily from issues in the US and SEC rules generally caused under estimation of reserves. The North Sea is a much better modern model of how reserves are produced.
Has the North Sea seen reserve growth that resulted in a significant change in peak production and overall production ?
As far as I know from the data this has not happened.
So outside of the case of initial field development its not clear that using reserve growth is valid for the model.
It may mean the model is unreliable in the long tail but thats not the place we are interested in modeling and its not clear this is the best model for fields in terminal decline since water handling constraints probably have a bigger effect on the production profile.
In my opinion the inflation effect caused by incorrect application of reserve growth to pre-peak production is a pretty serious problem. Unless we can show reserve growth is real in the sense that it both increases peak production and delays the peak date correctly for regions in know decline I'd think its use is suspect.
I am not swayed yet. Whether reserve growth is real or not is independent on whether it puts pressure on the extraction rate. For example, a perceived greater reserve allows them to make a decision to build more rigs and thus to increase the extraction rate. But if the perceived reserve turns out less than expected, then the extraction is reduced.
Perception may trump reality. Whether it is a first-order or second-order effect I don't know. If the reserves are as high as some claim, and as some of the questionable statistical analysis indicate, then we should put it in, at least as a form of worst case (i.e. conservative) error.
You are right, reserve growth in North Sea shows no real reserve, if you don't count the double humped discovery as reserve growth.
UK shock model curves

unshocked
shocked


Note that on this set, the curve required a deterministic delay of 4 years for each discovery, which I rationalized by the fact it takes a finite delay to accomodate rig construction before any pumping is allowed on a difficult offshore platform.
http://mobjectivist.blogspot.com/2005/10/uk-north-sea-simulation.html
As far as I'm concerned if reserve growth is not from discoveries after about 1970 or so when we had reasonable technology and understanding of the field geology its very questionable. And if its coming from real discoveries we can book it as discoveries. Reserver growth numbers without associated discoveries are in my opinion bogus. At least present the model without these reserve growth figures.
I will admit that but dismissing these numbers you could easily underestimate oil that could be produced in the long tail end of oil production but I assert that for world peak this tail is irrelevant because of above ground factors. And more important the reserve growth gives what I consider a inflated peak production and delayed peak date not clearly backed but a real process lets call it the paper barrel effect.
Next in your reply can you explain a bit you present it shocked and unshocked. I'm not sure what you mean by unshocked this is without discovery ? The shock part is primarly from backdated discoveries.
Or is it just the triangular discovery curve you present here
without shocks.
http://mobjectivist.blogspot.com/2005/09/oil-shock-model.html
Sorry I'm being dense but I'm not sure what you mean by unshocked shock model :)
Unshocked means that the extraction rate is constant over time or varies gradually. Real shocks are where sudden changes in extraction rate occur, as occurred during the oil crises of the 1970's and early 1980's.
Discoveries are not shocks by themselves because they get filtered by the time constants of construction, maturation, etc. The filtering removes any instantaneous changes. Whereas extraction rate can be turned down at a moments notice -- due to political or economic situations, for example. Although a bit more difficult, extraction rate can be cranked up as well.
BTW, that triangular discovery curve is used for illustrative purposes only.
We have shown last time (see Figure 8) that this behaviour makes the predicted production follow the reserve profile R(t) leading to an immediate peak most of the time.
I usually see an immediate peak only if the lag terms are small (I still think that 3 years for the lag terms is on the low side), or if there is no reserve left to speak of.
In the latter case, I agree that the only ways to get the peak up is to start increasing the extraction rate or by adding in the reserve growth.
Reserve growth is very tricky because of the outlandishly bad statistical tricks used in papers by Attanasi & Root among others. That is deserving of a long discussion thread all by itself.
After staring at it awhile, I agree that your equations (2) and (3) show some amazing insight that I hadn't put together yet. I only have a slight misgiving on how accurately that Q(t) provides the right "incentive" stimulus to increasing the extraction rate. It may be heuristically about right but it gets back to the old adage of equating oil to a birth-model. YET ... Perhaps the numerator Q(T) acts more like a technology driver to up the extraction rate. Then it looks like the extended overshoot over the conventional Shock Model is provided by the hysteresis in the Q(T) outpacing the QT(T) in the out years, until QT catches up. This gives us a clever way of generating an uptick in extraction rate over the constant rate that the shock model assumes. It's a bit of a Kalman-like filter trickery where we use the Logistic model as a short-term estimator for future extraction rates.
Brilliant idea, I say.
caveat: I still like the idea of playing with the Maturation lag a bit more. My gut says that Maturation acts a lot like reserve growth and if we can supply realistic numbers for the Maturation lag, we can also model the peak-extension better than the "immediate" drop-off we see.
Pertaining to my caveat, I noticed Equation 7, and you captured the Maturation lag I was imaging there quite well.
So I agree that extension of peak can be modelled by a Logistic extraction rate uptick or by adding in reserve growth.
Which one works best, I don't know. They both could be important.
I only have a slight misgiving on how accurately that Q(t) provides the right "incentive" stimulus to increasing the extraction rate. It may be heuristically about right but it gets back to the old adage of equating oil to a birth-model.
I agree. I don't have a physical interpretation for such a linear behavior that would be equivalent to the "word of mouth" term in the Stochastic Bass model (maybe our economic expansion is equivalent after all to this internal influence). However, it seems to describe well the observations for the last 20 years (Figure 1) so there must be something behind this phenomenon.
About the maturation lag. I agree that it deserves more attention, I have fixed the value at lambda= 3 years to limit the discussion.
It could indeed be a technology driver, i.e. word-of-mouth discussions about extraction advances, but then why does it need the QT(t) as a denominator? That would tend to suppress the effect until QT(t) starts to stabilize, which allows the ratio to then take off.
The heaviness of the tail in Figure 6 is critical to understanding the 'soft landing' in out-year oil production.
I did a impulse-response experiment similar to what Khebab did a while back where I assumed that incremental reserve growth decreased slowly as 1/T (still infinite supply!) but it did not stretch the peak out that much. However it did provide adequate supply cushion in the future, with a more gradually declining production rate.
Red curve=extraction. Green curve=reserve estimate additions.

And the equivalent curve to Figure 6.

http://mobjectivist.blogspot.com/2006/12/conun-drum.html
The problem with this analysis of the tail is EROI effect predominate on the tail of the world peak. They don't effect local peaks in a world that has not peaked. Even a rough estimate shows EROI potentially have order of magnitude effects on high energy tasks such as oil extraction. As rising oil costs increase production costs delaying projects lowering the amount of oil produced rising the cost....
So for world peak EROI consideration would I believe be the predominate force driving production rates much past the peak.
Associated and similar political factors will only further drive down oil production. And of course export land model.
Since Oil prices act almost the inverse of the fractional banking system with a large reserve requirement with a rise of 1 dollar per barrel results in say a cost rise of 2-3 dollars. Indeed we have seen costs double and almost triple as we continue to be constrained by production. Buy using the model I'm proposing that costs rise much faster than price and only the fact that originally production costs for a lot of the worlds oil where a fraction of the price has saved us so far. This cushion is rapidly disappearing and is probably the biggest obvious effect of peak oil too date.
The biggest reason this is important is this squeeze removes the vast profits made by the national oil companies used to finance social programs. We seen that despite the high prices for Oil most of the major western oil companies are not reaping the expected profits because of cost. The National Oil companies are under just as much strain.
I think the shock model is amendable to including EROI/Political/Export Land in the model.
memmel says,
"We seen that despite the high prices for Oil most of the major western oil companies are not reaping the expected profits because of cost. The National Oil companies are under just as much strain."
Damm! How much were they "expected" to reap?! :-O
RC
Remember we are only one cubic mile from freedom
If their cost basis had stayed low it would have been what 6-10 times higher profit margins instead of just 2-3.
Production costs range anywhere from 7-40 per barrel. Its hard to find recent numbers but overall I suspect you will find that costs have generally increased substantially in the last few years.
A couple of things about per barrel costs. These are as far as I know direct costs and do not include overall operating costs that themselves are influenced by oil prices. Also the expenses in oil production tend to be up front when a field is developed so new production is already prohibitively expensive even with todays high oil prices thus the profit margins from the recent runup have in many cases already been absorbed for the newer projects.
If a barrel of oil is 60 and costs are 40 then the profit is 20.
If a barrel of oil is 40 and costs are 20 then the margin is 20.
For the National oil companies which used that used to have insane profit margins their cost have increased in a similar way as with the private firms but more important their social welfare costs have soared since many import subsidized gasoline or internal demand has increased lowering the profit margin not to mention they import most of their goods which have suffered price increases from fuel issues. KSA for example imports most of its food.
So yes they have had or more correctly had a large windfall when supply dropped but production costs where low but this is rapidly eroding.
One big reason I suspect OPEC wants to see 100+ oil they as their cost rises into the 40 bbl range they need that to keep their newly fat profit margins. Not to mention the rampant inflation we have experienced that has eroded purchasing power of the petro-dollar substantially.
In general expect the profit margin to narrow from now on out. They all probably all made the highest margins in 2004-2005 if you include social program costs for the National companies. Or maybe to put it another way the real purchasing power for all oil producers has I believe peaked and is in decline. The problem is since most of the money goes into social programs its the fact its declining not the amounts that is important since these countries are faced with cutting social programs from here on out which does not bode well for their security.
Maybe WT can add all this into his Export Land model its really just and extension of the concept.
I suspect because of the bidding war scenario we will see another jump into the 100+ range when the wealthier countries start competing for oil. But the purchasing power will erode quickly since oil prices are very inflationary.
Its not clear that even this will give the real purchasing power enjoyed in 2004-2005 since you have to consider the recent massive monetary inflation thats fueling price inflation along with oil. I actually believe that monetary inflation and the oil wealth are linked because of the movement of this huge amount of money made on oil back into the capitol markets driving down yields. This real leveraged cash seeking high yields has a hell of a big multiplier much more then Central Bank actions since this money is hot.
I know this is a tremendous amount of additional work but it sounds like Khebab has it planned. Applying the HSM against the Lower-48, Texas, Prudhoe Bay, or the North Sea should be very illuminating. Particularly if you see what the HSM would have predicted right at points before, during, and after peak.
Ghawar Is Dying
The greatest shortcoming of the human race is our inability to understand the exponential function. - Dr. Albert Bartlett
Yes, I was planning a third part maybe in May as soon as I can get some data (I asked Jean Lahèrrere but he kindly told me that he cannot give me that data for confidentiality reasons). However, he told me that I could get some data on the DTI and NDP website (UK and Norway).
It's really a shame that there is no public and open database.
Perhaps some of us can assist and see what we can dig up.
Ghawar Is Dying
The greatest shortcoming of the human race is our inability to understand the exponential function. - Dr. Albert Bartlett
Thanks! Any help is welcomed!
Re: reserve growth - lo ng post:
Following are my comments on my USGS petition. USGS RG projections are a huge overstatement.
4.10 Reserve Growth (Chapter RG) General Failings
4.10.1 Reserve Growth Causes
The un-stated assumptions of the RG projection are that RG is purely a function of geology and is uniformly time dependent. Neither assumption is valid. What are the real conditions?
- Reporting practices A)
In the USA, regulations require companies to report proven reserves. Proven reserves are defined as 90% probability10. If a company is quite capable of making an accurate 50% probability (most likely) initial estimate, but is constrained to report only the 90% probability estimate, (certainly the case in the USA for the last 30 years), their reported reserves will grow over time as more drilling is done and more reserves are proven, converging finally on the original 50% estimate. (Reserve growth being growth of “proved” reserves is clearly recognized on page RG-2).
In the rest of the world the tendency is to report proven plus probable – defined as 50% probability10. If the uncertainty of such estimates is similar over a large number of fields there will be a rough balance with shrinkage of some fields balancing growth of others, and near zero net growth as a result of development. Laherrere has illustrated such an actuality.11
- Reporting practices B)
Historically, especially in the years of corporate ownership and booming discovery, it was in the interest of the petroleum corporations to under-report reserves, even when not constrained to by regulations. Low discovery years could then be compensated by reporting some of the pocketed reserves, thus keeping shareholders happy. In the late 1960s under-reported reserves were probably very large. Subsequent nationalization and declining discovery rates, in all probability, have largely emptied the corporate reserve pockets. They can’t be emptied twice.
- Technology
Before about 1930 oil discovery was largely random and estimating reserves was a matter of guess work. Technology has progressed through gravimetrics, seismology, digital analysis, 2D and 3D imaging, data base development, computer correlation of well logs and seismology, enhanced well-logging and widespread computerization with PCs and supercomputers and sophisticated imaging software. Estimating reserves was associated with pretty high confidence levels by the 1970s and had become something approaching an exact science by the early 1990s.
In the early days it was logical to estimate conservatively and err on the side of caution.21 Technology has allowed updating of prior conservative estimates, providing reserve growth that will not be repeated.
Since 1980 or earlier, initial P50 non-USA reserve estimates would have been sufficiently accurate to allow for relatively little growth due to technology.
- Politics/Quotas
OPEC quotas are decided, to no small degree, relative to reserves. OPEC members who want to increase their quota are motivated to announce higher reserves. Whether OPEC reserve growth, which was very high in the 1980s, was a case of emptying pockets of unstated reserves left over from nationalization, of applying new technology to old estimates or to quota wars is unclear. However, there is real risk that present reported reserves are overstated, especially as they have grown moderately for a decade regardless of production. Future shrinkage is more likely than future growth.
Flash – The O&GJ just lowered their Middle-east reserves growth base estimate by 180 Gb.22
4.10.2 General Conclusions
- Reserve growth is much more an artifact of reporting than a function of geology.
-Due to technological progress and changing reporting motivation, reserve growth is not uniformly time dependent.21
-USA reserve growth history cannot be used to estimate reserve growth for the rest of the world.
-30 year reserve growth history (eg 1940-1970) of a group of fields discovered long ago (eg 1935-1940)cannot be applied to a group of fields discovered recently, (1980-1985). (If reserve growth really was valid, this factor alone causes the USGS to overestimate the growth by 200-300 Gb for all discoveries since 1980!)
-Most historic non-USA reserve growth will not be repeated.
These conclusions completely invalidate Chapter RG and the bulk of the 670 Gb of estimated reserve growth.
4.11.3 Robustness/Reproducibility
It would be appropriate to test the applicability of the growth factors. Consider that large fields discovered long ago, under conditions of high uncertainty and high motivation to understate, show substantially higher growth than small fields discovered recently under conditions of initial estimation accuracy, motivation to overstate and requiring few wells to be proven.21 A good test would be to divide the total population of oil fields into large field, medium and small field groups. The large field group will have most of the oil, and the small field group most of the fields. Now divide each group into young, middle-aged and old subgroups. In the young group include fields less than 30 years old but for which known growth is now zero.
Without having done this exercise, but inferring from Morehouse21, one can confidently predict that the zeroth year large-old growth factor will be not less than 6x the corresponding small-young growth factor. If the resulting 9 growth factors are then applied to the subject population by size and age the USGS results will not be reproduced. Using a single growth for all fields overstates potential growth substantially.
Example: Prudhoe Bay had “proven” P90 reserves of 9 Gb and P50 reserves of 12.5 Gb in 197712. Production peaked in 1988 and by 1997 “known” oil could be confidently projected as 12- 12.5 Gb. Secondary recovery (infill drilling and re-pressurization) had been extensively applied13 so expected growth was already zero. If 1977 is taken as the zeroth year the USGS factor would have estimated growth of 45 Gb vs an actual of less than 3.5 Gb or more than 12 times too high. (If the initial P50 reserves estimate had been used, real growth would probably be slightly negative). Prudhoe Bay is a large young field. Imagine the error multiple on a small young field outside the USA reporting an initial P50 estimate.
The reserve growth estimation fails the test of robust reproducibility.
4.11.5 Historic growth
Chapter RV notes that world reserves grew by 379 Gb from 1981 to 1993, “despite declining exploration” (a tacit acknowledgment of declining NFWs – see 4.4.2 above) and 254 Gb of production. (Total additions to reserves of 633 Gb in 12 years). The interpretation is that “future reserve growth of discovered fields has been under assessed”.
The USGS completely fails to note that 329 Gb of this growth took place in OPEC15 in 1983 through 1990, and that OPEC reported reserves then remained unchanged through 1993 despite production. Nearly 400 Gb of the 633 Gb noted was quota motivated, (see 4.10.1 above) and is no indication at all of future reserve growth.22 Most of the rest was discovery, not reserve growth.
Similarly, upward revisions of past reserve estimates as a result of applying new assessment technology, (common in the 1980s), is no indication of future reserve growth.
The interpretation stated is both naïve and misleading.
The chapter goes on to state that estimates of the total resources limits in general have regularly increased, with reference to Adelman and Lynch. This statement is clearly false. Forty plus estimates done from 1959 to 1999 show no trend for forty years and they include prior USGS estimates16. Adelman and Lynch are not hydrocarbon experts, and as noted cornucopians are not appropriate references, unless there is an intent to mislead.
4.11.6 Reserve Growth Assumptions
“Reserve growth is the major component of remaining US oil resources. Projections of reserve growth of known fields have therefore become necessary elements of US petroleum resource assessments.” (Page RG-1)
This assumption fails to recognize:
- The inapplicability of large-old growth factors to small young fields.
- Small young fields are proven relatively quickly with relatively few wells and therefore will hit zero growth long before 30 years.
- Seismic 3D, enhanced well logging and improved computer analysis move the initial P90 estimate much closer to P50 and reduce growth potential. (See Prudhoe Bay example above)
-
“Patterns of past reserve growth are assumed to form a rationale for modelling patterns of future reserve growth”. (Page RG-2)
This assumption would only be valid for USA P90 to P50 growth with a valid pattern. Other causes of reserve growth (see 4.10 above) do not form such a rationale. Even for the USA, the pattern used, not adjusting for field size and age, is invalid.
“Age of fields is assumed as a surrogate for enhanced recovery practices”.
This assumption is not clear, is not explained, and therefore is not useful to the user.
“Age of fields since discovery is a predictive variable”.
A factor derived from early growth of large-old fields is not predictive of early growth of small-new fields. (See 4.11.3 above).
“The O&GJ in 1996 noted 1990s’ additions of large volume through other than new field exploration” (Page RG-4), assumed by the USGS to be reserve growth.
Most of such growth was simply no changes in numbers reported from year to year by many countries, but especially by OPEC. These additions are much more an artifact of reporting practices than proven growth and should be treated as very suspect.22 The failure of the USGS to do so is, at best, unhelpful.
“The same reserve growth function was applied to all fields”. (Page RG-4). “Reserve growth function intended to represent world potential to be added to the remaining reserves of known fields”. (Page RG-5).
This in spite of the fact that there was an earlier observation that all fields do not exhibit similar growth. Note - no mention is made of fields that show negative growth11.
“Applying USA reserve growth to world reserves would give smaller error than not considering reserve growth”. “USA reserve growth experience ……… giving insight for rest of world potential”.
These assumptions are both unsupported and unsupportable, and are misleading for the user. The error is vastly larger than a no growth assumption, and is conducive to potentially hazardous complacency. USA experience provides no useful world insight.
Very good points, and I would say difficult to refute individually or collectively.
So you sent this as a chapter in a longer petition to USGS?
I hope the petition was to get some people fired from the USGS. I think the guilty parties know who they are.
The petition was sent in July 2002 under Public Law 106-554, H. R. 5658 sec. 515, covering integrity of information from Federal Agencies. It was rejected with a nonsense and non-responsive answer, and I have had better things (for me) to do with my time and money than hire a lawyer to sue. My demand was to get the USGS 2000 report withdrawn, with an apology to Congress. Clearly the USGS has totally failed to comply with the provisions of this law in almost all respects. So much for government respect for our laws.