The Shape of Oil to Come
Posted by Rembrandt on October 12, 2007 - 10:00am in The Oil Drum: Europe
This article is about the way in which oil production is going evolve. Will there be a sharp peak, or a long lasting plateau?
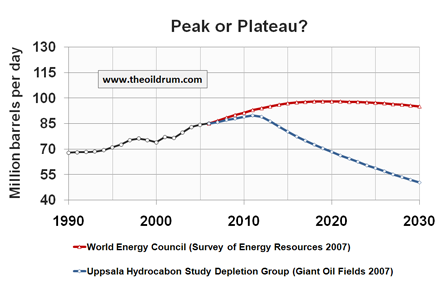
Our future is highly dependent on the way in which worldwide crude oil production is going to decline. If it goes rapidly, declining with a few percent each year or more, than it will be very difficult to complete the energy transition without severe economical consequences. If production stabilizes and plateaus for a decade or longer, after which the period of long decline begins, it would provide much greater means to sustain the present economy. Stability is needed to scale up alternative sources of energy sufficiently to replace crude oil during a transition period of decades.
Within the world of independent forecasters both the peak and the plateau scenario exist. The group of sharp “peakers” are mainly represented by the experts within the Association for the Study of Peak Oil and Gas (ASPO). The best publication out there so far is that of the Uppsala Hydrocarbon Study Group (UHSG), which is led by ASPO President Kjell Aleklett.
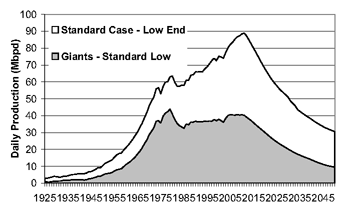
 In his PhD thesis, Fredrik Robelius has outlined the fate of the Giant oilfields, that drive crude oil production, and came to the conclusion that production will peak between 2008 and 2018, at approximately 90 to 95 million barrels per day. With the more likely scenario stating that the peak is in 2012 after which a sharp decline occurs. By 2030 he suggests production could have declined towards the low point of 50 million barrels per day.
Figure 2 - Fredrik Robelius
The group of “plateau” forecasters are widespread. Coming from a variety of organisations such as the BGR, the World Energy Council and energy consultancy PFC Energy. The analysis of the latter results in maximum production being reached around 2014, at nearly 100 million barrels per day, which would be maintained for a decade after which a slow decline occurs.
The plateau scenario would be far more beneficial for the world because it is not likely that it will lead to widespread liquid fuel shortages. Other liquid sources or equivalent energy sources can in that case fill a large part of the gap between supply and demand that is going to occur. The world could step up the pace significantly for the energy transition to succeed, leading the way for the time when production worldwide is going into actual decline. If this decline would occur immediately after the peak without significant preparation instead of a plateau, a worldwide liquid fuels crisis is inevitable.
Differences come mainly from disagreement related to the role of technological progress on valorising oil reserves into producible reserves.
What drives oil production?
From statistics we know that since the beginning of 2005, crude oil production including unconventional has been on a slightly upsloping plateau (see Oilwatch Monthly). It can be concluded from different reports, that in the the same period of time, 4 to 5 million barrels per day of new production have been added to supply (Skrebowksi, 2006; Koppelaar, 2006; CERA, 2005) . Which implies that present world production is declining at a rate of 4% to 5% annually. When looking at the scheduled new oil fields coming on-stream in the coming years, one can see a continuation of recent supply additions. Approximately 5 million barrels per day will be added each year up to 2010. From this it can be concluded that the present situation – a plateau that started in 2005 - is stable for now as long as no major factors are going to change. This situation is plotted in figure 3 below, where we see production increasing through an up sloping plateau until 2010, continued by a down sloping plateau until 2013 after which the decline sets is. In total this scenario amounts to total present recoverable (proven + probable) reserves of 1220 billion barrels, which is in line with current estimates from the IHS Energy database.
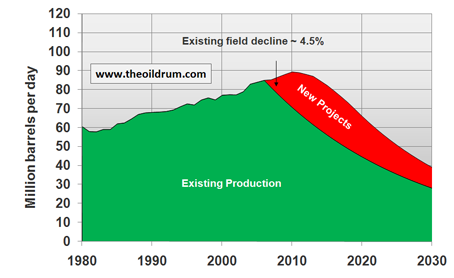
In relation to the peak or plateau question, this raises two questions. For how long will the oil industry be able to add such a large amount of new production each year? And the second being, is the decline rate of 4% to 5% stable or will it increase or decrease in the future?
The answer on the first question is dependent on two developments, future oil discoveries, and additions from unconventional plays. The answer to the second question is dependent on technological developments that add reserves, keeping the decline rate down, and on the production expectations for the giant oil fields in the world (Robelius, 2007).
From historical data we know that discoveries peaked in the 1960’s and have been declining ever since. Presently we are discovering on average one barrel for every three consumed. The continuation of this trend, which is very likely given the lack of new regions that have not yet been explored, would imply a remaining amount of oil yet to be found in the order of 100 to 250 billion barrels. The effect of 170 billion barrels of new discoveries in the coming 15 to 20 years is shown in figure 4 below. This would extend the present plateau until approximately 2017, under the assumption that the present decline rate of 4.5% will remain stable.
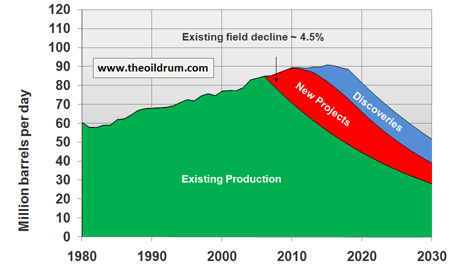
Figure 4 – The effect of 170 billion barrels of discoveries on the shape of oil production, assuming a continuation of the present decline rate of 4.5%.
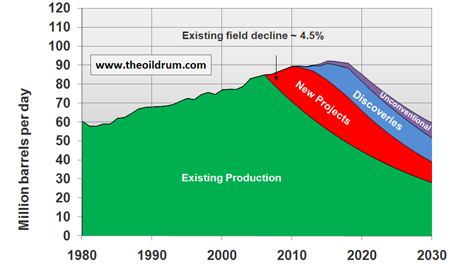
While discoveries can influence the extension of the plateau, unconventional crude oil is not likely to have such an influence. With unconventional in this article I mean oil sands, oil shale, polar oil and heavy and extra heavy oil. Present scenario’s for these sources of unconventional oil estimate a production level between 8 to 12 million barrels per day in 2030 (Campbell, 2006; IEA, 2006). This is too little and too late. The effect of approximately 12 million barrels per day by 2030 of unconventional production is shown in figure 5 below, which only slows the decline setting in 2017 slightly.
Will the decline rate continue at 4.5%?
The scenario in figure 5 above, with a plateau extending for a decade, is very dependent on the future evolution of the decline rate. As mentioned before, technological development can add reserves to the present oil fields of the world, so called reserve growth, and thus slow the decline rate significantly. For more details about reserve growth, I wrote a three part series about this topic, published on The Oildrum last year (1), (2),(3). Estimates and opinions on reserve growth differ widely. For the purpose of this scenario exercise, we take the figure of 500 billion barrels presented by Ray Leonard as the consensus conclusion of one of the latest HedBerg Conferences on the future of oil production. More information about this conference can be found in the interview of journalist David Strahan with Ray Leonard about the HedBerg Conference. The figure of the Hedberg conference leads to a recoverable conventional reserves estimate of 1890 billion barrels (1220 billion from present reserves, 170 billion from future discoveries and 500 billion from reserve growth). How likely this amount of reserve growth is going to occur will be discussed later in the discussion at the end. The effect is shown in figure 6 below, where we see that a sum of 500 billion barrels does not lead to an extension of the plateau, but to a much slower decline rate after the slightly higher peak.
On the other hand, there is also a significant downward potential because of the giant and super giant oilfields which dominate production. In his PhD thesis, Fredrik Robelius did a splendid job on analysis the largest oil fields in the world. A set of 507 giant and supergiant fields, contain around half of the words presently expected oil reserves that are going to be produced, according to the IHS Energy database. Their share of present total production is 48%, or in production terms, 40 million barrels per day. From his model, Robelius expects that these fields are the main driving force behind the shape of oil production yet to come. When this group of fields, that has been on a plateau since the ‘80s, starts to decline, world production will go with them. In figure 7 below the low standard case from Robelius is shown, assumptions behind this scenario can be found in his PhD. thesis on page 126 and 127, such as the expectation that the ultimate production of the supergiant Ghawar will be 105 billion barrels.
Next to the decline in production from the super giant oilfields, which is bound to increase decline rates, deepwater production will also have a significant influence. Deepwater fields have a rapid upslope, a short peak and a rapid downslope, because that is the most economical way to produce the oil from deepwater fields. In total, deepwater production is expected to ramp up to 9 to 12 million barrels per day at the beginning of the next decade, after which a annual decline of 10%-15% sets in (Campbell 2006, Robelius 2007).
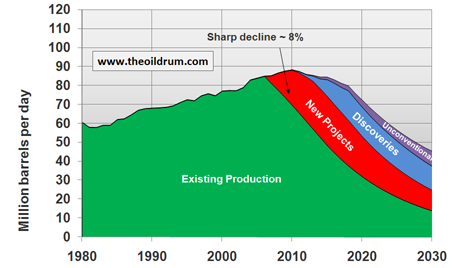
A scenario of what could happen to the shape of oil production because of these downward potentials is shown in figure 8 below. Here we see production increasing to a peak in 2010, after which the decline sets in which increases rapidly at the end of the next decade. Leading to a recoverable conventional reserves estimate of 1170 billion barrels (1000 billion from present reserves and 170 billion from future discoveries).
Conclusions
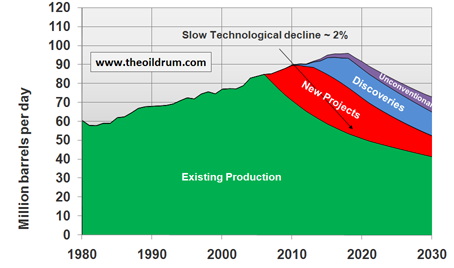
1)If the global decline rate of existing production of 4.5% continues, oil production is likely to plateau at a level of 90 million barrels per day around 2010 until the end of the next decade, after which a moderate to sharp decline sets in.
2)If the global decline rate of existing production of 4.5% slows down to 2%, thanks to the addition of 500 billion barrels due to reserve growth, production will likely increase with some bumps towards 95 million barrels per day at the end of the next decade, after which a slow to moderate decline sets in.
3)If the global decline rate of existing production of 4.5% increases to 8%, due to the effect that the end of the era of giant oil fields and declining deepwater production has, production will likely peak around 2010 at 88 million barrels per day, declining slightly to 80 million barrels per day at the end of the next decade, after which a sharp decline sets in.
Discussion
The discussion on peak oil has progressed significantly since the article on the end of cheap oil was published in Scientific American (Campbell & Lahérrere, 1998). Presently there is a converging agreement that we are going to enter a period in which supply can no longer meet demand, giving way to sustained high oil prices. Either because of the expectation of a long production plateau for one to several decades, or a peak after which a sharp decline sets in. My scenario exercise supports mainly the view of a peak with a sharp decline. The conditions in which a plateau can occur for more than a decade are an unlikely amount of reserve growth, significantly above 500 billion barrels, and/or much higher unconventional production increases.
As to what is the most likely scenario, I expect that the increase towards a higher decline rate, as shown in figure 8, is going to occur. The reasoning behind this is a combination of developments, 1) The end of the era of giant oil fields, where there was a sustained base of production of 40 million b/d, which is going to fall away, 2) The end of a sharp increase in production thanks to deepwater, which is going to go away with an equally sharp decrease, 3) The fact that the world has produced more reserves in the past three years than have been added from discoveries and reserve growth (Robelius, 2007; J.S. Herold, 2007), 4) The effect of above ground factors on production, which will lead to higher declines, because from 2009/2010 onwards there will be a significant gap between personnel supply and demand (CERA, 2007), there is a problem to scale up sufficient oil rigs for exploration and production (Simmons 2006), unrest and geopolitics are delaying new oil fields developments, and keeping production down in several countries such as Iraq, Venezuela and Nigeria, which is not likely to change for the better in the future.
References
Campbell C. (2006), The availability of non-conventional oil and gas, Prepared for the Office of Science and Innovation, Department of Trade and Industry, 16 pages, London
Campbell C. & Laherrére J. (1998), The end of cheap oil, Scientific American, March 1998, p. 78 – 83
CERA (2005), Worldwide Liquids Capacity Outlook to 2010, CERA Advisory Services, 58 pages
CERA (2007), Engineering Talent Squeeze --“People Deficit” -- Likely to Cause Further Delay in Some Oil & Gas Production Projects through 2010, Cambrigde Energy Research Associates
Herold J. S. (2007), Global Upstream Performance Review 2007, 29 pages
IEA (2006), World Energy Outlook 2006, International Energy Agency, Chapter 3, pages 92-94, Paris
Koppelaar R. (Oktober 2006), Oil Supply Analysis 2006 - 2007, ASPO-NL Newsletter, 4 pages
Robelius F. (2007), Giant Oil Fields - The Highway to Oil, Faculty of Science and Technology, PhD.,Uppsala University, 168 Pages
Simmons M. (2006), Limits to Growth: The Impact of Rig Scarcity, Oil & Money Conference, London, 23 slides,September 18, 2006
Skrebowkski C. (April 2006), Prices holding steady, despite massive planned capacity additions, Petroleum Review, p. 28 - 31
Personnel
Editors
Contributors
Peak Oil Primers
Archives
- November 2010 (3)
- October 2010 (6)
- September 2010 (4)
- August 2010 (7)
- July 2010 (6)
- June 2010 (7)
- May 2010 (2)
- April 2010 (8)
- March 2010 (4)
- February 2010 (6)
- January 2010 (3)
- December 2009 (5)
- November 2009 (8)
- October 2009 (12)
- September 2009 (6)
- August 2009 (5)
- July 2009 (11)
- June 2009 (8)
- May 2009 (16)
- April 2009 (10)
- March 2009 (7)
- February 2009 (10)
- January 2009 (15)
- December 2008 (9)
- November 2008 (9)
- October 2008 (9)
- September 2008 (13)
- August 2008 (10)
- July 2008 (14)
- June 2008 (23)
- May 2008 (16)
- April 2008 (12)
- March 2008 (16)
- February 2008 (9)
- January 2008 (13)
- December 2007 (13)
- November 2007 (16)
- October 2007 (22)
- September 2007 (8)
- August 2007 (9)
- July 2007 (16)
- June 2007 (8)
- May 2007 (7)
- April 2007 (7)
- March 2007 (10)
- February 2007 (10)
- January 2007 (12)
- December 2006 (9)
- November 2006 (15)
- October 2006 (4)
- September 2006 (5)
- August 2006 (5)
- July 2006 (9)
- June 2006 (5)
- May 2006 (10)
- April 2006 (9)
- March 2006 (13)
Vital Trivia
License

This work is licensed under a Creative Commons Attribution-Share Alike 3.0 United States License.
http://science.reddit.com/info/2zf7k/comments
resubmitted this morning...if you are so inclined...we thank you for your support.
Thanks Rembrandt, I always find your posts very informative and top quality.
hmm... maybe but it seems that growth is occuring mainly in the other liquid category:
growth in C+C seems to have stalled despite planned new supply from megaprojects:
From: Chris Skrebowski, "Prices holding steady, despite massive planned capacity additions", Petroleum Review, April 2006.
It seems to me that these forecasts have been somewhat optimistics and were forecasting something very close to business as usual (i.e. ~2%/year growth in supply). The actual production plateau was not predicted (see chart above). Have you conducted a post-mortem analysis?
The presence of a plateau is not obvious on your Figure, it seems that production growth from 2005 to 2010 is pretty much inline with the growth we had between 1982 and 2005.
Is the decline rate stationary? if you look at production decline in mature regions, the decline rate seems to linearly accelerate (~0.13% per year):
For instance, the logistic model predicts a linear dependency between the decline rate and the cumulative production as a fraction of the URR:
Decline rate(t)= K*(1-2*Q(t)/URR)
Khebab,
Your final graph is interesting. Are you estimating annual decline as the percentage increase of [this year] over [previous year]? Would you care to speculate about the reasons for the change in character of the curve after 1960? Before then it seems almost uncorrelated year on year, whereas after 1960 it gets much smoother and remains so for the next four decades, apart from the last hurrah (Prudhoe Bay?) in 1978-ish. What changed in 1960?
RE: Are you estimating annual decline as the percentage increase of [this year] over [previous year]?
Yes.
RE: Would you care to speculate about the reasons for the change in character of the curve after 1960?
Noise is a lot stronger before 1960 but I really don't know why. Maybe it has to do with the way the data was collected.
I will suggest and answer as to the "why" the US curve smooths out after 1960.
First, if you run a time series analysis on the variance(on the monthly data) you will see there is a periodicity in production of ~2.5 years. Even though they are much smaller in amplitude now, they persist to this day. What it looks like (and models out) is a damped sinusoid.
As the base magnitude of production increases (and "spare capacity" becomes challenged and decreases in both real and relative magnitude), the variance decreases.
Part of this change in amplitude may have been a policy change (and remember OPEC formed in 1960, though they didn't really flex their muscles until 1973). US imports grew significantly during the late 1940's and 1950's from 9% to over 20%, while oil exports fell essentially to "zero."
But in the period of the 1960's, oil imports also stabilized, as a percentage of the total, at around 20%. So, in a growing consumption modality, US production (or imports) could still act as the swing supplier though the degree of "spare capacity." was quickly being "consumed." And remember, the Texas Railroad Commission was also the 800 pound gorilla in the room with regard to US production.
A similar situation can be seen in the global data. If there is a great deal of "spare capacity" in oil production (and you have the storage capacity for what is produced), then you can see a great deal of variability both on the growth side and the downturn side of the production curves that are underpinned by economic conditions. This high degree of variability is seen in data all the way up to 1991.
But in the upturn in production that began in June 1993, the monthly variation became noticeably smaller (almost non-existent) as global oil production increased from about 60 million barrels per day in 1993 to about 67 million barrels per day just 5 years later in 1998. A short sputter between 1998 and 1999 and much monthly variation before resuming a runup into early 2001. Another short sputter into 2002 and then the last runup from 2002 into 2005 with somewhat larger monthly variation than seen in the late 90's run.
But since 1993, the variability (other than economic downturns) has become much smaller than in all previous data.
This diminishing variability looks like what happens when you have strong growth colliding with capacity issues and, in the case of the US in the 1960's, the coming peak. I suggest the same is likely to be true on the global scale, though we have many more "types of oil sources" than we had when the US peak occurred in 1970.
This is not to say we cannot have large spikes in production, but it seems less and less likely. Anyone know of any new Ghawar's planning to come on-line?
As an aside; in a class I teach, I start the class out on corn and wheat production with a progressive reveal of the curves and actually tell them what they are looking at. Then, I show this US oil production data and tell them "Here's 110 years worth of production data, and obviously we've gotten good at this. So, based on what we've done and been able to do so far, where do you think we will be in 40 years?" I also show them the growth variance curve that shows that while percentage growth is getting smaller, growth is still occurring. Then I give them the finer detail (monthly) from 1920 through 1970 so they can see the seasonal effect and the diminishing variability "for the past 50 years" prior to the 1970 peak.
Well, nearly all of the 40 students in the classroom just mentally extend the production out into the future and come up with an answer of "about 6" (representing the billions of barrels produced for a year, though they don't know that).
And then I put the graphs up with all the data since 1970 included and reveal what they are looking at. "Past performance does not guarantee future performance." Knowing what underpins the data, however, is useful.
Great story about your class!
Can you show us the examples you show in your class, or share the data if you have it in a xls format?
I could use that in the class I teach :)
plucky underdog:
In the late 1950's the world began to really use a lot more oil and gas. The oil finding rate was just about at its maximum, and nationalisation was a storm cloud over the horizon. OPEC hadn't been started It was the good old days of the "free market capitalism" approach to the oil business.
As the world changed from coal to oil for its fossil fuel BTUs, the amount in export trade went up a huge amount. At the beginning of the Second World War, Texas produced 60% of the oil and petrochemicals in world trade, although Texas was producing about 5 million barrels a day.
The rest of the oil in world trade came from Iran and the beginnings of the mid east fields from Shell and Anglo-Iranian Oil, now BP.
When the market was smaller and thinly traded, the decline rate was more closely tied to the performance of individual fields or groups of fields. But as the markets grew, the decline rate had a much larger group of producing field to average it over, so the curve got flattened. At any rate, thats my hypothesis and Im stticking to it. Bob Ebersole
Bob, Rembrandt: your explanations sound coherent... anyone know when the US became a net importer? (the readily-available data series on the Web don't go back as far as 1960, let alone before). I'm going to look at the data for the UK, which recently became an importer as well.
Khebab, westexas: if it (production rate volatility) really is affected by the switchover to export, does this analysis have any interesting implications for the predictive power of ELM? Not trying to muscle in on your zetetic bailiwick, just interested.
It appears that the US became a net importer right around 1949, 21 years before we peaked. Because of a rapid increase in consumption, the US actually showed a pretty rapid collapse in net exports.
Thanks Khebab for your useful comments
Correct
Correct but is this a temporary trend or a sustained one? That is the big question, which is very dependent on what is happening in Saudi Arabia, Russia and Iraq.
Yes, I have the projects in my database, and did some post-mortem work. One could even argue that the decline is somewhat smaller, if the decline in Saudi is voluntary. I still don't feel that we have a definite answer on this.
That depends on how one defines plateau. I called it an upsloping plateau, which in the light of demand growth is correct (demand outstripping supply).In the absolute term it is incorrect. Next to that it also depends on what numbers one takes, Liquids Production has increased with 1 million barrels per day from 2005 to 2006 according to the IEA. However the EIA figures do not show such an increase but a "real" plateau.
The point of this exercise was not to look at a plateau vs peak from a micro scale but from a macro scale. Ill try to be more clear next time in my definitions!
First we need to define what we mean with decline rate, in this post I looked at the total stock of existing fields (including those in a built up phase of production, on plateau and already past-peak). Your chart seems to include total production over time, not total production from a point in time. And then the development of the decline rate over time of that amount of production.
As to whether the decline rate is stationary, it is not. According to some it goes in cycles because of the addition of new production (in the case of existing stock through technology), and the outfasing of quickly declining oil fields over time. The technological vision is that the decline rate can be slowed down in a period of high oil prices.
To my opinion it is not correct to compare the development of decline rates in one oil producing region to another. This will lead to bad estimates because each region has many different characteristics. The problem here is then again a lack of data. While logistic models in general if sufficient correct data input is supplied can give an excellent outcome, we don't have such data. Fortunately over time we are getting somewhere, data quality is improving!
I was looking at your last figure with a 8% decline and I was thinking: why not exploring a range of possible decline rates and take the one that is giving the best match between the bottom-up analysis and recent production levels for C+C? a kind of maximum likelihood parameter estimation, I wonder what value it would give?
I too think comparing Chris past predictions with his great mega projects studies, plus a comparison of predicted new projects vs. delays, would be very useful in calculating a current world decline rate. Roughly, if Chris has been expecting 1Mb/d more each year, and if we are actually flat/down a bit, then his number for world decline (4.5%?) should be adjusted upward, say to 5.5% or so. Unfortunately, it looks like the rate is accelerating...
Why don't you take a stab at it?
That's a good idea, looking at Figure 8 it looks like the decline rate should be more around 7-10%.
Important that this dependence reduces to the Gaussian profile that Stuart discovered a couple of years ago that fits the USA production.
i.e. solve the equation
dP(t)/dt = (k-at)*P(t)
leading to
exp(kt-at^2/2)
When I look at your first two graphs (the horizontal axis on the third one is too compressed to easily read) it appears that we are likely to have as much oil in ~2020 as we do now.
How is consumption projected to change over that 10+ year period? How many new vehicles on the road and how much more/less efficient might those vehicles be?
Correct, whether that will be the ultimate outcome is unknown, but this simple exercise shows that this could happen.
I cannot say, that requires some analysis on what type of vehicles can come on the road at what pace. Probably quite somewhat more vehicles on the road thanks to the development of electric cars, biofuels and more efficient vehicles.
The question I find more intruiging is where these vehicles will be driving ;-)
Rembrandt, while I respect your careful scholarship, I'm wondering what mechanism you envision will actually get all liquids production over 90 mbpd? It appears to me that price is not doing it. Despite the price of crude doubling and doubling again, the world is currently producing a slowly declining level of both conventional crude and all liquids. It appears to me that the price of oil has reached a level that causes price increases in everthing necessary for oil production, limiting future mega-projects.
PLAN, PLANt, PLANet
Errol in Miami
Actually, I don't think it is so much the price of Oil that is causing all these projects to increase in cost, as much the price of Iron Ore, Coal and skilled labour.
Iron Ore and Coal are driven by the industrialization of the world outside the OECD. China's economy now uses about as many resources as Japan and continues grow at 10% per year. The future of the world is likely outside the current OECD.
Thanks for your comment notintodenial
The word currently is important in your sentence. There are many projects in the pipeline (shown in red, giving an additional production of approximately 25 million b/d over time). We will have to see whether these are going to be developed quickly enough, and how the decline rate develops.
I am working on a project analysis for 2007/2008 to see whether the current plateau is going to change next year or not. Will take me a month or two to finish it though probably (it's a lot of work, and I have a lot of other things to do).
Rembrandt, thank you for reminding me that price signals require years to work their way through stucture-intensive industry, and also for the the excellent analysis you generously contribute.
PLAN, PLANt, PLANet
Errol in Miami
I too have been thinking about price, and its effects on supply growth (or at least stemming decline). It seems to me to be too often neglected.
Obviously there's a supply curve and a demand curve, and they meet to determine the price. They also shift over time. Over the past century, the demand curve has been shifting towards greater quantities for a given price (more people willing to pay $30 for a barrel), and there's every reason to expect that to continue (though the rate may slow as high prices encourage conservation). The supply curve has also been shifting towards greater quantities as investments are made to develop more fields, tankers and pipelines are built etc. The result has been rising quantities with stable prices (volatile of course, but not trending).
Now that we're bumping up against geological restrictions on supply, and depleting the largest and best fields, that's changing. Going forward, [i]fewer[/i] suppliers are going to be willing to sell at a given price (as their lift costs rise or they simply water out). For supply and demand to continue meeting, prices have to rise, probably dramatically.
But as prices rise, we can still climb that supply curve. The short-term supply curve is obviously very steep beyond whatever "spare capacity" currently exists -- you simply can't ramp up production as much as you'd like overnight. But what's the slope of the longer-term supply curve? Right now the oil companies are largely using their profits for dividends or stock buy-backs, because they're conditioned by cyclical thinking into believing prices will go down again. Eventually they'll realize that the paradigm has changed, that prices will keep rising (at least until we come up with a decent alternative for transportation, which looks a ways off). How much investment would be driven by the [i]anticipation[/i] of $150 or $200 oil?
In short, I'm expecting a fairly long plateau in quantity with steadily rising prices driving the development of resources that are currently non-economical.
peace,
lilnev
Rembrandt:
Thanks for a thoughtful key post on our actual world oil supply situation. I appreciate your hard work and attention to detail.
You've not included any contribution from what I consider to be the most profitable unconventional oil sources, redeveloping old petroleum reservoirs in post mature basins, which could actually double or triple the ultimate recovery of all fields that peaked before 1980.
I'm a landman and an independent in the Texas Gulf Coast, one of the most mature basins in the world, so my level of expertise is beyond a laymans but still pretty limited. However, I do know that few of the techniques that are raising production in the current supergiant and giant fields have been applied to old fields. Secondary recovery-waterflood-was not standard in the United States until after 1970, and not general until after the 1980 price spike. #D seismic was not practical until the advent of inexpensive computing in about 1990, and the same with horizontal drilling or CO2, thermal or solvent tertiary development. If the international fields are like the US fields, only about 10% of the oil originally in place has been produced, contrasted with the 50% to 70% of the OOIP being currently produced from fields.
As Steve Andrew's of ASPO USA noted, its not the size of the tank, its the size of the tap. It seems unlikely that production from redeveloping old fields will do anything but slow the decline rate and extend the plateau, but it could add significantly to the ultimate world recovery. add Bob Ebersole
"Improved" extraction techniques that are raising production in super giants usually allow you to get oil out faster, but in turn that also means that you run out faster. The upslope is steeper, and so is the eventual downslope-- just look at Cantarell, which now faces alarming depletion rates due to nitrogen gas techniques used to ramp up extraction. I'm predicting that we're going to see a steep downslope, and be cut off quickly as nations with rising internal demand stop exporting their surplus.
Deuterium,
I wasn't commenting on fields that are currently producing like Cantarelle, but rather on fields like Baku which was discovered in the 1880's and few reservoirs waterflooded or the giant American fields that were far past their peak in 1980.
There's a great paper on CO2 enhancement published by the US Department of Energy and available online. I'd link it but I'm a computer moron, but its entitled "Ten Basin Oriented Strategies for CO2 Enhancement" .
try this:
http://www.fe.doe.gov/programs/oilgaspublications/eorco2/east-central-te...
I'll finished this post, then looked for the link again to try to hook up. But any rate, the DOE says that on fields like that the production averaged around 10% of the original oil in place in the United States, so that leaves a target of the balance of the oil in place-as much as 6 times the primary production, as a target for tertiary production. This assumes that the US has a big enough sample of the world basins for its statistical conclusions to be useful worldwideThe particular assessment i linked to shows 80 billion barrels from the Giant Fields of the Texas Gulf Coast and the Panhandle. Thats right, the geographical assessment makes no sense, it seems to be all oilfields outside the Central and east basin platforms of the Permian basin, but the info is good.
Bob Ebersole
Deleted comment, I misread your post, sorry
there's a guy at texas a&m named datta-gupta who's been working on methodology and software to have a second shot at mature oil fields:
(from http://www.netl.doe.gov/technologies/oil-gas/Petroleum/projects/EP/ResCh...)
An Integrated Approach to Characterizating Bypassed Oil Saturation in Heterogeneous and Fractured Reservoirs Using Tracers
Akhil Datta-Gupta (datta-gupta@tamu.edu
DE-FC26-02NT15345
Goal
The goal of this project is to develop a systematic and cost-effective approach to the design and interpretation of Partitioning Interwell Tracer Tests (PITT) to infer hydrocarbon saturation distribution in highly heterogeneous and fractured reservoirs. The key elements of this approach are a very fast streamline-based flow simulation technique and a rapid and novel history matching technique that exploits an analogy between streamlines and seismic ray tracing. This approach will be orders of magnitude faster than conventional history matching, resulting in significant savings in computation time and manpower. The integrated approach will take advantage of the dense spatial coverage of the seismic data for static modeling and the strong coupling of interwell saturation variations to partitioning tracer response. The outcome of this research will be a systematic approach to the design and interpretation of tracer data and practical, PC-based software tools providing high-resolution saturation estimates in the interwell region by combining well log, seismic, and partitioning tracer data.
Performers
Texas Engineering Experiment Station, Texas A&M University, College Station, TX
Petroleum and Geosystems Engineering, University of Texas at Austin, Austin, TX
Results
The major project accomplishments to date are the:
* Development of a “generalized travel time” inversion scheme for interpretation of field tracer response via inverse modeling that can result in orders of magnitude savings in computation time and significant cost savings in terms of manpower (days as opposed to months).
* Generalization of the streamline-based simulation to describe fluid transport in naturally fractured reservoirs through a dual-media approach. An examination of the scaling behavior of the computation time indicates that the streamline approach is likely to result in significant cost savings for large-scale field applications.
Benefits
The streamline-based inverse modeling has resulted in a dramatic cost reduction in terms of computation time and manpower when compared with traditional history matching. Field scale tracer test interpretation can now be carried out in a matter of days as opposed to weeks or months, and this makes the technology accessible to small operators. The approach is particularly advantageous for high-resolution geologic models consisting of millions of cells that are now routinely used in the industry. The streamline approach has been generalized to model water injection in naturally fractured reservoirs through the use of a dual media approach. Researchers have shown that the streamline models exhibit a linear scaling of the CPU time as opposed to a quadratic scaling for finite-difference simulators. This has the potential of significant savings in time and manpower for field-scale applications in fractured reservoirs.
Background
One of the goals of reservoir characterization, particularly in mature reservoirs, is to identify unswept regions containing high oil or gas saturation for targeted infill drilling or enhanced recovery. The project goal was to develop a systematic and cost-effective approach to the design and interpretation of PITTs to infer hydrocarbon saturation distribution in highly heterogeneous and fractured reservoirs. Unlike other efforts in this area, the focus of this research was to identify the location and distribution of remaining and bypassed hydrocarbons in mature oilfields. This represents an enormous resource—on the order of 100 billion recoverable barrels in domestic fields.
Summary
The project utilized the unique features of streamline models to develop an efficient approach for interpretation and history matching of field tracer response. Researchers investigated the relative merits of the traditional history matching (“amplitude inversion”) and a novel “travel time inversion” in terms of robustness of the methods and convergence behavior of the solution. The research shows that the traditional amplitude inversion is orders of magnitude more non-linear and the solution likely to get trapped in local minimum, leading to inadequate history match. This project’s proposed travel time inversion has been shown to be extremely efficient and robust for practical field applications.
The project generalized streamline-based simulation to describe fluid transport in naturally fractured reservoirs through a dual-media approach. Researchers compared their results with a commercial finite-difference simulator for waterflooding in five-spot and nine-spot patterns. For both dual porosity and dual permeability formulation, the streamline approach shows close agreement in terms of recovery histories and saturation profiles, with a marked reduction in numerical dispersion and grid orientation effects. An examination of the scaling behavior of the computation time indicates that the streamline approach is likely to result in significant savings for large-scale field applications.
Project performers have also developed several alternative ways of using PITTs in oilfields for the calculation of oil saturation, swept pore volume, and sweep efficiency and assessing the accuracy of such tests under a variety of reservoir conditions.
==================================
Prof Datta-Gupta has also co-authored a textbook on this technique:
Datta-Gupta, Akhil, and King, M.J., Streamline Simulation: Theory and Practice, Society of Petroleum Engineers, textbook series
Thanks for the book references, I'll get copies!
I think what he's working on though is different from the type of reservoirs I'm working on, though. He's working on limestone reservoirs, mostly from the Paleozoic through the Cretateous Eras, while I'm working on salt domes on the Gulf Coast in Miocene,Oligocene and Eocene formations. There are only a few limestone reservoirs, and they're not tight-they are reefs and cap rock reservoirs on the Texas Upper Gulf Coast domes. Bob Ebersole
Some of the oldest fields that probably haven't been subjected to modern extraction techinques:
Kirkuk, Basra
what a coincidence?
Man we should send troops to control these resources.
Ohh wait.
Actually one of the biggest reasons I think that a steep collapse is coming is because of the moves in Iraq and Afghanistan. And I believe no one saw WT export land.
If the powers where willing to do Iraq without the export land model image what they are thinking now.
Tuning the extraction rate up and down using the Oil Shock model gives insight that you can't get from HL. FWIW
Right the shock model could actually correct for technical advances in extraction technology.
I don't agree that HL is wrong per-se but once technical advances are in place for a long period of time and no new ones cause significant changes HL would again be correct.
Back to the dogleg phenomena HL would settle back to the correct answer once the furious drilling campaign fails to produce results that can sustain the rate of drilling.
Your correct that HL is blind to this sort of systematic error because of technical advances but over time as real production data is added it corrects itself.
Considering that both shock and HL point to fairly steep declines already its safe to conclude that the steep decline
model is probably correct and in my opinion like global warming we have underestimated the real decline rate. Since no one has really taken technical advances into account.
deuterium, look at my posts downthread. Off shore wells that are drilled horizontally don't run out of oil more quickly than onshore wells, but rather the workovers cost 10 or 20 times as much as the equivalent workover on an onshore well, so the well can't be produced for years at low level of production with a high water cut.
Think about the geometry of a horizontal well. The centralisers on the rods rub up against the casing, rods are hard to screw and unscrew after pumping under stress, and the oil must flow by gravity through the horizontal leg to get to the downhole pump. If the well sands it must be jetted out with high pressure water after pumping the water through coiled tubing, its not like a 5,000 ft verticle well. Plus, workover rigs are mostly on a barge and require a captain and an engineer as well as the tool pusher for the workover rig. It just plain costs a million bucks for a workover that might cost $100K onshore with a rig thats trucked in and half the crew size.
That means that a well becomes uneconomic much more quickly.
Bob Ebersole
Oilmanbob thanks for your insightful comment
That is an intruiging statement. Your story makes a case for the plateau scenario, but from what is happening in the present, (very high decline rates), it doesn't appear to be happening, or if it is happening the impact isn't sufficient.
Can and will this be applied at a global scale? And what is the amount of production we are talking about? What will it add to the slowth of the decline rate? What price would trigger these techniques being applied? Do we have enough in house knowledge in the oil industry to massively imply these techniques?
Rembrandt,
First, let me disqualify myself a little. I was an english major in school, because I loved hippy girls, the beautiful sounds of words and was lazy to boot. I was drafted into oil and gas exploration by my father, an Oil and Gas Title Attorney , but my family's first real involvement was in about 1950 as investors in Houston. Something really strange happened, after 2 years or so I discovered I loved the oil patch and buying oil leases and had a real talent for parts of it. I can follow many mathematical arguements and know a lot about geology, geophysics and technology, but my best guesses about physical quantities are just that, good guesses.
I really appreciate the bottom up analysis that you have generously shared with us, and I could no more do your work than a duck can tapdance I'm really awed by your work, and Khebab's,Stuart's, Ace's and the rest of the quantitative guys with real mathematical skills.
Oil production and consumption has been increasing staedily for years, and the fields that I consider candidates for tertiary development all had their peaks before 1970. The world produced about 60-65 million barrels per day. The natural pressure in the fields was expended, and the fields will have to either be repressurised through waterflood, gas injection or CO2 injection to get much production, and that will be both expensive and require lots of high level engineering. So I'd say as a practical matter that if we could get 5 million barrels of oil per day for the next 30 years this would be a resounding success.
If you'll look at the National Petroleum Council reportgraphs, they suggest that in 2050 the world could get 40 million barrels of oil per day from tertiary develpment, which I consider wildly overoptimistic. Westexas suggests that all this type of production will do is slow the decline, and I think he's right about this. But the resource is real and should extend oil production a long time past my life, though, although not at the rates they suggest.
Why its not being done as yet is based in contemporary history. The big oil companies started to consider the US to be geopoliticially unsafe about 1973 when Richard Nixon put price controls on US oil, followed by the Windfall Profits Tax. They changed the whole focus of their exploration to natural gas offshore in the Western Gulf of Mexico in shallow water areas. They were barred from drilling in the California and West Coast areas after the Santa Barbara blow out, and NIMBYism was created in Florida and the US East Coast too, and the Exxon Valdez oil spill at Cook Inlet barred them from ANWAR. This was an reaction to the sixty years of political manipulation by the owners of the major oil companies who had resisted the New Deal, sold gasoline to the Japanese in their war of conqest in China, and the Nazis in their invasion of Poland. The majors redeemed themselves with their efforts in 1942 building pipelines to the East Coast of the US. But, all my life the Major Oil Companies have caused major problems in both the USA and the rest of the world. Now 88% of the exploration areas of the world is controlled by National Oil Companies (source:API), and nobody except themselves have considered it to be unjust or undeserved.
The Upstream arms of the multinational oil companies are designed to do one thing-locate and produce new Giant and Supergiant oilfields. And they are superb at that, now they are pretty well out of new areas to explore, although deep water technology is adding new deepwater areas, and therefore more prospects. The big boys can't make money anymore on establishing new fields or even step-out wells onshore in the USA. Their internal overhead is so bloated that a 10 million barrel of oil reservoir won't make them any money . They sold off almost all their Gulf Coast and Mid Continent production, they are operating very few fields except in the Permian Basin and California in the USA. In other words, they no longer have acreage positions or wells in the old fields in the USA onshore basins, and the ones that they do have still are mostly already developed.
Bob Ebersole
OMB...I really appreciate your abilities to be a liaison between the hardcore petro-statisticians and the laymen here at TOD.
BTW...I HAVE seen a duck tap dance before...jk ;-)
Thanks, Dragonfly 41. We all bring different perspectives to looking at peak oil, and cooperate and teach each other. I love this blog.
I'm getting for free information that various experts are working on in real time. We help each other, and because of our varying backgrounds but emphasis on the scientific and technological approach, we get the benefit of near real time peer review of questions and possible solutions of the world energy and growth problems. The Oil Drum is an amazing way to solve problems related to energy and the environment, and we've only begun to scratch th surface of its utility.
The example of this I'm thinking about is the biofuels/ethanol/cellulistic ethanol/biodiesel solution to the liquid fuels problems of the peak. It was just beginning to be examined when I first started reading the blog about a year and three or four months ago. Almost everyone who reads this blog is predisposed to like a sustainable, renewable solution to our energy problems, and we were blessed in that one of the regular contributors, Robert Rapier got his Master's studying celluistic ethanol.
But by the time this group had finished studying the possible solutions, various members of the group reviewed the math and came up with documentation about the inputs, the fertiliser, the diesel for tractors and ect. made all these "solutions" not very practical and an evironmental disaster in the making. The result, diseminated by he stock market/speculator guys that read the blog is that ethanol is now having a hard time getting financing and will likely never be scaled up. Think about it, the truth is that the most opportune time to implement ethanol has passed, everone questions it and its unlikely to end up with massive subsidies with a new president in 2009.
I think this is a model of how TOD will actually work for the world. We're all ied to various companies and organisattions, yet no institution controls TOD. We are using the internet to jump outside our various views of the world.
I think the article Matt Mushalik and I did a few days ago looks at a similar question, from a different perspective.
We found that if one adjusts EIA data for the loss of production during Hurricane Katrina, it already looks like we may have reached a peak in late 2005, and are on the way down.
We also found that there are only a few countries that currently have increasing production. Apart from China and Russia, the only countries with increasing production are shown in this graph. The amounts shown in the graph are the amounts by which production has increased, ignoring their "base" production before the period began.
If we include China and Russia, the total incremental production we get worldwide from growing countries is only equivalent to 1.2 million bpd, per year.
If you are looking at replacing 4.5% of 73 million barrels of crude oil per day per year, that amounts to a required increase of 3.3 million barrels of crude. Where are you going to get the rest of the increase? Some of it will be in China and Russia, offsetting declines on other fields. There is perhaps a bit of other new production in some of the declining countries, but the level of decline of these countries was around 4%, even with this new production.
When one looks the question this way, the question gets to be where we are going to get the incremental new production. We know China and Russia are going to start declining in the next few years. The countries in the growing group are going to have a hard time maintaining their current growth in the future, because of infrastructure issues. Iraq and Saudi Arabia could perhaps add a little, but haven't actually shown that ability so far. It looks like we don't have many places to find the additional required growth to keep overall production from declining further.
you step out the door in the early morning and close the door. You hitch the ox up to the wagon that is bundled high with switch grass. You drive out to the train you get there around noon several people ahead of you, your switch grass finally gets loaded on the train your account card is scaned and you get a recipt you can also see it on your cell phone. at the back of the train you get the ox cart loaded up with very black soil. as you are slowly heading back home the train puffs off. you hope you can get home before it gets too dark.
My grand father was a Blacksmith I am a Lawyer My Grandson will be a Blacksmith.
Where will your grandson get the energy to melt down metal? Breeder reactors?
Where will your grandson get the energy to melt down metal? Breeder reactors?
charcoal
pyrolisis of wood producing burnable gasses that can be made into liquid fuel. I hope creating stable carbon can one day earn carbon reduction credits.
Is Conoco Philips with ADM working on this ?
They got Biodiesel credit for chicken fat.
things gasification and terra preta
...or a solar furnace. 2500+ oC, not a problem. Throughput is low though.
Save aluminum foil, preferably unused. Not a great mirror, but material's dirt cheap.
Gail, interesting data
You seem to be very certain of your case, how do you know?
Regarding Russia, the newspaper article that everyone quotes is a July 10, 2007 Moscow Times Article:
The IEA was quoted in the Moscow Times as saying
If you put in a more realistic decline rate than 3%, the result is clearly worse. Claude Mandil of IEA is quoted as saying:
This statement doesn't say Russia, per se, is declining, but it is not expected to increase enough to make up for the decline in other countries.
Other comments that seem to bolster the view of a near term decline in oil production is this one from Jeffrey Brown:
Also, Jeff Rubin of CIBC in Canada, speaking at this year's ASPO conference sees little growth potential for Russian oil, according to Heading Out:
Finally, in the papers circulated to staff by Euan Mearns on October 11, Ferdinand Banks of University of Uppsala, Sweden in "Architecture of World Oil" says:
Regarding China, part of the evidence is in the form of lack of production. Production is barely inching up:
2005____3,609
2006____3,686
2007 YTD July___3,725
Also, Prof. X. Pang of ASPO China, speaking at the ASPO conference in Ireland, presented this chart:
Let's just say that Russia has a starring role in the projected net export crash by the top five net oil exporters. Details to follow.
It will be interesting if they can continue to upgrade extraction methods with western technology and if this slows their decline rate.
But on that note Export Land has a bit of a catch 22. Countries like Russia that might offset some of their future declines short term via a technology infusions would earn more money and thus it would further spur internal consumption.
So I think its a zero sum game for the most part once a country stops increasing production. In effect any advances with technology only result in higher internal consumption/faster growth.
And with all that it seems Russia has done a good job of throwing out the western oil companies so its not clear that they will actually do any significant upgrading of their technology.
A huge issue for Russia and Alaskan production that I just thought about would be melting permafrost it looks like we probably will see a lot of melting next summer and this external threat may seriously damage Russian production.
Its the Arctic equivalent of a hurricane. Not to mention shorter time periods for things like ice roads.
Memmel, suggesting that the Russians need US Multinationals in order to adopt tertiary development methods is arrogance. The Russian oil business produces about one-half of all the oil in the world, the OPEC nations about 35% and the multinationals together with the rest of national oil companies the balance. The giant service companys control the technology that the Russsians would need to modernise their industry,and i'm sure will be delighted to continue working there. The only thing that changes for them is the name on the invoice. Bob Ebersole
In July of 2007 Russia produced 13% of all the oil in the world. Even if you added the former Soviet States you still would not be up 20% of all the oil in the world.
Ron Patterson
Actually I disagree I think the western oil companies are the kings of extraction. Its not just technology but years and even decades of experience working over oil oil fields. And the smaller players that produce a lot of oil in the US cannot be dismissed.
If the problem is getting blood out of a turnip I think the western oil companies are the best, cost are another issue.
Now I disagree with if these methods in general result in greater URR or just higher extraction rates.
As far as I know all advanced extraction methods have been developed in the west and in in particular this US/Canada.
FWIW, a friend of mine, who is a Russian oil analyst (ie he works for an investment bank, and tells clients what Russian oil stocks to buy or sell) and who has been looking at Russia for ten years (ie he's not a newbie and has very high-quality contacts) reckons that Russian production will not increase more than 1-2% above its current level. The main reason for this is the tax system in Russia - marginal tax rates on production are extremely high.
Cuchulainn
Graphs with various trend lines are fine when dealing with "Engineering availablity(or amounts of Oil that may be pumpable over a period of time)".
But the real problem in the Oil market is 1)The law of Supply and Demand this is well known. But there there is
is also the "fear of running short" a Psychology well known during the 70's when people lined up at gas stations often on a daily basis becaused they had the fear of running short, "hoarding" is also another strategy caused by the fear of running short, this also ocurred in the 70's when people not only queued at gas stations but hoarded gasoline in jerry cans at their homes. If the prices increase quickly in the northern hemiphere summer 2008 as market conditions suggest (oil prices tend to rise quickly and to higher than expected levels when supplies are tight due to demand elasicity problems in this market).
The real fear is that if a panic hits the market about "Peak Oil" and countries like The UK,Norway,Canada, Mexico and Iran and posssibly Russsia have to reduce exports because the voters in those countries want to preserve "domestic reserves" for their own citizens. This "hoarding behaviour" could become a major problem in world Oil Markets and just a small Peak Oil threat could quickly become a major shortage as producers with declining reserves withold from the market due to domestic pressures.
I expect this to happen and for Peak Oil becoming a very sudden Crisis for world economies.
Is not the SPR just a form of whoarding [sic}?
Good post the only problem is production to date has failed to meet the predictions so they are already wrong.
So the question is why might these approaches be incorrect ?
The biggest case is that reserver growth via technical advances is overstated and in my opinion by a fairly large margin.
This leads to the Yibal effect for the big fields.
Next I understand that over 50% of the current worlds oil production is from offshore basins. Until fairly recently most of these basins kept production high via two approaches advanced extraction methods with a lower URR vs Onshore and expansion of the fields to the point we have reached deep water drilling.
HL which seems to have so far done well predicting real oil production is a heuristic equation that assumes past performance is a good indicator of future performance. In general most other reserve estimates are also similar in nature.
At no point has our increased ability to keep high production rates been taken into account the only point that technical considerations seem to be included is the famous dogleg in HL plots around the peak as expanded drilling campaigns are used in attempt to keep production rates high.
The problem is that although this shows in a fairly obvious manner the reality is that technical advances over the decades have increased our ability to maintain production rates by multiples if not a order of magnitude.
HL which has done well to date seems to have a systematic upwards bias.
Now back to predictions of a slow decline and even later peak that so far are actually wrong. If I'm correct that we have badly overestimated URR and production profiles as the world peak we can expect sharp declines.
And finally from a technical perspective smart christmas tree wells or super straws intuitively represent the peak of oil extraction technology in both cost and maximizing extraction rate.
This last technical marvel is being deployed today.
If this is true its no coincidence that production rate is slowing sooner then expected and points to this technical bias as real and valid and that technical advances are no probably no longer a viable way to increase production rates.
Memmel, yours it is an interesting perspective but also a very speculative one.
We don't have a factual basis to make these assumptions.
Memmel,
I always enjoy your posts although I seldom agree with the conclusions you draw. You have a terriffic ability to ask questions that move my thought processes into a different groove. I find it really very useful. I hope the stuff I look at has the same effect on the pure and applied science types that inhabit The Oil Drum.
I think the concentration in offshore drilling is more for geopolitical reasons than geological reasons.
Think about the nature of an offshore rig. They are a boat rather than a platform sitting on the bottom. In production, many production platforms reach the bottom in shallow waters, but they are still ships. They are built and transported in water and the tool pushers are a type of seaman.
The move into offshore exploration overseas took place mostly post 1980. The majors concluded that because of price controls and the Windfall Profits Tax, the USA had moved into the geopoliticially challenged category. This also reenforced their tendency to manipulate the US system, but it moved them to safe areas for drilling and production. At the same time, a lot of the foreign areas that the big boys had thought were great places to drill and produce were nationalised, the biggest wound being the nationalisation of Aramco. As many of the most promising areas have reached maturity in exploration, its clear that Ghawar was the biggest and best field on earth, and it seems to have peaked.
Offshore rigs are safe. They drag them in mostly in international waters, and they are hard to interfere with by a country with a weak navy or pirates/guerrillas with speedboats. By contrast, land rigs have to be trucked in or driven in, and the oil or gas has to get to ports to be sold. Look at the situation in Iraq right now as a good primmer in the difficulties of onshore production in an unstable area. Pipelines get blown up, and in the first Iraq invasion by the US, Burghan in Kuwait was set on fire by the Iraqi Army and the production was very seriously impaired, probably had some really serious reservoir damage although that's just my guess.
The result is that its a heck of a lot easier for a big oil company to justify an offshore prospect than an onshore prospect in places like the Niger Delta. And other really promising areas like the Congo part of the African Great Lakes basin is going to languish.
An oil company doesn't find oil unless it drills, and the multinationals are limited by their size, water depth technology and the geopolitical risk to the continental margins and water depth of less than 1,000 ft. There may be some truly fantastic plays that are camoflauged bypolitics, and thats shown by the Chinese oil companies exploring in Darfur and the Sudan and the dope lord half of Columbia. Bob Ebersole
The approach to projecting "the shape of oil to come" via the guaging each of the factors involved - decline rate of existing fields, new production added, new discovery, change in technology, and so on is all fine and good. But it seems to me that it's doing it the hard way. The Hubbert method is actually a discounting mechanism, the "easy" way, that automatically factors in all these hopelessly complicated things plus some things you or I aren't going to be thinking of. It accounts for old field decline vs new field addition, the changes in the technology and economics of extraction, and many, many more important factors. So where a dissection of the factors such as this one agrees with Hubbert's approach, I think it's probably about right; but where there's disagreement, I favor the Hubbert result. That's for conventional oil, of course. As conventional oil production goes over the peak, unconventional oil, especially deep water, is going to dramatically effect the shape of the curve, as it already is. And here, the Hubbert method doesn't account for it well, so the "hard" way must be used to try to guage it. You make a good point in that the deep water production that is helping to prop up world supply is from ocean reservoirs that behave more like a gas field - sharp ramp to the high production level, a relatively brief production history, then a sharp collapse adding to the likelyhood of the sharp fall off scenario you describe. I don't know how anyone can determine just how much deep water oil there is. It seems like the biggest source of uncertainty in projecting the total liquids peak.
See my above post it eventually gives the right answer but their seems to be a good case that its a fairly high prediction of both future production and URR.
To repeat but keep it short. The dogleg effect has been recognized as an aberration around peak as the nature of the drilling campaign changes fairly dramatically as attempts to keep production up.
Technical advances cause the same errors in the data set but they are hidden and more systematic. WT uses the rule of thumb that production peaks about 60-70% of URR with HL. But if this technical bias is correct it may be say 80-90% of the real URR if technical advances where systematically used to enhance production.
Note that KSA is probably the poster child for an area that may be significantly overestimated by HL.
One that probably is not overestimated is Russia since few of the technical advances where used through the production cycle and the ones that where employed where used for a long time allowing the HL method to account for them.
Actually Russia is a good test case since its just now deploying advanced western extraction methods. If production remains higher than WT HL predictions its safe to assume that a lot of this is just super straw effect.
So if I'm right I think that Russia will actually enter a bit of a plateau or slower decline over the next few years and not decline quite as WT has predicted.
Memmel,
Russia is mostly onshore production. King Hubbert drew up his data from analising onshore basins because offshore didn't exist very much before his retirement and death, just as the 3D seismic and horizontal drilling didn't exist, or producing tar and calling it oil.Bob Ebersole
Well its a combo of onshore/offshore and technology advances thats the issue.
The problem is that both offshore and technical advances that increase production rate over time have a inflated URR vs onshore. So mixing the two data sets gives results that are inflated in respect to URR.
HL will still get the peak date correct and the peak production since its a heuristic equation. But if the production is strongly weighted to offshore which tends to be pumped fast and you leave a lot of oil behind as you discussed before because of economic reasons. The HL will underestimate the post peak decline rate overestimate URR.
The reason it probably continues to fit well up till now is that production in offshore basins was expanding fairly rapidly up until recently. Since HL uses past data to predict the future this expansion factored in to in effect hide the nature of offshore vs onshore wells.
At global peak this expansion effect drops off and we can see the effects of offshore drilling vs onshore.
This is why all the bottom up analysis are off by 10-15 years in prediction peak. We have a lot less oil remaining
then even HL is predicting. Considering that most of the volume declines are early on then 10-15 years is pretty far off.
In my opinion the URR calculations could be off by as much as 20-30% because of the move offshore and technical advances. HL is better but its probably high by at least 10%.
This is just considering the volume of oil thats predicted to be pumped over 10-15 years by bottom up that probably does not exist.
Think about it if the peak predictions are off by 10-15 years that means that the URR estimates are also way off.
Think about the volume of oil needed to maintain a 10 year plateau at 90 mbpd or more and overcome depletion.
If we peaked now then URR estimates are garbage.
I think you have good points re: offshore. Offshoe and deep offshore has heroically put off peak, maybe not for much longer. Certainly decline will be rapid compared with land, and this effect is only beginning to be felt because offshore is relatively recent. Nevertheless, we are already seeing declines in UK/norway, US/Mexican gulf. Rapid declines offshore are IMO not properly included in bottom up analyses which use traditional land based decline rates, eg Chris 4.5% assumption.
OTOH, most production remains onshore, and traditional decline rate/URR calcs would apply. An interesting calc would be to separate world wide land and offshore production, make some assumptions re: both decline (maybe use UK/Nor for offshore assumptions), then look forward, considering how the proportion of offshore production to total is increasing.
This onshore production is basically supported by the giant oil fields that are probably all in decline. A lot of the rest of onshore production is well past peak.
My understanding is offshore is 40-50% of production and a good bit of this has been brought in since the 1980's a lot of the fields are going into decline since about 2000.
This is the "swarm" effect so in general offshore we basically have 40-50% of our production in decline and at a steeper decline rate than traditional onshore production.
And next the URR of these offshore fields is far less than is estimated because of production costs which are increasing dramatically lately esp offshore.
Couple this with Export land and other feedback issues and the chances of a slow decline are pretty small.
Rembrandt says:
But when I look at chart 3 of his (excellent) OilWatch paper, what I notice most of all is the maximum liquids production peak of 86.13 million b/d back in July 2006. This is over a year ago now. Doesn't this show we are already in decline, or is it too soon to say?
I'm new to the forums so please forgive any ignorance I might be displaying here.
I place a lot of importance on Rembrandt's OilWatch work because to me, while the analyses of when the peak might occur are interesting, the only way we are going to know for sure when the peak has occurred is by looking in the rear view mirror.
Also it helps to convince policy makers (at least here in New Zealand) if we can clearly show we are in decline as it is a far stronger argument than using the phrase "oil will peak sometime in the next decade". I think there is a perception that the term "Peak Oil" is associated with some kind of wacky Green conspiracy theory, which is why I'm wanting to use the term "declining oil production" if it is valid to do so.
Very simply, there were periods very recently that (on a graph) look exactly the same as our current situation.
1998-1999 and 2000-2002.
In both cases the Peak-Oil Guru Ken Deffeyes and the Peak-Favorite James Kunstler(based on Deffeyes work) called a peak. They were both wrong both times.
The things that they are saying now are not any different from the things that they were saying then.
Kunstler is a polemist. Deffeyes is a geologist.
Deffeyes has never explained his previous two false calls on peak and why we should believe him now. Never.
All peak predictions. I repeat. ALL peak predictions are based on Deffeyes. His record of failure is perfect.
I expect a new book soon, with a new preface and an introduction by Matt Simmons.
Should be easy. I could write it for them.
Rembrandt Koppelaar takes a hard look at numbers and is extremely disciplined. He looks at the same numbers every month. He is not predicting he is looking at history as best he can figure out.
RK is one of the most under-appreciated geniuses in the peak-oil world. He is not trying to tell you what will happen. He is showing you the rear-view mirror. If you were smart, you would stop trying to see what the entrails say, and pay attention to what he is saying.
That isn't actually true now is it. For example, I don't see any Deffeyesian influence in Skrebowski's work.
Who?
Just Kidding. Let Skrebowski speak for himself. I know exactly who you are and I don't care what you "see" or "don't see." If you are Skrebowski than I apologize for not seeing your flag.
"I don't see any Deffeyesian influence in Skrebowski's work."
You may want to take a look at that. Can any sane person see otherwise? No offense, Chris, but you are an editor here. I think when first time viewers look at TOD and see staements like that - well one of two things happens.
Idiots are influenced. People that know the first thing chuckle to themselves.
Let's play a little game.
How many headline Posts and references has Stuart Staniford had on TOD?
Chris Skrebowski?
Daniel Yergin?
No, Seriously. Just throw some numbers out there.
Hello?
Excuse me, but I can't remember Kunstler or Deffeyes calling a peak in 1998-1999 and 2000-2002.
Kunstler has always used other data as reference, and Deffeyes did call a peak on Thanksgiving Day 2005.
Could you provide some reference?
PS: Excellent work, Rembrandt, many thanks for this, you always spark the most intelligent discussions here!
Deffeyes never backed away from his prediction that world crude oil production would peak between 2004 and 2008, most likely in 2005.
He observed in the 2002 time frame that world crude oil production, contrary to what his model showed, probably peaked in 2000. But that was never a prediction.
You're not contradicting what was said - "observed" and "called" mean much the same thing.
Well here are his followup comments from up the thread:
The second statement if false. Deffeyes never predicted a 2000 peak, and the EIA shows world crude oil production to be down from 2005, while oil prices are hitting new nominal highs.
Through July, 2007, the cumulative shortfall between what the world would have produced at the 5/05 rate and what we actually have produced is about 633 mb (EIA, crude + condensate), despite record high nominal oil prices.
No, but he did call a 2000 peak, and was wrong about that.
EIA data shows oil production over the last 12 months as up from the previous 12 months, and down from the highest 12-month period, although by marginal amounts in both cases (47kb/d and 122kb/d resp., through July07).
IEA data, by contrast, shows a substantial production increase (~1mb/d) over the same period.
In the absence of a compelling reason to favour one dataset over the other, it's much too early to call declining production.
Moreover, there remains the fact that prices dropped significantly early this year, due to the unusually warm winter in major consuming countries, and that increases in non-OPEC production meant that production stayed higher and prices lower than the same time last year until OPEC cut its production. Accordingly, while production does indeed seem to be no higher at the moment than at this time last year, much of that appears to have had an above-ground driver.
Indeed, non-OPEC production is at an all-time high, even according to EIA data, with the last two months of production representing the two highest months ever. In the face of that, it's only reasonable to say there's a lack of production capability if OPEC is unable to push its production back to the levels seen last year before its cuts.
...is misleading. Picking an outlying data point and basing your argument on that is known as cherry-picking, and is not a good basis for a sound and compelling argument.
The IEA data doesn't show May05 as a particularly unusual month, casting some doubt on its exceptionality. What if the EIA revises that data point? Do you really want your argument to be that fragile?
As I'm sure you know, I was talking about crude + condensate--you know, the stuff that refineries buy to turn into refined petroleum products. Both on a monthly basis and average annual basis, world crude oil production is down relative to 2005.
Regarding Deffeyes, it is true that he said that the world appeared to have peaked earlier than what his model predicted, but he never backed away from his model.
Since NGL refinery products compete directly with crude refinery products, it's silly to ignore part of the oil supply. Indeed, both the EIA and the IEA explicitly consider the world's oil supply to consist of "all liquids".
I'm not sure why you bring this up, though, since you're not contradicting anything I said, and it doesn't make any substantiative difference.
It doesn't change the fact that he put his name behind a 2000 peak, was wrong, and hence his subsequent calls of a peak have to be treated with some level of skepticism.
It's kind of like the boy who cried wolf. The wolf was indeed real, but poorly timed and ill-considered warnings ended up doing more harm than good.
I would say the words are completely different, certainly in the given context. Deffeyes called for a peak in 2005 in the late nineties; this was predictive. Later, not realizing the 2001 reduction was on account of recession, he looked back and said that, perhaps, we had already peaked; this was a historic observation and not, AFAIK, based on any new calcs but simply looking in the rear view mirror.
His actual calcs look good in todays rear view mirror, and may turn out to be dead on - Gail points out that total liquids would also have been in 05 had it not been for Katrina - or may not. Nevertheless, for all those thinking the current situation is just like the 02 downturn, consider that the price environment is totally different, encouragaing every producer to produce every barrel. IMO, every producer is responding as best they can, just as I expect SA to produce a bit more just as soon as their new project comes on line.
Predicting the future is tough, those getting it right deserve full credit.
And it was also wrong, which is all that Echelon appeared to be saying in that part of his post:
1) The production graph around 2001 looked like it does now.
2) Deffeyes called a peak.
3) Deffeyes was wrong.
4) Deffeyes sounds similar now to how he sounded then.
You may or may not agree with Echelon on these points; however, whatever Deffeyes said or did not say about 2005 is irrelevant to him getting this one wrong.
Not if the predictor peppers the future with so many predicted dates that the event in question can hardly avoid them. According to this compilation of Deffeyes's predictions, he's said the numbers support 2003, predicted 2004 and 2005, and predicted the whole swathe from 2004-2008.
Nice post Rembrandt, the collection of references is by itself an important source of information.
Like you I also can’t see a plateau at 95 Mb/d forming, but on the other hand we might have one forming at 85 Mb/d. What do you think of the hypothesis of OPEC constraining production where it is to delay as far as possible the onset decline of the Old Giants?
OPEC’s actions in latest months seem to indicate some kind of concertation around 30 Mb/d. A plateau at 85 Mb/d could last, say up to 2015, and soften the huge impact of deep offshore peaking by 2011-2012.
Thanks for your comment Luis,
Possible but speculation. I would be rational to do so, but when have humans ever been rational? You are also assuming that there is a concerted action by all OPEC members around a plateau of 30 mb/d. I don't think OPEC can coordinate it's collective members in such a way. Especially over time, idea's can and will change as the world political system changes. Maybe OPEC currently has a policy to keep production around 30 Mb/d? Maybe in two years time they will say we can sell the oil for 300 dollars per barrel and drop their output significantly? Depends on who holds the power, and who is wiling to pay.
As usual, we shall see ;-)
Energy and Net-Energy Graphs?
I would love to see Rembrandt's graphs converted first into energy (even if only crudely by assigning a uniform energy content to each of the three or four major types of liquids) and then some net energy scenarios based on three possible EROEI trajectories.
Could any of you number wizards do this (or send me your databases so I can do this for you)?
Cheers,
Davidyson
Davidyson, good point, I will add energy conversions in the oilwatch publication in November!
Thanks, this might be very, very interesting!
I was once a supporter of the “slow decline” school. I have had reason to come to the conclusion that the decline may be faster than expected, at least by me. My old premise was that as oil became expensive, producers would make every effort to increase production. However, as I recently discussed on a post here on TOD:
http://www.theoildrum.com/node/2978#more
http://www.opec.org/opecna/Speeches/2007/attachments/Transport_Energy.pdf
If the producers see in the face of rising prices there may well be reason to doubt increases in demand, they become reluctant to make the investment needed to continue increasing production capacity any greater than the minimum amount needed, i.e., they will not be willing to invest in “spare capacity”. Concern about global warming only adds to an environment in which more and more money is being spent to “get off oil”. The lack of dedicated willingness to commit to long term projects (at a cost of billions) will only serve to reduce ability to maintain spare production, and invest in increasing production.
Some folks here at TOD have said that producing nations may “hold back” production. They simply need to withhold or delay needed investment to have the same effect. Interestingly, the financial community seems to be only assisting this. Recently, John Bolger, financier of Vanguard Mutual funds fame, pointed out that the combined profit from "financial services" now easily exceeded the combined profits from oi and gas extraction worldwide.
Roger Conner Jr.
ThatsItimout
Infrastructure will not be sized for a passing peak
What you are up to is a variant of the "load factor" principle, isn't it?
You build the cheap, big, heavy, slow, mostly coal fired power plants for base load, and fast, operationally costly gas- or even petrol-fired power plants for peak load.
Another example: If you build a passive house (one that uses "no" external energy sources for heat and as little as possible for electricity), you usually do not design it to also cover the 10 to 15 coldest days of the year. For this, you provide a wood stove or simply heat electric. The investment for this is much lower than the investment for the extra insulation and air tightness that would be required to cover every single days of operation entirely without external energy, due to the law of diminishing returns.
The same might apply for oil production infrastructure: if an oil producer anticipates a peak, he would probably not want to build the required gas-oil-water-separation plant for the expected geological peak capacity: this peak will be over quickly and the plant will idle a lot of it's capacity, making it a stranded asset.
You're right, Roger, this will "smooth" the peak, making the onset of the plateau earlier - if they expect the peak and avoid going into "overshoot" with their capital investments...
Cheers,
Davidyson
Which does look to be what people are going.
Personally I'd say we are set for a wavering plateau for the 5-8 years as the plays of various countries come out and are countered. As we get towards the end of that time things will become increasingly desperate to keep the production up. Fields will be overproduced. At the end of that period some major event, an invasion, pandemic, depression, etc. will hit and not cause, but herald, a reasonable steep decline (~8%) as things stop working, systems break down and serious insurrection strikes.
I think national and international entities are planning for such behaviour (SA, US, Europe) and are just about at the stage of taking the covers off their game plays for the transition period.
As the curse goes: may you live in interesting times.
Davidyson:
That depends on whether the gas-oil-water separation plant has a dual use and its original capital cost.
The hydrocarbon stream is mostly an emulsion in formation and as it gets to the surface. But it costs damn little to sepate the oil, gas and water. Gas bubbles out of oil when the pressure drops at the surface and oil floats on top of water. Mostly its just done with a storage tank, and sometimes a heater treater and some chemical to break the emulsion. And since the storage tanks can be used for a little hoarding, a dual purpose, too big for the wells that the tanks serve doesn't cost much money.
Seperators work either by heating the emulsion so the water drops to the bottom or by adding an emulsion breaker chemica. An engineer around here can tell us the cost, but its not too much. The casing head gas that bubbles out of the emulsion is used for fuel for heating the oil on a lot of wells. Other than that use or as fuel for pumping units, the gas has to be compressed again to put in a pipeline. Overseas, where it can't be monitored by governments with an idea as to its value, the gas is flared (burned as waste).
At any rate, all of this is cheap and off-the-shelf equipment that is portable on trucks. The real limitation on continuing to produce wells with a high water cut is the high per well overhead of major oil companies. I'm sure that companies like BP or even Talisman add on a factor to each well that amounts to a cost like this-something like $1,000 dollars a month per well to operate a well, and maybe $20,000 a month for the lower limit of a field. The real constraint is inengineers and oilfield workers-a person can only look after so many wells at once, and the labor cost always grows as the production gets worse. Older equipment breaks down more often, and requires more frquent workovers. The main reason it drops off so radicially offshore is that workovers cost 10 times as much or more than onshore workovers, and the more the workover costs the more oil the well has to make to be profitable.
I don't know that I've explained this very well, so let me give an example. Suppose you have a well that has a potential of 1,000 barrels a day brand spanking new. In two or three years it starts making a significant water cut, maybe 50%. The well is still worth producing, its making 500 barrels of oil and 500 barrels of water, so a million dollar offshore workover pays back quickly, plus the operator has 30 or 40 wells in the same field sharing the overhead.
After 7 years, the well needs another $1million workover, but the water cut has gone to 70% and the production declined to 300 bbls a day because of the high water cut. After another year the well needs new flow lines and tanks, while the oil cut has declined to 10% or 100 bbls a day plus it needs another million dollar workover. It becomes clear that the operator isn't going to get its money back and the operator plugs the well and salvages the equipment. And thats the reason offshore wells have a big production decline at the end of the well life.
Meanwhile, onshore the same workover costs maybe $50 K as opposed to $1 million offshore. The wells can still be profitable producing a 2% water cut on 1,000 barrels a day worth of fluid, so the wells are produced virtually forever.
Its all about overhead and being a low cost operator. Bob Ebersole
Bob, thanks for the clarification in respect to GOSPs.
I meant the GOSP just as an example for a piece of bottleneck infrastructure - pick any other with high capital cost and specific use only to illustrate the point better: pipelines, refineries, tankers, whatever...
Cheers,
Daniel
THANK YOU, Rembrandt, for making the essay understandable to non-technical people:
Altogether an excellent model for a technical article.
Bart / Energy Bulletin
Thanks Bart for your positive comment!
I heartily agree with Bart, very well done.
I would also add that I'm very pleased to see the discussion presented as a range of possible scenarios. I personally feel that far too much of the peak-oil debate is preoccupied with making specific predictions which to my mind is generally not all that useful.
It's far too easy to dismiss a specific prediction as being either too optimistic or pessimistic, whereas a range of possible scenarios is more likely to lead to a much more useful discussion about WHY some scenarios are more likely than others, such as the excellent discussion we now see here.
Even Hubbert gave a low and high estimate for world URR. I would encourage everyone to follow this example, set aside the preoccupation with specific predictions, and move the debate to a more useful discussion about how to plan for a range of possible scenarios.
Cheers,
Jerry
The problem is it seems everyone is high even HL is probably underestimating future decline rates.
If we don't have a good lower bound then ?
So far contemplating the possible lower bound i.e HL corrected for offshore vs onshore production gives a lower bound estimate well below current predictions. This means in my opinion some of the proposed productions scenarios are simply wrong and should be discounted.
This means that current HL predictions should be used as the high estimate. The shock model could provide lower bounds.
In effect most of the bottom up approaches can readily be discounted with the single exception of Bakarahti.
Rembrandt - congratulations on a great post - which I've not read in detail yet - but your approach looks very sound.
Above is a chart I produced from Skrebowski's latest update which I think agrees pretty closely with your figure 3.
It is right to add in new discoveries - though debatable whether they may start to come as early as 2010. This, however, may get cancelled by discoverred undeveloped resources being scheduled - that are not yet on your data base.
Its also intersting to play around with decline rates. Lots to discuss in December!
Euan
The question is, 'is this chart a reasonable prediction of the future'? It would be helpful in answering this question to consider Chris past estimates in conjunction with his most recent ones. For example, he expected a substantial increase in 06, not shown in the above and which did not occur, in addition to a substantial increase in 07, shown above, and which also did not occur, or at least not yet. On what basis should we expect a substantial increase in 08? Would it not be better to first try to see why predictions have been a bit too optimistic?
As Khebab asked up thread, why aren't there studies of decline rates that factor in recent actual production vs production predicted, and predicted new oil vs the amount of new oil that actually appeared? In the absence of such studies a logical assumption is that world wide decline rate is higher than punters are using in their models, say 5.5% rather than 4.5%, and soaking up nearly 1Mb/d/y of predicted new supply... and, if so, the likely situation is that decline rate is accelerating, certainly an ominous situation.
Furthermore, Gail points out that had Katrina not occurred peak all liquids would have been in 05, not 06, meaning that we are that much further on a plateau that is trending down, not up.
JK - I have history matched Chris's forecasts for the past 3 years - there's an interesting story - but want to give him the chance to repsond to my queries first.
Remember the past = demand and the future = capacity. How do you know the new projects did not materialise? My view is that most probably did, and Saudi cut production to make way for the new capacity.
Hope he responds, I respect his work and efforts, just think he is low on decline rate, plus maybe projects are running late... should be possible to sort out these effects, if they are real, and come up with more accurate predictions.
Regarding past/demand/future/capacity - IMO the evidence strongly suggests everybody is flat out, whereas you hold to the hope that SA with excess capacity is holding off production, presumably to firm prices. This action, hoarding for the future, is in fact predicted by some at TOD. Of course, such an activity makes more sense if a country is running out, but SA claims they have hundreds of billions of barrels not even found yet... in this case they would seem to be less likely to cut output to accommodate full production by others... SA does, in fact, need enormous cash flow, was negative until just a few years ago.
You are of course free to posit that SA has growing excess capacity while I remain free to think they are, at the moment, pumping every barrel possible. Price is, after all, 84, and they continue, as usual, to claim price is too high... why not believe this to be a true refrlection of their view? If their capacity is really 9.6Mb/d, why are they not pumping at this rate to benefit from the high price? Note too that their cuts have been made in shipments to asia, not the US/Europe, and Tapis price was in the 80's throughout the summer (86 now), implying to me that they have not had enough oil to meet past committments at any price. IMO you are carefully selecting which of their statements to believe. I do expect them to produce more soon, but this will be a project announced a couple of years ago and will only temporarily arrest their decline.
What evidence do you refer to?
Non-OPEC production is at its highest rate ever. Oil production in the first half of this year was higher and oil prices lower than the same time last year, thanks in large part to a large drop in demand due to the warm winter. It wasn't until OPEC cut its quotas substantially that that situation changed.
Essentially, you're saying that OPEC's cuts were involuntary, despite the obvious reasons for them to make voluntary cuts (i.e., higher production and lower demand leading to lower prices), and despite their stated intent to increase production in a couple weeks.
Occam's Razor says that their stated reasons for cutting quotas are probably more-or-less correct, and that spare capacity exists.
What decline? Saudi production has been rock-steady all year.
Looking at just this year you are standing too close to the forest. Looking back a bit, world production jul thru oct 06 was 800k/d (1%) higher than 1H06, and just when (fall) demand was due to dip; the 100Mb excess production went into storage, forcing prices down into 1Q07. Perhaps a warm winter also contributed to lower prices.
During the 06 runup in price, which peaked in aug but remained relatively high for a while, SA steadily cut production. By oct, the month of the meeting that preceeded the agreed 'cuts', they were down to 8.8M/d, or 8% below the 05 avg. Does Occam provide guidance for the most likely explanation?
a) there were no buyers for their oil (surging angola had no such difficulty finding buyers for their new production), which is what they said.
b) they foresaw better than the bulls running on wall street that all liquids would surge in late summer/early fall.
c) they had no use for the money.
d) the cuts were involuntary.
As an aside, it is more accurate to say 'SA cuts' than 'OPEC' cuts. SA, with 30% of OPEC production, heroically made 80% of the cuts.
Coming to this year they have, as you said, been rock solid at 8.6M/d (cutting contracted shipments to asia and driving Tapis price above nymex for most of this year). One might think the unchanging output is a sign of a bit of excess capacity, but if the drop to 8.8 was involuntary, it wouldn't be much. IMO they are pretty close to their max until the new project comes on line... by coincidence, they are talking of increased quotas (but only 30% of the 1.7M cuts in spite of peak price and falling inventories), mostly to be produced by SA, just as the new project is due to start. Maybe we will see 9M/d for a bit...
"IMO the evidence strongly suggests everybody is flat out"
"What evidence do you refer to?
Non-OPEC production is at its highest rate ever. "
QED
Producers, both those in and out of cartels, routinely produce at max when price is high. Generally, only cartels, or a swing producer, sometimes cut when price is low. Price was 'low' end 06/early 07, providing ample explanation for a cut... but, first, even 50 is satisfactory for many, and this explains why few OPEC producers actually cut production; tokens from sa persian gulf friends, the bulk by SA. Second, I see sufficient evidence that SA 06 cuts were involuntary, at least down to 8.8/d.
Sigh.
I've been through this before, and every single production cut by Saudi Arabia in the last two years makes sense when you look at what's going on with the weekly price level for OPEC oil. All of the cuts were when prices were sliding, with the exception of (IIRC) March 2005, but - since prices underwent a substantial fall immediately after that cut - it seems more like foresight than geology.
Let's look at this another way: how about you find me an instance in the last two years where Saudi Arabia substantially cut its production while the price of Saudi oil had a sustained rise both before and after that cut. Give me an example of Saudi Arabia cutting production in the middle of a sustained price increase.
When I looked, I was unable to find a single example of that in the last two years. I expected to find one, since everyone here talks about it, but it just isn't there.
Yes:
e) The price of OPEC oil had fallen 20% by late September.
Pretty obvious, really.
What is that supposed to tell us about OPEC? Other than giving it a strong reason to not be producing flat out?
Apparently not for OPEC, since they cut their quotas.
If they know the world can handle $60-70 oil, why settle for $50, much less risk a steeper drop? The catastrophic days of the late 90s aren't all that long ago, and it's almost certain OPEC remembers them well.
The idea that sa prices were falling while world oil was rising is a new idea for me. After a cursory look I extracted 2006 data from the T71 chart linked below
http://www.opec.org/library/Annual%20Statistical%20Bulletin/interactive/...
and compared these SA prices with SA EIA production data, as shown below:
2006
Jan 9,400 58.43
Feb 9,500 56.56
Mar 9,350 57.54
Apr 9,350 63.85
May 9,200 64.83
Jun 9,100 65.03
Jul 9,300 69.06
Aug 9,300 68.76
Sep 9,000 59.72
Oct 8,800 55.65
Nov 8,800 55.53
Dec 8,750 57.70
As can be seen, sa production fell quite steadily (from feb) through sep, with prices rising every month until sep... I assume that sep production, to the extent it was voluntary at all, was reacting to aug price, virtually the same as Jul. Perhaps output in oct was in response to falling price, perhaps not; production has been close to this value since. My reading is some field watered out over the period, leaving them with say 8.8M max capacity, probably declining slowly to now.
I fail to see any support for the idea that SA reduced production on account of falling price during the period... and in any event, their past history does not show much reaction to modest price changes. SA 2005 and 2007 production show a completely different pattern from 2006, IMO bolstering the idea that the 2006 decline was involuntary.
Which prices are you looking at? None of those numbers appear in the prices table available from your link.
Here is the EIA's data on weekly oil prices, and here is the Feb-Mar average for the three grades of Saudi oil:
Feb 03, 2006 $56.94
Feb 10, 2006 $53.75
Feb 17, 2006 $50.92
Feb 24, 2006 $52.06
Mar 03, 2006 $54.29
Mar 10, 2006 $54.18
Mar 17, 2006 $54.45
Mar 24, 2006 $54.74
Mar 31, 2006 $56.72
You will notice that the price was falling in February, and then stabilized in March. Perhaps that has something to do with the 150kb/d production cut between those two months?
Let's look at the AprilMay production cut:
Apr 07, 2006 $58.71
Apr 14, 2006 $60.37
Apr 21, 2006 $64.10
Apr 28, 2006 $64.73
May 05, 2006 $64.03
May 12, 2006 $62.83
May 19, 2006 $61.50
May 26, 2006 $60.83
Prices fell in May, despite the 150kb/d production cut. Now the May/June production cut:
May 05, 2006 $64.03
May 12, 2006 $62.83
May 19, 2006 $61.50
May 26, 2006 $60.83
Jun 02, 2006 $61.01
Jun 09, 2006 $60.67
Jun 16, 2006 $58.88
Jun 23, 2006 $59.02
Jun 30, 2006 $61.48
Prices were falling, but stabilized after the 100kb/d production cut. In fact, prices then went on to rise:
Jun 02, 2006 $61.01
Jun 09, 2006 $60.67
Jun 16, 2006 $58.88
Jun 23, 2006 $59.02
Jun 30, 2006 $61.48
Jul 07, 2006 $64.36
Jul 14, 2006 $65.04
Jul 21, 2006 $66.66
Jul 28, 2006 $65.09
And so did Saudi production, by 200kb/d. The next quota change came between August and September:
Aug 04, 2006 $66.37
Aug 11, 2006 $68.21
Aug 18, 2006 $64.78
Aug 25, 2006 $63.74
Sep 01, 2006 $62.59
Sep 08, 2006 $59.79
Sep 15, 2006 $55.90
Sep 22, 2006 $54.25
Sep 29, 2006 $52.68
The price of Saudi oil was crashing; that might help explain the 300kb/d production cut. The price kept falling through September, prompting another 200kb/d production cut. What were the results?
Sep 01, 2006 $62.59
Sep 08, 2006 $59.79
Sep 15, 2006 $55.90
Sep 22, 2006 $54.25
Sep 29, 2006 $52.68
Oct 06, 2006 $52.23
Oct 13, 2006 $51.59
Oct 20, 2006 $52.30
Oct 27, 2006 $52.25
The price stabilized after that second cut. For the rest of the year the price stayed stable, as did Saudi production, with the exception of a small production cut in December. Let's see what happened around that time of the year:
Dec 01, 2006 $54.27
Dec 08, 2006 $56.35
Dec 15, 2006 $55.01
Dec 22, 2006 $55.62
Dec 29, 2006 $54.34
Jan 05, 2007 $51.61
Jan 12, 2007 $46.91
Jan 19, 2007 $44.76
Jan 26, 2007 $46.36
Production fell as price was falling? Who'd have thought.
Please, by all means download the EIA data and confirm my numbers for yourself. I've simply averaged these three columns of the spreadsheet:
Saudi Arabia Saudi Heavy Spot Price FOB (Dollars per Barrel)
Saudi Arabia Saudi Light Spot Price FOB (Dollars per Barrel)
Saudi Arabia Arab Medium Spot Price FOB (Dollars per Barrel)
The weekly price data explains every one of Saudi Arabia's recent production changes.
Don't understand your difficulty in extracting the values I did from the link I posted. No matter.
Using your numbers, SA produced 9.5Mb/d in feb when price was mid fifties. In aug/sep, price ranged from upper sixties to upper fifties. I agree that sep price was declining, but still above feb and, anyway, a decision to cut based on lower sep prices would not have been effected until oct at the earliest. So, production down 700k/d (7%) while prices are up ~15%, coupled by statements that A) they have no buyers and b) price is too high, is sufficient evidence to me that, in the period feb-sep, they produced every barrel possible. This takes them down to 8.8 following which, this year, they have, as you said, been rock solid at a lower number, 8.6. I see no evidence of any ability to priduce even at 8.8, tho, unlike ace, I do expect them to be back up to 9.0 as the new project begins production.
I further expect this value to hold thru 1Q08 before declining slowly again. Will this be what happens? Probably not, the future will be somewhat different. Nevertheless, I will be surprised to see them ever get back to 9.5 for an extended period.
Regarding your thought that they somehow adjust production mid month in response to price that month, there is little evidence that they ever adjust much on account of price fluctuation. Certainly, if they could produce more, as you seem to think, it is hard to see why they are not producing more over the past few months... OPEC is certainly no barrier to SA producing whatever they want, and if they saw a need to work within OPEC it is a simple matter to call a meeting on account of 'helping the west' with unacceptably high prices. Note too that tapis has been higher than nymex for most of this year. Why didn't they take advantage of this high price and meet their contract numbers?
Might as well just wait and see what happens over the next year.
Based on what do you say that?
Take a look at the Sept05 production. Saudi Arabia promised to pump more oil after Katrina, and did so for the first two weeks of Sept. Nobody wanted their oil, though - the price of Saudi oil fell to pre-hurricane levels by the third week, and so did production.
Why would it take more than a few days for a swing producer to lower production?
Moreover, in 2006 the price had been falling since mid-August, so there was plenty of time for Aramco to realize that and decide to cut production.
Why do you suggest Aramco would be basing their production decisions on the price from half a year before as opposed to the current price movements? Do you suggest they wait to deal with crashing prices until after the price has fallen to start-of-year levels?
Perhaps you and I would prefer that, but I don't see why that'd be the obvious choice for Saudi Arabia.
Nor is there any evidence that they can't, and yet you seem remarkably confident of that.
Uhhh... They adjusted production 7 times in 2006, and each one was exactly the direction you would expect based on the behaviour of oil prices in the 4 weeks immediately preceeding and following. If you don't consider that to be evidence that they adjust production based on prices, what would you accept as evidence? Or is anything enough to convince you that that's a possibility?
That you personally would manage the resource differently is not particularly compelling evidence that Saudi Arabia is lying.
One obvious reason for them not to increase production is that consumer stocks were very high, and Saudi Arabia didn't want a repeat of the price crash last fall. If they believed prices were rising in September due to speculation rather than short supply - and a number of analysts did appear to believe that, so it's not impossible the Saudis did, too - then they may have believed that dumping a bunch more production on the market would have led to exactly the price crash they were hoping to avoid.
It is kind of surprising that they're willing to let the screws tighten this much, although we'll see in a few months whether October production went up at all. I suppose it's possible that Saudi Arabia is trying to bolster OPEC's discipline by adhering tightly to its own quota, though.
How exactly does the price paid for Malaysian crude tell us about the price Saudi Arabia can get for their oil? We have weekly price data for Saudi Light, Medium, and Heavy oil; it's not clear that whatever a benchmark based on Malaysian oil is doing is relevant.
Not with a Whimper, rather with a Bubble
All the decline predictions seem to take it as a given that consumer demand for oil will continue unabated and that price will continue to climb (forever) to support commercial extraction ventures that use techniques of ever increasing expense and technological complexity.
But what if the consumers simply quit?
What if they vote in political parties that are anti-oil and anti-Global Warming? What if they can no longer afford cars and gasoline because they don't have "jobs"? (IOW, a second Great Depression.) Then all the demand-side assumptions go down the drain with the giant burp of a bursting bubble.
We have seen collapsing bubble behavior in past markets:
The Tulip bubble.
The dot.com bubble.
The subprime mortgage/ housing bubble.
Good point!
I remember someone over at the peakoil.com forums projecting a series of crashes with lots of demand destruction and subsequent recovery to an ever lower level "local" peak, until people become aware that there is a ceiling to recovery.
I think this is a much more realistic assumption than that of a smooth decline.
Cheers,
Davidyson
Good paper, Rembrandt!
In my view, there may be a bit too much emphasis on when precisely the peak in oil production occurs.
We are primarily interested in peak production, because this moment largely coincides with the moment when supply can no longer keep up with demand, and that is the moment when the oil price must experience a knee, i.e., when the price increase will no longer be compensated by inflationary trends.
Yet, the two points: peak production and lack of supply do not coincide completely, because the demand keeps growing (especially due to China and India). For this reason, oil supply will no longer be able to keep up with demand a few years before peak production occurs.
This effect is actually beneficial, as it will grant the industrialized world a little extra time in adjusting to the inevitable decline that will follow. The effect is similar to extending the plateau for a little while longer.
Ray Leonard (Strahan interview) said that he expects 250 billion barrels in new discoveries. Because reserves growth has yielded 2 barrels developed for each one found, he expects a net of 500 billion barrels from oil not yet discovered.
Your article seems to assume that there will be zero reserves growth from 1) the existing resource base and 2) discovered oil not yet put on-stream which has not been booked as reserves.
I'm not saying that we should have big expectations here. I am merely pointing this out for accuracy.
Also, my own examination of Skrebowski's data shows that his project schedule requires major revisions. I am engaged in doing that now.
Good article, best --
My problem with reserve growth is that I'm not convinced it really matters in terms of flow rates and peak production. If you look at the US reserve growth (Lower 48) which is the poster child for reserve growth, the growth is just mind-boggling: +26 Gb in reserve addition between 1977 and 2005 or +20% of the total amount of discovery in 1977:
However, despite these record numbers, it did not change the production peak position or influenced the decline rate (currently around 4%/year)!
Oh, I agree. Reserves growth will not affect the peak much. We're talking about longer term reserves projections here.
I've only said this about a million times on this website and elsewhere.
Reserve growth has to be considered carefully. The USGS 2000 report based there total world reserve growth projection on USA history, going back a century. Three problems:
1)reserve growth from old technology was high because there was no good way of estimating reserves, and oil companies were motivated to keep some in there pocket to be announced later to keep shareholders happy. Reserve growth from recent technology which provides much better original estimates, and from empty pockets is much lower.
2)USA reserves are 90% probability (1P) by SEC requirement, so reserves grow over time to what an original 50% probability (2P) would have been. With modern technology and smaller fields the gap between original 1P and 2P estimates shrinks - a lot. See Alaska.
Example: Prudhoe Bay had “proven” P90 reserves of 9 Gb and P50 reserves of 12.5 Gb in 1977. Production peaked in 1988 and by 1997 “known” oil could be confidently projected as 12- 12.5 Gb. Secondary recovery (infill drilling and re-pressurization) had been extensively applied so expected growth was already zero. The USGS factor would have estimated growth of 45 Gb vs an actual of less than 3.5 Gb or more than 12 times too high. (If the initial P50 reserves estimate had been used, real growth would probably be slightly negative). Prudhoe Bay is a large young field. Imagine the error multiple on a small young field outside the USA reporting an initial P50 estimate.
World outside of USA announced reserves are mosty 2P to start with, although Campbell points out that FSU "reserves" were often 3P.
3)All of the reasonably expectable reserve growth from most fields has already occurred. Applying new technology to old fields to increase % of OOP recovered might increase reserves, but as othres have pointed out, the recovery rates will be so low that the impact on decline rate will be negligible.
Projecting future reserve growth from any history more than about 2 decades back and from USA SEC requirement is certain to give an overestimation. Do good recent numbers exist to work with starting with 2P estimates? My guess is that the reserve growth estimate of 500 GB can be reduced by at least factor 10. Murray
Oops! Problem 4) Between the big OPEC reserve increases and the producers that have kept reserves close to constant in spite of production for close to 2 decades, it is likely that presently quoted reserves are overstated. Rembrandt, what happens to your peak timing if you apply a correction factor of say 100 Gb to presently stated reserves?
Or maybe 500Gb ?
Dave,
In the slow decline rate scenario there is an assumption of 500 billion barrels of reserve growth (whether this comes from the existing resource base or discovered oil not yet on stream is something that I haven't divided).
In the high decline rate scenario there is no reserve growth indeed.
This is a link to a 2005 study at Stanford comparing production predictions (primarily EIA, IEA, and OGJ) over the previous 30 years with actual production. The study's conclusion is that for the first decade, the predictions have had an accuracy within about 6% which is far better than I had anticipated (the study does not take into account CERA's predictions which probably would have significantly skewed the results).
http://srb.stanford.edu/nur/GP200A%20Papers/vermylen_paper.pdf
The chart on production vs. predictions is crowded but interesting. Maybe someone here who has computer skills (which I do not so hopefully the link itself will work) can actually put the chart on a post.
Obviously, it would have been nice to see these predictions extended past 2005. Now that would be more revealing, as we know were the data heads.
It would be nice to see extended projections but from memory they mostly just continue existing trajectories. The chart is anyway useful in explaining the optimistic projections; punters just look at how production increased in the past and assume it will continue in line... well, after all, such an assumption would have been pretty good for a generation, pretty tough to predict/acknowldege abrupt changes after such a long run.
All but 4 out of 37 are simply near projections of the current trend, so they will tend to be good until there is an inflection point. Meaningless analysis in this context. Rembrandt and TOD are looking for the inflection point Murray
The idea that the decline will be gradual simply defies logic. Exporting nations will not be anxious to share their oil with other nations. They will be looking out for number one. It is highly likely also that there will be resource wars.
Small nations with lots of oil could be invaded by much larger nations with no oil. Nations with oil with oil will see the oil as their bounty but larger nations with no oil will see the oil as the earth’s bounty and they will demand their fair share of it.
Hungry and desperate people will turn more and more to terrorism. More refineries, oil wells and pipelines will be attacked.
Imagining a slow and gradual decline while we adapt to less oil in a peaceful way is just another form of denial.
Ron Patterson
Tell it Ron.
The rosy picture of the future where everybody stands in line(on Line or On Queue if you prefer) and wringing their hands saying "I hope there's enough for me when I get to the head of the line" will NOT happen, IS NOT happening.
The slide we have seen in the last 7 years towards "PreEmptive Involvement" if you will, WILL speed up.
Whether the Tail of Production is "Fat, or Skinny" will be a moot point. As Kunstler has said, "There will be MANY glasses knocked over, by people scrambling, fist fighting each other, trying to get the last amount".
You hit it Ron.
"The revolution will NOT be televised" because the TV will be OFF and the Broadcasting station closed.
Going up Hubbert's Peak, geology has ruled,
Coming down, Human Nature WILL rule.
Speaking as a Canadian, that's certainly way up there on my list of worries.
"You want to do WHAT? Abrogate NAFTA? I don't think so, my little snowbound friend. Let me introduce you to my good buddy Mr. M1 Abrams. Of course you'll be getting to know him very well, so you can just call him 'M1'. Now out of the way, he and all his chums are heading to Fort McMurray."
Ron: To a certain extent you are correct, but you are dramatically overstating your case. As an example, the USA will likely still the the preeminent economic power on the planet if "all nations looked out for number one". The fact is, most nations do not look out for "number one", if by "number one" you mean the economic strength and future of the nation itself. Most nations are controlled by guys like Marcos, Cheney, KSA royals, etc. and their idea of "looking out for number one" doesn't match yours at all.
Well, Khebab and I are going to present a different point of view in Houston next week. I just e-mailed off the final version of the Powerpoint slides to the ASPO-USA guys. As I told the ASPO guys, this was a 90%/10% joint venture, with Khebab doing 90% of the work (and in possession of the majority of the IQ in the partnership).
In my humble opinion, Khebab has done some outstanding work.
You know, it's not often that you deliver a paper and hope like hell that the projections are wrong. Unfortunately, I don't think that they are.
BTW, I had some discussions with a Wall Street correspondent this morning. He said that they physical market is looking increasingly tight going forward. Lots and lots of buyers scrambling for light, sweet crude.
If I had money to blow...I would be investing like mad right now in companies that specialize in heavy crude processing/refining.
Oil sands... even though it may be a false hope, people will be desperate. In fact, the fields are close enough to the US border, there might be some "Abrams" action as previously suggested.
for right now, have a look at mcdep.com - they talk about royalty trusts for oil sands, coal bed methane, NGL, etc.
fyi, I don't have any business relationship with Kurt Wolff or his company, mcdep.com
Why most of you are blaming insufficient production for troubles with peak oil? Nearly no one say "We made the problem".
You are still speculating how much oil is in Ghawar and how much are Saudis cheating with their oil reserves. Stop to use your guzzling loved car and go by bicycle to work instead of by car.
Decreasing of oil consumption in US by half would help at least for some time. And it should not hurt so much. Just don't be so selfish.
Do not ask what world can do for you but ask what you can do for world.
I remind you that this is "The Oil Drum: Europe".
Great post Rembrandt!
My take on this now is that optimistic, real-world, above-ground factors - geopolitical interruptions but no big US-Iran or similar conflict, infrastructure & personnel constraints, accidents and storm damage - will hopefully flatten out the peak to a longish plateau. If things unfold that way, it'll give us a bit more time to prepare, adjust and educate, as it'll be harder to deny that there is a problem, if we have several years of level plateau behind us (as distinct from "upslope plateau"). :)
This is only a 2.5% decline per year! OK, let's say we peak at 90 mbpd in 2012 and decline to 50 mbpd in 2030. That's a 44% decline in 18 years, or 2.5% (2.25 mbpd) per year on average. I think we can handle that kind of decline rate. (Note: this would be 3.5% compounded)
Then of course, there is the net export question. . .
yes, looks like we're going to have to learn to share :)
http://digg.com/business_finance/The_Shape_of_Oil_to_Come
at 13 diggs and rising!
I must agree with step back's posting a bit above, economics are a key point here.
How can any prediction of oil production be made without knowledge of future economic conditions?
Perhaps I'm missing something here, but I see no consideration in these calculations for macro-economic changes in demand for petroleum products. I assume what we are seeing here is a description of a maximum possible production type of scenario and a world economy that will continue business as usual.
It seems current events would lead one to suspect business is not going to continue as usual. Needless to say, a world-wide severe recession or depression in the next few years would impact production in unforeseeable and significant ways. Due to the interaction of countless factors and greatly reduced demand, I can see the projected production curves being extended out over time to a considerable degree. However, in a possibly chaotic world that is less able to consume and produce, we may or may not have the ability to use this valuable time to make the necessary adjustments to alternative energy sources before the ultimate collapse of the Oil Age begins.
My crystal ball says that for economic reasons all of these projections will need to be stretched a bit further into the future.
I have the same problem with predicting future production from new projects. Some models just add them as if they were a given. How many new projects have been delayed or somehow not lived up to their initial estimates in recent years? New projects that were designed five years ago may show very different dynamics if revisited in detail this year.
I look at all new projects reaching their initially-proposed and their ideal fruition with a skeptical eye.
The very broad overview of potential production given above of course cannot cover all of the potentially significant factors -
Beside the probability of geoeconomic turmoil as global capitalism enters recession
(with the knowledge that PO (energy denial) and GW (insurance denial) both preclude any normal recovery of investor confidence]
which would hinder the vital development & deployment of non-fossil options,
there is also a further major obstacle that may be worth noting.
Namely effects of the growing number of extreme weather events.
For instance, following the damage to Thunderhorse in GOM, a series of repair dates have now slipped to the end of 2008,
and the main owner, BP, is pulling out of all GOM operations bar this and one other mega-platform.
So how soon will weather costs, whether direct or via insurance, make the GOM somewhere the industry as a whole would rather avoid ?
Personally I doubt that any reliable prediction of future oil supply can be formed as I am already seeing cascade effects of cock-ups, cocked-up conspiracies, and their compounding consequences leading to absurdly unpredictable outcomes.
For instance, a tree-damaged drainpipe at a disease research lab,
an unprecedented rainfall event,
and Britain's mountain sheepfarmers lose half their year's sales income via markets' untimely banning for a Foot & Mouth outbreak --
Just how likely (predictable) was that outcome ?
And we are only at the start of the steepening of the curves of the key problems' intensification.
Regards,
Backstop
Dragonfly41,
Its generally a pretty good idea to look at the future projections with a jaundiced eye. The deepwater Gulf of Mexico production is running years behind already because they require the operator to comission and adopt cutting edge technology just to produce. All the seabed work is going to be done with robotics because no human can get under a mile of water and 10,000 Lbs/PSI pressures. The latest snag at Thunderhorse was the pressure changed the metalurgy of the sub-sea equipment and the hydrogen made the steel brittle, so all the christmas trees, ect are being replaced.
And the Devon/Chevron Jack discovery is in water that is about 1/3rd deeper than Thunderhorse. Its not clear how high oil prices need to be to make the project economic. They've not elected to complete the wells yet, and Devon I think is planning another appraisal well at a well cost of $100 million dollars.Bob Ebersole
Assuming 86.13 mbpd is the world peak, how long will it be until we know for sure?
The world is not the United States or the West, and our business models cannot directly translate. I would suspect
that in the world of oil and production there are similar or greater differences.
I doubt the world exporting countries will follow the US Texas model of adding to reserve capacity even if they technically can.
The topic is certainly a valid one: just when will oil production peak and at what level? However, it is much less important than the question: are our current societies and economies sustainable? I think this kind of article often includes the implicit assumption that the answer to the second question is "yes". This is highlighted by the phrase in the opening section of this article:
Later on, we find:
The clear assertion is that there are alternatives to be found that could enable society to continue as normal, or at least the paradigm of continuous economic growth to continue indefinitely (if production follows a fortuitous curve, of course).
Such assertions and assumptions are, I think, unhelpful for dealing with the crisis we're facing.
alternatives don't have the return on investment of light sweet crude. Canadian tar sands is something compeatly different. Conoco Philips is selling chicken fat as biodiesel. http://www.changingworldtech.com/ is making bio-diesel from turkey guts. Conoco Philips and ADM are talking next generation bio-fuel. I should stop here.
Global resource corporation hawk-10 microwave oven will produce very dirty oil from plastic waste using as much energy as you can get from the oil. my idea was grow vegetation extract oil from it producing charcoal for which you get carbon credits if you find a way to not burn it.
Gary C. Evans, CEO of Dallas-based GreenHunter Energy
is buying wind generators from china. China and canada are buying wind generators from The United States.
American Superconductor.