| This Week in Petroleum 10-31-07 | The Oil Drum | Are We in a Speculative Bubble with Regard to Oil Prices? |
A Few Charts of the US Crude Oil Supply and Stocks Situation
Posted by Sam Foucher on October 31, 2007 - 3:28pm
Notes:
- For some figures (Fig. 1, 2 and 3), the year-to-year increase is adjusted assuming a linear trend (see Are Prices Affecting the Gasoline Consumption in the US? for details).
- data points are interpolated for missing days.
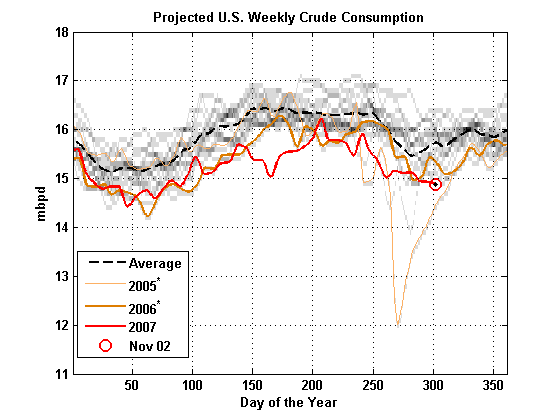
Fig 1. Crude oil input to refineries: The gray level image in the background is the observed seasonal fluctuations (darker areas mean more frequent values). The red curve is the observed data for 2007. The * means that the data for the year 2006 and 2005 have been adjusted to match the yearly consumption for 2007 given by a linear growth model (details here). The dark dotted line is the average fluctuation.
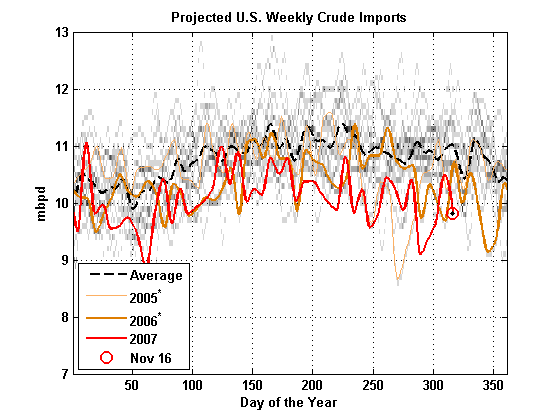
Fig 2. U.S. Crude oil imports: The gray level image in the background is the observed seasonal fluctuations (darker areas mean more frequent values). The red curve is the observed data for 2007. The * means that the data for the year 2006 and 2005 have been adjusted to match the yearly import level for 2007 given by a linear growth model. The dark dotted line is the average fluctuation.
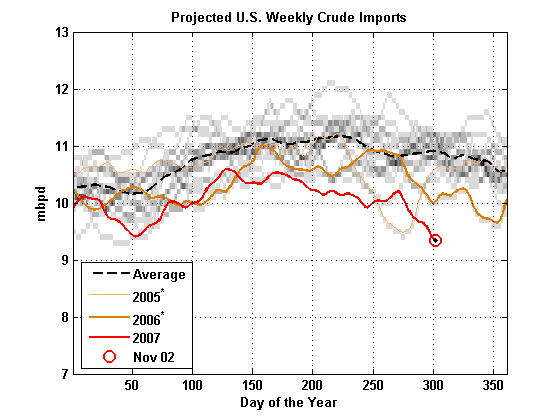
Fig 2b. Same as Fig. 2 but the data has been smoothed with a 4 weeks moving average..
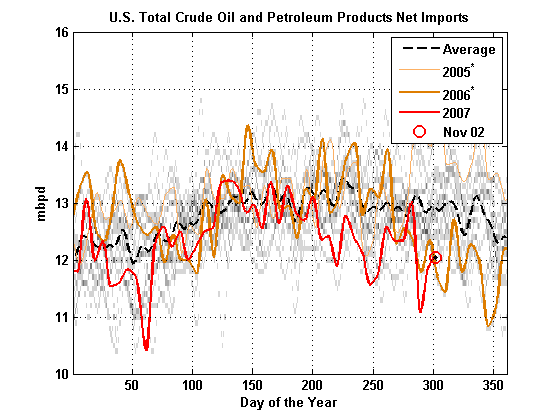
Fig 3. U.S. Total Crude Oil and Petroleum Products Net Imports: The gray level image in the background is the observed seasonal fluctuations (darker areas mean more frequent values). The red curve is the observed data for 2007. The * means that the data for the year 2006 and 2005 have been adjusted to match the yearly import level for 2007 given by a linear growth model. The dark dotted line is the average fluctuation..
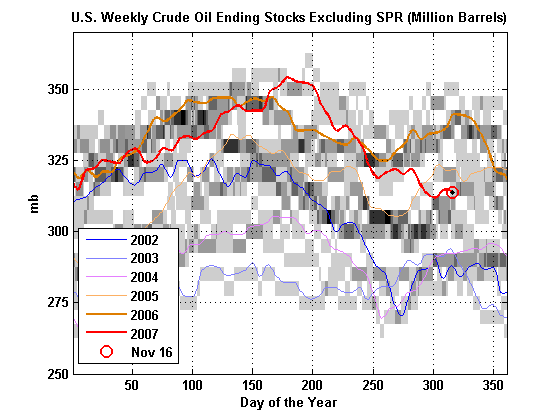
Fig 4. Observed crude oil stock levels (NDFC): the shaded gray values are the observed distribution of NDFC values for each day of the year from all the available years (1991 to 2006) (dark means high probability, white means low probability). The lines are for the last 5 years
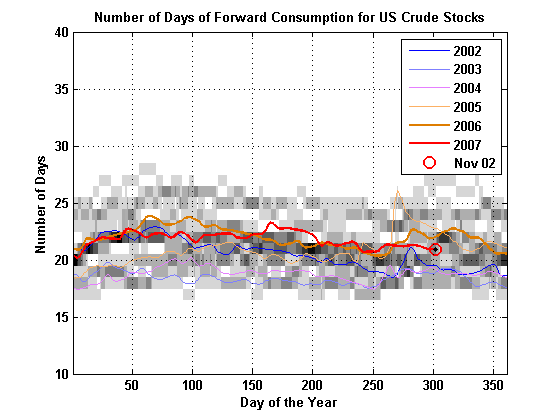
Fig 5. Observed crude oil stock coverage values (NDFC): the shaded gray values are the observed distribution of NDFC values for each day of the year from all the available years (1991 to 2006) (dark means high probability, white means low probability). The lines are for the last 5 years.
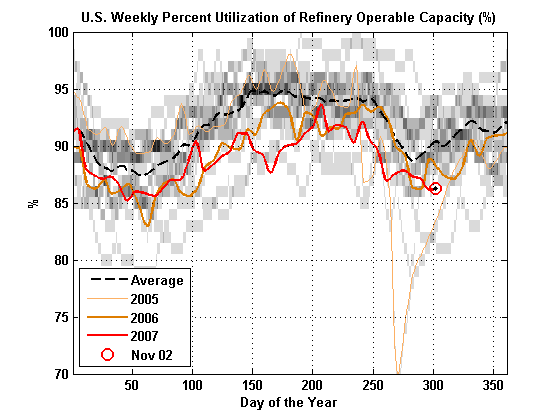
Fig 6. U.S. Weekly Percent Utilization of Refinery Operable Capacity (UROC): the shaded gray values are the observed distribution of the UROC values for each day of the year from all the available years (1991 to 2006) (dark means high probability, white means low probability). The dark dotted line is the average fluctuation.

Fig 7. Cushing, OK WTI Spot Price FOB (Dollars per Barrel) .
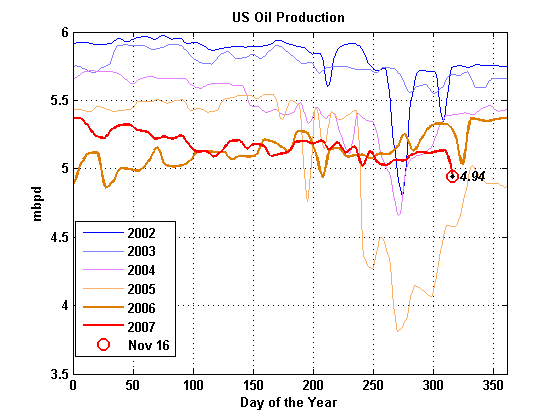
Fig 8. U.S. Weekly Crude Oil Field Production (Million Barrels per Day).
“What people need to hear loud and clear is that we're running out of energy in America.”
—George W. Bush, May 2001
Contact
- Content: editors at theoildrum dot com
- Tech support: support at theoildrum dot com
License

This work is licensed under a Creative Commons Attribution-Share Alike 3.0 United States License.
Great charts, thanks for your effort.
Consumption & imports down, I saw posted that US production is up, not quite as much as imports are down. Can you post a production chart, too?
TIA
I'll try during the day.
I posted this in another thread but I'll repeat since your graphs highlight the situation.
Looking at refinery utilization it seems the US now has excess refining capacity.
This means refiners are starting to face the choice of shutting down some capacity or selling refined products at razor thin margins. This is independent of the price of oil inputs. It seems that we are seeing some capacity shut-in and low margins. At some point the least efficient refineries will have to be shut down.
On the input side crude it makes sense that if your making little money on products but crude is increasing in price you would run a fairly large inventory of crude.
So refiners seem to be idling as much capacity as they can and refining oil at the last possible moment to try and capture the biggest spread between the purchase price of the crude and price of gasoline.
This stalemate ends when refineries are actually shut down and refining capacity meets supply. It seems to me that if we actually ran our refineries at capacity we would see a large crude draw down and even higher crude prices. But from the above the refineries who have a lot of idle refining capacity don't make any money doing that. Right now if they can hold the crude in storage for a few months they gain of the increased price spread vs other refiners who refined to much oil and must pay higher prices.
Looking at refinery utilization it seems the US now has excess refining capacity.
We are still in turnaround season. Typically, October/November are the low utilization months in the fall, and February/March in the spring.
I'm actually talking about the long term trend over the last two years we have been consistently low on refinery utilization vs the five year average.
Next consider that overall oil supply globally has dropped since 2005 and that new refining capacity has been added both globally and via expansions in the US and it seems safe to conclude that we now have excess refining capacity. Thats the simplest interpretation and we seem to have had it consistently for almost two years now. I understand that their has been a lot of work to add capacity for heavier oils but thats a different issues.
If you assume excess refining capacity then it makes sense that refining margins are razor thin even though the price of oil is high. I'm sure it depends on how a refinery is configured but I'd have to guess you cannot profitably run a refinery below say 75% capacity before you simply have to start shutting it down.
So to me the simplest answer for the current situation is not only a US glut in refining capacity but probably a global glut.
I fully agree... and, it will get worse. Heavy sour/vanadium crude will soon be produced and refined in sa to replace light sweet they used to sell, meaning more refineries without more crude, placing further downward pressure on all existing refineries. Least efficient will shut down, second bit of infrastructure no longer needed (tankers are already in excess supply, facing the problem of flat production and higher exporting country consumption = fewer shipments.)
Memmel I think the Refinery Utilization question is one that yields some interesting thoughts on where to invest your portfolio petrodollars. While most of the WS types continue to recco the Integrateds I am leaning more towards the pure producers for the reasons you allude to. An increasing tendency towards over capacity in the refining market. Less oil more international refineries... if Econ 101 plays out we should see lower refinery margins as the rule not what the squeeze over the last couple of years has implied. Tempering that would maybe be the age of the U.S. refinery infrastructure but I think there is better than 50/50 odds that refineries will compete aggressively for the remaining oil thus pressuring their margins and disporportionally benefitting the pure producers over the integrateds.
Hey Robert are you getting nervous yet? Your $100 bet looked solid a couple of months ago now...who the heck knows.
IOC's are running our of oil and/or replacing oil with far away ng, eg xom. I have always preferred small US E&P's, particularly ard and gpor.
I have a different interpretation.
The refineries appear to be breaking far more often since the post Katrina full throttle experiment wore everything out. If the utilization is down because the refinery is down, it doesn't support your conclusion of over capacity. It just means the refinery was down.
Unfortunately, unlike the NRC data, there isn't a site showing current operating levels and outages, so I can't prove my point.
Also, total combined stocks are way down at about 1.1 million barrels a week YOY and this would reaonably explain about a .5 to 1% drop in utilization over the course of the last 12 months. Again, my point is if stocks are down, it doesn't mean there is excess capacity. It just means less capacity was utilized.
I defer to your judgement if my conclusions seem unlikely.
If you look at the graphs I posted I see no indication of this post Katrina full throttle effect. In fact refinery utilization never recovered after Katrina. We have had a excellent post that indicated Katrina probably masked the real peak in oil production. The simpler answer is we peaked in 2005 and refinery utilization has been decreasing since. Katrina just happened to hit during the peak year.
Looking at this.
http://www.petrostrategies.org/Graphs/Gasoline_Pump_Prices.htm
You could not pick out when Katrina happened.
In fact what we see is a obvious pattern that started after peak production in 2005.
It seems a lot of things contributed to Katrina seem to be a myth.
You changed the subject. Your showed a graph of prices. However, your original post was in the context of excess capacity and utilization and that was the basis of my discussion. Your price graph also doesn't support your excess capacity theory either or the price would be down noticeable.
If your chart were to extend into October, it would most certainly not show the usual September swoon in prices. Of course those prices would be even lower than usual if there was excess capacity.
In fact, it's clear to me were not even talking about the same thing. There is no excess capacity. Any oil finding economist could tell you that.
Capacity graphs are below I did not want to repost you see the sharp drop right around Katrina and a rebound. Which is also by coincidence right around when the world peaked. The point of my price graph is the real world runs on oil products not crude oil. We see no indication that Katrina had any lasting effect on gasoline prices. Instead we are seeing a fairly obvious pattern forming post global peak.
Sorry but I knew I had posted the production graph already I did not want to repost.
Don't focus to much on month to month numbers they are not important for Peak oil we have to look at year long trends if possible I hesitate to use even six months of data for any sort of peak oil argument. Seasonal variation in oil usage is quite high so you really have to watch the trends.
Post 2005 we see that refinery utilization stays low prices for gasoline are volatile but high and it seems oil stocks are being gamed as part of hedging strategies. Given the consistent low utilization factors its fairly obvious that if our refineries where operating at capacity then we would have drawn down the oil that was imported over the last two years. In the case we seem to have that refinery utilization is low then its pretty obvious that crude stocks are being managed as part of a complex strategy to extract profits.
The price volatility is a classic symptom of peak. We can expect the the hedging by refiners will eventually fail and prices for crude and gasoline will soon start a large upward swing until we see serious demand destruction and refineries shutdown.
We have in my opinion one more downward swing on crude prices as the US economy falters but this will be irrelevant by next summer and we will move from peak volatility to post peak exponential increase sometime next summer. And it will be relentless until we some some real demand destruction in the more affluent nations. Assuming that crude does a drop down to around 70 a barrel later we will then see it rise from then on out past 150 a barrel and continue to rise close to 200 only when we hit 5 dollars a gallon plus for gasoline and finally get real demand destruction will we see a slowdown.
Read this paper closely.
http://www.cge.uevora.pt/aspo2005/abscom/Abstract_Lisbon_Bardi.pdf
If you look at prices we are now in the post peak volatility period but more chilling is the fact this occurred at 80% depletion which means we probably will only extract another 200GB of oil or six years at our current rate. Obviously the extraction rate will slow over the coming years but at best we probably have 10 years of reasonably high oil extraction rates left. Given all the other factors I'd be surprised if we make it five more years.
Crazyland.
A barrel of crude is 42 gallons.
http://greenyes.grrn.org/2006/10/msg00084.html
"It all depends on where and what the specific refinery is reforming for and
if they are focusing on gasoline.
Here is the average breakdown of refined products for 2000:
source: http://www.classroom-energy.org/teachers/oilfacts.pdf page 3
Product Gallons per Barrel
Gasoline 19.4
Distillate Fuel Oil 9.7
(Includes both home heating oil and diesel fuel)
Kerosene-Type Jet Fuel 4.3
Coke 2.0
Residual Fuel Oil 1.9
(Heavy oils used as fuels in industry, marine
transportation, and for electric power generation)
Liquefied Refinery Gases 1.9
Still Gas 1.8
Asphalt and Road Oil 1.4
Petrochemical Feedstocks 1.1
Lubricants 0.5
Kerosene 0.2
Other 0.4
On 10/2/06, David Biddle wrote:
>
> From:
> http://www.eia.doe.gov/kids/energyfacts/sources/non-renewable/oil.html
>
>
> "One barrel of crude oil, when refined, produces about 20 gallons of
> finished motor gasoline, and 7 gallons of diesel, as well as other petroleum
> products. "
$95 divided y 42 is basically $2.2+.
If all the crude had a wand waved over it as it passed from ground to gas station, turning it into unleaded 87 octane
the wand waver would still not make money.
Add 45 cents in State/Fed taxes.
Gasoline pricing is the last finger in the dike of the American Economy.
Arkansaw of Samuel L Clemens
Although the situation was different we also had a lot of excess refining capacity at the end of the 1970's
Can anyone find some graphs of prices vs refining capacity back into say the 1950's or so to the present ?
I've seen them before on the oil drum.

http://www.petrostrategies.org/Graphs/Refinery_Utilization.htm
In my opinion this shows that refinery utilization has dropped
since katrina.
The crack spread seems to be highly volatile but generally going up over time compared to 2003. This is contrary to the claim that its decreased it has relative to the wild swings we have seen but not vs 2003. So profitability is higher yet utilization is lower.
http://www.petrostrategies.org/Graphs/Cracking_Margins.htm
Dunno how to to interpret this
Gasoline production is volatile but increasing. Notice we are producing more gasoline than ever before but have lower utilization.
And this graph is very interesting.
http://www.petrostrategies.org/Graphs/World_Oil_Supply_and_Demand.htm
My son who is five plays these games where you pick one thing that is not like the others and US refinery utilization stands out. They have a ton of data on this site. But the refinery utilization given all the other numbers are up indicates to me that refineries would not be well supplied if they actually converted the current oil stocks at capacity. I don't know enough to interpret all the data but something is obviously wrong IMHO.
memmel,
I agree that low refinery utilisation should be a canary in the coal mine with regard to observing the effects of diminished crude oil supplies after the peak. Oil tanker utilisation is obscured by the changeover to double-hulls.
The hypothesis that crude oil production has peaked has the observable consequence of lower crude oil refinery utilisation. High refinery utilization is not consistent with a post peak situation, but low refinery utilisation is by itself not proof that the peak has passed, rather just more consistent evidence.
I'm not saying its proof just that we are living right now in a sort of Indian Summer period where refiners are slashing margins to keep refineries operating or they have to shut them down. Soon we will start to see refineries shutdown if they are not economically positioned to compete at the razor thin margins post peak.
The other situation is demand causes prices to increase and refiners again see large profits for a bit and more oil is imported causing higher crude prices. I really don't think we will see this again simply because America cannot afford another round of bidding and I think we will see some very high gasoline import prices soon. So in my opinion the US has already lost the next bidding war to Europe and Asia.
Memmal, economics is not my strong point, so I'm not sure I follow the "razor thin margins" and "may have to shut down" reasoning. This query is not sarcasm.
thinks
I have crude stock now purchased at $80.00. I think the price will be back to $80.00 in late winter/early spring. I don't want to use my $80.00 stock now, and use $95.00 stock in the spring, when prices are lower. Therefore I will refine as little as possible now. However I have to buy some oil on the cash market to keep operating, at high prices, and the end product prices have not yet gone up proportionately, so my margins are thin.
Is that the logic? Or what?
Seems to me that if I shut down now, end product prices will go through the roof, and the guys who are still refining will have huge margins, so that doesn't work.
Why is everything up and utilization down? Seems like that post Katrina, as well as repairing facilities, considerable capacity may have been added. No? Murray