| The Bullroarer - Thursday 6 December 2007 | The Oil Drum: Australia/New Zealand | Charts of the Day - Sunday 9th December 2007 |
Shedding Light on the Question of Reserves Growth
Posted by Phil Hart on December 7, 2007 - 11:30am in The Oil Drum: Australia/New Zealand

USGS World Petroleum Assessment
In 2000, the United States Geological Survey issued its World Petroleum Assessment, covering the thirty year period 1995-2025 (Table 1). The resource estimates from this study are widely quoted to support the argument that oil production can continue to expand. (Comments now open!)
Conventional oil and NGLs

In assessing the world's total oil endowment to be over 3 trillion barrels, the USGS study defines a huge contribution of 730 billion barrels with the 'potential to be added' to world reserves over the period 1995-2025 as a result of increases in the amount of oil that can be extracted from existing fields. The complete Reserves Growth report (Chapter RG) from the World Petroleum Assessment is available through the USGS website.
It should be noted, that while the USGS total estimate is likely high in each of the three areas assessed, a total endowment of 3.3 trillion barrels is insufficient to enable production to continue growing at historical rates beyond 2020. Forecasts for peak oil occurring much beyond 2020 imply even more unlikely resource estimates.
USGS Methodology
In assessing the potential for reserve growth to increase world resource estimates, the USGS studied apparent field size increases over time in the mature oil producing regions of the United States and applied the observed growth to worldwide remaining reserves and cumulative production, resulting in an average increase of 44%. A flow chart illustrating the process the USGS used is shown in figure 1.

Figure 1: Flow Chart for the USGS Reserves Growth Assessment Methodology.
Secondly, the manner in which oil fields are developed now bears no comparison to the early days of the US industry and leaves a lot less to gain. This difference has arisen largely because North American (USA and Canada) mineral rights are vested in the landowner, while almost everywhere else in the world they are vested in the Government.
Since the 1970's, and in contrast to early North American experience, new fields have generally been unitized and fully delineated. This means that the joint field owners are allocated a percentage share in the field based on how much of the field lies within their acreage. Costs and subsequent revenue are apportioned between the owners, enabling agreement on upfront capital costs for appropriate development. The result is that secondary recovery is now generally in place where appropriate from day one.

Figure 2: The forest of drilling rigs that occurs when owners of small pockets of land have the mineral rights and compete against each other to extract oil from a field as quickly and cheaply as possible.
As a result of this fundamental difference in ownership and approach it is quite inappropriate to apply the reserve growth experience from North America to non-North American reserves. Development of deep water and smaller fields has only strengthened this trend towards optimized recovery from early in field life. Consequently, there has been relatively little reserves growth observed in offshore producing areas in the last decade.
A New Reserves Growth Methodology
The USGS used a plot function that defined reserves growth as a function of the age of the field. However, largely because of the errors described above, the function is much too optimistic when applied to the rest of the world.

Figure 3: Graphical representation of typical recovery factors (chart from Industry Technology Facilitator, owned by 18 UK North Sea operators).
Rather than applying a growth function simply as a factor of age, we can consider categories of fields according to their current development status. For each category we can estimate the maturity of the current 'proven plus probable' reserves estimate and the scope for further gains:
- For fields that are not yet developed or that are using primary recovery only, the scope for reserves growth is large. However, there are relatively few fields in these two categories.
- For the large fraction of fields where secondary recovery facilities are in operation, or strong natural aquifer pressure support is present, future reserves increments are the additional contribution that could be achieved by tertiary recovery only.
- For fields where tertiary recovery mechanisms are already operating, the recovery gains expected from those facilities will be included in current reserves estimate. The prospects for further reserve growth in this category are limited.
- For fields at or near the end of their producing lives, especially those decommissioned or de-pressurized in a switch to gas production, there is little scope for reserves growth. While isolated fields may be successfully redeveloped, the average increase in reserves will be low.
- For gas/condensate fields, confidence in ultimate liquid production is somewhat higher and possibilities for enhanced recovery are generally limited to lowering wellhead pressures.
Conventional crude oil, condensate and NGLs (billion barrels)
Revision: 29th Nov 2007

Click to enlarge
- (a) Primary recovery is often used for initial field production, with pressure maintenance applied once sufficient field experience has been accumulated. Effectively, most fields move from primary recovery to secondary recovery (where required) within a few years of start-up.
- (b) This category includes fields where aquifer support achieves strong pressure maintenance, eg. Burgan, Kuwait.
- (c) Gas/condensate fields are assumed to have potential liquids reserves growth of 10% on average and are therefore included in the same category as fields with secondary recovery. Clearly the total figure here of 220 billion barrels has limited potential to delay peak oil, compared to the more significant 730 billion barrels suggested by the USGS. The weight that other commentators have given to 'reserves growth' in meeting future production needs implies even higher figures which seem unrealistic.
- Gb : Giga (billion) barrels.
- NGLs: Natural Gas Liquids.
- Unless otherwise stated, reserves here refer to P50 estimates, ie. proven plus probable. Also referred to as 2P, these are 'best' estimates, which are just as likely to be exceeded as not. P90 (3P) 'proven' reserve estimates are those which have a 90% chance of being exceeded. P10 (1P) 'possible' estimates have only a 10% chance of being exceeded.
The estimates presented in Table 2 are necessarily approximate but dramatically improve on the simple and inappropriate extrapolation used by the USGS. Input to refine the figures is welcome; both in terms of the growth possible in each category and the volume of reserves allocated to each category.
As a final note, the USGS estimate of 730 billion barrels of reserve growth over the thirty year study period describes an annual reserves increase of 2.5%. Internal company estimates of annual growth in field reserves are closer to 0.2%. The USGS result is ten times higher than that used within the industry and must be called into question. I hope that this post provides new methodology for which the contribution to be made by reserves growth can be estimated.
Definitions & Abbreviations
Acknowledgements
Chris Skrebowski helped edit the text for a previous version of this article which was published in the Journal of Petroleum Technology by the Society of Petroleum Engineers in June 2007, in response to CERA's guest editorial “Peak Oil Theory Could Distort Energy Policy and Debate” in February previous.References
United States Geological Society (2000) World Petroleum Assessment, Reston VA.Contact
- anz at theoildrum dot com
License

This work is licensed under a Creative Commons Attribution-Share Alike 3.0 United States License.
Archives
- November 2010 (2)
- October 2010 (5)
- September 2010 (4)
- August 2010 (8)
- July 2010 (2)
- June 2010 (2)
- May 2010 (6)
- April 2010 (7)
- March 2010 (12)
- February 2010 (11)
- January 2010 (7)
- December 2009 (10)
- November 2009 (6)
- October 2009 (7)
- September 2009 (10)
- August 2009 (10)
- July 2009 (3)
- June 2009 (14)
- May 2009 (10)
- April 2009 (15)
- March 2009 (16)
- February 2009 (16)
- January 2009 (15)
- December 2008 (15)
- November 2008 (23)
- October 2008 (25)
- September 2008 (24)
- August 2008 (30)
- July 2008 (44)
- June 2008 (38)
- May 2008 (48)
- April 2008 (43)
- March 2008 (29)
- February 2008 (32)
- January 2008 (30)
- December 2007 (26)
- November 2007 (32)
- October 2007 (11)
http://science.reddit.com/info/62emx/comments/
thanks for your support...
Excellent concise article Phil. Mahalo.
This has always been the big if in the petroleum business. How much is there and how much is it going to cost to get it out of the ground.
Very funny, these USGS people.
One has to ask: In an environment where so much money is to be made using "reserve growth," why hasn't it happened already?
It would seem that right now would be the easiest point to grow reserves while they are relatively easy to get at, not when they get really hard to extract.
The USGS argument falls flat. There will not be a sudden boom in extraction technology that will allow us to scrub every pore in the pay zone. What they fail to recognize is that it requires energy to push, pull, heat, or freeze. All of the slack in inefficient technologies has been pulled taut over the past forty years. Throwing energy at the problem is self-defeating.
I would guess that the USGS will continue to be the equivalent of the "propaganda bureau for continued corporate happiness" until the truth has been beating the average corporate slave over the head for several years.
By that point, it will be too late to mitigate anything. All of the people who have been urging "caution," to "go-slow," to avoid "looking like a nut" will have won. What will they have won? Well, immense human suffering that could have been avoided. A destroyed, polluted, degraded world. And a society that will undoubtedly be as fragmented and lonely as it ever was.
They will have won for the short-sighted, greedy, me-first corporations the last squeezings from the dying hearts of our people and our environment. Of course, the black-hearted corporatists will head for the hills and attempt to live in their gated, broken glass-topped walled compounds with Blackwater standing watch outside those gates.
Unfortunately for them, the earth will still be a sphere and the effects of their greed will still be felt by them.
Thank Gaia for that.
Yes.
What Cherenkov said.
Gaia is self-regulating.
The honorable Professor Lovelock is not to be disregarded. On the contrary.
Shh! Cherenkov, you will wake the sleeping and brain dead.
Think on the lemmings migrating to pastures new, think of a Cherenkov lemming shouting "the bridge to Avalon is out my comrades, death is near and will be of a rate 90% inclusive". They would mill and stomp about eating the last leaves of grass in great despondency, all to be lost to pasture degradation and slow starvation, 100% inclusive.
So shhh Chenekov, go quietly and gather those like-minded and whisper softly in their ears "Hey guys lets go for beer the (-------) end is near".
I'm a believer in the report. After all this is a government that lies about the inflation rate, manipulates the mass media on a routine basis, lies to get us into war(s), run by a president that god talks to, etc. What's there not to believe?
Opinion on EIA and IEA data? Perhaps there's no terra firma.
I'll just point out one, very obvious thing.
The reserve growth result is highly dependent on the expected increase from secondary recovery fields. If 10%(a nice round number...) were actually 8% it would result in a reserve growth of less than 200Gb. Taking Ghawar as the stated example, is there really the scope for tertiary recovery to yield an extra ~12Gb from the field? How does 10% stack up on a sanity check?
Putting a degree of extra precision on that 10% number would be worth the effort.
agreed. any ideas about how to do that?
i think a 10% increase in recovery after efficient secondary mechanisms have been exhausted is probably optimistic.
From a peak oil perspective its probably irrelevant. Your not getting high production rates out of this sort of extraction.
We tend to equate reserves with a certain assumed production rate but thats far from the truth. Once your past secondary recovery its not all that interesting. Theoretically we will be extracting over 20mbpd for a very very long time but who cares ?
On a small part of the oil extracted using secondary mechanisms will be extracted while we still have high production rates from primary and secondary recovery. All that matters is what are the reserves recoverable by primary and secondary recovery. I think you will find that we are down to a few 100GB of oil in this class and it makes up over 60% of our production. I could care less about the remaining 40% of or less of oil produced via secondary recovery. Its not clear how much of this will be extracted nor who and how it will be used once oil is no longer useful as a cheap commodity.
Phil,
Thanks for writing and posting this important article. "Reserve Growth" is one of the key parameters that distinguish ASPO projections of future oil reserve size (and therefore, production, which is what the world actually uses) with those of the optimists like CERA and EIA. EIA of course takes their data from USGS.
I'm wondering about a detail: the report was issued in 2000, covering the 1995-2025 period - so is it correct that they used no data available from 1995 to 2000 to calibrate their projections? Did they, in effect, pretend it was 1995 and then project forward their calculations for 30 years?
One important aspect included in Table 1 is "Undiscovered Reserves". This is another key parameter where USGS methodology is over-optimistic and vulnerable. If you assume (unrealistically) a flat rate of discovery, and spread out those 939 billion to-be-discovered barrels over the 30-year forecast period, you will find we should be discovering 31 billion barrels per year. And of course the reality is that we're finding only a fraction of that - maybe 6 billion per year (somebody confirm this?)
Of course, a flat rate of discovery over 30 years is not realistic, given the natural reduction in discovery prospects over the 30-year period. If we make the reasonable assumption that discovery rates might be reduced by 50% over the 30-year projection, then the interval must begin in year 2000 with discovery at over 40 billion barrels per year, declining to 20 billion by 2025. Based on the same assumptions you will find we should have discovered, cumulatively, 263B barrels in the period from 2000 to 2007. So, how close to that 263B barrels have we found in the 2000 to 2007 period so far? Not even close! (I would love to see another TOD article addressing this, with more detail and better numbers).
This is a key element of the ASPO peak oil forecast, since (as Colin is so fond of saying) you can't produce what you don't discover. This is why (with reserve non-growth, plus depletion rates) peak will almost certainly be within 4 or 5 years, not in 2030 or 2037 or beyond.
When you combine Phil's assessment of Reserve Growth (subtract 510B bbl) with realistic estimates of future discovery (subtract XXX billion barrels) and the overstated ME reserve sizes (subtract 300B bbl) you are down at least 1 trillion barrels from the USGS projections of total petroleum endowment. For something this important, it's astonishing how wrong they are, and how uncritically most of the world has accepted their numbers as gospel. This fact, 7 years into my energy education, still amazes me.
One would hope that 7 years into their 25-year forecast (starting in 2000) - that's almost 30% of the period - real data on reserve growth and new discovery would have made it very obvious how over-optimistic their forecasts are, which should cast severe doubt on the validity of their projections going forward.
I believe the IEA has, in fact, decided to review their use of USGS numbers and by now has been hit over the head by a 2x4 (insert metric numbers here) enough times to see how reality is diverging severely from USGS and EIA projections. It's about time. You can only "make your own reality" for so long and get away with it.
Dick Lawrence
ASPO-USA
thanks Dick. there is a similar correction required to reserves and discovery numbers.
i'll try and post a second part to this which pulls together the total numbers you are talking about.
if you want a sneak preview, my estimate of discovery and reserves is in this paper which was presented at the Australasian Transport Research Forum earlier this year:
http://philhart.com/fileshare/files/101/TheOilDrum_ANZ/atrf/RP_Hart_82_T...
One big issue your missing is that Shell has revised its reserve estimates downward by over 50% in multiple revisions.
I can't imagine that Shell's reporting behavior and metrics differed that significantly from the rest of the industry. Given that employee's in a given field especially in the higher ranks often work for several of the large companies in a area. The chances that Shell approach to determining reserves was that badly off of industry standard is slim to none.
Next and more directly how much of the current reserves are true new discoveries ?
We discovered close to a trillion barrels of oil by 1980 and mega fields made up a fair amount of these discoveries. I question that you can discover 800GB of oil with only one giant field being discovered ? No more super giants in all those discoveries and in fact no pretty much no really large fields discovered since the 1980's ?
I think you will find the majority of these 800GB consist of backdated discovery yet even with one of the last major oil fields discovered Purdhoe Bay we had a original estimate of 10GB and a final production of probably 13GB. With the last 3GB coming out at a greatly reduced production rate.
So for now at least to be conservative we should discount 400GB of the 800GB until we have better transparency. Shell shows we cannot take these numbers on faith.
This leaves 400GB. And new we have to question how fast we can extract this 400GB how much of that is going to be extracted close to our present rate ?
Again to be conservative we say well maybe 200GB before we see a significant decline in extraction rates.
Well guess what we extract 30GB or so a year so at best 10 years before we see serious problems.
And now your at the level I'm at is it 200 or close to 100. I think its somewhere in this range. The reason I lean toward closer to 100GB is simple because Hubbert came up with a global estimate of 1250GB and he was right in his first prediction. When he did his global analysis because of the political economic climate he simply did not have access to the quality of data that he had to make his original US prediction. If anything he probably erred on the high side.
http://www.touchbriefings.com/pdf/2590/Ferro.pdf
This indicates we are at least 80% depleted based on water cut right now.
Given all this yes we may still have a significant amount of oil to extract but the chances we can extract that oil at anything close to the 80mbd+ that we do now are in my opinion slim to none. Can we do it at 40mbpd sure but that does not support our society.
So in closing using oil as a cheap energy source for powering our society is probably in its last few years.
And even the 2 trillion number is suspect once you divide it out into new production and production under secondary recovery that provides high production rates which is gas injection or water drive.
And second its probably that reserve estimates by the Major Oil companies are also highly inflated I just don't believe that Shell is the only company that has overstated reserves.
So if you focus in on how much oil that can be extracted at high production rates the situation is even grimmer.
So until otherwise I think this is the real breakdown.
100-250 GB of "easy oil"
200-250 GB of oil extractable at a slow rate with advanced recovery.
500-700GB of paper reserves that probably simply don't exist.
Given that Shell has written down reserves by over 50% multiple times we have no reason to assume they are down and that other Oil companies won't be forced to follow suite.
As far as extraction rates who knows. I happen to think that we will see steep declines effectively now. If its 100GB of easy oil left you have to imagine that overall production rates have to start dropping sharply. If its 250GB then we have 3-4 years. But in my opinion if we did have 250GB of easy oil left we would not have hit peak production now but should have continued to climb slowly into 2010-2011.
Given that we have had high priced oil for years one would think that market forces would have resulted in continued production increases if we had 250+ barrels of oil left.
Its only when you pull the number back down near 100GB that it makes sense that strong market forces and advanced technology cannot overcome depletion higher estimates imply that we have room to increase.
Dick, the USGS has, in about the first paragraph of the executive summary of the 2000 World Assessment, the following description of what their numbers are...and I quote...."potential to be added to existing reserves".
They don't say..."for a given discovery profile", or "for a flat discovery profile", they say POTENTIAL, which strikes me as a hedge against ever seeing the entire amount mentioned, for WHATEVER reason.
Within potential I imagine economics comes into play, if everyone is driving EV's and there is not much demand for crude, there won't be much of an incentive to discover ANYTHING, let alone an imaginary profile within a given timeframe.
Also, the USGS numbers don't come anywhere close to a "total petroleum endowment", no way, no how. They specifically excluded all unconventional plays during their assessments ( at the World level anyway ). That small fact means that their numbers are guarenteed to be low. Not optimistic, or high, but when talking about global endowment, low.
As usual this seems to fit into the style of politically expedient pronouncements instead of sound technical judgments.
I suppose the POTENTIAL was there in the 1850's for the passenger pigeon population to continue on indefinitely, yet it didn't turn out that way.
Too bad I have to phrase it that way, but no way, no how, would I want to see this discussion fall into some safe expedient realm where you never look at the worst-case scenario.
I suppose the POTENTIAL was there in the 1850's for the passenger pigeon population to continue on indefinitely, yet it didn't turn out that way.
Quite right. And I imagine the history of oil will be different in the future than we can imagine today as well. Like...we won't use as much, and alot of what is in the ground will forever remain in the ground.
Quick questions.
Does this take into account the suggestion by Russia that the Arctic has some 100BB or more?
Also, how much is off the east seaboard that is considered at present off limits?
I suspect neither would add to much to the reserves, as it's the level of output that is more important that what's in the ground.
Richard Wakefield
your points relate to new discovery, not reserves growth, so they are counted in those categories.
the usgs discovery numbers are way optimistic, even allowing for realistic artic discovery levels.
That's what I thought. Seems the CEO of Shell knows how much is off the eastern coast, I've never seen any numbers, any ideas how much is out there and how accessable it is?
I have my doubts about the high Arctic, the mid atlantic ridge runs right through the pole. Makes one wonder if there is any meanful amount of oil up there at all.
Richard Wakefield
There is probably some off the Florida coast. Now that the Democrats are taking over, the Republican rich that control Florida politics are going to lose power and the Democrats will wind up offering it for lease to pay for medikid or something in 2008.
There doesn't seem to be anything off the rest of the East Coast, but there is almost certainly a lot off the California coast in the south, again in Republican areas where the rich people don't want oil slicks. But there are also a lot of ecofreaks there that don't want drilling and oil slicks on their beaches. The Democrats will win control of California in the next election and may allow that to be open for development in 2008.
I'd like to open ANWR and see if there is anything there. It's possible that the oil fields might be there and developable. I'm more worried about short term balance of payments problems than medium term peak oil.
Damn those ecofreaks keeping us from having oil slicks on our beaches. What's the matter with them? California's coast will be open for drilling when Hell freezes over whether the Democrats win control or not.
Nah, we'll drill off the beaches when gas rationing cuts in and even the rich get with the program. Nothing like having to wait for a bus to get your priorities right...
ANWR seems to have been surreptitiously investigated. By Shell according to rumors. They seems to believe there is somewhere between 10 to 15 billion barrels. Best 'safe' guess 11 billion barrels.
It has been estimated that peak flow from the area after full development should be in the neighborhood of 800,000 bpd, maybe even 1 million bpd. Roughly 1/20th of present daily U.S. demand.
It appears to me that the now forbidden off shore areas and ANWR are being 'kept in the back pocket' for later in the game.
We need to hold use of ANWR and the coastal oil back for after the point where the public realizes that Peak Oil has happened. During the decline period any fields that haven't yet been developed will reduce the pain from the production decline.
Or if your KSA wait until everyone is in decline and Arab Heavy fetches a premium price.
Two can play this game.
I guess the question would be, if we hold back on development and Simmons is right that rigs are rusting away, will there be time, money and resources to build platforms in these areas?
I would think so jr. The powers behind the throne are gaming this as best they can and there is just no way that these volumes won't make it into the system at some point. The question would seem to be what do THEY consider the appropriate circumstances to open these areas up?
We reached the 84 million bpd production neighborhood sporadically in 2004 after a serious surge in output. To my way of thinking we have been on the plateau now for roughly 3 years, if numbers from IEA, BP, etc. are to be trusted.
Initially, I did not believe that output could hold at this level for this long. I told myself that it would all happen in slow motion, the quantities are huge and even at these production rates change takes time to take effect. But 3 years?
Total output should start slipping soon, but that is a relative term and things happen slowly in the oil business. I think that all the players are doing their damndest to stave off the first hint of real slippage. It will totally change the tenor of the situation. When it does occur there will doubtless be no end of claims of purposefully lowering output due to demand drops from switching to alternative fuels, conservation efforts, etc.
To my mind the pricing we are seeing now is at least partly attributable to the players feeling out what the market can take, and what it will take to cause demand to lower in a manageable way.
This year was a perfect case in point for this premise. Consider last Spring: volumes were already at the effective limit of production going into May, so what to do to keep a lid on things? Crank the product price to keep stocks at acceptable levels. For that period $3.50 or so seemed to be what was needed to keep a handle on throughput going into the summer driving season. All kinds of things were trotted out to explain this, Refinery Capacity being the main culprit this time around. Most people bought into it just fine, it was handled very well by TPTB I thought.
The price gradually settled back down quite a bit from the highs, farther than I thought it would, as crude continues to go up. At this point the refiners have to bite the bullet on margins a bit in order to keep throughput at the most profitable levels. But then again, vertically integrated companies are still cleaning up hugely on the crude volumes they obtain from their own production efforts.
This Fall it hasn't taken near as high a product price to keep volumes under control, quite interesting to consider.
I am beginning to believe that the dip off the plateau just won't be as catastrophic as some do. Wishful thinking? I try not to let it be.
There is so much waste in the system, at least here in the U.S., that we can probably weather a fairly steep dip in output without the wheels coming off for some time. The kicker of course being that production dips will be permanent. Change will occur, weather we like them or not.
How much will output dip before TPTB open up the off shore areas and ANWR? I have no idea. Just before the pressure becomes unbearable I would think. The later the better- 20 billion barrels of oil makes a bigger difference when total output is 50 million bpd than when it is 85 million bpd.
A lot of things need to get done, but things ARE starting to get done. Wind and solar are receiving a lot of effort now, some big money is being thrown at them. Pickens has been extremely public about his wind efforts and other big boys have sat up and taken notice.
Big money getting thrown at fusion. Yea, possible return on efforts are on a very distant horizon, but at least the effort is being made.
Thank goodness ethanol's limitations are getting more publicity finally. If we can just get Congress to act appropriately now, sheesh...
The winds of change have begun. I try not to get impatient, this is a huge ship and takes a fair amount of room to change course.
Also, I don't believe the statement "For the large fraction of fields where secondary recovery facilities are in operation, or strong natural aquifer pressure support is present, future reserves increments are the additional contribution that could be achieved by tertiary recovery only." is correct. Firstly, if the field has multiple reservoirs or compartments, not all may be initially drilled and so estimates for the other reservoirs may grow over time. Secondly, there are other reasons why reserves may have grown in fields under secondary recovery. For example, horizontal drilling and geosteering may allow exploitation of strata that were too low in permeability to meaningfully contribute to a vertical well, but can contribute to a horizontal well. Also, there are cases of fields were zones were initially thought too wet to contribute, but it turned out that much of the water was in microporosity and so in fact those parts of the reservoir could contribute.
Only the cases of a reservoir that cannot be economically produced without horizontal wells can potentially add a significant increment of new reserves. In most of the other cases if they where really adding significant increments then we would see a more symmetric production profile for our fields. This in general does not seem to be the case.
We do know that horizontal drilling allows you too keep the production rate high and water cut low at the expense of faster depletion. Its not clear that the oil industry has correctly accounted for this in both reserve estimates and in expected production lifetimes. In fact almost all public estimates of estimated reserves and production lifetimes have turned out to be highly optimistic. The North Sea, Deep Water GOM. The reliability of government oil companies if they publish data at all is highly suspect. They have little or no incentive to provide realistic projections.
The underlying problem is pretty simple extraction methods cannot change the fractional flow characteristics of a reservoir only in a small number of cases of tight porosity does the extraction method physically matter. You have a lot of room to increase production rates but very little can be done to increase total recovery especially at high production rates.
To finish at least when I account for technical aspects of extraction I'm coming up with Hubbert as being essentially correct with a easily extractable global reserve of about 1250 GB with a potential additional 250 GB that could be extracted at a much lower overall extraction rate then today. This overall extraction rate is throttled by two factors. Horizontal drilling leads to rapid depletion so fields extracted with this methods decay rapidly. Thus even though you have a high rate for a individual field the overall rate will drop dramatically when the number of fields in decline exceeds that number of fields in production because of the steepness of decline.
For example if you have 5 fields going into a 20%+ decline that where developed or redeveloped with horizontal wells and one new field coming online the sheer number of fields in steep decline will result in a fast drop in overall production rate. On top of this we also have the problem that newer fields are smaller and have shorter lifetimes generally around 5-10 years.
The next class of older fields are those that have reached 90%+ water cut extraction from these is limited by water handling facilities and it takes a huge investment to get any significant increase in production and in general your simply accelerating the decline rate.
Well, I think this is going to be very reservoir dependent. If you get a layer of 10 milliDarcy rock between two layers of 0.1milliDarcy rock that form a barrier to vertical flow, you'd get nothing out of that bit of reservoir with vertical wells, but something with a horizontal well into it. Stare at a well log like the below for a while (especially the lower zones), and remembering that the deposition is horizontal so those spikes of low permeability could easily be laterally extensive, and it's not hard to see that situations such as I describe could occur.
Hmmm, are you sure? Seems like radial flow to a vertical well would be dominant. Basically a 2D problem as long as the producing layer is intersected by the well.
Intervening layers of low permeability as you suggest would certainly reduce vertical flow between strata, but isn't this essentially a horizontal flow problem anyway?
BTW, thanks for all of your great work.
Stuart this is well beyond anything I could answer. But given a path to flow i.e you have a region that has higher porosity and pressure you will get flow. The simplest example is a pinhole leak.
I did not deny their are cases where porosity is a issue but you can easily reverse the problem oil flowed into the region where the reservoir exists so it can flow out and in most cases fairly readily. We actually know of only a few reservoirs that are so "tight" that horizontal drilling is the only way to economically produce them. In fact even in south Ghawar its not clear that it could not have been profitably produced with vertical wells.
I'm not saying that horizontal wells are not highly productive easily 2-5 times more productive than vertical wells and you don't need tight formations to get the productivity gains.
I'm saying thats the problem.
thanks Stuart.
my main aim i guess is to put out there for discussion a simple but hopefully fairly robust way to estimate the likely contribution from 'reserves growth' and reduce some of the mystery surrounding the concept.
i'll try and come back later today with a bit more description of how i got these numebrs - at this stage though they are a rough first pass at demonstrating the methodology.
if anybody has data on how much recovery increases after applying EOR then i'd love to see that!
cheers
phil.
My main aim here was to put out a new methodology for assessing reserves growth, one which shows how hard it is to achieve 700+ barrels of growth when you give it a physical context.
The other problem is that I did this work early this year, in response to the CERA article in SPE's Journal of Petroleum Technology. Having sat on it for so long, I just wanted to 'get it out there' now but that's not really an excuse for not documenting it properly. I will make that a project for a future date (probably next year), but thought I'd get some feedback from the TOD community before attempting that.
I should really have published the basis for the reserves estimate first, but that involves trawling through the whole Saudi debate again which we've done enough of recently, so thought I'd skip straight to something new. In summary I've got a Proven plus Probable estimate for OPEC by extending Stuart and Euan's work for Ghawar and Abqaiq to the rest of Saudi and combing that with some lower IEA estimates for UAE and Kuwait and extending a similar average revision to Iran, Iraq and Venezuela. I'll publish all of that retrospectively in a Part 2, but you can also see it here:
http://philhart.com/fileshare/files/101/TheOilDrum_ANZ/atrf/RP_Hart_82_T...
For the other OPEC and non-OPEC countries, I used the Oil and Gas Journal figures, but have now realised they need to be adjusted upward, because they are 'Proven' rather 'Proven plus Probable'. That adds another 10-15% I think (I know Euan had a typical figure he was using to make that correction).
In assigning reserves to categories, I was (somewhat subconsciously) trying to be conservative by adding as much as I thought possible to the categories with the most room for growth, thereby leaving less in the 'secondary recovery' category than perhaps may be the case.
In terms of data sources, I found a site which had the recovery mechanism listed for most of the Norwegian fields, and combined that with what I knew about UK North Sea and Australian fields as well (eg Bass Strait all has strong natural water drive). Then I went through a list of giant oil fields - for many of them we have a reasonable knowledge of the recovery method and they cover a huge fraction of the total resource.
The most important percentage gain to estimate was that provided by tertiary recovery after secondary. For this, I was using a typical figure I've seen for the contribution EOR can achieve, and graphically represented in ITF chart in the post. However, your point about other ways to increase reserves is quite valid. The Saudi increase is OIIP due to adding higher initial water saturation and lower permeability areas is another example which should be counted in this methodology. However, I think many of the gains in these areas have already been 'booked'.
The gain from Primary to Secondary is based on rough estimates that Primary Recovery achieves ~20% and Secondary achieves 25-40%. Looking at now, I should have allocated a higher gain in this category but should significantly reduce the volume of reserves, so there may not be much net difference.
I just found some useful estimates in attempting to document all this in some geology class notes:
http://www.usask.ca/geology/classes/geol463/46314.pdf
Primary Recovery average 19%
Secondary Recovery 25-45% (average 32%)
Tertiary Recovery gains another 5-20% (average 13%)
Using those figures would increase my estimate significantly, but I think that would be counterbalanced by substantially reducing the volume of reserves in the high potential growth categories (especially Primary recovery, which may be closer to zero than 200?).
Also, the average given in those notes for EOR is just in those fields where EOR is actually applied, which are necessarily the ones where it has enough benefit to be economic. Many fields will never use it because the gains are not sufficient to justify the cost, so the average increase across all fields currently using secondary recovery may well be closer to my estimate.
I think it's also useful to look at the industry estimates of the real rate of Reserves Growth in their portfolio. At approx 0.2% (used internally by at least one major IOC), the 220 billion barrels that I have brazenly stated here would take well over a century to realise, as opposed to more than 700 billion barrels that the USGS see in thirty years.
Sorry for a lot of excuses.. "There's never time to do it right, but always time to do it over"
cheers
Phil.
Thanks for posting this, interesting reading the different methods of oil extraction.
Isn't this old news? Everybody has been saying how over optimistic the USGS has been for ages now.
The opinion that USGS resource estimates are too high is old news, but that opinion doesn't get far in policy circles unless someone has data to back it up. ASPO doesn't, as their "official" resource estimates are derived by the creaming method (aka creaming curves). This is a statistical method rather than one that uses geological data and information, and tends to systematically underestimate resources in all but the most mature regions. (This latter point was stated plainly by the method's developers, J. Meisner and F. Demirmen in their original 1981 paper; the reference is listed below, for those who'd like to hunt it down.)
Also, for those searching for data to refute USGS' assessment, the best place to look, in my opinion, is the USGS themselves. In 2005 Tim Klett et al. published an evaluation of their survey in AAPG Bulletin, and noted plainly that actual reserve growth and discoveries are falling far behind their estimates. Further, discoveries were falling much farther behind than reserve growth, suggesting that discovery shortfalls might be a bigger issue.
They say (and this is a paraphrase, as I don't have the original document in front of me here) that while it is possible that the USGS study was flawed and overestimated resources, it is more likely that the low actual reserve growth and discoveries is due to a an existing economic climate that does not foster investment in oil resources and that undiscovered resources are located in areas that are environmentally, politically or economically challenging to access.
For those interested in this debate, I'd definitely recommend tracking down the Klett et al. paper, even if you have to buy it from the AAPG. I listed the reference below.
Cheers,
-ELG
References:
J. Meisner and F. Demirmen. 1981. The creaming method: A Bayesian procedure to forecast future oil and gas discoveries in mature exploration provinces. Journal of the Royal Statistical Society. 144: 1-31.
Timothy Klett, Donald Gautier, Thomas Ahlbrandt. 2005. An evaluation of the U.S. Geological Survey World Petroleum Assessment 2000. AAPG Bulletin. 89(8): 1033-1042
Thanks for the Klett ref. I may try to track that down.
For those of us who have recently began learning about energy issues, this is new news because we were expecting another century of oil :) -- seriously, before watching Crude Awakenings last summer, one hundred years of supply was the last thing I remember reading about a few years ago -- funny, how mislead I was by reading one article (I think it was Newsweek).
Welcome to TOD! This is the right place, for newbees, techy or not
The USGS 2000 assessment of a 730 GB reserve growth out to 2025 seems somewhat supported given a recent USGS report that 171 GB of new reserves from existing fields was found from 1996-2003 (The 2000 assessment used data up to 1995). During that same period, 69 GB of new oil was found from new fields, the report claims.
OTOH, if new field discovery is so low, perhaps your 220 GB will be more realistic, if the majority of new reserves coming from existing fields has been found.
Perhaps the near 3:1 ratio of existing to new field discoveries is the more significant point to make for PO.
Source: http://pubs.usgs.gov/of/2007/1021/pdf/OF07-1021_508.pdf
This pdf file looks to be a very brief supporting document to the paper I just cited above. Both are worth a look!
-ELG
yes it is and claims to explain the 2005 paper better and provide the data. And it's free (ummm - your favorite world dominator's tax dollars at work).
Reserve growth is the key issue. If the reserves are not real then given the large base of existing production its practically impossible to increase reserves given that future discoveries are almost certainly in difficult to extract areas for geological, political and economic reasons. Future decline rates are probably dominated by the validity of both the estimated reserver growth and our ability to extract these reserves at a reasonable rate. Obviously I think that most of our reserve growth consists of either paper barrels or very mature reservoir's that probably cannot be extracted at a high rate once secondary recovery ends.
Also of course the average lifetime of the newer discoveries is important. Replacing a field that produced 100kbd for twenty years with one that does 400kbd for five years is not a apples to apples comparison. This sharpening of the extraction profiles has a big effect.
huh ? 171gb in 8 yrs ('96 through '03, inclusive) amounts to 21.3 gb/yr, projecting this out to the 23 or so yrs remaining in the assesment comes out to 490 gb, not 730 gb.
am i missing something here ?
edited
Well technically 618 GB (1996-2025 or 29 years) at your rate. But can that rate be sustained? I don't think so.
The point however is not are the USGS estimates reasonable, but completely off the rails. To date, they look much better than the author of the intial work was willing to give them credit for.
And they are better than any other numbers ventured to date, by anyone, that I am aware of.
I would love to be proven wrong, if anyone has someone elses global estimates for something similar.
Does "completely off the rails" mean unhinged?
I guess I don't understand the meaning of this. I thought off the rails would mean that they are way off base, but then you say that they are better than they looked originally. What exactly are you trying to say?
Maybe what you are trying to say is this:
"The point is not that the USGS estimates are reasonable, but that they are not that totally off-base as to be within the realm of possibility"
It seems like the equivalent of damning with faint praise.
i see what you mean, but arent they using the ksa definition of "reserves" ?
I am amazed that the author uses "inside industry" estimates of reserve growth when the USGS has already tested their assumptions against real world growth, and is doing much better than the author would lead you believe. Much, MUCH better, as John points out.
If I were trying to minimize reserve growth at all costs, I would ignore that work, just like the author did.
Good catch John.
Well I was fishing for something else. I had read the USGS was reassessing their 2000 estimate of world oil, and went to their site to look for info. I linked to the report as it was relevant, though the 2005 paper had been noted by Eric Garza below.
My comment upthread didn't imply "much, much better"; I quoted the numbers from the paper but suggested the rate was not sustainable.
BTW, I never determined whether USGS is actively updating their 2000 assessment. Anyone know?
Someone needs to start a new website that distills all this wrangling into a digest for people who can't afford to spend 15 hours a day here. This is a great site but I stopped coming here after about 6 months because reading all these articles and debates gets one no where. It's like arguing over religion. Either you're a believer or you're not. The other side will never provide any definitive proof to you.
I think we need a site with some graphic representation that shows in which direction the preponderance of evidence is leaning--at the moment.
A few days, I read somewhere that Saudi Arabia has agreed to goose up production. So much for all those hours I spent here reading about how it couldn't do so--even if it tried.
Well, there can be a lot of noise in the comments here... especially on Drumbeat, but overall the main articles are very educational.
You are probably, like me, from outside the oil industry. Still, if you have an interest in the topic then you, like me, will just have to bear down and spend time to learn about details.
In this case, the "reserve growth" argument is part of a chain of arguments used by those who believe that Peak Oil will not happen for many years. This article today on TOD attempts to show that the reserve growth estimation method has some fundamental flaws, thus "reserve growth" is a weak link in the chain of arguments for the very-distant-PO proponents.
The question for you and me is... do we have time to follow the arguments over each link in the chain of reasoning used by the various sides (of the PO debate), or do we merely drop in (to websites like TOD) once a year to see how the progress is going?
The problem is that I can't afford to invest the time needed to parse all this information.
I have a similar 'complaint' ie I feel quite well educated but my reading another "the end is near" article is having no effect on the global response. I've written to every politician I can think of on climate chaos & resource depletion but the only ones that reply are not in positions of power. I've changed my own lifestyle to use minimal direct petroleum (bike, electric scooter etc) but I'm a commercial pilot (great choice!) and I still (have to?) eat staple foods imported from the opposite side of the planet. When the trucks stop delivering to the store I will understand why but I'll be just as hungry.
When do we stop making a distinction between scholarship and activism?
Karavans, the USA site of the Association for the Study of Peak Oil, http://www.aspo-usa.com/, offers such a roundup every Monday. Probably other sister sites do something similar.
I appreciate your dilemma, its hard to wade through all this stuff.
We need something like http://www.lastoilshock.com/map.html, When all sectors turn red, TSHTF! This map would be improved if it indicated the relative production of the countries involved, producers <0.5 Mbbl/day are less of a concern than the likes of KSA.
Saudi Arabia is going to show two years of declining production relative to 2005. And their net export decline rate is almost certainly going to accelerate, perhaps close to a double digit decline rate from 2006.
In any case, what refutes a peak is a new peak. In order to refute the 2005 peak, Saudi Arabia would have to show an annual average production rate of 9.6 mbpd or more (C+ C).
We shall see what happens in 2008.
That's where crude oil production is leaning to, up to August 2007:
Read the original article right here in the oildrum:
http://www.theoildrum.com/node/3052
Thank you for this excellent summary paper. You have made a clear description of important material, usually densely and poorly available. Brillant!
I was always reading that there was 50 years of proven reserves left not counting reserves undiscovered. We were bieng sold a line.
hello all.
i'm not very skilled in oil and such, but it seems that most of the discussion regarding this issue is whether or not the data being presented is valid or not.
I have a rather simplistic view on this, and probably full of holes, but here goes:
I think all information connected with the government is sensored and manipulated in order to make the current administration and the "boy king" look flawless and wonderful. I've never once seen a big government report that said "We made a big mistake, and the scientists were right". The government has enormous power, and they are ruthless.
So i ask, is it possible for this data to truly be manipulated, or is the data collected and analyzed independantly of the government, and if so, is the data then presented without manipulation?
i honestly don't know the answer to this, and i welcome discussion and any answers. You guys are light years ahead of me on this stuff.
And, just a big thanks to all the regular contributors for all the hard work. I really enjoy reading the TOD, the only site that i really trust.
best regards
Phil in Austin
The 2000 USGS assessment was completed before Bush took office in 2001.
Anything attributed to malice can also be caused by incompetence. Phil has a point about "censored" data but I think it is technically misused prior to publication rather than politically misused or censored/edited after the fact.
Or does the USGS simply hire from the bottom of the barrel for their technical staff? See my full comment down thread.
They employed Hubbert for quite some time.
Last I heard he was dead. So I guess you are correct in using the past tense of "employ".
How astute of you to notice. The quesion was on the quality of the personnel involved, based on past hires, you would say they do a terrible job?
Yes I would say they do a terrible job. I am reading the following paper right now and have come to the conclusion that are trying to apply algorithms (such as the law of proportionate growth) that are not appropriate to the problem domain.
http://pubs.usgs.gov/bul/b2172-c/b2172-c.pdf
This is curious, since the USGS does have staff that have applied the math to the correct domains:
http://gsa.confex.com/gsa/2004AM/finalprogram/abstract_77575.htm
You have to know a lot about crystal growth physics to understand what is going on, but I am beginning to think they f'd the whole thing up.
Yes I would say they do a terrible job. I am reading the following paper right now and have come to the conclusion that are trying to apply algorithms (such as the law of proportionate growth) that are not appropriate to the problem domain.
http://pubs.usgs.gov/bul/b2172-c/b2172-c.pdf
Interesting. Tell me, on Page 1, Paragraph 4, point (2). What do you think of that particular assumption?
I have my own comments on this particular paper, but they have nothing to do with what is, or is not, appropriate to something which certainly isn't crystal growth physics.
Page 1, Paragraph 4, point (2)
I have no arguments with point (1) -- which is kind of obvious IMO.
But you asked about point (2). My problem with this is that they simply use a least-squares fit to the compounding of reserve growth observed over a 15 year period. The law of proportionate growth they try to apply has no apparent physical basis to the reserve growth itself. It does have applicability to a log-normal distribution of reservoir sizes, which has come about over millions of years of nucleation and aggregation -- the same basic concepts behind 3D crystal or particle growth. I spent a good 10 years working on crystal growth experimentation and modeling for PhD and at least a dozen refereed papers on the topic so that these ideas are second nature to me, yet I think they are terribly misguided in their approach. It is also possible that they brought it up to add some math, which can wow people into thinking the paper has more significance than it otherwise would. I almost think the latter, because they don't actually show the final connection from log-normal reservoir size distribution to reserve growth, and appear to use compound growth from the data itself.
And the data is suspect because they don't consider the implications of censoring the data outside of the 15-year collection window.
But you asked about point (2). My problem with this is that they simply use a least-squares fit to the compounding of reserve growth observed over a 15 year period.
Not quite what I was asking. I was wondering, in general, what you think about assumption #2, NOT necessarily as it applies to their work in this particular paper, but how it works in the reserve growth field of study in general.
Yes, I believe in using the past data. As a general rule, that is the only way to validate a model. And I would assert a valid model is necessary to understand the asymptotic properties of the reserve growth curve, which you can then apply elsewhere.
Yes, I believe in using the past data.
Lets start there then. Let me express a scenario, and if you would, tell me what you think about it.
Any given field ( reservoir, well, geographical area )has an absolute upper limit in volume of oil, gas and water contained within the pores. Call it VolumeInPlace ( VIP ).
This same field has produced a volume of oil and gas and water. Call it ProducedVolume ( PV ).
This same field has an estimate of volume of oil and gas to be produced in the future under a reasonable cost and price scenario. Lets call them Reserves ( R ).
Now lets take the available methods of predicting reserve growth and apply it to this field. 6 different people, using 6 different methods, some statistical, some geologic, some hobbyist SWAG.
These methods, by definition, will be greater than PV.
They will be less than VIP.
Some may be less than (PV+R).
Most will be greater than (PV+R).
These 6 different methods will define a distribution of best estimates for a given field. Assign a distribution to represent these answers. I really don't care which one because I am not yet convinced it really matters, considering the uncertainty in the process to begin with.
Aggragate all of the individual field distributions, subtracting out (PV+R) for each one to quantify reserve growth ( which allows for net increase or decrease ).
Would a probabilistic representation of ALL estimates of reserve growth be considered a reasonable way to present an answer at quantifying the size of the reserve growth?
I wonder who Mr. Reservegrowthrulz is refering to?
No skin off my back.
I think RGR is getting into 2nd-order effects, which is putting an uncertainty on top of an analysis. This is a valid concern, and in practical terms, the most important point is getting the mean correct. By definition, half the time the prediction will be optimistic and the other half the time the prediction will be pessimistic. Error bars on this really don't matter, because the error will be largely unbiased to either the side of pessimism or optimism.
So nothing wrong with aggregating a bunch of mean estimates to get another mean estimate. Unless of course one of these analyses is completely wrong and skews the prediction incorrectly. This is when we have to use the outlier card and remove the bizarre ones. And so you end up keeping the amateur analyses and dismiss the clearly misguided ones.
If we are now running a 80% plus global water cut most of the current estimates of reserves and reserve growth are way off.
I suspect the core reason is simple with our current advances in discovery technology we now have a good handle on VIP.
Knowing VIP or OIP has lead to the reporting of OIP as URR because of confidence in technology to ensure that URR approaches OIP.
A fairly small change in the assumption of recovery factors can lead to large increases in URR since the recovery factors where so low to begin with.
So I think VIP itself in fairly well understood and probably
close to correct the key is that real recovery factors may be much lower than anticipated.
The world has moved to reporting something closer to OIP as URR.
A fairly small change in the assumption of recovery factors can lead to large increases in URR since the recovery factors where so low to begin with.
Reserves are not calculated from simple OOIP and recovery factor etimates. While I realize its a favorite analog of reserves because of its simplicity, the engineers involved in the development of large oilfields do not simply calculate OOIP, apply a recovery factor, call the answer reserves, and head home for the day, work complete.
Because of this, changing the recovery factor upward arbitrarily, while amusing, does not necessarily have anything to do with a current reserve calculation. It can most certainly increase because it is a side effect of better development strategys, different economics, different technology, but its not a number which by itself swings reserves.
And after having sat through a years worth of presentations concentrating on super giants and giants, there has been no apparent shift in OOIP or ( cum production + reserve ) estimates on any sort of systematic basis ( beyond expected reserve growth ) which might lead me to believe that there has been a shift in the way the information is being reported.
You can fool some of the people some of the time,
But really, you only need to fool 'em on election day.
It's a little more complicated than that.
One can lie without lying.
Take the USA Consumer Price Index (CPI) as an example.
Instead of outright lying, the government invented a new phrase that sounds almost like the old one: Core CPI. But the "core" CPI (which framed to make you think you're getting to the core of the matter, which you ain't) excludes the accounting for food and energy.
Similarly with crude oil. Like ex-President Clinton I said: It all depends on what your definition of "is" is. Is crude oil equal to C+C or is it All-Liquids or is it something else? See? You just start playing word games and redefining what oil is and what an undulating plateau is and what lying is. Before you know it, nobody is lying to no one.
You're getting the truth, but just not in a way you can put a handle on it.
In 1940 there were 12 years of reserves remaining in the United States. Reserves remaining I am defining as Total Reserves in America /American Production rate for any given point in time.
In 1950 there were 12 years of reserves remaining in the United States.
In 1960 there were 12 years of reserves remaining in the United States.
In 1970 there were 11 years of reserves remaining in the United States.
In 1980 there were 9 years of reserves remaining in the United States.
In 1990 there were 10 years of reserves remaining in the United States.
In 2000 there were 10 years of reserves remaining in the United States.
In 2005 there were 12 years of reserves remaining in the United States.
So "50 years left" is the wrong characterization, the answer is more like "10 or 12 years left".
That's pretty good agreement with the Shock Model which uses a characteristic time (1/rate) of about 13 years for extraction. New discoveries were always coming on line and there was enough of a lag between discovery and mature production that this number held steady for many years,
As a point of information, the characteristic time is shorthand for describing when a value will decline to 1/e of its original value, typical of an exponential decline curve. So there are of course long tails in the decline curve but whose fault is it that the numbers get interpreted incorrectly? I certainly can see that 12 years of reserves implies a 1/e value for the current point in time, but I don't think the ordinary layman (nor the extraordinary layman?) understands this subtle distinction.
http://mobjectivist.blogspot.com/2005/10/shock-model-applied-to-usa-lowe...
When I said I heard 50 years left I was refering to the World, not the US. Sorry for the confusion.
I agree that this is a real intriguing topic. Anytime someone from the government calls a phenomena "enigmatic", I become very curious. I think a number of factors are at work here that no one has really scratched at.
First, no one seems to pick up the fact that the USGS analysts don't seem to understand the use of censored statistical data. All of the extrapolations are based on a 15-year period, somewhere between the mid-70's and 1990. Which means that data before that time is censored or truncated. This is OK if the USGS acknowledges this fact and uses the appropriate statistical analysis for censored data. I don't have an ideal analogy for this yet but let me take one from baseball. Say you were looking at Barry Bonds muscle mass over the course of a few years, starting in his mid-30s and continuing for a few years. If you came up with a human growth curve based on that data, it would give some weird results because you didn't take into account steroid use during that part of his career. And this happened because you "censored" data from previous years. Now, applying this to USGS estimates, the same "steroid injection" can be applied to the 15-year period of interest, yet the USGS analysts don't take this into account. They assume this juiced growth had compounded yearly since some of the older fields in the study were first discovered.
Secondly, they don't seem to indicate that the reserve growth will subside any time soon, just about implying that the growth is infinite. Take a look at some of the curves they have published and you will see what I mean.

Thirdly, I haven't seen a non-heuristic model applied to reserve growth. Studying the reserve growth curves published, including one from 2001 referred to by Khebab
http://pubs.usgs.gov/bul/b2172-c/b2172-c.pdf
you notice that it is curve fitting with extrapolations based on some dubious assumptions. I look at those same curves and see a rather obvious physical model that we can apply -- namely that of a Fick's law of diffusional growth. Unfortunately, growth by diffusion is infinite, i.e. ~sqrt(time), so you have to apply some elementary boundary conditions to the problem. A good technique I propose to use involves the dispersive growth model discussed on TOD in recent months.
http://www.theoildrum.com/node/3287
I describe the preliminary results of this approach in a blog post from a couple of days ago:
http://mobjectivist.blogspot.com/2007/12/dispersive-diffusion-model-of-r...
As always, it shows promise because it is based on some real intuitive physical principles. Whether it is right or not remains to be seen, but it provides the punching bag that we never get with the heuristics that seems de rigeur in USGS circles. In comparison, arguing the curve fitting heuristics is akin to pushing a rope -- it doesn't improve our brain muscle mass and it also doesn't get us anywhere.
thanks WHT, especially for the 'steroid' analagy for the 15 year period used by USGS.
unravelling the statistical effects of the methods and assumptions used by the USGS is quite tricky, even after reading the study several times. the end result is that they think everything will grow by another 44% (even including the volume that has already been produced). my aim here is just to show how unlikely that is, within a simple conceptual framework.
i think the work you and khebab are doing on reserves growth is very important, especially if you can explain it in way's that i can understand :-) and perhaps eventually boil all the statistical analysis down to a 'reserves growth' estimate that we can compare to others?
cheers
phil.
I have some graphical explanations in the works.
USGS reserve growth goes flat right at the end of that graph. There is assumed to be no further growth past 90 years. It is explicit within their methodology,so it most certainly not implied that growth will continue.
Verma's equations for Russian are different in that he does not have an explicit limit. But the curves you reference are not his.
I am not really sure how a methodology plays into this. You probably mean methods.
If not, I'd observe that the various USGS analysts are screwed up and completely at odds with each other. Maybe that is their methodology, in principle to create a set of underlying heuristics to account for any possibility. That seems kind of cynical, but the only alternative is incompetence.
I'd say we'd be better off starting from scratch than to reverse engineer their heuristics. I'm happy to see that Phil Hart is questioning the conventional "methodology" and hope we can continue to pursue some other approaches on TOD.
I'd say we'd be better off starting from scratch than to reverse engineer their heuristics. I'm happy to see that Phil Hart is questioning the conventional "methodology" and hope we can continue to pursue some other approaches on TOD.
?? I believe the EIA is currently doing a reserve growth study along very similar grounds as what Phil is suggesting for the US. Has been doing it for quite some time, 3-4-5 years maybe? The B.E.G. does something similar as well for Texas, and has been for perhaps even longer.
Are you suggesting that TOD is going to come up with something else, or does applying other peoples methods to global data somehow qualify it as some "other approach"?
But why isn't EIA doing their study out in the open like we do here on TOD? I'm frankly sick and tired of waiting for those anointed as the "official" ones to get stuff done.
I am not going to put myself in a position to defend the timing of any work done by the EIA, or anyone else for that matter.
They get it done, when they get it done, under the rules they work under. I have no idea what timeline they are on, but I would hardly let their work get in the way of yours.
It certainly doesn't get in the way of mine.
It "stops" after 90 years simply because they don't have enough data points beyond 90 years (there is only a handful of oilfields 90 years and older).
Anyway, even with generous reserve growth it does not change the peak position. The poster child for reserve growth is the US with almost half of their annual reserve additions coming from reserve growth. Despite that fact, it is important to note it did not have any impact whatsoever on the actual position of the US peak production. IMO, reserve growth is as important as your initial estimate underestimation (for instance by taking only 1P reserve values as initial estimates).
It "stops" after 90 years simply because they don't have enough data points beyond 90 years (there is only a handful of oilfields 90 years and older).
That is exactly correct. They didn't manufacture a tail to their data, they didn't imagine it going on into infinity ( like some growth curves I am aware of ), they simply called it quits where the data ended. Quite reasonable.
I am not aware of reserve growth by itself being a determinant in where peak takes place. I am aware that reserve growth was built into the original 1956 Hubbert work in the form of "future discoveries".
Attanaai's and Roots work in the US was based on SEC proven reserves. The growth function from this work was applied to the world level data, but they DON'T say it was applied to only P1 estimates at the world level. This strikes me as reasonable considering that SEC rules aren't global rules, but mostly North American ones.
Ahhh, but the perception of infinite growth is still there. Why do Attanasi and Root title one of their papers "The Enigma of Reserve Growth"? This frames it as a mystery that has some sort of positive and enduring, if not infinite, growth potential.
And when they simply truncate after 90 years, then the USGS can just wait a few years and then say, "Hey look! The enigma of reserve growth is back!" as the reserve growth keeps creeping up. Face it, they do not have a real model and are playing graphical mind games worthy of Edward Tufte with their audience.
Ahhh, but the perception of infinite growth is still there.
If all you do is peruse the graphs I suppose, and then mistake it ending for it continuing. You and I and Khebab both know why it stops at 90 years, which means anyone who pays attention and actually READS the silly document shouldn't have any trouble.
Why do Attanasi and Root title one of their papers "The Enigma of Reserve Growth"? This frames it as a mystery that has some sort of positive and enduring, if not infinite, growth potential.
Because they thought it was a snappy title? And it sure doesn't imply "infinite" to me, when I read it.
Face it, they do not have a real model and are playing graphical mind games worthy of Edward Tufte with their audience.
Boy....you really want to simply bash things, don't you? A) yes, they have a real model B) they use it where others fear to tread and publish ANYTHING about the size of global reserve growth C) if reserve growth was a topic good enough for Hubbert to notice and estimate, it sure seems reasonable that other minds should be allowed to refine the concept.
When I say they don't have a real model I mean that whatever model they have is invalid and therefore broken. Or it is a curve-fitting model, of which I have little interest in.
They do hand-waving in the general direction of a log-normal model but they stop short of deriving it from first principles. Otherwise, the mu and sigma values would have some real physical meaning, which points that it is curve fitting.
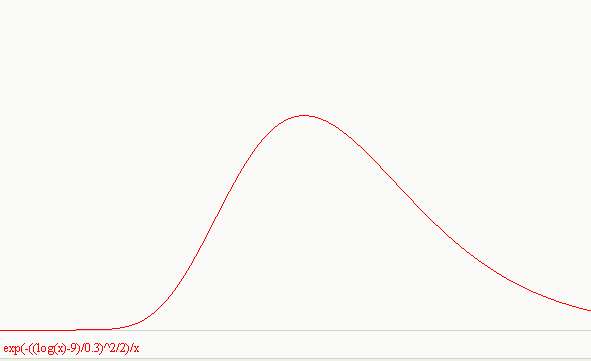
I notice they used a log-normal "mu" of 9 and a "sigma" much less than 1 in Panel 3. This seems quite odd as it gives a quite sharp lognormal, something I would not expect for reserve growth.
Web what gets me is the difference between back dated discoveries and real true drill a well new fields. This ratio is the problem. If you look at backdating vs new finds you will find we fell off a cliff once we had searched a finite volume.
Dispersive discovery smooths out the effects of falling off a cliff as we finish searching a finite volume. The dispersion is in the range of rates, so that slower rates will take longer to reach the cliff. If you can grasp this principle, you understand the dispersive discovery model.
Yes I understand. But are backdated discoveries or reserve growth dispersive ? I'd expect that the dispersive model is correct for the dates of a discovery and the normalized volume. By normalized I mean assuming 100% of the oil available discovered and not worry about the actual amount.
But why would backdating fit a dispersive model ?
Rates such as volume searched per time or discoveries per time is the type of parameter that disperses in the dispersive discovery model.
Reserve growth is also dispersive but that occurs within a single region.
So the part I'm missing or not understanding is how your handling reserve growth in your dispersive model. I honestly don't understand what dispersive in a region means from the math side. I understand what you mean qualitatively but then what ?
This says that the original search defines or eliminates search volume to create regions ?
Reading this I'm not understanding how backdated discovery is handled.
http://www.theoildrum.com/node/2712
The issue is the discovery model is in effect taking on faith the backdating of discoveries. The key is the "original" conservative estimate. A check on Purdhoe Bay revealed that the original estimate was 10GB with final recovery around 12-13GB but those last 2-3GB are coming out at a slow rate. Most official announcements seem to be wildly optimistic I've got no reason to believe that backdating is correct. Its really hard to find a paper trail for a discovery to determine when and why the reserves where increased. I don't even know the model used to justify backdating.
See this article.
http://dieoff.org/page176.htm
Maybe this could clear things up.
The question I asked myself was fairly simple given what we know what is the minimum amount of reserves needed to support our current extraction rate ?
The answer seems to be given all the factors that we can extract at the rate we do today with a total reserve of 1250GB or less.
The reason I don't think we need large remaining reserves is pretty simple advanced extract and shear well count allows us to keep the production rate high till you get about 90% depleted.
If we are looking globally, the search volume accelerates with time. This means that the cumulative of discoveries shows an inflection point, the familiar S-curve that we all have seen. You can imagine reserve growth on a global scale as describing the new discoveries that come on board at a progressively diminishing rate. The reason for an inflection point is that the accelerating rate of search in volume competes with the diminishing un-searched space. The reason that the region around the inflection point appears continuously smooth is caused by the dispersion of search rates about the mean. At the end, after all the fast searches have been exhausted, the slowest ones contribute to the long tail.
On the other hand, reserve growth on a local scale does not show an inflection point. The search rate is governed by a diffusive term that only increases as the square root of time. Square root growth (i.e. also known as parabolic growth) only decelerates with time. Therefore a deceleration on the growth does not compete with a diminishing reservoir -- the effects are additive and no inflection point appears. Dispersion on the diffusive term only serves to make the curves more concave downward.
You can see the effects in the following set of curves that I graphed. The purple and orange curves show the local reserve growth with the strong concavity and clear square root growth rate. The green and blue curves show an accelerating search space representative of global or larger ragions; these demonstrate a clear inflection point that gets stronger the faster the search acceleration. For completeness, I also show the linear growth rate (the middle red curve), which is what Hubbert has graphed because it normalizes the search acceleration and essentially shows the dispersion by itself. The linear growth also does not show an inflection point:

Backdating of discoveries plays into how the global discovery dynamics get updated by the local reserve growth terms. If the local reserve growth follows some nearly universal concave profile, it is computationally simple to apply the local reserve growths to the global curve. Khebab has done this recently with an Arrington reserve growth profile.
http://www.theoildrum.com/node/3287#comment-270062
Memmel, that quote of mine that you posted is still relevant. Backdating is a confidence level booster certainly, but it is also used to increase the rate of extraction. If a slowly depleting reservoir suddenly had a reserve growth burst, the rate of extraction would certainly increase, and that's where the shock model fits in. But I agree with Khebab that we have to apply this uniformly to only the original discovery estimates, and therefore don't include it in the maturation phase.
Hopefully you can bring this together in another paper. In particular I want to see what you come up with starting with the original discovery estimates.
Also I hope you will consider my idea of the minimum reserve level needed to support a certain production level I think it has merit.
So given the original discovery size and some but probably small reserve growth level say 10-20% I suspect our current production levels are plausible if your willing to accept a asymmetric production curve which the shock can provide.
I think you have the tools to come up with a very reasonable minimum estimate then the question is are we beyond the minimum and if so why has production slowed now ?
And as a final note what about the world ?
And thanks for the explanation.
Stan said:
"I believe the IEA has, in fact, decided to review their use of USGS numbers and by now has been hit over the head by a 2x4 (insert metric numbers here) enough times to see how reality is diverging severely from USGS and EIA projections. It's about time. You can only "make your own reality" for so long and get away with it."
There has even been a serious over-estimation of wood reserves when you consider a 2x4 is actually 1.5" x 3.5"
The other somewhat important question is what the oil price has to be to produce whatever the remaining reserves are.
Is it $100 or is it $200 and at what point does price really start to have an impact on demand?
Dear Scotsman,
If the bullets be flying close to yer head as yea goes about drilling, what "price" would yea put on that?
As oil gets more scarce and people realize how much they need it, they'll start killing each other for it (as if they haven't started already). Sure, there will be a monetizing "price" put on each barrel. But is that the true cost? At some point people are going to wake up and say I don't want that death liquid at any "price" because the "cost" is too high.
BBC reports that Statoil shares are down on the announcement that production targets will not be met.
This was interesting:
As I understand, Norway uses some of the most modern exploration and production technologies. Is this is a sign that despite this even their gas production is now peaking after crude peaked in 2001.
Its hard to get mouthfuls of icecream when you're having to scrape the bottom of the tub (from own experience).