Update on Megaproject Megaproject
Posted by Stuart Staniford on December 10, 2007 - 11:00am

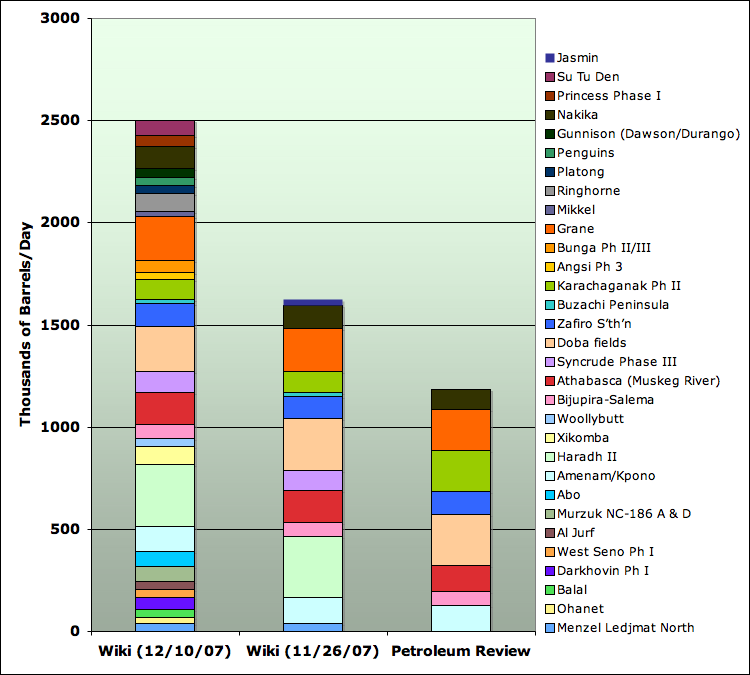
New liquids capacity with first oil in each year as estimated from Petroleum Review megaproject reports (last available estimate in each case), and interim estimates from Wikipedia table as of December 10th, 2007. Error bars on Petroleum Review figures are as documented in Is the Decline of Base Production Accelerating.
As of now, we've reached about 350 citations used in collating the information. I have mainly been working on the past - the years 2003-2006 - while the years from 2007 onwards have mainly been handled by Ace and Khebab (though there is some crossover both ways). The 2003-2006 projects, of which there are currently 108, depend on about 140 citations. In attempting to assure completeness and quality of the list, I have reviewed the 2003-2006 annual reports, and/or all press releases, for the following companies:
- Anadarko
- Apache
- BHP Billiton
- BP
- Chevron
- ConocoPhillips
- Deer Creek
- Encana
- Eni
- ExxonMobil
- Hess
- Kerr-McGee
- Kuwait Oil Company
- OPEC upstream investment plans
- Petrobras
- Repsol
- Saudi Aramco
- Shell
- Talisman
- Total
- Unocal
- Woodside
- Nelson
- Statoil
- Tanganyika
- Yukos
- Nexen
- Naftiran
- ADCO
- ADNOC
- Santos
- Husky
- CNR
- Pemex
- Gazprom
- QP
- Sasol
- Petronas
- Norsk Hydro
- Petrodar
- Lukoil
- AED
- Devon
- Murphy
- Marathon
- AWE
- Rosneft
- NMNG
- NIOC
- PDVSA
- Coogee
- El Paso
- CNOOC
- Reliance
- OMV
- PDO
- Surgutneftegaz
- First Calgary
- Maersk Oil
- Hoang Long Joint
- Sinopec
- Cairn
- Dominion
- Barrett
- Premier
- Burlington
- Sonatrech
- Petrofac
- Korean National Oil Company
- PetroCanada
Nonetheless, it should be clear that all conclusions from this data are preliminary and may need to be revised as the exercise continues. So far, it is producing pretty big revisions to our idea of new capacity added in recent years. Here's the evolution of 2003, for example:
New oil liquids capacity with first oil in 2003 as estimated from Petroleum Review MegaProject report in Jan 2004, and estimate from Wikipedia table as of November 24th, 2007, and as of December 10th, 2007.

New oil liquids capacity with first oil in 2004 as estimated from Petroleum Review MegaProject report in Jan 2004, and estimate from Wikipedia table as of November 25th, 2007, and as of December 10th, 2007.
New liquids capacity with first oil in each year as estimated from Petroleum Review megaproject reports (last available estimate in each case), and interim estimates from Wikipedia table as of December 10th, 2007. Error bars on Petroleum Review figures are as documented in Is the Decline of Base Production Accelerating.
It's worth stressing that the above graph is peak capacity of projects, but tabulated by the year they first deliver any oil (at least for the Wikipedia totals - it's not quite clear what procedure Petroleum Review used to get totals). We really would like to see what it looked like when convoluted with an estimate of the composite production ramp-up. We'll get to that, but I don't have a reasonable sample of projects on which to base such an exercise yet.
The wave of oil in 2008 is a prominent feature of the tables at present, and I'm sure will give great comfort to late-peakists. It's perhaps a bit premature to put too much store in it yet. The years 2007, and especially 2008 are different from 2003-2006 in several important ways. One is that they've been largely compiled by different people, and the process might be at different stages of completeness. The other is that 2008 project schedules could still incorporate a certain amount of hope likely to be dashed by the usual complications that enter into all project schedules as they make contact with the real world. So some fraction of 2008 projects, and a much smaller fraction of 2007 projects, will get delayed. The past is less subject to unexpected delays...
Here's the split of the current estimates of new capacity between OPEC and Non-OPEC:
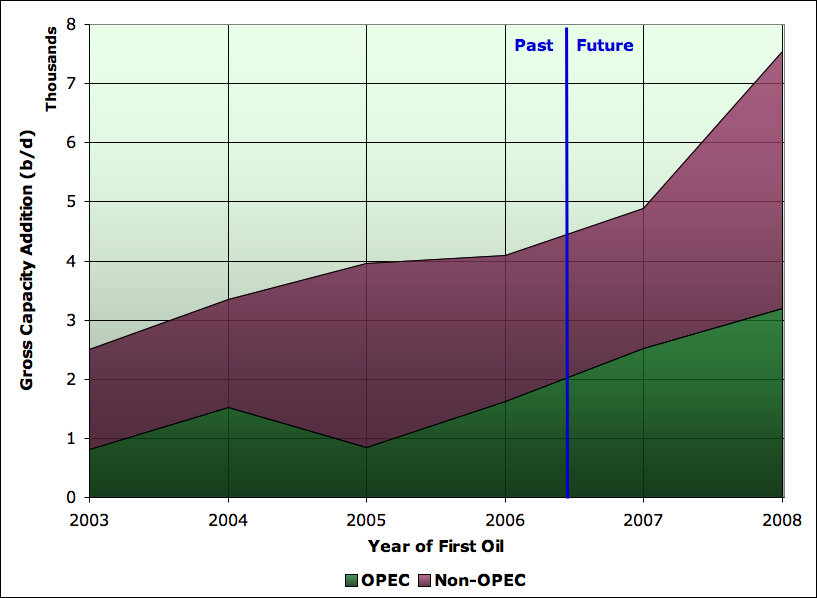
New liquids capacity with first oil in each year: interim estimates from Wikipedia table as of December 10th, 2007 split between OPEC and the rest of the world. Note that Angola joined OPEC in January 2007, so Angola projects are accounted as non-OPEC in 2003-2006, but as OPEC after that.
Finally, for the 2003-2006 projects in the Wikipedia tables, I repeated an exercise I did for the 2006-2010 projects in the 2007 Petroleum Review Megaproject report. That is, I sorted all the projects by size, and then calculated the cumulative capacity from the largest down to each project. Essentially this gives the effect of cutting off project tabulation at each size. Here are the those two curves:
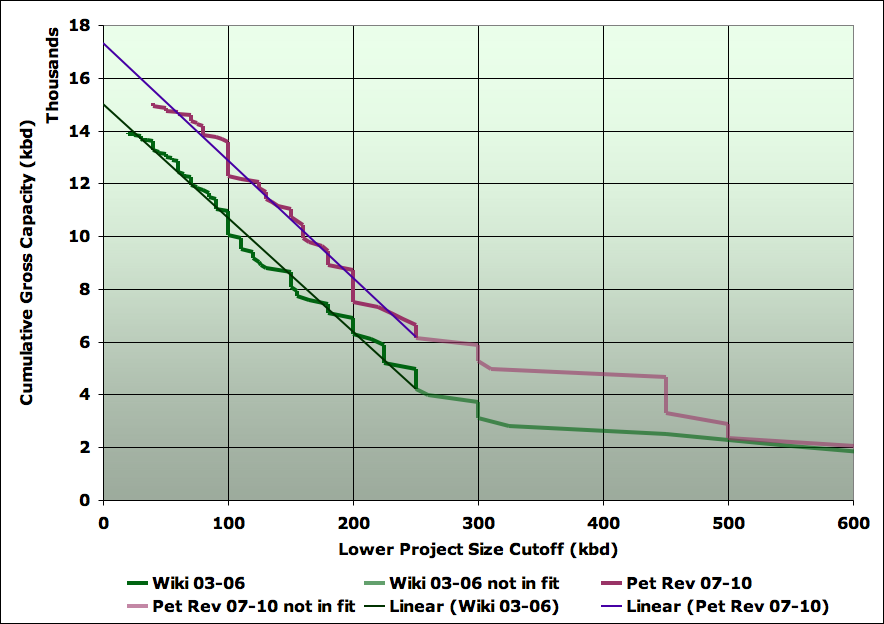
New liquids capacity with first oil in each year, cumulative capacity by size of lower project cutoff. Petroleum Review estimates are for 2007-2010 projects. Wikipedia interim estimates from Wikipedia table as of December 10th, 2007 for years 2003 to 2006. The two curves are not tabulating the same projects.
Finally, this stuff is a lot of work, so I'd like to repeat my appeal: the more folks in the TOD community head over to the Wikipage and help, the faster we'll know what's really going on here.
Contact
- Content: editors at theoildrum dot com
- Tech support: support at theoildrum dot com
License

This work is licensed under a Creative Commons Attribution-Share Alike 3.0 United States License.
Stuart,
It never ceases to amaze me the commitment that you guys show to rooting out titbits of info and pulling it all together into useful arguments and articles!
So isn't the increase in output seen exactly what an economist would argue would happen given the increased cost of the extracted product?
I think we may see the same happening with some other commodities that have seen huge rises -such as Uranium. There's loads of Uranium in the ground the economically extractable amount goes up exponentially with the underlying asset price.
Regards, Nick.
There's no question that there's more supply coming on line. The question is at what point will it not be enough to overcome declines (of various kinds) since we know production has been more-or-less flat the last couple of years.
The staged nature of production growth, in the emerging Oil Sands megaprojects, presents a few questions imo for the Wiki page. That said, I have done the work, so far, on the Long Lake Project which is a JV between Nexen and OPTI. And I'm happy to do more, as this is an area where I've invested capital for several years, and I spend most my time reading all this stuff anyway.
What's happening is that the speed by which these projects will bring on subsequent stages is getting tossed and turned on a sea of wage inflation and labor shortages. And more recently, the new royalty regime from Alberta has already caused Canadian Natural Resources, for example, to suggest their staged buildout of the enormous Horizon project may slow down.
Alot of the charts investors were offered back in 2003-2006, therefore, showing production growth at Syncrude, Horizon, Long Lake out to 2015 (not to mention the junior projects), are going to have to be revised.
One wonders, in this context, how useful or even possible it becomes to enter a Peak Capacity/Peak Production number on the Wiki page. Some of these projects now might get stretched out now to 2018. No guidance specifically has been offered yet on this from the companies involved. But it's coming.
Best,
Gregor
In answering my own question, my hunch would be, that the nature of oil sands projects might suggest that the Wiki Page should have not only a column for Peak Production, but, also a column for each stage. Nexen's Long Lake comes on next year (6 month delay) at 60kbd, but, the peak will only come more than several years from now. Contrast this with Nexen's North Sea Project, Buzzard, which although it had a few problems ramped towards peak production pretty quickly after first coming on line.
Gregor
I agree that tar sands projects represent the "long tail" of the composite ramp-up project - I've been amazed at the slow ramp-up of the ones I've looked at. But ramp-up is a more general issue - tar-sands is just a small (albeit extreme) case of it. My feeling is that we are going to have to have to try to get the largest sample we can manage of projects where we know both the first oil date and the date at which we reach plateau, construct a suitable estimated convolution function out of that sample, and then apply it to the new capacity estimates we have.
It's an important issue on which I will focus once I have some confidence that the lists are reasonably complete and correct. At the moment, the gross totals are still changing enough that I'm not ready to worry about the ramp-up issues.
Thanks for your help btw! Feel free to create an account over there so we can see your name in the history.
I prefer your use of "tar" sands rather than the preceeding designation as "oil" sands.
Thanks for the reply, Stuart. When doing further work therefore on the tar sands projects, I will enter the expected peak production rate in the "Peak" column. As opposed to entering merely the expected production rate from the intial stage. (Wiki instructions: "Peak: maximum production expected (thousand barrels/day)."). Based on your remarks, you can then figure out how to handle the Long Tail, as you call it, of these staged projects in the sands.
So for example, I have Long Lake coming on next year with the figure of 60Kb/d entered in the "Peak" column, as their initial stage. I will change that therefore to the expected Peak rate, which, according to Nexen will eventually be about 240Kb/d.
Gregor
If the company breaks the overall development into separate phases with dates and production rates for each, we generally put each phase in as a separate project.
Without meaning to harp on about it - Longlake won't actually be getting 60 kpd of upgraded crude until mid 2009 according to its website (www.opticanada.com). 2.5 Years from first steam through to full capacity of upgraded product.
It is a long wait but I am in for the long run :)
Hi O.K,
I'm not sure that I understand your post completely, but, all guidance from both Nexen and OPTI now has Long Lake producing fully upgraded Synthetic Crude sometime starting in the back-half of 2008. Bitumen production has already started though at a very minimal level. The central problem with the Long Lake project so far has been the shortage of labor to complete the Upgrader. In my opinion there will be a final hurdle for this project to overcome next year: and that is their unique gassification/recycling process, aka "OrCrude." What I imply here is that we have not seen this process actually work, yet.
Fingers crossed.
Gregor
Some collateral damage from the mortgage meltdown.
Apparently several tar sands companies that raised tons of money stuck it in short term institutional money market funds that were heavily invested in US mortgage bonds.
The Canadian Tar Sands...where Finance and Peak Oil meet. Would be a heck of a title for a book!! How many other high-priced extraction/exploration operations have done the same thing with spare dollars...invested in high interest funds to try to help with increasing costs.
Can you point me to any sources regarding oilsands/failed short term deposits? I would be keen to find out who has lost what.
An investor in Canadian oil stocks told me about the money market situation. I don't have any specifics.
Optimistic Kiwi,
If you find out would you E-mail me at billvon@windstream.net I have been investing in tar sand companies for 2-3 years
Gregor
I have been investing in OPTI for several years also. Have you compared OPTI with Suncor and Uts?
I also see that Suncor and Imperial Oil are left out of the above referenced List
I guess the best way to answer is that I have been researching all these companies and their myriad projects for several years. Imperial, which you asked about, is both the largest shareholder in the Syncrude project, and now, is the operator. It's probably wise for the Wiki Megaproject page to follow the Syncrude project as a standalone, rather than break it apart company by company, from Imperial, to COS, to Nexen, and COP. Imperial also sits on the Cold Lake Project.
The four companies you mentioned are quite different from each other. Imperial and Suncor are giants. UTS and OPTI are juniors, really. I either have been, or remain invested, in all of these. They don't really make for good comparisons,imo.
HTH.
Gregor
Gregor:
Thanks for the reply BTW my E-mail address is owvon@windstream.net. Would love to compare notes sometime
Using the Texas and North Sea models and just looking at the initial production declines out for about 8 years after their respective peaks, one could argue that higher oil prices and increased drilling activity result in lower crude oil production.
In the alternative, one could argue that the smaller fields that we tend to find post-peak can't offset the declines from the older larger oil fields, e.g., East Texas & Brent, that we tend to find pre-peak.
http://science.reddit.com/info/62m6z/comments/
thanks for your support.
Wow, amazing how much data coming from committed volunteers.
Stuart,
As I posted in replying to an earlier post by Ace, the 2008 looks to be a significant outlier. When I looked at the wiki data for 2006, 07, 09, 10, 11 etc. the values seemed to vary about the 4mbpd level.
At 7mbpd, 2008 looks massively out of the ordinary. When you look at the data this is also composed of lots and lots of small and medium sized fields (nothing >400kbpd). How confident can we be that all of these are really due to come onstream during 2008? And all under the oil rather than gas heading?
Also, this year its claimed that 4.5Mbpd came onstream. Yet we've seen essentially flat total production numbers. If all of this was real then it implies that the natural decline of all of the old fields is 5.2% - a high decline number.
I'll leave it to Sam and Tony to comment on how reliable they feel 2008 is at this point.
Your point that the base decline rate must have been higher than we thought seems right to me - the more projects we find in the past, the more it seems as though decline rates must have been higher than we knew.
This is what I found most striking about the information. And if the decline rates really are higher than commonly accepted, along with the rational assumption that as oil prices rose, as many producers as possible did their best to produce as much crude as possible to profit as much as possible in the short term (as in the longer term, the consensus was prices would fall again), then the future looks increasingly precipitous.
In my opinion what may be behind a surprisingly high decline rate is the short lifetimes < 10 years of a lot of modern fields. In many cases less than 5. I deep understanding of the various project i.e taking Megaprojects back into time would be great. We know we ramped nearly 10mbd from about 2000. It would be nice to compare that success to the current situation.
So I really think we need to get back to at least 2000 to make good use of the data.
Feel free to start work on that at any time.
I wish. I'm just saying that back in 2000 we seemed to have "normal" increases so the question is what has changed.
2003 is good. 2002 better etc.
The point is that the oil market behaved as expected until say 2004 or so. One problem I've noticed with the older data is that as you go back very little info seems to be web accessible.
ConocoPhillips CEO Jim Mulva:
http://blog.foreignpolicy.com/node/7273
I found this stupifying, electrifying, terrifying, fascinating and about right... all at the same time.
It's a hell of an age we may be entering.
It's pretty close to what Gould of Schlumberger has been saying for about 18 months now. He's been saying about 7.00%.
Gregor
Gould has been saying 8% as well, for at least 30 months.
I now think he's talking about what I'm christening the "petrophysical decline rate". Ie what happens to an average well if you don't do anything more than fix mechanical breakdown. That's different than the base decline rate relevant to megaproject analysis, which is the decline after you've allowed for infill drilling, workovers, rigless shutoffs, etc, etc. Typically the base decline is smaller (and it may even be growth, eg probably in Russia).
And even the EIA is worried about accelerated decline rates.
http://www.eia.doe.gov/oiaf/servicerpt/depletion/preface.html
They say what I'm saying but hey I'm just a super doomer.
Would you please be clear about these terms. "Accelerated" only means it is bigger than last year, "accelerating" means it will continue to do so.
People throw these words around without any numbers to the point where they are meaningless. How can one possibly predict the future (which I think is your goal) when you cannot accurately describe the past?
I've just created this chart showing the repartition of project sizes:
We have more small project entries for 2008 and 2009 but also more projects in the 250-500 kbpd range. There are also some uncertainties about the exact timing of some large projects in Angola scheduled for 2008 but that could be delayed to 2010. 2009 has a large contribution from the Khurais field (Saudi Arabia). 2004 and 2005 have a relatively small contribution from the 100-250 kbpd segment at almost half what is observed in the following years.
Sam - I'm struggling to reconcile this chart with Stuart's. His chart lacks the spike in 2005. Also, what's going on in 2013 and 2014? The project tables are near empty those years?
It's then worth noting that 2009 is even higher than 2008. And maybe the lower forecast volumes beyond then are a distant horizon feature.
So looking at this, one gets a feel for why CERA have perhaps been a bit more optimistic than us? The world will be building spare capacity like crazy the next couple of years - if this comes to pass!
So will we all live happily ever after? It would be good to see a break down by liquid type. There seems to be a lot of NGL, GTL and syncrude in there.I also wonder to what extent the 2008 hump is due to delayed projects rolling into the front year?
This is great work btw by you Stuart and Ace.
Yes - this graph must be buggy at present. The tables only have 40kbd for 2013 and 280kbd for 2014 at present.
However, the idea of it is interesting. If it turns out, as I expect, that bigger projects are visible further out, we may be able to correct for that if the size distribution of the smaller projects is as regular as it appears to be.
Stuart - its great work. Khebab is having a bad chart day. I suspect that the front year (2008) is inflated with delays rolling up - and if you take that out then we revert to seeing the very tight supply situation that Faith Birol was kind enough to draw our attention to. I think you're almost certainly right that bigger projects are more visible further out.
It will be good to get 2008 settled before the year end - and then see how it pans out in reality. What we may end up seeing is that "next year" is always going to be a bumper year - that never materialises. So Wikipedia stores the edit history, so history matching will be straight forward?
This is a preliminary result, I didn't double checked the numbers yet. This chart is derived automatically from the Wikipedia tables. A perl script running on the TOD server is converting the Wikipedia table into csv files (check the Wikipedia pages, the csv files are linked at the bottom of some tables). I know there are still some conversion issues mainly because commas or alphabetic characters are mixed with numbers. I'm in the process of cleaning the content of the tables so it's possible that some oilfields have been discarded by the conversion program hence the discrepancies.
Ok, I've made some cleaning in the data. Just hit refresh, the result is now similar to Stuart's charts.
2013 and 2014 are still clearly wrong, so you still have some debugging to do. You might want to manually total a sample of the years and make sure your code can reproduce your manual totals before you post results...
Khebab, why does your chart show a local max at 2005 when Stuart's curves above show a monotonic increase in the 2003-2008 time period? Is there something I'm missing here?
Oops, Euan hit the "post" button before me...
Also, my comment directly below this was based on an earlier version of Khebab's chart that had some issues.
If I'm reading this correctly, it also appears that we're looking at an additional 40+mbd in the 2008-2014 period (the latter few years of which are likely to be an underestimate for time horizon reasons). Fatih Birol mentioned the number 37 mbd by 2015 to avoid a serious crunch. If this chart comes to pass, we may just get it.
See my note below, and not to be too redundant, but in any case several sources--now including the New York Times--have pointed out that there is a big difference between total world oil production and net oil exports.
Why would anyone think total world oil production and net oil exports are the same thing? Why would the New York Times need to point it out? When and/or where have they ever been confused?
WT's point is that if net exports decline, it makes little difference to someone in an importing country whether the world production levels continue to increase or not.
However, it is only recently that the issue of net exports is being reported (Rubin, NYT, etc.). So the MSM may not have been 'confused' before, but they certainly did not report on this issue much.
Don't be ridiculous. There wasn't anything in what he wrote that would indicate that was his point.
Besides, what you said isn't necessarily true either.
What exactly is the "issue." The MSM didn't report on it because it isn't an issue.
A few people saying it will be an issue does not make it either a crisis or newsworthy.
This is obviously coming from a later set of data than I extracted from the wiki page to total up the future year contributions.
From basic principles I would tend to expect the level of additions per year to be essentially flat or gradually increasing - governed by the available drilling capability, the average yield of a well and the central limit theorem.
I'm guessing what we see in the 2008/2009 time period is a bow wave of hoped for projects, some of which will actually arrive later. I can understand how small projects appear preferentially in close-to years - there isn't that much effort required to bring them in.
What I do tend to see in this data, after smoothing out the above effects, is a ~500kbpd increase in new capacity each year. That's equivalent to a 0.6% increase in the overall production. Before we get all hopeful, that doesn't necessarily mean continued real growth. We have to account for the greater numbers of large old fields turning into decline over time, coupled with the short lives of smaller fields. In essence we would expect to have to see a rise in the addition of new capacity each year to deal with the increasing average 'age' of the fields.
Where does the balance lie? Which side do we fall on?
I think we can have some reasonable certainty that going back to ~2001 we could increase production. Let's say that we were adding 3Mbpd in megaprojects at that time and could count 1Mbpd as real addition.
By 2006 ~4Mbpd bought no real world production increase. That's 2Mbpd extra needed in 5 years - or 400kbpd/year needed. At that rate the 500kbpd from above is enough to generate a 100kbpd real world rise per year, or 0.1%.
In short, with some rough figures, it suggests we are running along the top of the plateau, and that we have the hope of staying there a good 5 years at least. Of course, it means no world growth, etc. - but its not knightmare real declines either.
Mind you, I didn't account for infill drilling and tertiary recovery in old fields which helped sustain production as well, and isn't counted here. That only works for so long before it gives out...
It seems that we will see some substantial supply growth in the next few years (excluding geopolitical events):
I don't know what to think from all of this yet. Looking at this chart, it seems that Peak Oil won't happen before at least 2015. However, I have the gut feeling that there is something fundamentally wrong with this methodology probably around the way we are forecasting production erosion from fields in production.
Do oil projects always come on line when projected and at the flow rates projected?
See my note below. I suspect that the gross decline rate is too optimistic and that the projections for new fields are also too optimistic. Every oil field that has ever produced one mbpd or more of crude oil is almost certainly in decline.
At a 6%/year gross decline rate (the upper end of ExxonMobil's estimate), we need about 4.5 mbpd of new crude oil production every year just to stay flat. At that rate, we have to replace 100% of current crude oil production in about 16 years.
Key point: these smaller fields that have come on line and that are coming on line will have sharper decline rates than the older, larger fields.
You might be right, but without evidence backing these assertions and more detail as to what degree you think things are too optimistic, such statements tend to be uninformative.
By how many barrels per day are they "too optimistic?"
What will global production be next year? If you can't answer this correctly than your opinion on gross decline rates is probably wrong.
ExxonMobil's estimate of the decline rate from existing wellbores of 4% to 6% is probably as good as any. As I noted, the smaller fields, especially in offshore areas, coming on line will have sharper decline rates.
I expect the worldwide net decline rate in crude oil production (C+C) to probably be between -2% and -4% per year.
That is highly unlikely. I would say there is a 10% chance of that.
But, please, be specific. Is this 2008 average versus 2007 average or Dec 2008 versus Dec 2007?
You will be very lucky if you acheive -2%. -4% would qualify you with amazing predictive abilities.
"Excluding geopolitical events". There you have those d*mn*d above ground factors again. Denial, euhm ,Daniel was right!
Decreasing depletion over time?
More than 1Mbpd less?
Something sounds wrong methinks.
PS so where was the >1Mbpd net this year?
We'll actually see depletion, as measured in absolute terms, decrease each year post-peak-oil, because we'll be able to extract less oil from the ground each year.
I think this is kind of premature given what we now know - I'm not sure our list quality is good enough yet to draw reliable conclusions, and in particular we need to understand the trends in the decline rates better.
You probably have a bug in whatever you are doing with the decline rate since the "Depletion" bars keep shrinking, even though your new supply is supposedly bigger than depletion (implying that the production base to get depleted would be bigger and that the depletion bars should grow, not shrink).
You're not having a good day here :-) At least your 2013 and 2014 project totals look plausible now :-)
Re: You're not having a good day here :-)
Probably right :), posting too fast. should double checked but don't have enough time!
my depletion bar is shrinking because I assumed -4.5% from 2003 production (79.16 mbpd). I assumed no depletion in the new supply added (obviously optimistic).
Well, I presume the overall depletion rate represents a weighted average of all the individual field depletion rates, and that there's always been a mix of newer and older fields, some declining, some not, contributing to that average. So I suppose you wouldn't expect the depletion rate to decline while production was increasing unless you think the new capacity has fundamentally altered the blend of new vs. old production to the point that you have lowered the total mean depletion rate.
Anyway, I should probably just shut up and let you hard core quant guys figure it out. I will, however, take this opportunity to add that I think this is among the very most important and compelling work being done here at TOD, and I will read all future results from this project with great interest. Thanks for all the hard work, folks :)
A reminder regarding definitions.
An oil field starts depleting the day the first barrel of oil is produced. The depletion rate is the percentage of URR produced per year. As long as any oil is produced, depletion is a long downward slide. And you have to define whether we are discussing total URR or remaining URR.
The production rate can increase, stay constant or decline.
And as the production rate increases, the depletion rate increases.
If we use Deffeyes' estimate of about 2,000 Gb of conventional crude oil reserves worldwide for URR, at the (so far) peak production rate in 2005, we were at the peak production rate, and we consumed about 1.3% of URR and about 2.7% of remaining URR (conventional C+C).
This is what led to my observation that, based on Deffeyes' work, we consumed, during Bush's first four year term, about 10% of all crude oil consumed to date, and during Bush's second four year term we will consume about 10% of all remaining conventional crude oil reserves.
I'm coming up with some amazing depletion rates 5% 10% and as high as 20% for some fields.
So I suspect that depletion rates overall are much higher then many people think.
My definition of depletion rate is the amount of time the field spends within 5% of peak production. Since most modern fields decline steeply post peak its not a huge issue. And it generally throws out 1-2 of ramp up.
So if your fields are lasting five year with the aboved definition your running a 20% depletion rate. This seems very common esp with all the small fields.
So I've I'm right most of the < 500kb fields drilled in 2000 should be in steep decline now.
I respect your enthusiasm, but "so I suspect" isn't a number we can do anything with. And "If" isn't an argument. I hope you understand my skepticism.
What are you coming up with for an average? And what is the data you are using? Many of us here would like to know this.
I think if Daniel Yergin said we are probably going to hit 90 million barrels in February, or if an Arabian minister gave a speech claiming they could easily pump 14 million barrels if war broke out next year, they would be met with challenges for the data and the models.
I don't think it is too much to ask the same of you.
I don't have a average I just do this calculation across any field I can find production data for. Graphical tabular etc.
I've spot checked over 20 fields. Generally I don't have production data you have to look at the graph and take the year when production maximized generally 1-2 years after startup and when it started collapsing.
Your lucky to get a field lasting over five years at maximum production rate. It really amazing how fast we can extract oil out of a fields these days.
And as far as rigorous goes I think any real data set we could present would be such a small set of fields it would be difficult to convince people they would extrapolate.
A lot of it is North Sea data some GOM etc and obviously its slanted. But these small fields consistently last least then 10 years and often less than 5.
This is the problem. The larger oil fields of the past lasted decades we are replacing this production with shortlived fields. This means each year the precentage of new production needed to offset declining shortlived fields increases. As far as I know any public data set that had this trend would be considered biased.
I knew I should probably have kept my mouth shut :)
What I was trying to refer to in whatever tangled mishmash of terminology I included in my last post was annual rate of decline in existing daily production, absent any new production coming online. So if you produced 100 mbd in one year, and had an annual production decline rate of 5%, you'd produce 95 mbd the next year. I thought that's what the 4.5% figure in Khebab's chart (which he labeled "depletion", hence my use of that term) meant, but it's quite possible I'm confused.
That is normally what we would mean by the decline rate. Specifically the "base decline rate" to distinguish the decline rate after accounting for new drilling in existing fields, etc, but before outright new capacity in different fields (which is what we are tabulating in the megaprojects page). However, Khebab in his graph has done something different, which is to only apply declines to all the production before the start of the graph (not likely a very good assumption over a decade or more).
I understand what you are saying, and you are right(in a larger sense), and I'm not trying to play word games, - but, technically this isn't correct.
Fields and regions tend overall on average to follow a "production profile" which consists of a (usually) steep ramp-up, a plateau/peak (of varying length), and a decline (impossible to describe in a sentence).
A distorted bell-shaped curve(although, if it is distorted it can't be bell-shaped, can it?). Distorted differently in every case, management and field/geologic characteristics are the key to the distortion.
Matt Simmons' powerpoints and book charts provide enough examples to show the variability in the overall production profiles.
My point was that production goes up, stops, and declines in that order and once (usually). It doesn't [randomly] "increase, stay constant or decline."
Probably too-long winded an approach to make sense. Yes, this is nit-picking. But if it is falling on jaded ears, then we certainly wouldn't need the New York Times to point out the difference between production and exports.
Check out the production rate versus time graph for the Yibal Field.
In regard to production versus exports, until recently even within the Peak Oil community, very few people were focused on net oil exports.
For the most spectacular example of ignoring exports, the Economist Magazine in 2006 stated that Saudi Arabia could maintain its then current rate of production for 70 years without finding another drop of oil, the implication being that Saudi Arabia could reliably supply oil for 70 years plus.
At their current rate of increase of consumption, Saudi Arabia would show a long term overall net export decline rate of about -10%/year, approaching zero net oil exports around 2036, even with constant total liquids production of 11 mbpd.
For what it's worth, at Saudi Arabia's current rate of increase in consumption, they would be consuming 108 mbpd in 2075, which is probably somewhat unlikely.
westexas,
would you have any figures that would give some sort of total to how much oil you think will increasingly be kept off the world market for national use. Also have you any thoughts on what effect a slowdown in world economy would have on how oil is distributed. More local than world or...?
Stuart,
I keep looking at these prices for oil at almost 100 dollars and wondering how fast those projects would disapear with a drop in price. How dollar sensitive are each of those projects? Could they be rated in some way? Maybe from AAA to subprime?:)
Oops gotta go now Bernanke helicopter is just approaching.
Oops again,... a quarter point and the punters aren't happy!!! But I am:) Colour me Bear
From todays Drumbeat
If those two things do not happen, oil prices will remain near historic highs and that is not good for anyone, including the producers, he said.
Gee willickers, producers don't like high prices? Now I am confused
Our middle case is that the top five net oil exporters (half of current world net exports) approach zero net exports around 2031.
I expect that we will see some extreme bidding wars, hopefully not involving weapons, for declining net oil exports.
Well, in the usual definition of decline rate (which would be applied to all production in each year), you have a decelerating decline rate. That doesn't seem too likely...
Paradoxically decline rates are both complex and simple.
Complex in the sense that no amount of data mining is going to give you a figure, if it did that figure would change every year anyway, decline rates vary hugely for a vast number of reasons (...and I could go on, but I'm sure you are well aware of these issues having studied them and attempted to come up with hard numbers).
Simple in that if you look at oil that is in decline all around the world and average it together you get a fairly stable number which you can use to predict future production fairly accurately from the same oil.
My definitions of "stable" and "fairly" are probably different from yours. I'm guessing I've set my bar higher ;)
Try this. I think the results will surprise you.
Take a very standardized, accepted yearly database like BP's. Take their excel database and sort the countries listed from highest to lowest in terms of yearly production. Now only use the top fifty.
Go through each one and mark those whose production has decreased for the last three years consecutively. 2004, 2005, 2006. No exceptions. No interpretations.
Now add-up the production for these countries going back to 1965.
This is your decline group. Tell me? What year did this group peak and start an irreversible decline? I get 1997.
What do you get for a decline rate? I'll bet they will decline by that much this year as well.
Now backtest the method. Don't use the countries that we just used, but use the method. For instance if we were to do this this(next) year, we would have to add Mexico.
What is the variation on all your decline rates?
I think you're missing the apparent fact that overall decline rate is increasing. Your 4.5% decline rate assumption is ok for 2005, but new production in 2007 is 6% of world total while overall net production is down a little... so, apparently we are looking at the decline rate increasing around .75%/year. If true, and if yours/stuarts 2008 new oil total is correct, then there is a glut of maybe 2mb/d in 2008, just enough new oil in 2009 to cover what would by then be a 7.5% decline rate, but not nearly enough new oil in 2010 to cover what logically would be a 8% decline rate.
On one hand the decline rate will obviously not increase every year forever, OTOH we may see substantially higher rates as giant on shore and smaller fields off shore hit high rates of up to 20%.
Look at the apparent change in decline rate over the past three years, then project this rate... things will then look worse than what your are showing with constant 4.5%.
As others have pointed out, however, this argument assumes that no one has been holding any spare capacity in reserve. If not everyone has their taps wide open, this logic starts to show cracks. The fact that it's starting to look like OPEC really has increased production by 500 kbd (or will once the UAE maintenance is sorted out) would at least tentatively suggest there was some spare capacity being held back. Time will tell I guess.
This seems like fairly big news for the TOD community. Is this data essentially saying we have not peaked and that peak could be off as far as 2015? If so in 5 years what will the megaprojects supply graph look like then? Will it show growing supply growth as well? Does anyone know what a graph like this would have shown back in 2000? I am fairly suprised at this but data is data. Just seems like a big turn from what I normally read on here and I just want to get into context.
I think both the data, and the way he's analyzed it, are too unreliable to support a firm conclusion on this point (which is why I didn't make my version of the graph Khebab just put up). a) the lists for future years and past years have been compiled by different people who may be at different stages of completeness, and may not have adequately harmonized methodology, b) the lists are definitely still incomplete, c) it's not likely that the decline rate is decelerating as Khebab has assumed. Check back in a few weeks - this is an interim progress report, we just aren't ready to draw final conclusions.
garyp
The calculations which you are making, make the critical underlying consumption that the annual liquids or oil production figures are equal to production capacity. In fact, apart from changes in storage, the production figures everyone are using equal consumption and not production capacity. Without addressing this issues the calculations are likely to produce incorrect conclusions, which will be particularly large when one is looking at differences. A priory, we have seen a plateau in consumption. Whether we have seen a plateau in production capacity is indeterminate. This is an often repeated error in TOD postings.
In the absence of gross shortages, production = consumption plus or minus changes in storage. Production does not equal production capacity.
We can be reasonably certain that non OPEC countries are producing at their maximum capacity - in order to make best use of the high prices.
As far as OPEC countries are concerned its possible that some are artificially restricting their supply in order to sustain high prices. Certainly there is the scope for 500kbpd increases, but it would appear not much more. However much of the discussion here is about the real hard supply limits which many feel are the reason behind much of the policy over the last few years.
We also have a reasonable body of evidence that there IS latent demand that is unfulfilled as a result of the high prices, when we look at the riots in developing countries over lack of supply and supplies to far east asia being reduced from agreed contracted levels.
Rough calculations like the ones above are designed as a sanity check, taking assumptions and feeding them forward to make a testable hypothesis. In this case the hypothesis is that the megaprojects and other predicted supply additions are going to make-up for declines elsewhere, and that the pace of this effort is increasing.
Thus far it fits the facts and the geology based expectations - it's a Red Queen's Race that gets worse over time as small and short lived fields make up a progressively large percentage of the total. For the hypothesis of production <> production capacity to hold true we would have to see a sustained rise in production to match increasing world demand. Every day that goes by on the plateau increases the probability that the first hypothesis is correct, and that the second is incorrect.
This game is one of probabilities, not certainties.
garyp I agree with everything you are saying. However I worry that the tendency of many TOD analyses and posts to simpluy ignore the difference between production and production capacity is something that will be a cause of significant errors and will result in unnecessary egg-on-the-face. I accept that there are at the moment very limited ways for people to asses reserve capacity. However, that does not make the issue any less important. Variations in withheld capacity of the size that might easily be occurring would significantly modify or substantially qualify many of the conclusions being drawn.
The current output plateau is a demand plateau - there is absolutely no way of knowing if it is also a production plateau, and I see no point in fudging the issue.
I agree entirely, that that current prices are causing fuel to be less accessible to the customer - but presumably that is exactly what is causing the demand plateau - price based demand alteration.
I am not arguing that considerations of variations reserve capacity invalidate the general drift of TOD arguments. On the contrary, I suggest that price is one surrogate indicator of (the inverse of) withheld capacity, and that if that hypothesis is correct, then the last couple of years have not been a period of plateau in underlying capacity, but have been a period of decline in underlying capacity.
In July 2004, the then editor of the IEA Oil Market Report, Klaus Rehaag, presented a slide show at a workshop in Rio, entitled "Is the World facing a 3rd oil shock?"
http://195.200.115.136/textbase/speech/2004/kr_rio.pdf
In it, there is a graph showing that 70% of oil fields are in decline and that depletion rates accelerate from 4 mb/d (7%) in 2005 to 7 mb/d (10%)in 2015 which would be an increase of 300 kb/d production loss per year
The long term net decline rate (net after new fields, workovers, enhanced recovery, etc.) for Texas and the overall Lower 48 has been about -4%/year and -2%/year respectively.
ExxonMobil put the gross decline rate worldwide from existing wellbores at between -4/year and -6%/year. On the higher end, we need about 4.5 mbpd of new crude oil production every single year just to stay flat, and ExxonMobil's 6% higher end number might be conservative, especially for some of the larger fields that are watering out--or as Matt Simmons put it, turning into "oil stained brine" producers.
See my post above. The more of the smaller projects we take into the database the closer we come to having to add those to the field decline rates which are much higher than 4% pa.
No.
What is claimed is that projects whose eventual capacity is 4.5Mb/d came online. That is not the same as 4.5Mb/d of current capacity.
It's virtually impossible for a project to produce at full capacity in a year in which it produces first oil - it would have to ramp up instantly and on Jan 1st.
In particular, if the amount of capacity per year has been increasing - and it has - then misinterpreting the data like that will systematically overstate the added capacity. Subtracting that artificially-inflated number from total capacity to get decline, then, will necessarily give you an inflated and unreliable value.
Or that spare capacity has increased. Since OPEC lowered its quotas substantially and has since increased them, that's a strong possibility.
At any rate, non-OPEC supply has gone from 49.7 to 50.3 (Oct to Oct, IEA), while OPEC supply has gone from 35.6 to 36.2 over the same period. Taking 4Mb/d as the capacity that should have come online in 2007 (i.e., first oil in 2005/2006), that's 1.2Mb/d net on 4.0Mb/d gross, or a decline of 2.8Mb/d on 86Mb/d - 3.3% - assuming no increase or decrease of spare capacity.
Interesting.
I see that Mexico announced that it would export zero oil to the United States by 2012.
I guess all this new oil will make up for that decline and the decline of other fields and the increased domestic use by oil producers.
Of course it will.
My guess is that demand destruction through a collapse of the world's economy will drive down use. Prices may be another thing as we spiral towards hyper-inflation. I see that the markets are anticipating yet another helicopter drop. Half a percent, the rumor goes.
Here, the most important thing is that certain peak oil timing factions be proved right or wrong.
Reminds me of Enrico Fermi, one of the most brilliant of the atomic scientists, who offered to take bets on whether or not the bomb would ignite the atmosphere.
"My guess is that demand destruction through a collapse of the world's economy will drive down use"
Aha, all above ground factors Cherenkov..
How much lag is expected between first production and peak production? It seems like it must be at least a couple of years.
When we look at total world C+C oil production, there were fairly large increases in 2003, 2004, and 2005, followed by small declines in 2006 and 2007 YTD. These increases in thousand barrels per day were as follows:
2003___2,280
2004___3,064
2005___1,295
2006____(263)
2007____(451)
The years with high first production are the ones with low total increases, so it clearly doesn't make sense to just map the production increase to the year the production came on line. Any ideas what the new data says?
A related question:
When I look at which countries have increases of 250,000 barrels a day or more in C+C according to EIA data, I get the following list of countries:
2003___Saudi Arabia____1,141,000
2003___Russia___724,000
2003___Algeria____305,000
2003___Iran___298,000
2003___UAE___266,000
2004___Iraq___703,000
2004___Russia___673,000
2004___Saudi Arabia___326,000
2004___Iran___259,000
2005___Saudi Arabia___449,000
2005___Nigeria___298,000
2006___None!
2007 YTD___Angola___252,000
How does this information compare to the data we have compiled? For example, was Russia showing lots of new capacity in 2003 and 2004, which has since tailed off? Or haven't they been good about reporting?
What kind of data has Iran been reporting? Does the data show new projects to support their big increases in 2003 and 2004, but lack of big projects recently?
Going forward, are there any countries that can reasonably expect increases in production (net of declines on old wells) of 250,000 barrels per day in 2008 and 2009? If not, it seems like we can expect declines in world oil production.
I haven't worked hard yet on Russian companies, and obviously we now know that the Petroleum Review lists should be viewed as a sample of unknown representativeness, rather than a complete listing. So I think it's premature to say too much on a country-by-country basis. Hopefully we can get there. However, the Saudi projects are pretty well known in terms of size, though we don't have as good a grip as I'd like on the ramp-up. Angola, Nigeria are probably fairly complete as most of those projects have been done by the majors.
We can do all kinds of amazing analyses once we have complete lists!
Gail,
Another explanation, is that what happened in 2006 and 2007 was simply a reduction in demand, as a response to the price profile over time up to that point. How can we tell the difference?
Production does not equal production capacity.
Production does equal consumption plus or minus changes in storage.
Stuart - I am new to the megaproject stuff but it appears to me that 'West Qurna Phase II' is booked to add 650,000 barrels to new production in 2007 and as far as I can tell this project is not even off the ground yet. Conoco Phillips have it booked as a 2012+ project and that may even be out the window if partners Lukoil have lost the contract.
http://www.conocophillips.com/NR/rdonlyres/529DEF29-3A4B-4E35-9CAA-31A97...
recent news items suggest development is a long way off ("Analysts have long said the West Qurna deal could bring benefits only in the distant future."
http://www.reuters.com/article/companyNewsAndPR/idUSCOL55148220071105?pa...
If this is correct it takes a big bite out of 2007 added capacity?
Yeah - I agree. I have a comment in to that effect on the Wiki talk page.
Good effort.Lots of leg-work.It's hard to measure from your charts(picking out same color),but it appears that some projects have different production amounts depending on the source you used.It would be usefull to have 3 bar charts of the prod from the same # of projects from the 3 dif sources.
Yes - in some cases errors have been found in the project size.
Is the vertical axis of the first chart mislabled? It says kb/d with single digit values. Should this be labeled "thousands"? Anyway, the vexing problem of how to balance all the new megaproject production with typical existing field decline patterns, the discovery pattern of finding big first, small later and all the factor interplay that happens in any large body of land is the main thing that Hubbert's math figures out for us. But it is Hubbert's model that gets ignored by most everyone portraying the new finds and projects and their implications for energy policy.
Yes - it's mbd. I'll try to remember to generate a new graph tonight with the correct label.
Stuart,
In the 2nd list of companies I can see quite a few with new projects developing. Mexicans, Norwegians. Maybe Russians? Iranians, and more.
Collectively with the smaller companies, some of which I never heard, the 2nd list will add significantly to the total.
Can this off-set declining old fields? I doubt it. And if it does, for how long? And if longer, will technology save us? I doubt it. Human behavior is not so easily altered. The window of opportunity is getting smaller by the day.
We need a crash plan NOW. Local agriculture, birth control, a 250% gas tax*, proper basic education, literacy & craftsmanship, reforestation. To start with.
No doubt this will not happen.
*Of my gas,66% vanishes straight in to the coffins of The Hague; this equals a 200% gas tax.
Incredibly good work. Before we start to think Jackson, Yergin et al are correct a number of points..
Depletion should be at least 4mbpd through to 2014.. Probably more at 4.5% of cumulative net.
Oil sands should be separated out as decline rates not relevant.
Chicontepec must be phased in.
70kbpd from phase 2 at Long Lake Oil sands 2011
http://www.longlake.ca/PDF/LLPhase2%20Brochure%20LR%209_web%20.pdf
Shah Deniz condensate has been revised down to 14kbpd http://abc.az/cgi-bin/wnews_one.cgi?nid=19111&lang=eng
Iraq production very tentative especially Taq Taq and Subba
Probably lots of other revisions due..
I think on the big picture looking back at the oil production curve , peak and all. We would see a mechanism like this, where the backside of the peak will be rather flat and with small net declines for im not sure how many years, 5 maybe? This would be due to oil producers starting to realize the incentive of higher prices and their small proximity to the peak. So maybe a lag to where we have a increase new production for a while to a point where the declines will start to become much steeper as new projects are more and more heavily outweighed by declines? What do you guys think?
Also I was thinking along lines with these mega projects of another mechanism related to the overall peak. It follows as price rises you have more and more incentive to find oil. It follows that that oil will be a lot harder to get to, therefore larger projects are required to get to that deep, or very low quality oil. The larger the project the more time required to build it and put it online. I wonder if the size of these large projects would prohibit them from catching up as fast as they'd need too. I suppose I'm talking about the same kind of thing with a shallow cliff and a steep plunge. How long that cliff is may affect how long we have to bring up other energy sources online, with cliff being defined by a relatively sudden increase in net production decline. I wonder when factors will come into play such as demand destruction, recessions and renewable/unconventional resources will play a role. Seems to me like the quicksand effect described by this, http://www.peakoilassociates.com/POAnalysis.html, as far as projects are concerned because the cost of production for the project itself will rise as production declines increasing the cost of energy. Oil producers will not have as much economic reason as one would think with high oil prices, due to the sheer cost of building these massive projects. I would like to look into this. What do you guys think though, what are the cost of these mega projects plotted against their expected return ect.
Sorry that was a bit scattered but thats how I think
Other posters here have previously made the assertion that accelerating decline is not what we should expect, basing that on the behavior of the observed US lower 48. However, this assumption appears to be discounting the potential change in shape of extraction curves due to EOR techniques, the high drive to extract as fast as possible from costly reservoirs (especially undersea reservoirs), the possible changing percentage of offshore versus onshore reservoirs, and the impact of higher profits on drilling activity generally.
Let's do a brief mental exercise and see if accelerating decline rates look reasonable or not.
First, we know from the data that global production has remained essentially flat from July 2004 to the present. This is the plateau that Stuart, Khebab, Ace, and others have so often documented. Second, we know that during this time frame the price of oil has more than doubled, from the mid $30 per barrel range to the current high $80 range (with spikes near and even over $100 per barrel for selected types of oil). Third, we know from both the Wiki project and Petroleum Review that the volume of new oil coming online from 2004 through 2008 has been increasing. Petroleum Review has a low of 1mbpd of new oil in 2004 rising to about 4.5 mbpd of new oil in 2007. The Wiki project has a low of 2.5 mbpd in 2003 rising to nearly 5 mbpd in 2007 then exploding to over 7mbpd in by the beginning of 2008 (that is over the course of 2007 which is now nearly over).
Clearly large price increases have not (yet) broken the plateau. Thus any new project coming online must be seen as only offsetting existing declines minus any deliberate reductions by nations like KSA. In order for the entire 4.5mbpd of new production last year to not be attributed to declines someone must demonstrate that existing producers chose to withhold over 4.5 mpbd of existing production in a market that is paying better than any oil market in 25 years. The only major producer whom we can argue may have voluntarily reduced production is KSA and by about 1mbpd. This therefore means that the remaining 3.5 mbpd are highly likely to have been used to offset declines in existing fields.
However, let's step back to 2004. In that year the lower bound of the argument (Petroleum Review number) suggests that 1mbpd of new capacity arrived online. There is no evidence that any major producer voluntarily withheld production in 2004 during a rising oil market. Thus the entire 1mpbd of new production was used to offset declines.
A popular figure is 3-4mbpd annually of declines that must be offset in existing fields. Retired officials from Saudi Aramco have used this number as well as other petroleum professionals ranging from the CEO of Schlumberger to Matthew Simmons. It's a widely accepted number. This would strongly suggest then that in 2004, about 2-3 mbpd of declines were offset by reworking existing wells using EOR techniques.
Fast forward back to 2007. If we assume that the 2-3 mbpd of decline offsets from existing wells is the same as in 2004, then total declines in 2007 must have been closer to 6-7 mbpd. We can derive this number from looking at the 4.5 mbpd of new production, the plateau in total production, subtracting out the 1mbpd of KSA reductions (generously assuming that ALL of it is voluntary - the situation is worse if not), and then adding in the 2-3 mbpd of reworked well production used to offset existing declines. For this not to be true we would have to assume that oil companies worldwide were voluntarily not applying EOR techniques to stop declines in existing fields. This is a completely unreasonable assumption.
This means that from 2004 to 2007 we have seen total declines go from roughly 3-4mbpd to 6-7mbpd. Thus it does appear that decline is accelerating and that opens up the question of why?
The area that I would expect to cause the most change in production profiles is the percentage of total global oil derived from offshore fields. The economics of offshore fields drive the producer of that field to extract as rapidly as possible, since the field is a constant (and high) fixed cost that appears fairly independent of the total volume of oil pumped. So pumping more faster reduces costs and raises profits. Thus a good question might be whether we are witnessing a change in the total global volume of oil produced onshore versus offshore. As I review the Wiki page there does not appear to be data indicating whether a particular project is onshore or offshore (and if offshore whether in shallow or deep water). This doesn't mean that a shift to offshore production is the explanation, simply one that I believe might be useful to explore to try to explain the apparent increase in declines.
If we can verify that decline appears to be accelerating and if we choose to explore the onshore versus offshore aspect, key questions to ask would include:
1. Is the percentage of offshore versus onshore production changing significantly?
2. What is the shape and lifespan of onshore versus offshore production curves?
3. If the answer to #1 is yes and the answer to #2 is such that the curves are steeper and/or shorter in duration, then we might be able to determine whether any acceleration in decline was a temporary occurrence due to the shift in types of field or whether it appeared permanent and independent of the type of field (onshore versus offshore).
Remember that it is possible that a short acceleration in annual declines is simply a mark of a shift in field types going from onshore to offshore. Thus an accelerating decline rate is not necessarily indicative of a problem unless the new offshore oil being discovered starts to fall significantly or if the decline rate continues to accelerate after the shift in field types is complete. That's what we would need to determine - is the acceleration an ongoing thing or just a temporary, transitional phenomenom; and is there enough new production going forward to continue to at least cover for the increased decline rates?
You're (at least) a year off in your accounting. The 4.5mbd in 2007 is projects that got first oil in 2007. Ie, in the aggregate they probably reach their peak in 2008 sometime (we don't understand the aggregate ramp up at all well yet). The 7mbd of new projects in 2008 is (supposedly) reaching first oil in 2008, and so the fraction that doesn't get delayed will reach peak in 2009 or so. Etc.
Furthermore, all totals in all graphs are for work in progress and likely will change (at least 2003-2006 I expect the gross new capacity to grow further, though I couldn't say how much).
All that said, my best guess at the moment is the accelerating decline trend is going to survive all this change. But that's really not too much more than a guess.
Interesting post, I had not thought of the whole onshore vs offshore thing till now. also would you agree the energy rate of return is less on offshore fields vs onshore fields, If we are indeed significantly moving towards offshore fields then I would think our net energy rate of return is decreasing, but I think that has been true since we stopped finding oil bubbling out of the ground. How do you think the cost of building an offshore rig will be affected by higher energy prices, do you think this means much? I mean the oil fields are not getting any bigger, but the cost to start producing them is going up, but so is the amount of income you can generate off of it, but your energy rate of return in decreasing. When do you think this will factor in?
Unless 2003 and 2004 megaprojects are revised fairly substantially upward, or we learn that there is quite a long lag in actual production versus the start date, I think that we will have to throw out 2003 and 2004 from a comparison basis. It may be that non-US companies back in that time period did not report very complete information about their mega-projects. The countries having big increases in production don't seem to be showing enough megaprojects, and this is somewhat disconcerting.
We do know that whatever level of new projects we have had in the last two to three years has not been enough to keep C+C production flat, according to EIA data. (There might be a small increase with IEA data.) We need a higher level of new projects going forward if we expect production to grow.
The fact that 2008 megaprojects are higher is a good sign, but we really don't know how much of this will really come on line in 2008. There are two
issues:
(1) Will the projects really start in 2008, or will they get pushed forward?
(2) Once they get started how quickly will they ramp up?
We don't really know how this will work out. We may get EIA production back up to where it was in 2005, or a little higher. This may still not take us off the plateau. At this point, there are a lot of things we don't know - including good decline rates. I think we should be careful about trying to conclude too much, too quickly from this data.
Well, it's not that mysterious any more. Everyone agrees that KSA had deployable spare capacity before some time in 2004, so obviously they were in a position to increase production without needing large projects to do so. Russia needs further analysis. One possibility is there were megaprojects and we just haven't found them yet. I now think this is quite possible. However, the other is that the Russian revival was entirely a matter of refilling existing Soviet capacity with unproduced oil. We will need to figure this out and account for these things, but that's no reason to throw the data out altogether.
I agree completely with that.
In 2003 and 2004, it is not just Saudi Arabia and Russia's increases that are not explained by the megaprojects list. Neither are the increases of Algeria, Iran, or UAE. Maybe you will run across some more projects in the reports you haven't looked at, but the current list doesn't seem to explain any of the increases.
I would like to suggest an alternate hypothesis, if you don't run across quite a few more fields in your later analysis. My hypothesis is that the financial statement data from 2003 and 2004 is not comparable to that for more recent years. National oil companies did not feel an obligation to lay out what their production plans were back then, and didn't, or at least not very completely. Now that everyone is concerned about future production, NOCs are much more complete in what they report.
Decline rates are the most complex part of this puzzle. Increasing offshore may accelerate the decline, but inceasing unconventional/heavy may decrease the decline rate. NGLs should follow a more "gas like" profile (long plateau with v steep final decline), and use of secondary tertiary techniques will have other effects.A good model should separate all these out!
I agree with GreyZone that the US 48 decline rate may not be applicable globally, and would add this reason - when the US peaked, the rest of the world was still growing. So while, yes, there was great pressure for the US to extract all it could domestically, that pressure was not absolute, as demand could be met with increased imports. Once the world has peaked, then the pressure on the US - as on any other country, region, field, company - to maximize production will indeed be absolute. No one will be able to compensate for the laggards, so to speak (see the posts of Westexas for excellent explication of this). Initially, this phenomenon may be masked, as those few regions still able to grow will make up for the many in decline. This may look something like a global plateau... So as I see it there are two tipping points involved. One, when the globe peaks, when this some growing, some declining mix is in tenuous balance. The second comes when the decliners outweigh the growers such that the mask comes off, and global decline sets in. It seems likely at that point that geology in concert with those pesky 'above ground factors' will yield decline rates greater than seen by individual regions pre-peak.
I'll also add, as others have raised herein as I have before, that what's really important is the net energy available to society. As we go into deeper water, and use heavier oil - even sand and shale - EROEI declines, and the net available shrinks. Again, as others have pointed out, this has been happening since oil stopped bubbling out of the ground. We face global gross decline, decreasing EROEI, declining net exports and increasing population (not to mention Peak Everything else as Heinberg describes). 2%, 4%, 6%, 8%... pick a number, then factor it by all these other factors to get a truer picture of the future.
IEA data says oil supply in July/04 was 83.37Mb/d, as compared to 86.43Mb/d in Oct/07. That's 3.06Mb/d in 3.25 years, or 1.2% annual rate of increase.
EIA data says oil supply in July/04 was 84.18Mb/d, vs. 84.93Mb/d in Sept/07, which is a 0.3% annual rate of increase. The IEA data showed a 1.4Mb/d jump from Sept/07 to Oct/07, though, and a similar jump in the EIA data would put its rate of growth at 0.8% per annum.
So proved global production capacity has expanded quite significantly since July/04.
And hence a failure to adequately account for the delay between first oil and full production will necessarily look like an increasing decline rate, simply because the amount that is mistakenly being counted early will be increasing.
October oil supply was the highest ever, and November oil supply looks like it has a good chance of challenging that record. The situation is not as clear as you suggest.
Faulty assumption.
We know for a fact that projects whose first oil is in 2007 will not add their capacity to 2007's annual average - they'd have to instantly start producing at full capacity on the morning of January 1st to do that. Making that known-false assumption means that overestimating the decline rate is inevitable.
If we take into account the fact that projects take time to reach full capacity, the "missing" production is immediately accounted for - it's pushed off into the future.
Because that's a necessary result of the false assumption you're making.
To make this clear, consider an example. Assume world "lio" production is 100, that yearly decline is 1, and that total projects having first lio in a given year are 1 in the first year, 3 in the second, 6 in the third, and 10 in the fourth, and 0 in all subsequent years.
Assume that each project takes 2 years to reach capacity (linearly increasing), and gets first lio on the first day of each year.
In year 1, you'll see 1 unit of production removed over the course of the year (decline) and 0.5 units added (first half of the projects that started that year), for a net decline of 0.5. You'd account that as a decline of 1.5, but we know the true decline is 1.
In year 2, you'll see 1 unit of production removed over the course of the year (constant decline), and 2 units added (second half of previous year's 1x projects + first half of this year's 3x projects), for a net gain of 1. You'd account that as a decline of 2 - we were "supposed to" add 3 this year - even though we know the true decline is still 1.
In year 3, you'll see that same 1 unit removed for decline, plus 4.5 units added (second half of 3x + first half of 6x), for a net increase of 3.5. Since we were "supposed to" add 6 that year, though, you'd account that as a decline of 2.5 - oh no, accelerating decline! - even though we still know the true decline is a constant 1.
Year 4 will see 1 unit of decline + 8 units added = 7 units of increase vs. 10 units that had first lio that year = decline of 3 by your accounting.
Year 5 sees 1 unit of decline + 5 units added = 4 units of increase vs. zero that had first lio in that year. Your method of accounting would tell us that decline had suddenly gone negative, and lio wells were spontaneously improving!
Decline rate stays utterly constant throughout, but your method of accounting becomes consistently more and more wrong.
***
The accelerating decline rate you see is precisely the mathematical signature of a faulty assumption regarding when the added capacity comes online. Since we know for a fact that your assumption in that regard is indeed faulty, we should hardly be surprised.
If you're trying to investigate whether decline is increasing or decreasing, you absolutely need a very solid model of how quickly these new projects come online. Without that information, there's essentially nothing you can say.
Careful, my friend. Greyzone has set his sites on you. And at TOD it seems facts, good logic, and a persuasive argument and 10 cents (scratch that) - $1.75 will get you a small coffee.
I totally agree, and "writerman" thinks I'm a sockpuppet. His evidence is that I agree with you. Can I use the same logic to implicate 100 people here with "sockpuppetness."
Like Steroid use in baseball?
Writerman?
Greyzone will never actually respond to your challenges, that's why I decided it was safe to fill in. He's purely hit and run.
You're right, there is nothing he can say.
I have been reading the oil drum for more than a year now and never found a reason to post. I want to get more involved somehow. So I guess posting is the first step.
Stuart,
This work is some the most enlightening and interesting work done on the oil drum today. I want to say keep up the good work. Seeing knowledge created out of chaos is absolutely fascinating. This information should be much more transparent and readily available so we can truly plan for the future.
Thanks for all you do.
Phil Jonat
Thanks for the kind words, and welcome!
Thanks so much Stuart and all who put this post together. To many people sit and wait and talk, this is precisely why were starting to face so many problems in our day and age, but theres hope and inspiration when people like you do stuff like this. Thank you
Thanks, Stuart and everyone working on this project. Great job. Back in early 2006, I did my own analysis and came up with a peak liquids number of 88mbd in 2008. Watching the production numbers in 2007, I didn't think we would make it. But then the November numbers surprised us, and I thought 2008 very well could be the peak year.
When I did my research, the year that stood out was 2008 because of the mega projects data. 2008 is the last year when we see a big jump in new production, then we start downward.
I've read TOD nearly every day for nearly 2 years. This is the first piece that seems to shed light on what we can expect. Lately we've been watching the production numbers and waiting for confirmation. Well, this data pretty much confirms that we will trend up a little next year.
The decline number is also starting to show itself, and it is clearly accelerating. I think this data (when Stuart and friends are finished) will show that we are already past 5% and heading to 6% in 2008. We are probably looking at an annual increase of at least .50 and maybe .75.
The decline rate is going to be so significant, that by 2009 we will definately be on a plataeu that is trending downward. By 2010 we are looking at shortages and high prices. Beyond that it only gets worse.
These numbers may imply a huge influx of new projects, but I wouldn't bet against the export land model and the decline rate once we get to 2010. We have two more years of abundant and affordable oil. After that we are pretty much screwed and have to remodel society.
Sure a serious recession could slow demand, but don't count me as optimstic once we get to 2010. I'm going to enjoy the next two years and revel in abundance. We are the generation who will recall when the gas stations were full.
Oh, and I will continue to read TOD and inform myself of the changes that need to be made to society. I will try to get an education and pass on that information. Isn't that why we are all here?
Thanks,
Newager23
Unfortunately, I only qualify on the third category of your "appeal."
But I'm willing to team up with any 1st and 2nd category TODers on this project.
Any takers?
When looking at additional production we need two major factors.
First we need to include price: This "high price inviroment" as they call it, that has made a lot of projects doable will give you the impression that there is lots of oil around the corner or soon to come on stream. This will surely be limited as the number of rigs is limited, some projects still haven't got the rigs to make them happen.
I cant help to wonder how the "new capacity" can increase with constant rigcount and an established trend toward smaller new fields.
Second, but surely worse, we need to look at psychology among oilproducers. After all they are only humans...
My biggest fear is not the geological limits to oilproduction but the limited incentive to produce once it is established that we are past peak.
We dont even need to be past peak for this scenario to happen, we just need to be confirmed past "peak cheap oil"
Once the oilproducers realize that oil will be much more expensive a year later they will only produce what they need. Suddenly they will use an entirely different model to maximize the value of a reserve.
By producing at a lower rate they will suddenly increase the URR of the field measured in barrels, but also the net present value of a reserve will be higher if produced slower.
If you know for certain that oil will be 10% more expensive next year, then why would you ever pump the oil, sell it and buy bonds that only yield 5%
The countries that need the revenue will probably keep producing if they can't lend the money they need, but countries with savings to use or countries currently saving, will surely keep the oil rather than any kind of money/bonds/stocks they could trade it for.
Just ask yourself if you would sell your oil if you didn't REALLY need the money.
If I was sitting on a few billion barrels of oil in an established post peak invironment I would do anything possible to spend my savings and even take a loan before selling my oil.
Imagine what kind of drop this would give to production!!!
If you dare you might even consider what this would do to the USD as this is the most used currency for savings among oilproducers...
I would much rather hold NOK than USD! Maybe even DKK.
I wonder if the DKK will keep its peg to EUR?
Denmark is after all a net energy exporter with net savings.
Actually I believe Denmark won't be the worst place to be as we have lots of knowhow in the areas of energyefficiency and companies like Vestas, Rockwool, Novozymes and Danisco.
If you think the USD is currently under pressure you haven't seen the beginning. Soon nobody wants the USD, and if KSA starts spending their savings China will surely follow.
It is not the first few percentages of missing oil that will make this ugly. It is the following change of mindset!
Rune
What is even more scary is that we are so close to max production that all we need is KSA to say "we won't sell for anything less than 200$" to get this thing started.
If KSA wouldn't sell for less, would anybody else?
Is this what is happening these days?
As we are entering sellers market in oil why would anybody believe in falling prices? They will surely see how high we can afford to go before demand destruction will set in.
If 200$ oil would reduce oilconsumption 20% OPEC would make the same revenue with half the use of resources.
Surely makes sense to me.
I am not in any doubt that OPEC is currently testing us.
Soon they will go for the big hit.
Scares the crap out of me...
Rune
Since I assume you're Danish I also see that you don't GET IT.
Oil scarcity means War. The USA will go to war to get oil PERIOD.
We own KSA. If they screw us we will take the oilfields. Why do you think we are in Iraq?? We are the only major power in the ME right next to all the good fields. Is your Denmark there?? no.
In the coming oil wars you will be small fish and easily taken just like the 1940's.
Remember, a wounded bear is the most dangerous of all...
Dear Korg
Maybe we get it after all :-)
Actually Denmark is both in Iraq with the coalition and in Afghanistan with NATO at the moment trying to save the world long distance.
According to the US gov: http://www.state.gov/r/pa/ei/bgn/3167.htm
As the locals do not seem to appreciate it we will probably go home some day and spend our efforts elsewhere.
Apart from that. Being a small independent nation for > 1100 years have taught us some survival skills, not quite forgotten.
Now back to megaprojects. Thanks to all in TOD's for another fine thread. Mostly lurking here I can tell you that you have a real impact on the energy discussion. Just try to "google images" with "peak oil". Now more than 50.000 images! mindblowing.
Kind regards And1
I had one thought about this "We'll just go and take it all by force" scenario last night. Suppose the non-US oil producing nations collectively decide that that behavior is beyond the pale? Suppose they all decide to stop selling any oil to an overtly hostile America that has abandoned all pretense and is attacking major oil producers one by one? I wonder how long the mighty US military would be able to function effectively in such an environment? 6 months? Less? Wars require a lot of oil.
As And1 said, we ARE in Iraq.
The Coalition is Denmark, UK and US. But this is surely besides the point.
I agree that the oil in Iraq made it more important for US to enter Iraq, but I am very sure that it will not be an acceptable cause alone no matter how much the US need cheap energy.
My points:
* Oil production falls when a country is occupied
* Non occupied countries would sell their oil to the former customers of the now occupied country
* There are too many USD around the would to let US win a bidding war
* The american people would not accept oil as the only reason for war if this would bring them against NATO big time.
Remember if you go get the oil with force you will be lucky to get even half the oil currently produced, as the industri would be sabotaged just like it happens in Iraq.
This would bring you right back to square one.
The very second you have secured oil from any occupied country you would loose the oil elsewhere. If you take the oil from Iran, KSA or anyone else by force you will be outbid on the canadian and mexican oil.
The USD would be useless in a bidding war as sellers already have more than enough USD.
China has even more USD to spend on this.
You get oil from several different sources and to secure that flow you would need to secure them all.
Do you imagine The US to take on (list of top exporters to US)
Canada, Saudi Arabia, Mexico, Venezuela and Nigeria.
These top 5 exporters to US gives you 68% of your imports.
Lets just think that a country (IRAN) produces 4 mbpd, you take it by force, and get 2 mbpd.
But you just removed 2 mbpd from world production, and the people who used to buy the oil in Iran will now try to buy it in Canada and Mexico. These two countries currently provide the US with 3 mbpd.
The rest of the world is now 1 mbpd short and you are 1 mbpd short too.
Besides the massive costs to the war and unpopularity amongst everybody else.
Do you think that you could keep up imports from non occupied producers?
If the US were to go and get enough oil to maintain domestic use, this would be of great cost to everybody else as there would be NO oil to anybody else and the US would be very much alone in this game.
The US army is big, no doubt, but not big enough to take on the world...
I feel quite safe here in Denmark that the world society would not accept anybody taking Denmark by force.
If anybody were to take on Norway, Denmark or UK the whole world would be a mess. You are right about that, I JUST DON'T GET THAT... Do you?
In this case I am quite sure that China would use their trillion USD savings to prevent this simply by crashing the american economy.
The US might have a big military, but china has a financial weapon that could criple the US.
The unrest in the US would be worse than anything you can imagine.
The US could easily be selfsufficient if they reduced the consumption 60% :)
Once PO is established we will see demand destruction and crashplans to make this solvable.
Actually I think this is the only place the US has an advantage as you are currently waisting so much oil that savings will be easier.
The efficiency gains possible in Denmark are way way way smaller...
Rune
Actually Korg
I think here you almost get it.
I don't know a lot about all the ins and outs of oil but one thing I am somewhat sure of, or kinda sure of, or a bit sure of is that it is not about the USA getting oil, it is about it controlling oil.
That might sound like semantics but if you control oil you control the world and all the things and thingies in it:) Even Korg .
Now since you mention the USA, how much of the USA is really the USA?
Let's have the 50 or a 100 families who control the USA please stand up and take a bow, and let's ask them how much oil do they need to keep them happy?
"hmmm that's not much, just enough to control all the oil in the world and so everyone in it?"
"hmmm that seems reasonable, as like you say 'The People' didn't seem to need any at all before oil. Sort of a little unfriendly though, eh?. They'll get used to it you say?"
"Well let's see."
"Okay now, will all the millions and millions of American peasants please stand up and grovel a bit. Right on, you are learning that well."
"Oh very good Korg , that was a most beleivable tug of the forelock. Excellent! Excellent!
Not to increase oil production, apparently - it's down about 20% from pre-invasion levels. Indeed, US oil imports from Iraq are similarly down compared to pre-war levels.
So either (a) the US didn't go to war for oil, which invalidates your assumption, or (b) going to war for oil doesn't work. Either way, there's no evidence that anyone's apt to try something like that any time soon.
Or (c) going to war for oil is a ruse for maintaining influence over an oil producing region, damned be the consequences, in which case the results have been "favorable" even if they may not look to be so in the short term.
Hi Rune_Friis,
About your statement, Imagine what kind of drop this would give to production!!!. I do and I love the thought, but I think that would also drive a wooden stake into the heart of the Capitalist marketplace and the price of oil would drop like a gut-shot buzzard.
As well, I too have an imagining and mine is that we have very long plateau of oil production and, for form's sake, produce a few 'environmentally friendly' energy sources. We will still use all the oil, all the coal, all the FF and in that process produce enough CO2 for one honking great global temperature rise. So there we will sit muttering in our beards, with not enough energy for a cooled round of beer to weep into.
BTW Hope you haven't bought into any subprime mortgages there in Denmark, that is even worse than buying dollars:)
Also BTW, I wonder of there is not some fixing of prices by something out there, in order to get those last drops out of the ground, but that is another conspiracy theory isn't it?
Since oil is up very very high on the need to have, I don't see demand going away no matter what happens. Surely demand will fall, but a 10% decrease in consumption could easily be managed since the same would aply to ALL producers and stil maintain high prices.
Remember that we only need to raise the price on exported oil... The oil producing countries will keep oil artificially low to support own economy.
And talking about prices, what currency should we measure a price increase? USD, Euro or yuan?
Measured in USD the oil could go much higher without hurting the europeans og chinese if the dollar continues its free fall.
If we talk about Denmark, they could easily remove som of the taxes on oil, as the lost revenue from petroltax would be returned as higher profit from the NOC.
We are already paying 8 USD/gal. So don't start a bidding war with us :)
Maybe they should rather say "we won't sell for any less than 200 USD or 100 EURO...
BTW, I sure hope I haven't got any money invested in subprime debt, and I am very happy to be short a load of USD.
Rune,
There is actually an interesting precedent. When I used to follow the issue some years ago, gold production in South Africa would drop every time the price of gold went up. That was due to a government policy to maximise cumulative gold production in the long term. Higher gold prices meant that existing mills could afford to process lower grade ore, result in lower gold output.
In the case of oil, I think the issue faced by producers, including ones outside of OPEC, is much more digital. On balance of probability, once there is a significant and annually increasing shortage of oil compared to 'intrinsic' demand, the oil price will go up to something like $200-$300 a barrel, for a decade or two.
So if you owned the oil, what would you do? Work around the clock to avoid that time arriving, or, perhaps discretely, put less effort in so that you had more oil to pump at three times the current price, quite possibly within the next five years?
I believe this is what is happening right before our eyes...
Why anyone would exchange oil for any fiat money today if they dont need the money is beyond me!
Especially when you know that accelerated production decreases URR...
Wonder why we can still get oil for IOU's
The November issue of the IEA report (P24) states that Non-OPEC supply growth for 2008 is expected to be 1.073 mb/d. The Non-OPEC growth shown in Figure 5 above (Opec, Non-OPEC growth) shows a gross growth of about 4.3 mb/d for 2008. Assuming that the IEA has a good data base and a good handle on schedules, to make the figures balance, we need either a 6.4% decline rate in the Non-OPEC countries (assuming 50 mb/d of production) or that a number of the 2008 projects will be delayed into 2009.
The IEA Medium term oil market report published in July 2007 gives the following projections for Non-OPEC production
2008 51.0 mb/d
2009 51.6
2010 51.9
2011 52.2
2012 52.6
Note that the Nov 2007 issue has updated the 2008 number to 51.2 mb/d. Based on the original data, the IEA is only projecting a total net growth of 1.6 mb/d between 2008 and 2012.
IEA states the following:
"We revise downwards the non-OPEC forecast by 0.8 mb/d in 2011, partly reflecting slippage, but also incorporating a new 0.4 mb/d contingency factor, reflecting a tendency for unscheduled field outages. Supply-side uncertainty is further exacerbated by increasing instances of resource nationalism and geopolitical risk, constraining the ability of the industry to produce the 3.0 mb/d of new production needed each year to offset the effects of decline. Overall, this leads to average non-OPEC supply growth of 1.0% between 2007 and 2012, 0.4% below the growth seen in the previous seven years and roughly half the rate of demand growth projections."
Since the IEA is indicating that the decline rate in the Non-OPEC countries is about 3.0 mb/d, (6%), this is consistent with what is needed to get a net growth of about 1.1 mb/d in 2008 from the mega projects listed above.
Isn't it a bit arbitary to plonk the full capacity of these projects coming o line within a calendar year? Would the model
be more accurate if you added a date on-line and a ramp up factor (Intuitively I would think larger projects would ramp up slower). Also I get the feeling you could then model resource constraints to the increases (how fast can they built the suckers). Looking at the graphs I'll be surprised if 2008 is the bumper year that they predict.
Neven MacEwan B.E.
From the piece:
Stuart
Sorry to waste your time, I missed this bit. Another point is would it be worthwhile keeping "snap shots" of this data, because It could quantify the propagation of the "soon" production. What I mean by this is I predict you will always find a peak in the first year estimate as projects that get delayed are put in the "just around the corner" category.
Neven
Yes, I've been wondering about that effect. It seems to assess that we'd have to trawl through old press releases/annual reports and a build the delay history for a sample of projects.
hi Stuart
since they're in my neck of the woods, i'll try and look through woodside and santos annual reports for the last few years. that might be two off your list..
cheers
phil.
Thanks!
Dear Stuart,
This is a brilliant, as well as huge effort. Thanks and congratulations to you and everyone else who contributes to the Wiki. But please remember my tag line when trying to come to conclusions about production capacity changes.
'Production equals consumption plus or minus changes in stroage. Production does not equal production capacity.'
So whats your take, when and what conditions, different of what we have seen 2002-2006, will bring that hypothetical spare capacity onto tankers?
"I can produce a lot more oil, but I aint gonna do it" "until . . ."
Oil is really expensive. Has happened.
Political pressure to produce more. Checked.
Wars. Ok there are a few.
Competition starts with renewables. Underway.
Peak oil is leaking out. Happening as we speak.
So, whats left to bring that spare capacity onto market?
Gimme something. When is it coming to a fuel depot near me?
Segeltamp,
I am not arguing that there is lots of spare capacity out there. My point is only that variations in reserve capacity, difficult as they are to deal with, have a material effect on the position, and should not be ignored.
As I posted in another elsewhere, if oil price over the last few years has been a rough indicator of spare capacity, then spare capacity has been in decline , and what we have observed as a plateau in production/consumption, is masking an actual decline in underling available capacity, and the supply outlook is worse than is being assumed.
Equally, if magically 4 mbd of new production in excess of underlying declines becomes available over the next two years, one would not necessarily expect production/consumption to jump by 4 mbd, one might expect that reserve capacity would go up, and that the price came down.