Food Price Inflation
Posted by Stuart Staniford on December 17, 2007 - 10:58am
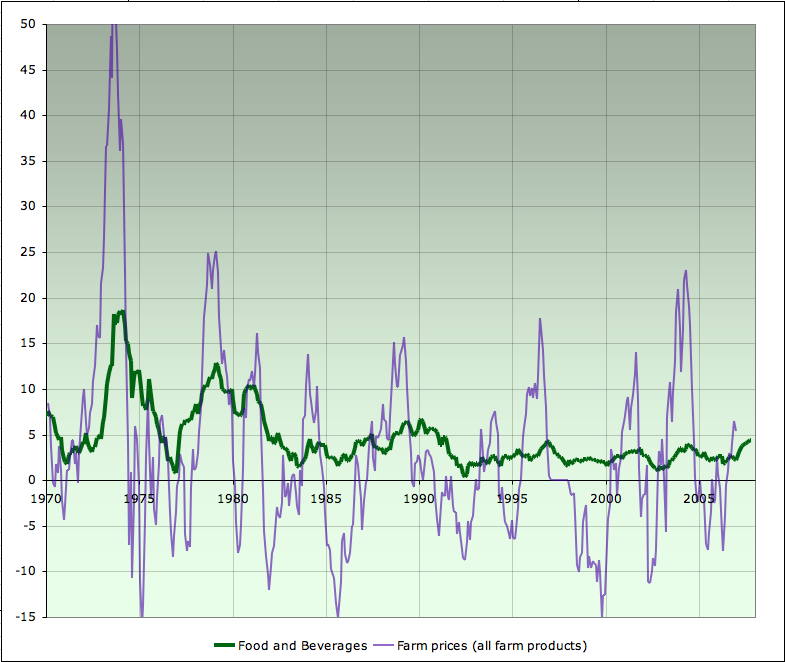
Year-on-year percentage change in monthly consumer food prices and prices paid to farmers (average across all farm products) Jan 1970 - October 2007. Source Bureau of Labor Statistics, and National Agricultural Statistics Service. Graph is not zero-scaled. Click to enlarge.
Let's start by looking at the last almost 50 years of consumer inflation in the United States. I have separated out energy, food and beverages, and everything else (this last is often called "core" inflation by economists). In this graph I am showing the percentage change in prices from 12 months ago to the current month:
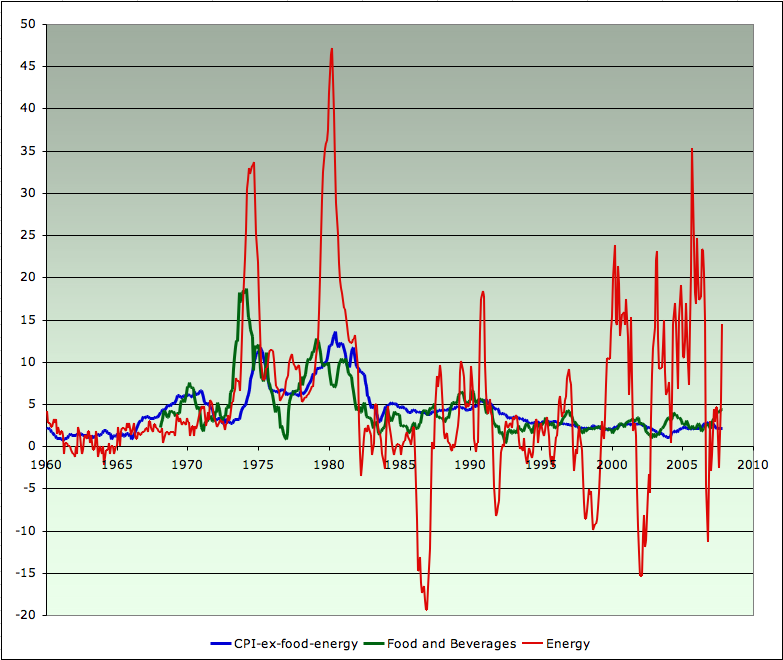
Year-on-year percentage change in monthly energy prices, food prices, and the rest of the CPI inflation basket Jan 1960 - October 2007. Source Bureau of Labor Statistics. Graph is not zero-scaled. Click to enlarge.
This next graph is the same, but zooms in just on the period from 1978 to now, and with some of the full range of the energy inflation cut off. I have also emphasized the green food curve more heavily, and made the red energy curve partially transparent, to allow food to be seen more easily:
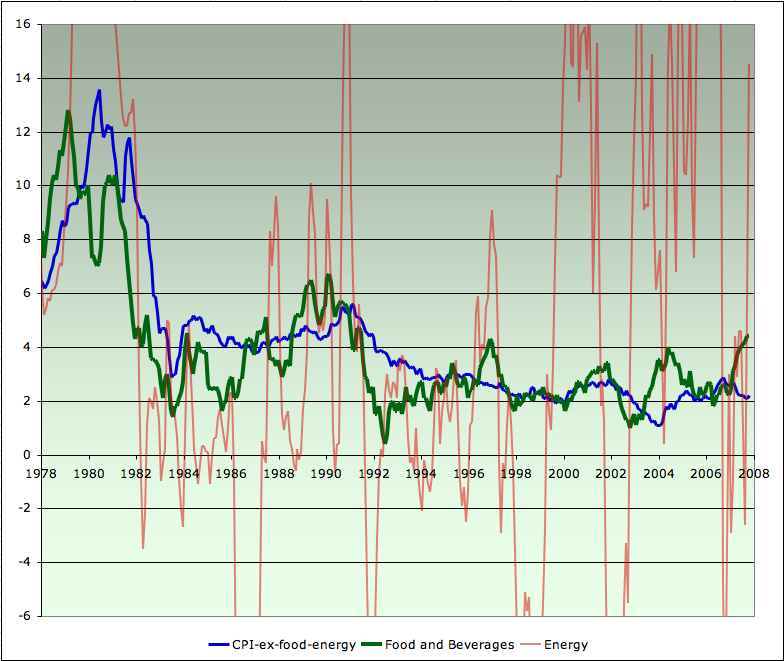
Year-on-year percentage change in monthly energy prices, food prices, and the rest of the CPI inflation basket Jan 1978 - October 2007. Source Bureau of Labor Statistics. Graph is not zero-scaled. Click to enlarge.
I next explored farm prices by looking at the National Agricultural Statistics Service statistics for average prices for all farm products. I've plotted the yearly changes in that basket on the same graph with the consumer food price changes:
Year-on-year percentage change in consumer food prices and prices paid to farmers (average across all farm products) Jan 1970 - October 2007. Source Bureau of Labor Statistics, and National Agricultural Statistics Service. Graph is not zero-scaled. Click to enlarge.
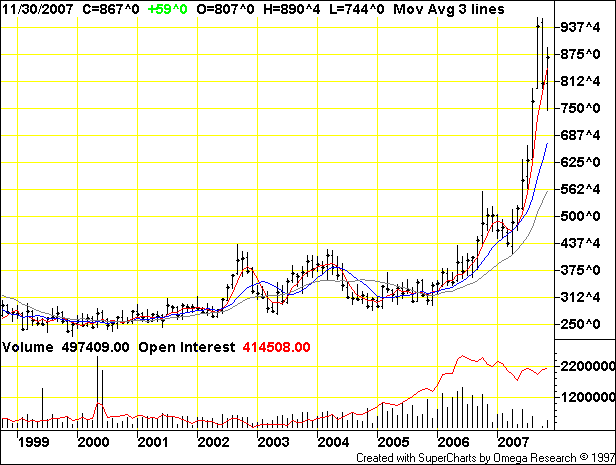
Unfortunately, the NASS all farm products price series only goes through the end of 2006. That conceals what is probably a significant spike in prices in 2007, centered in grain prices.
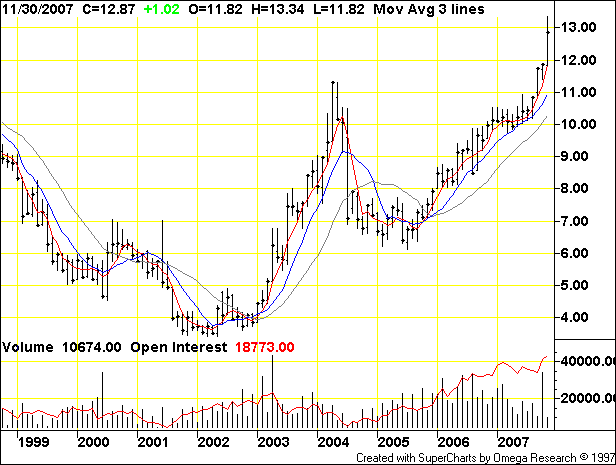
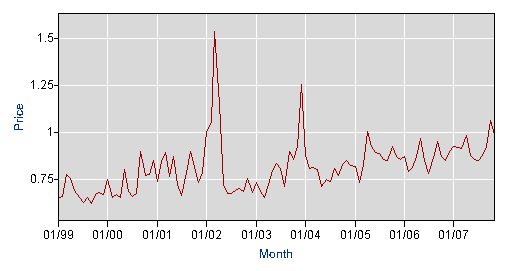
Here are corn prices (and now I'm switching to price levels (of futures contracts) rather than percentage changes.

Monthly corn prices on the Chicago Board of Trade, 1999-present. Source TFC Commodity Charts. Graph is not zero-scaled. Click to enlarge.
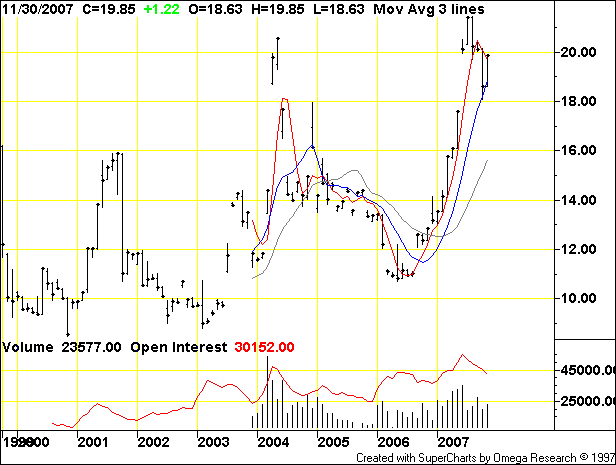
Monthly wheat prices on the Chicago Board of Trade, 1999-present. Source TFC Commodity Charts. Graph is not zero-scaled. Click to enlarge.
Monthly rice prices on the Chicago Board of Trade, 1999-present. Source TFC Commodity Charts. Graph is not zero-scaled. Click to enlarge.
Among major cereals, this season’s main protagonist is wheat, the supply of which has been hampered by production shortfalls in Australia, a major exporter, and low world stocks, while demand has been strong, not only for food but also feed. In September, wheat was traded at record prices, between 50 and 80 percent above last year. Maize prices increased progressively from the middle of last year until February 2007, when they hit a ten-year high, but have fallen considerably since. Supply constraints in the face of brisk demand for biofuels triggered the initial price hike in maize prices. However, reacting to a massive expansion in plantings and expectations of a record crop this year, prices have started to come down, although by September they had still remained 30 percent above last year. Prices of barley, another important cereal, also soared lately. Supply problems in Australia and Ukraine, tighter availability of maize and other feed grains, compounded with strong import demand, have contributed to the doubling of prices of both feed and malting barley in recent weeks.Here's milk, at the center of the dairy sector price increases mentioned above:The tightness in the grain sector also affected the oilseed complex, which witnessed a year-on-year price surge of at least 40 percent, depending on crops and products. Soaring maize markets during the second half of the previous season contributed to keeping oilseed prices at high levels as maize plantings expanded at the expense of oilseed plantings. Due to the expected shrinking of world supplies and historically low inventories in 2007, in the face of faster rising demand for food and biodiesel, as well as unusually strong demand for feed, oilseed markets are experiencing further increases in prices in these early months of the new season.
Among all agricultural commodities, dairy products have witnessed the largest gains compared with last year, ranging from 80 percent to more than 200 percent. Higher animal feed costs, tight dairy supplies following the running down of inventories in the European Union and drought in Australia, the suspension of exports by some countries coupled with the imposition of taxes by others, and dynamic import demand are the main factors that have sustained dairy prices at historically high levels.
Monthly milk prices on the Chicago Board of Trade, 1999-present. Source TFC Commodity Charts. Graph is not zero-scaled. Click to enlarge.
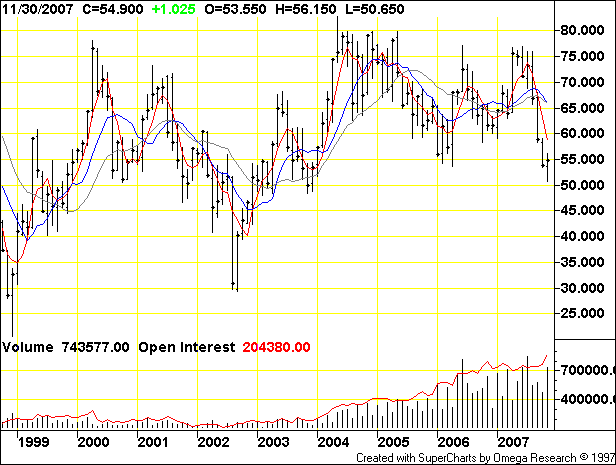
Monthly lean hog prices on the Chicago Board of Trade, 1999-present. Source TFC Commodity Charts. Graph is not zero-scaled. Click to enlarge.
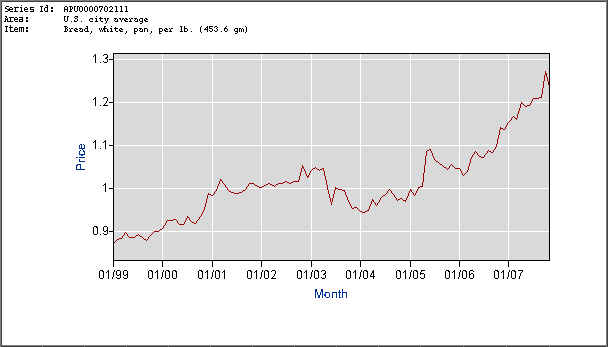
Monthly price of white bread, Jan 1999 - Nov 2007. Source Bureau of Labor Statistics. Graph is not zero-scaled. Click to enlarge.
Monthly price of iceberg lettuce, Jan 1999 - Nov 2007. Source Bureau of Labor Statistics. Graph is not zero-scaled. Click to enlarge.
However, it's another story altogether in the developing world, where a massive tragedy may be in the early stages of playing out if the trends of this year were to continue. Very poor people eat far less processed food, and rely very heavily on cereals, so they are much more exposed to the price rises in grains than western consumers. I haven't been able to find any statistics on diet/hunger that are recent enough to show the effects of this year's price rises, but we can engage in some speculation based on long standing patterns of diet. For example, here's consumption of major food groups in a very poor nation, Bangladesh:

Consumption of major food groups in Bangladesh 1964 - 1996. Source FAO Nutrition Country Profile for Bangladesh. Click to enlarge.
Rates of malnutrition in Bangladesh are among the highest in the world. More than 54% of preschool-age children, equivalent to more than 9.5 million children, are stunted, 56% are underweight and more than 17% are wasted. Although all administrative divisions were affected by child malnutrition there were important differences in the prevalences of the three anthropometric indicators...It's not hard to imagine that sharp increases in the price of grains will have immediate and significant effects in worsening the situation of people already so vulnerable.Bangladeshi children also suffer from high rates of micronutrient deficiencies, particularly vitamin A, iron, iodine and zinc deficiency. Bangladesh should be commended for making significant progress in reducing vitamin A deficiency (VAD) among preschool children over the past 15 years; however, consumption of vitamin A rich foods is still low, suggesting that the underlying causes of VAD require further attention and support. Anemia is also highly prevalent among children in Bangladesh and few programs have been initiated to improve their iron status...
Malnutrition among women is also extremely prevalent in Bangladesh. More than 50 percent of women suffer from chronic energy deficiency and studies suggest that there has been little improvement in women's nutritional status over the past 20 years...
Closer to home, here is the diet of a less destitute country, Mexico:
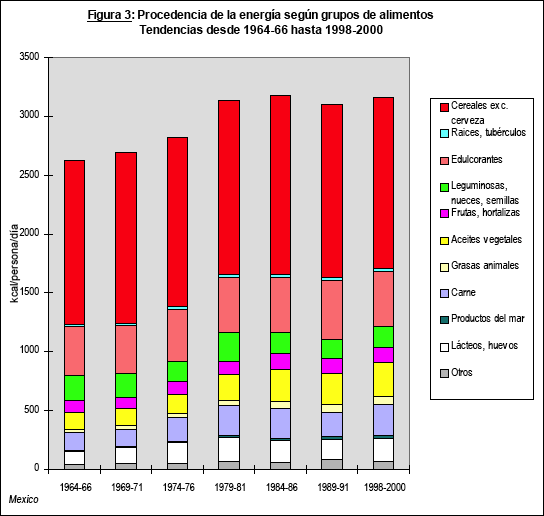
Consumption of major food groups in Mexico 1964 - 2000. Source FAO Nutrition Country Profile for Mexico (Spanish). Click to enlarge.
And there lie the key issues for wealthy citizens of developed nations I think.
In the last year, there have been food riots, protests, or stampedes in Mauritania, China, Senegal, India, Pakistan, Morocco, Mexico, Yemen, Indonesia, and Burkina Faso.
If food prices continue to go up, the world's middle classes will still be able to afford ample food. But it's hard to see how, in the long term, we will be insulated from the social and ecological collapses that might get triggered in poor countries.
Contact
- Content: editors at theoildrum dot com
- Tech support: support at theoildrum dot com
License

This work is licensed under a Creative Commons Attribution-Share Alike 3.0 United States License.
Thanks a lot Stuart, as usual it's first rate work!
Indeed calls to stockpile food appear be off the mark in the"developed" countries based on the trends shown in your graphs. Still, I chuckle and think about the "turkey analogy".
"We have a huge amount of room to eat more cheaply by eating less processed food and less meat."
http://news.bbc.co.uk/2/hi/americas/7106726.stm
New York hunger levels 'rising'
The shelves at Food Bank are empty (Pic: Food Bank)
Food Bank is unable to meet demand, with shelves empty
Over 1.3 million people, one in six New Yorkers, cannot afford enough food, with queues at soup kitchens getting longer, anti-poverty groups say.
The CRB and the Baltic Dry Indexes are the sinquo non
for grain, fiber, metals, and energy.
http://www.investmenttools.com/futures/bdi_baltic_dry_index_bdi_crb.htm
12/13/07 Since cumulative wheat sales have reached an amazing 89.6% of the USDA forecast as compared to 66.7% on average, there is now talk, that stocks will at some point be wiped out and the US may be forced to curtail or embargo further sales.
These charts will compliment yours.
Inflation is theft, IMHO and Americans have been
impoverished by it.
They'll realize that over the Holidays.
We have zero room for error now.
James Kunstler-
"Some other differences this time around: in the background is a "real" economy of depleting natural resources (oil, soils, aquifers, etc) and the systematic disassembly of an industrial manufacturing infrastructure. In the 1930s, many people could return to family farms and get by, even with little money. Today there are far fewer family farms."
Finally, thank you for your interest in food and fiber,
Stuart.
And a quote:
"Selling a soybean contract short is worth two years at the Harvard Business School - Robert Stovall."
http://sixtythirtyten.com/
Found this at your link, it brings a little perspective to the "record" prices
alan,
Once more, the late 1970's mirror works....it is ASTOUNDING.
You can look at the historical charts on wheat, corn, copper, tin, bauxite, oil, natural gas, propane, almost all the metals and you see exactly the same top in the late 1970's....I graduated high school in that period and it seemed like the Western economies were FINISHED.
So what is yet to fall into place?
The stock market: It is still due for a serious correction. That is not doomer talk, it just makes sense....the markets have weathered the dot com crash, the 9/11 attack, the Asian bond crash, the runup of energy prices....so do we assume the market is now exempt from normal rules? I wouldn't bet on it.
My guess is that we should see a 9500 point Dow sometime in the next couple of years....but what will cause it?
Interest rates: They MUST go up. contrary to popular belief, they are still very, very low, and need to rise to perhaps 10% for at least a short time.
The fundamentals of the U.S. economy are at least as good as any nation in the world (certainly MUCH better than the fundamentals of the E.U. or China)
What we are seeing is a currency/curve, pure and simple, and we are doing what we have always done with the Fed, trying to stick our finger in the dike.
This cycle could go another 3 to 4 years, and then, just as in 1982, when all the "little guys" and weak players have been shaken out, on one sunny day without warning, the markets will take off, the economy will begin what could be an astounding expansion with new efficiency technologies pouring into every corner of the U.S. economy, and pity the pour swine who got shaken out of everything he or she had.....they will not have the cash to enjoy the rebound.
It's an old story....you can't time the market. But it can sure time you.
RC
It depends what you mean by "weathered". The markets have gained basically nothing in the last 7 years (S&P, which is the broadest measure; DJIA is up ~50%, but Nasdaq is down ~50%). When compared to 8% historical growth, that means the stock market is down 42% from where we'd expect it to be, which is pretty severe.
Comparing to the 70s, the markets fell about 45% from Aug/00 to Sept/02, vs. 45% from Dec/72 to Sept/74. Five years after the bottom, the market was up 1% in Sept/07, vs. down 7% in Sept/79 (it wasn't until Jul/80 that it reached up 1%). Both had oil problems and a 10% correction in their fifth year after the low point, oddly enough.
So if the 70s are a good analogy - and the behaviour of the stock markets is surprisingly similar - then the markets should be due for a good run. I personally wouldn't push the comparison that far, though.
Yes. I've noticed/noted that, as well.
This "deflation" of grain prices along with
gasoline (I'm sure the chart would look similar)
has been the "lid" on price pressure.
Note the "crush" in pricing occurs with Volker and the
15% interest hikes in 81.
And also note the breakout occurring this year.
I loved this article. We always hear that corn is up because of the ethanol demand, but it's good to see just how far up. One question that I have though, why is it only the cereals are going up? Is it because they are the most major commodities? Or is it because vegetables tend to get grown locally? (Hence minimizing the oil consumed in transport.) I'm just typing out-loud, maybe someone has the answer.
*edit* I just reread the article and the UN report seems to suggest that it's specific events that are driving the price increases: drought in Australia, ethanol demand for corn, etc.
From what I've read we've been drawing down worldwide grain reserves 6 years running. There isn't much hope for a turn around due to drought and global climate change.
It's one thing to find a super-giant oil field and spend the next 20 years using more oil than one finds. But that doesn't work with food. If enough food isn't grown then soon people start to die.
I've not seen grain prices go up but I buy local organic stone ground oats and hard wheat. It's already at least 2x as expensive and decoupled from ethanol / world reserves and distribution.
This helpful report from the International Food Policy Research Institute has a graph of cereal stocks - looks like they have bottomed out, and further supply-demand mismatch is directly resulting in price increases:
Interesting, so the food price increases I have been seeing are double what the farmers/producers have been getting. I guess one could pin that on transport costs, but one would think that farmers feel the full force of fossil fuel prices so they should be driving the inflation.
Farmers are the only producers who buy retail and sell wholesale.
All farmers can do is hold back product.
Which is costly and the USDA/Merchants of Grain
will take advantage of everytime.
The only protest a farmer has:
Stop producing. How's that working?
Or war.
Or no more grain can be produced. Usually associated with
Death of Empires.
Kunstler-
The nation is acting just now like a crowd of bystanders watching a car wreck that has nothing to do with them -- as though they were just occupying the Nascar grandstand on a particularly bad day. They'll discover soon that it's their own society that's hit the wall out there on the track. It raises the question, under the circumstances, as to whether the next presidential election will have any legitimacy.
Thanks for these fascinating graphs. I agree that the updated 2006-2007 price hikes need to be reflected in some of them.
I also agree with mcgowanmc that the food crisis is already here in the USA if you know where to look for it. A demand spike for food assistance is becoming difficult to meet. When you consider the rising costs of other household budget items ie utilities such as heating and cooling, the pennies are being pinched in food budgets of the poor. And in the USA, the poor eat MORE processed foods not less. [Dollar meals at McD's] The urban poor also pay more for their food than suburban shoppers because grocery food costs more in the city, especially if the closest food is at the 'convenience' stores.
Not scientific but in our town some school PTA meetings have seen increased attendance when canned food is available those nights.
Food prices will continue to rise, given the fact that agriculture is so dependent on unsustainable practices. So I understand the food hoarding recommendations as anticipatory preparation for even worse food prices or shortages.
However, I think hoarding food is not as helpful in the long run as learning how to grow food yourself and sharing that info and experience with others around you.
Happiness is... a peaknik in his victory garden.
There you go. 8D
And almost all of a dandelion is edible.
This is a really interesting article.
Your thoughts parallel my own.
When I think about eating less processed food, and work to do so myself, it means I buy grains and dry beans in bulk, mix with fresh veggies from my garden and farm...in other words, I engage in old fashioned home economics and can eat very cheaply. The rise in the price of dairy isn't so much of a big deal when I am saving in so many other ways.
However, I am putting in the time to think about this, organize my habits accordingly, and be creative. I also happen to have little cultural resistance to eating this way, as my wife and I are very health conscious and aware of the hazards of eating highly processed foods.
By contrast, I listen with sadness to people lamenting about how difficult it is for them to NOT eat the food they are used to. Mothers saying their husband and kids don't like the "new" food they try to cook. Single parents working 2 jobs have little time to do the extra work it takes to shift behavior patterns.
It is all unsustainable, of course, but you can imagine the tension that builds.
ps. I am wondering if anyone has familiarity with what food banks accept. I am familiar with canned goods being highly desired, but what if I wanted to donate a 50 lbs bag of whole grain wheat? Would they be able to give it away? Do the people they serve have grain mills?
There are some good suggestions in the comments to a thread on casuabons book - see here:
http://casaubonsbook.blogspot.com/2007/11/saving-life-that-may-be-your-o...
To summarise: they won't find your unprocessed grain useful. Typically the recipients may be working multiple job and don't have the time or resources for processing very basic foods (in many cases it may be older kids cooking). Canned foods are popular as some do not have even the means to cook and canned food is still OK cold. Food banks accept cash donations too.
Sure, for the long term growing and sharing are the only answers. But an element of hoarding is inherent to the grow-your-own solution. Until such time as each of us is competent to survive by the fruit of our garden it may still be prudent to stock-pile essential staples. As we have seen, courtesy of various natural desasters, our nation's storehouse on wheels quickly presents bare cupboards when disrupted. Harvest time can seem a long way off especially if you are eating your seed grain.
In the U.S., only about 20% of the energy that goes into getting food into mouths is consumed by farm operations (including the embedded energy of equipment and fertilizers).
See: http://www.swivel.com/graphs/show/21368509
I think the energy inflation of the 70s and 80s did a lot to reduce the energy footprint of farming, so yes, many farmers are complaining that they can't cut back more.
See: http://www.centralvalleybusinesstimes.com/stories/001/?ID=7175
Diesel prices pick farmers' wallets
Fresno, Dec. 5, 2007
It will be interesting to see how long it takes for commodity food and energy prices to spill over into the retail sector given the sources Stuart cites. I have seen suggestive articles that this began in earnest in 2007. Each part of the "food chain" has what economists would call a "menu cost" for changing their prices that puts friction into the price system. I suspect transportation would be the main driver since they can pass on higher costs to customers via fuel surcharges, whereas most farmers are at the whim of commodities brokers and can't directly pass on the burden of higher fuel and fertilizer costs.
The corollary to this, surely, is that there is a HUGE reservoir of energy savings (most of the remaining 80%) in reducing the length of the processing/distribution/consumption chain.
I am alarmed that "home refrigeration/preparation" consumes more energy than primary food production...
A diet based on local, unprocessed, fresh foods being the ideal. (A few fancy far-flung condiments, and fine wines, are excusable because they are only a small proportion of one's total consumption!)
"The global commodities boom that has lifted prices of everything from gasoline to gold is now elevating rice -- a staple food for half of the world -- to its highest level in nearly 20 years."
December 15, 2007
By LAUREN ETTER
The Wall Street Journal
http://ki-media.blogspot.com/2007/12/rice-prices-are-steaming-with-many....
http://politics.reddit.com/info/63878/comments/
thanks for your support...it is appreciated.
"In general, farmers have had a miserable couple of decades in the 1980s and 1990s as their price increases generally fell below other forms of inflation."
Lower prices doesn't necessarily mean farmers were miserable. Agricultural markets are heavily distorted as a result of farm subsidies, particularly in developed countries, and prices paid to farmers don't necessarily bear a direct relationship to their final income. In some years, in fact, thanks to our bizantine farm policy government payments to farmers have equalled or exceeded the income farmers received from selling their crops. This applies, of course, to those planting program crops (staple grains, oilseeds, feedgrains, dairy, cotton and peanuts). Fruit and vegetable farmers, and some others, are on their own to deal with market volatility.
I'm hardly an expert in ag eco, but I did live in a midwest farm town for several years and count farmers among my friends. At least part of this consolidation is children getting out of the family business and selling the farm to the neighbors. All of the farmers I knew were incorporated, presumably for legal and tax reasons, but they were all still family run operations.
I think your observation is correct.
For any sort of income grain or commodity farming, you've needed the base acres to be eligible for commodity payments. One of the best ways to increase base acreage was buying another farm. Farming without commodity payments has been the surest ticket to bankruptcy.
When the kids leave after a while, or the old folks find the kids aren't interested, the sale is usually to other farmers and neighbors close by. The plum is established base acreage.
In the past, operations I've observed who sold to wealthy investors for the commodity payments often have been resold once the the depth of the pocket was reached. Hard to predict how this will play out with increased commodity prices.
Stuart, when I think about the "size of a farm" I usually think first of farm area, not gross sales. I am sure there is a relationship between farm area and gross sales, but I am not sure it is linear.
There's an interesting chart here:
http://www.cnr.berkeley.edu/~christos/articles/cv_organic_farming.html
that looks as though smaller farms yield much more income per unit area. There could be many reasons for this but the ones that immediately come to mind are:
1. small farms concentrate on higher value products
2. small farms have a higher labor input per area and so can more smartly manage the space
3. small farms are more likely to be "organic" or attempting "sustainable agriculture" which feeds back into 1 and 2
It would be interesting to see if the monetary profitability of farms is actually bimodal, with big farms focussed on commodities able to take advantage of fossil-fueled powered economies of scale, while small farms, e.g., less than 50 acres able to manage well with strategies 1-3.
Jason,
Have you thought of starting organic gardening/farming classes, perhaps in association with a local school district or community college?
Yes, I initiated a farm at a school last year. We are still putting in infrastructure but are a very active farm. The local community college is open to having courses at the site and I see this as critically important. We are potentially looking for a really keen intern for 2008 but don't have the funding solid yet. A local organic farmer offered courses for 2008 at our farm starting this fall, but there were few takers. She may try again in the spring.
You can follow this project and my thoughts about agriculture and food systems here:
http://www.energyfarms.net/blog/willits
Jason:
Very interesting. The chart is:
The ultimate source of it seems to be this report which presents evidence that the same pattern applies in the US.
So it seems that small farms produce more output/acre, but use more labor input to do it, and so overall are less profitable (at least at current wage levels and energy prices).
Do these studies take into account soil quality and other important factors like length of the growing season?
Highly fertile soil allows for very small intensely farmed plots. And soil quality can vary substantially within the same region.
For what it's worth, much the same thing is true regarding organic vs. conventional farming - same yields per acre, but at current prices 50% more energy is cheaper than 15% more labour, so conventional farming is more profitable.
Check out the price of forage
http://future.aae.wisc.edu/data/monthly_values/by_area/874?area=US&tab=f...
Am I the only one who sees a breaking point in the economy of scale and agriculture? As food prices rise it's not the farmer on 10,ooo acres that is seeing all the money, it's cargill and monsanto
Great eye-catching graph.
I spent quite awhile with a neighbor couple of draws over yesterday. We were trudging thru the snow to catch one of his cows that missed the roundup last fall. That girl has gone "wild", hanging out in some pretty steep, dense timber. We thought the cold would have driven her into my corrals, but not yet. Joking, I told him this was one way he could skirt high hay prices, browsing my pasture and timber brush.
"Nope, I need to get her" (One point we'd noted blood in her urine on the snow, so that was uncontested) But I pressed about hay, as I'm not sure I have enough and its been bugging me.
"I'm not worried. She and the rest are taking a vacation"
What?
"I've got some pasture lined up down in California. Should start to green shortly. Bring em back in the spring for calving."
Isn't that..
"Pencil it out. I'll save a bunch."
He does alot of trucking-hay and livestock. He watches his costs. Even with diesel close to $4, I see where he'll come out ahead with good hay pushing $200.
Hello SS,
Thxs for the detailed analysis, I always read your excellent work.
http://www.ftd.de/karriere_management/business_english/:Business%20Engli...
-------------------------------
Potash is the scarcest of the three main raw materials of fertiliser; the others are nitrogen and phosphates.
Government officials in Regina, capital of the province, did not issue a single potash exploration permit in the 15 years to 2004.
------------------------------
The two key controlling potash consortiums of Canpotex and Uralkali have ridden this structural underinvestment trend to great profit, but it takes a long time and big buck$$$, to create a new greenfield mine plus the associated beneficiation factories and distribution network capacity.
The rising prices of energy and steels adds to the expansion difficulty too. We are talking of the required movement of millions of tons of rock/powder--not weightless Internet Packets. The physics and chemical formulas are fixed; impossible for any kind of Moore's Law improvement.
From a prior posting: it takes roughly 250 lbs of inorganic NPK and other trace elements/acre to efficiently sustain the topsoil mining process above a potential Liebig Minimum-- this is a daunting global requirement if one considers that P & K mines are much fewer than oilfields or natgas fields; these long distribution spiderwebs only add to the final farmer's cost.
Bob Shaw in Phx,Az Are Humans Smarter than Yeast?
All the places I have lived and gardened, potash was the least needed 'raw material' for the soil since the soil was already rich in potassium. I don't know how general this is, but phosphorus has always been the Leibig ingredient in all of my gardens. This might have something to do with the fact that potassium is frequently a product of deteriorating rocks, especially granite, while phosphorus is usually (I think) derived from living matter. I'm not very knowledgeable on the subject, but it seems like the phosphorus in the environment is more diffuse and is concentrated by processes such as shells forming on animals and dropping into phosphate beds that are mined at some point in the future.
Anyway... I'm looking to buy a ton of rock phosphate before the next gardening season. Good investment, high return.
Thanks to Stuart for giving us a sane look at food prices.
If you are willing to cook grains and beans, you can have a nutritionally sound diet for $2 per day. And this will include some meat and fresh fruit and vegetables.
I put this to the test myself last winter for 2 months and found it an easy go.
For instance: currently in Toronto, Loblaws, our largest chain of regular retail food stores sells:
22 lbs of whole wheat flour for 5.99
18 lbs of parboiled rice for 7.99 (brown rice is a couple of bucks more)
Let me emphasize:
Through observations from working at a local food bank the biggest problem is few of the people coming to the bank know how to cook anything but Hungryman frozen dinners. The schools do not teach home economics, read how to make a meal from scratch. They will turn down flour, dried milk, farina and whole chickens. We give appplesauce, dried figs, and staples that need some prepration, and get them back in the next food drive at the schools.
I can't say that it doesn't affect my family. The young girls/women do little in the way of food shopping that does not revolve around frozen and pre-packaged foods. We are teaching the kids how to be socially acceptable but neglegent in how to care from them selves.
I am in negotiation with the local schools to see if they can prepare more fresh, local foods. Cafeteria staff are limited, down to 2 cooks who have to serve 900 meals per day. The same kitchen had 6 cooks 20 years ago and I hear stories of the fresh bread they made.
Meanwhile, health concerns are leading the state to mandate healthier foods, especially more fresh veggies. How this corresponds to the staffing and budget constrains I don't know.
Classrooms are full of posters of the food pyramid, and staff are hired to teach nutrition, including making healthy food choices, reading food labels, etc.
Then they enter the cafeteria, made possible by deliveries from Cisco Foods. And if they eat like the average American just hope they don't get diabetes by age 11.
The system is completely schizophrenic.
What would be good to do is to get the students in the cafeteria preparing the food. Why bother with "home economic" classes? It's so much better to just do things and learn rather than always preparing to prepare. First plow up all that grass around the schools, put in gardens and edible trees. Have a group of students who are learning about business and economics use the food budget to purchase local food. It could be so much more integrated. Part of the problem with doing any of these things is regulation of course. As Joel Salatin new book says, "Everything I Want to Do is Illegal."
What would be good to do is to get the students in the cafeteria preparing the food. Why bother with "home economic" classes?
Well, it turns out that cooking for large groups is almost an entirely different skill than cooking for a few.
For instance: you would be amazed at the number of recipes that don't scale up. ie. The recipe completely fails when you try to cook it for 500 people.
A short-order cook, however, is doing something closer to home cooking. But he/she doesn't use bulk staples as inputs.
Regulations can get in the way.
For example, the kids loved coming out to the farm last spring and gobbled food right after picking it. Peas were a crowd pleaser. I don't use herbicides or pesticides and no animal manure so unless there's a bunch of dirt on something it should be fine to eat.
We harvested about 30 lbs of peas and brought them to the cafeteria for a snack choice. In that setting, the cafeteria folks felt the need to wrap a group of about 8 shell pea pods in plastic after washing them. Remember, these are shell peas, so they come with their own wrapper, like a banana.
They also put a bunch of un-wrapped pea pods into a large pot and I got to walk around the cafeteria handing them out to students to try, and to teach them how to open them up. But in order for me to do this, I had to wear giant plastic gloves.
The kids are about 6-8 years old and are picking their noses and generally spreading filth among themselves, but oh no, don't hand them shell peas without a biohazard suit on!
Jason
I'm starting to market to hospitals and having some luck. Also some local universities, not as much luck
here's some links
http://www.farmtocollege.org/
http://www.foodsecurity.org/farm_to_college.html#f2cresearch
I've also hooked up with our senior nutritional program
I'm also working on a farm to school program
can you grow quality garlic? Seed garlic is off the charts
http://americanvalleygrowers.com/
Good Luck
I wonder how on earth I survived childhood, with me and my cousins picking carrots straight from my grandfather's fields and eating them. The best carrots I ever had. A little dirt just adds flavor! Perhaps it's different for citykids though, they may not have the immune system to handle it?
"Perhaps it's different for city kids though, they may not have the immune system to handle it?" I think you nailed that one. I grew up in the city and the wilds of Brazil, wrapping peas in plastic, how ridiculous!
One of them gets scalded and there is a million dollar lawsuit against the district.
Anyway your idea is again - "let the state take care of my kids". How about parents teaching the kids how to cook?
Oh I forgot - they are too busy eating all their meals out, and if money runs short - complain about hunger!
Plus the population of unable and unwilling to cook pre-diabetic kids keeps exploding, on the back of food-stamps and cheap food.
If any droughts or harvest failures come to America it is going to be one of the biggest blessings (in disguise). Unfortunately, given vast vast surplus food and large uncultivated land it is unlikely to happen.
Actually, I am not in favor of "let the state take care of my kids." My husband and I have homeschooled both of our children or more accurately they have "unschooled" themselves. After reading John Holt who wrote How Children Fail, Instead of Education and Teach Your Own and John Taylor Gatto who wrote Dumbing Us Down: The Hidden Curriculum of Compulsory Schooling and The Underground History Of American Education which basically states the our educational system is producing exactly what is is designed to produce, i.e. passive, socialized, non-thinking people who don't challenge the system, we immediately withdrew our son from public school and never sent our other. I think that all of our compulsory schools should be closed because they impede the process of real learning.
By the way, my oldest son has learned how to make pizza from scratch, Pad Thai, sushi, lasagna, meatballs, and at age 16 was cooking entirely for himself.
Stuart,
Nice post. Very accurate and you can see the market at work. I work in the Ag & feed/food additives market and have seen this coming. And welcomed it for the producers and food sector as a whole.
What people (who don't work in agriculture) don't understand is that farmers don't grow food for the third world out of the goodness of their hearts. They must make a profit in the U.S or lose their operation. Ditto for the rest of us involved.
The commodities markets follow the money. Corn and beans are profitable due to biofuels demand, plant them instead of wheat. Oh, now wheat could make us money we will plant more, but still need to keep enough corn and beans to feed the new uses. The key is that in this hunt for profitable crops more total agricultural products can now be grown at profit. Before biofuels any increase in any agricultural grain product would crash the price of both the grain and meat because food like fuel is very inelastic.
Most people on TOD don't know it but in the last 2-5 years there have been huge consolidations and shakeouts in grain handling, poultry production, egg production and swine production. There was so much oversupply of meat products that just about everyone was losing money short term and that lack of demand kept grain prices low. This was great for the rest of the country but many people involved with delivering food to your table didn't make any money.
I find it funny that Wall Street and Silicon valley can make hundreds of millionaires per year and no one says boo. But if food prices go up 5% everyone blames the greedy farmers and Ag companies.
-Yes how dare they! Food, like the Energy that goes to fertilise, sanitise and transport it, should be free!
Nick.
It was the relentless decline in corn prices that was behind the early push for ethanol in the 1980's. Farmers did not like the concept of being on the receiving end of the government dole although most participated. To try to find another market for the excess corn, ethanol co-ops were formed. Soon marketing became a problem as oil company's hardly wanted to give up market share as they also faced surplus supply. Thus mandates originated to use the ethanol, but oil companies still resisted out of their understandable self interest. Finally ethanol subsidies were introduced that benifited both the ethanol producers and the oil companies. The ethanol produces gained a market and the oil companies received the the 51 cent blending credit against taxes owed, which they could readily use being very profitable. Thus was born the evil ethanol subsidy hated by many.
Now finally after about 25 or more years of low prices, the market can use most of the corn produced and the price has risen. But the price increase of corn is nothing compared to that of oil, medical care, education, cars, houses or nearly any thing else trading in the market place. We hardly hear peep about such like house prices going up 5-10 times. But if the rural economy has a somewhat better situation there are howls of protest from far and near. Fantastic oil company funded theories like EROEI that omit the critical function price plays in resource allocation are concocted and widely distributed. Now the world in nearly convinced of a complete lie: that it is ethanol (which is a small fraction of energy usage) that is the cause of rising food prices. It is nothing but pure propaganda.
You nailed it dead on.
The propaganda machine that fossil fuels, and only fossil fuels, can supply the energy and feed stocks for a happy world is in high gear. The goal of that machine, IMHO, is to prevent any other approach from being tried.
The rural economy has been working towards getting control of their destiny for 20+ years. Now they they are starting to get the pieces dovetailing in the Ag sector they are seen as a threat. It is now obvious to many that the ultimate goal of this new rural economy is not to be the cheapest, or even most energy efficient, the goal is to use the least amount of fossil inputs you can get away. Because that ultimately will become the cheapest and most energy efficient way to do things, even if it isn't in these early days.
I agree that ethanol is a small fraction of oil usage. It is not nearly such a small fraction of food usage - 27% of the corn crop in 2007. It doesn't take a complicated analysis to see that that's got to have a pretty material effect on corn prices.
This reflects the fundamental problem with turning food into fuel - the energetic content of the food supply is much smaller than the energetic content of the fuel supply.
Just to add context, here's the inflation-adjusted prices of corn. It's averaged ~$3/bu for the last 20 years, but was ~$10/bu in the 70s.
This post was timely aired indeed, wheat has just crossed above 10$ per bushel.
This last months there have been important protests in Italy against the rising prices of pasta and other direct products of wheat. At some point a popular strike on pasta was called upon. Even in one of the most rich countries high cereal prices have been deeply felt.
This post as some important information, but being the US such a large producer and exporter of cereals, internal food prices trends shouldn't be extrapolated.
My own experience at the grocery store is not yet serious, some rises on direct cereal products like bread some pastry and pasta. Talking with grocery store and restaurant managers I get the idea they're holding the longest they can before the start passing the price rise to a wider set of products. The €uro has been helping, but visible increases in food prices all across the board will come in 2008.
Just a note - much of this, though certainly not all, tends to a very American-centric view.
These days, 'bio' (organic) food is becoming increasingly common on German supermarket shelves, which is especially noticeable at Aldi, which is a mass market, low price retailer par excellence. Walmart is a bloated and inefficient retailer in comparison, one which had to abandon the German market after losing somewhere over an estimated half billion plus dollars.
The German Greens, when sharing power with the SPD, were able to create the framework for increasing organic food production, and the various retailers, seeing the higher margins of organic food, were happy to get involved. As were many farmers. And as organic means no genetically modifed organisms, most Germans see 'bio' meaning they can still eat food which meets their own standards (the whole GMO debate is fascinating - let's just say that most Europeans find GMO food to be unfit for human consumption, especially in regards to their children).
Creating an organic is not as easy at it may appear, at least in the case of mass market, high volume retailers like Aldi or Lidl. The investments and commitments are the result of roughly a decade's worth of planning and implementation, and the fruits are now being harvested.
Even more interesting is how the price spread between organic and conventional food seems to be shrinking, though that may just be a relic of longer term contracts for organic suppliers. Or it may accurately reflect a true difference in the cost of production, meaning that organic producers are likely to prosper over the next decades, while reaping greater profits without relying on Monsanto's labs.
However, at least in Germany, tractors are still considered to be quite superior to horses - but then, at least in the town I live in, people were still using horses into the 1950s - anybody that seriously thinks horses are going to replace things like combines is probably not really aware of how little fuel is required by agriculture, or how much care horses require - including the fact that a dead horse is not repairable, and depending on how it died, not edible either. As a guess, the amount of oilseed crop area required to fuel planting/harvesting equipment (at least in this part of Germany) is likely significantly less than that required to sustain an equal amount of horse power. Not to mention the fact that a lot of the horse powered equipment will need to be reconstructed, whereas fueling existing equipment is just a matter of organization. Some places seem more capable of that than others, though - how is the planning for Atlanta's water supply going these days? Is the governor still praying for rain as his response?
We love visiting Germany and holidaying there. I'm always impressed by the quality and variety of the food available in supermarkets, but in specialist food shops and especially in real markets in the centre of towns and cities. There's a market in the centre of Munich which is like going to heaven at least for me and my family. The vegetables are wonderful and so fresh. There are spices and flowers and stalls selling all kinds of fruit and vegetable juices. Lots of seafood too, and then there's German beer, fresh bread and herrings, yum, yum.
Some reasons to stockpile food:
1) With all the financial monsters out there, how much longer will you have a job? http://www.culturechange.org/cms/index.php?option=com_content&task=view&...
2) Stockpiled food is something to exchange at barter clubs, i.e. Argentina (see Dmitry Orlov for how Russians coped with sudden financial collapse) http://www.econ.umn.edu/~jcardena/Barter.pdf http://www.guardian.co.uk/Archive/Article/0,4273,4243942,00.html http://www.towardfreedom.com/home/content/view/147/54/
3) "Albertson's syndrome" -- just-in-time delivery breakdown plus one-day inventories = empty grocery store shelves within one day. Perhaps caused by Straits of Hormuz blocked with blown-up oil tanker(s) or other Black Swans
4) ABAG (regional SF Bay Area planning agency) estimates 20 years to recover from major earthquake since all freeways, airports, RR, & much other essential infrastructure is built on landfill. How long will it take to recover if the earthquake happens after oil & natural gas energy shocks?
5) All infrastructure is crumbling -- money goes to new development rather than maintaining existing infrastructure. Energy infrastructure in decline -- The Grid, pipelines, etc. Other infrastructure falling apart: water delivery & sewage, roads, bridges, -- you name it, see the ACSE report card)
6) Other short/small & long-term/large disasters: snow & ice storms, floods, hurricanes, tornadoes, landslides, fires, refinery explosions
7) The Ogallala aquifer is depleting fast, and it provides water for over 25% of our food, plus uses lots of energy to pump water from deep down. It won't be recharged again until after the next ice age
8) Increasing "food for oil" exchanges with oil-producing nations and for Chinese manufactured goods will increase food prices here
9) It's healthier to make food from raw ingredients. Non-whole-grain food lacks fiber, phyto-chemicals, vitamins, good fats, etc. Rats die if fed only white bread -- why this isn't as much of a scandal as tobacco I don't know...
10) Good practice to learn how to make food from a pantry for when it does become necessary, to already have equipment to process raw ingredients (grain mills etc).
11) "Limits to Growth" - this is an ecological crash. We've way, way, way overshot carrying capacity without even knowing it because cheap and plentiful energy is hiding the extent of overshoot so well - discontinuities can be quick and extreme in ecological crises, crumbling infrastructure & poor decision making of local governments how to allocate scarce energy resources in the future will make the crash even worse
In terms of personal preparations, your point #1 is key, I think. I have little doubt we face a recession, very likely a severe one, on account of the situation with the financial system. Staying employed should be a critical focus for most people. Folks should make sure they understand why they are valuable to their employer or clients and work to maximize that value. It's a bad time to start risky new ventures, and a good time for conservative and cautious decision-making. Priority 2 is reducing expenses, paying down debt, and increasing savings (held in FDIC insured accounts for the most part).
(Of course, priority 2) as a collective choice worsens the recession, but it's still individually rational).
**Priority 2 is reducing expenses, paying down debt, and increasing savings (held in FDIC insured accounts for the most part).
(Of course, priority 2) as a collective choice worsens the recession, but it's still individually rational).**
Don't worry Stuart, the Federal Reserve Banking System has a solution to the collective choice. Lower interest rates so that after inflation and taxes you have a negative real return on your FDIC insured account. Insurance is for nominal value, not real purchasing power.
Stuart,
I am impressed with your diligence in digging up and presenting the charts and information on food price inflation. It was an interesting read. However, as a vegetarian and 'whole food' person I have to disagree that commodity inflation has a muted effect on consumer prices. Our food costs have gone through the roof. Our rice and whole grains have almost doubled in price in the past few months. We've had to actually cut back on milk, eliminate cereal from breakfast and eat smaller food portions in general to keep the food bill from busting the budget. I am quite sure the high food prices will hit the economy really hard in the first and second quarters of next year just as the hordes of sub-prime mortgages reset. That on top of higher fuel prices doesn't bode too well for any part of the world, developed or not. We'll see if the oil companies and their cronies are able to pump more of all that oil they say is 'in the ground' and thus ease oil prices that are driving most of this. If they fail to pump more - or actually pump less - as demand goes up then we'll be more convinced that 'peak oil' is happening. That will present a whole new set of challenges.
D. Draffen
You're right of course that folks eating a lot of whole grains will have experienced a much larger percentage increase in food costs than folks eating a more typical American diet.
True but anybody eating a lot of (relatively) unprocessed whole grains is spending very little at the grocery store to start with.
However, if the person is purchasing processed grains in the form of commercial cereals or baked products, the commodity cost as part of the purchase price is single digits (percentage-wise).
D.Draffen might be conflating inflation from increased processing, storage, transportation and retailing costs of factory produced products with increases in the underlying grain commodity prices.
See my post below:
http://www.theoildrum.com/node/3387#comment-278710
Also, those of us eating a diet from home prepared whole grains and beans with garden veggies and some carefully selected meats (foraged mushrooms...) are eating so much cheaper than the 'hamburger-helper crowd' that even $10/bu wheat only induces a slight ripple in the food budget.
It is similar to cutting my driving down to a minimum of $40/month in gasoline driving a hybrid. Gasoline could double in price right now and not put a huge dent in our budget.
People who eat ‘richer’ notice less, because a) their budget is wider and they don’t pay attention, b), if they think about extravagant expenditure it is ‘big treats’ c) processed food cos. change the compo. and the weight slightly, thus offering ostensibly the same product for the same price, for a while; when buyers are displeased, if that happens, they upgrade and pay more for another product.
It is those who buy grains and local veggies in bulk who see the price change.
Prime beef, Swiss, is here now 100CHF for one kilo. (Imported beef, from Brazil or Ireland, is more.) I just used a converter and that is only! 87 dollars for 2.2 pounds.
A wheat farmer interviewed on Australian TV thought that a shift from winter to summer rainfall was confusing everybody, including the wheat plants. The crop should have reached full maturity and dried off in the dry conditions for harvesting around now. If however the crop is immature and wants to grow a bit more with summer rain it's hard to know when to harvest, given also the risk of mould. Climate change adaptation can be done but carries bigger risks.
Excellent presentation. The relationship of food/water/energy has fundamentally changed. In my opinion they simply cannot be separated at this time, as shown here for food and energy. Adding climate change to this and changes in rainfall/monthly and yearly max temp/monthly and yearly min temp in key agricultural areas makes this work especially relevant.
Thanks for this article!
Although I haven't finished my article yet and have not posted all supporting documentation, here's the link:
Who stole our lunch money? US inflation 20.3% in 2007

Still need to post up median household income data comparison across 8 US cities, and add a few more items to my "basket of goods."
Enjoy.
If you let me assemble a basket of any eight items of my choosing in order to make a point, I'm sure I could produce almost any figure for inflation. They need to be weighted by what people actually buy.
Hi Stuart. Yes, I know it's a small, unweighted basket right now. Still a work in progress and thanks for the note!
I will need to weight change in prices vs change in income, as well.
Cheers!
Stuart, if you follow the Chicago Board of Trade data back for lean hog or even most other meats, you should find that sudden price drops like the most recent drop are almost always followed by a nasty spike. The price drop is usually a result of farmers bringing meat to market due to the meat being too high in cost to continue to raise. This produces a brief drop in price as meat goes on sale, followed by a sharp spike upwards as there will be far less meat coming into the supply chain again until the next generation of piglets is ready to butcher. This behavior is just supply and demand at work. The more interesting question at any point in time is whether the underlying cause of the decision to dump meat on the market has become an ongoing problem or is a one time problem.
Oh yeah, as we often saw back in the 1970s, these price swings downward for meat are a great time to stock up and a reason to buy that freezer you may have been considering.
Hello TODers,
Unfortunately, I don't know how to create graphs and charts like SS & Khebab, and my earlier posting suggestion for legislation to promote huge NPK stockpiling [both organic and inorganic] before we go postPeak appears to have fallen upon deaf ears. =(
But it occurs to me that at some price point for rising food & energy & NPK that a large percentage of urban and suburban folk will move to gardening while at the same time industrial-ag will go to much larger nitrogen-fixing crop rotation to offset skyhigh natgas Haber-Bosch N. This non-organic to organic switch on the farms will result in lower yields during this interim period until the higher yields return; this switching period will further leverage food costs higher [which only further accelerates more citizen gardening or worse: food rioting, stealing, hoarding, etc].
Furthermore, my guess is that most of these newly converted non-ag, gardening areas will have poor topsoils, and the city-folks' first response will be to use industrial NPK as opposed to having huge, pre-existing, well-aged backyard piles of rich mulch and compost.
Imagine the giant sucking sound of retail, urban NPK sales almost overnight dwarfing the usual farm sales, plus a lot of NPK hoarding. Imagine 100 million US homeowners suddenly desiring to store 200 lbs of NPK. Maybe this is why we haven't seen any Presidential Plea for everyone to suddenly start a Victory Garden. We really need to first jumpstart a 'Victory Compost-Pit' in every backyard so we can go organic, and then stay organic in the urban & suburban areas to help mitigate the cascading non-organic NPK blowback.
I have not traveled the US much at all, but I suspect that if everyone started tearing up their decorative yards and lawns into gardens, plus the effects from ignorant, initial gardening practices: the erosion and other wasted resources would be something fierce, and the harvested yields rather abysmal. I could be wrong, but I think the available urban & suburban, topsoil-retaining mulch would be wildly insufficient. We could see just as much pesticidal and/or excessive-NPK chemically burned crops as we would see Liebig Minimum stunted crops in these woeful, first-effort gardens.
In short: like Westexas's ELM for FFs, I would be interested to see if a massive urban switch to gardening and NPK-hoarding in the wealthy countries would severely deplete NPK supplies to the outlying farms, and instantly price most of the poor countries' subsistence farmers out of non-substitutable NPK. I have no idea what kind of statistics would be required to detail this possible phenomena.
Could us suburbanites inadvertently kill billions by being cheaply non-organic, or help billions by choosing the more laborius organic path? I still think 60-75% of the US quickly moving to daily field labor in biosolar habitats is the best postPeak path.
Bob Shaw in Phx,Az Are Humans Smarter than Yeast?
Anybody interested in seeing how muted the impact of high commodity grain prices is on processed foods such as bread and commercial breakfast cereals might want to check out this paper:
http://www.stpeterscollege.ca/crse/pdf/compare_the_share.pdf
...which is apparently updated each year.
In 2005, in Canada, the farmer received only 7 cents for the corn in each box of cornflakes. (2% of retail price)
Corn prices are higher now, of course, but it still doesn't contribute much to the cost of processed products.
HAHA!! I LOVE this thread!!
I farm/ranch in SD. I read TOD every day.
Believe it or not, understanding the energy markets is the NUMBER ONE CRUCIAL FACTOR for marketing grain today. I can bore you folks all day with stories of guys with grains hedged at 2005 levels. YIKES!
I burn corn in a corn burning stove. ZERO SUBSIDIES needed to make it pay big.
$6.51 corn breaks even in a corn burning stove VS heating oil. Corn is only $4 in my area, so its a no-brainer. (Corn has 395,000 BTUs per bushel)
Burning corn in a stove only paid 7 out of the last hundred years. Historically, a BTU of corn bought nearly two BTUs of crude oil. That was the historic norm. Today a BTU of corn only buys half of a BTU of crude.
Farmers are delivering a cheaper BTU to the marketplace with corn than the petro industry is with crude.
I believe the inverse spread between crude and corn is not sustainable. It simply takes too much energy to raise corn.
I think corn will return to its historic value relative to crude, in which case my corn burning stove will no longer make economic sense.
Food inflation has not yet started in earnest IMO.
That sure removes the inefficiency of the conversion to ethanol from the process! Are there any stats on usage of corn for heating?
Your comment is pretty chilling with the suggestion that corn has to double again before it's on the same $/btu as heating oil.
That's my impression too.
Consider the plight of the poor souls in the auto/housing/finance sector facing declining income combined with the prospect of continued sharp increases in food & energy prices.
Oil Patch survivors have been through something like this, which contributed to my constant ELP diatribes:
ELP Plan
http://graphoilogy.blogspot.com/2007/04/elp-plan-economize-localize-prod...
"Farmers are delivering a cheaper BTU to the marketplace with corn than the petro industry is with crude.
...
Food inflation has not yet started in earnest IMO."
Change "farmers" by "oilseeds producers" and "corn" by "soybeans/sunflower/rapeseed" and it is exactly the case I have been pounding some months ago.
Once significant biodiesel production capacity has been built in Brazil, Argentina, etc., crude oil prices will set the floor for soybean/sunflower/rapeseed prices. Land arbitraging will in turn set the floor for grain prices.
An ELM for food is setting up.
Somehow I don't think graphs of various commodities vs the year to year rise(or fall) is quite the same as a pensioner on fixed income going to the grocery store and noticing the very big runup in all prices lately.
Example:
For the first part of this year(2007) and on until about spring I brought quality redtop milk for about $3.15 per gallon. Its started climbing during the year until it topped out at about $5.49 per gal..same brand and same type of milk(whole milk)..not 2%. And not Dollar General prices..but even they are not too much less.
Eggs...last spring about $1.19 and sometimes less for regular size eggs. Not large. Today $3.49.
Bread I am finding at about $1.89 and was sometimes less than a dollar the first of this year.
White flour has gone up in price. Corn meal also.
These are all basic foodstuffs in the country. Bacon of any value whatsoever is around $3.00 and higher. Last year I could buy decent quality bacon for $1.69
And I might add that the quality of these products is markedly down. Way down. Some eggs I throw out since they will hardly slip out of the shell. Some bacon I have to discard since it turns to pink mush in the skillet.
Graphs are ok but they to me do not represent real life experiences.
Bleach is another item. Used to be last year less than a dollar for a gallon. Now you get 3/4 of a gallon and its about $1.49
IMO there is a huge runup in the typical consumer grocery prices. Huge.
I used to spend around $50 on a normal grocery shopping event. Now its more like $75 or higher.
So what do I do? I now have started buying in quantity at Sam's Club. I can get 4 lbs of butter for a fourth of the price in the grocery stores. The savings are across the board. So IMO the grocery stores are engaged in massive gouging and ripoffs. If Sams can get it that cheap then so can the groceries. BUT they want to sell you smaller and smaller quantities so you have to keep coming back.
With many women no longer cooking in the home I think the hue and cry is more diminished. I have always shopped alone or with my wife..but now its always by myself since I do all the cooking.
And I will add once more.Those of us on fixed incomes never get to play catchup like the rest of the wage earners.
I just received notice of next years SS increase. Works out to about $20 more...big deal..thats not keeping up..thats falling rapidly behind due to inflation.
It may be a lack of competition in your area. If you go to www.kroger.com (or any other major grocery chain) the sale prices on most items in stores located in major suburban areas are still not up a lot when annualized over the past 20 years or so (heck - they may be down).
Of course that does not help your situation. In my experience areas that are not served by competing national chains have higher retail prices.
We've got a fair amount of competition here in San Francisco, and my experience is similar to Airdale's (and I'm also on a fixed income). 4% this year? Hardly seems like it to me, either. I shop at corner produce markets (they're almost always CHEAPER than supermarkets). Buy grains out of a store that is not a co-op but functions as one (grains in bulk, scoop out how much you want). The prices there for an average of what I buy have gone from $30 to $50 the past year for fewer things, even.
They also have a lot of imported cheese which has gone through the roof because of the declining dollar, I imagine. I used to try to buy it - not a good energy choice, but without bovine growth hormone and all the antibiotics in it I imagined it healthier. It's now a luxury.
I have shopped at Supermarkets in both San Francisco and Berkeley and they are much more expensive than the SE-US, for example, for similar products.
Maybe they pay their employees better (or provide healthcare...?? or other benefits that are not provided in other parts of the country) - I am speculating here on the reasons - I do not know. I seem to remember a big grocery strike in So. Cal. a few years ago. Did it also include N. Cal?
With your ref. to imported cheese: At the local Sam's Club - Emmentaler Swiss (aged 120 days is $5.87/lb (just checked the refrigerator)) & has not budged much (any?) as CHF/$ has gone from 1.40 to 1.15 over the past 10 months.
RE: Stuart, I do not have accurate numbers on corn stoves in the US. I know tons of folks with them.
Traditionally corn is piled on the ground near elevators in rural towns. No one ever considered stealing it. Any deer that ate it only consumed nominal amounts, and the price was too low to bother.
Now when one shines a light upon the pile at night, he sees many sets of eyes. These eyes don't belong to deer.
The normal price of corn forever was $2/bushel on the board, or $1.50 on the farm.(Corn has 395,000 BTU/bu) Hence $2 equates to $27.65/barrel crude oil on a BTU basis if I'm not mistaken. So $4 corn is undervalued by historic means.
Neb is the second largest corn producing State. They irrigate with 300 ft deep wells using $3 diesel. This equates to $8/acre/pass with pivot applying one inch. 20 passes are generally required.
You can see that trading $3 diesel for $4 corn is senseless. The subsidies mainly kick in when corn drops below $1.80/bu (Which used to happen every year). So ag is now pretty much in a free market environment.
Fertilizer inflation is wacking the bottom line (I believe you call it receding horizons?) at current grain prices.
One trades much corn for a little beef via feedlots. Livestock producers are liquidating herds in record numbers due to feed inflation. This beef is hitting the packers forming a glut.
What's happening specifically is this; It takes a little bit of corn for a steer to gain from 800 lbs to 900 lbs. It takes 3 times more corn to take that same steer from 1,200 to 1,300 lbs.
Hence lower carcass weights are hitting the packers, at the same time numbers are dropping. Add to it the fact that ENORMOUS amount of grazing land is getting cropped due to $10 wheat, and you have even MORE critters glutting up to the packer.
In another 9 months or so all this inventory at the packer will get chewed through. Low numbers with lower carcass weight will lead to a bull market in meat the world has never seen.
Wheat is differant. One bushel wheat yields 60 loaves bread. So an enormous rise in wheat price does not effect the consumer as much as does transportation costs.
If you folks are correct in your prognosis on energy supplies, then all these farmers with grain hedged 2 years into future, which is many farmers, will go broke. They will not be able to deliver $4 corn in the future, yet the bankers ARE SCREAMING at farmers to lock in prices 3 years out.
Very few farmers understand the oil situation. Those of us who do will make a ton of $$.
Thanks for the fascinating perspective!
Just make sure you cover the contingency that the credit crisis proves to be stronger than the energy crisis for a few years, and we end up with dropping energy prices.
"In another 9 months or so all this inventory at the packer will get chewed through. Low numbers with lower carcass weight will lead to a bull market in meat the world has never seen."
I've been saying this for awhile. Cheap beef thru spring, then once animals in the line have worked through, it'll really climb. Herds are really being culled this fall, we won't see near the calf crop next spring as usual. One other thing I've noted also over the last year, although I don't know if it is nationally significant, is with the better feeder prices over the last 18 or so mos, calves which might have stayed on farm for production have been shipped as feeders.
Don't quite agree about the present effects of $10 wheat. Last spring and before at planting, $5 wheat was just a hope for at harvest. No one was sure last winter's future's market tops-around 5.50 I think- would hold to harvest-and usually they don't. It just so happened worldwide drought didn't let up. But with the present price to 10, after previously topping around 9.5 and falling, that level is looking pretty solid for spring planting decisions and whether to keep land in grazing or try for wheat.
A interesting thing to watch will be CRP enrollments, esp as the farm bill is being bantered around. We're around 36 million acres total for 2006.
highplains,
I would love to have a discussion with you about this. I am starting my own ranch/farm right now and really... there is no information out there.
hydrajak at yahoo dot com
Thanks.
Thanks a lot Stuart, great job! My wife and I live on a fixed income in Florida, so food prices are something we follow pretty closely. From what we have seen while shopping, we would put the food price inflation definitely north of 4% but less than 10% per annum. The figures on food inflation from the government are really suspect, in our minds. Our last Social Security increase last year was about 2%. They managed this incredible figure by excluding food and fuel prices and the blatant manipulation of other factors, such as insurance and rent costs. As we move further into Post Peak Oil, PPO, anything the government says should be viewed as suspect. Ask any retiree.
Suspect? Suspect?
More like outright lies and massive fudging.
Like I said. About $20 per year SS increase and then the newer
part B deductions eat that up.
Just who is being fooled here? No one. Yet they like to think that most of us are fools. Perhaps we are.
Right now I am being shellshocked by the 'professional'fees of the medical 'industry'and the legal 'industry'. There is no end in sight.
If you have no insurance? You might as well go ahead and declare bankruptcy.
This country is rapidly approaching total meltdown and I suspect many on the sidelines are cheering for it. At least maybe then the 'professionals' will feel the pain as well.
In my small town this last weekend a disabled fella finally decided to end his misery. He placed a revolver in his mouth and blew his brainstem out the back of his head.
Yesterday a youngish fella(30 something) I had driven grain trucks with had 2 stents and 3 ballons. Next day he was judged a candidate for a implant of a defib...but he was far too weak to survive the operation. He condition is very clouded. He hasn't a stick of insurance. If he survives he will spend the rest of what he has left fighting the collection agencies.
These stories are seeming to be coming more numerous of late. Huge numbers with pneumonia and double pneumonia these last 2 months. Lots of large confinement feeding operations go on here and I suspect perhaps antibiotic resistance bugs are causing a lot of problems.
I had a pulmonary test last week and did quite well but the tech told me it was astounding the large numbers of young people now failing his tests. More and more diabetes cases.
Our country is full of filth and dirty food. Some homegrown and lots imported. Our hospitals are full of dangerous microbes that seem to flourish there.
What advances have we really made here? How are we any better off than when I was in High School(class of '57')?
I ate better for sure. I enjoyed life more. The future seemed bright. We all got many factory jobs that paid well.
You had pensions then and the cost of a childbirth was about $100.00
To me since about the 80s its all been going downhill.
Hope for the future? There is none. What do our children have to look forward to? Nothing.
There no longer exists an American Dream for its become the
American Nightmare.
Bak in the 1950s when a young guy had clogged heart arteries he died. There were no stents, no coronary bypasses, no statin drugs, no blood pressure drugs. You got heart disease? You died. Much cheaper.
People who look back in nostalgia ought to ask why medical care is so expensive. One big part of the answer: medical care today can do far more.
Cost of childbirth: It could still be cheap if you use a midwife. Just hope that the baby doesn't have a problem while being born. But if it does you could handle it the old way: let it die. Again, big money saved.
American Nightmare: Well, we had a lot more oil in the 50s too. But the older generations spent their lives burning thru it. Also, they had babies who are burning their way thru it. Plus, the older generation elected politicians who lowered the border barriers and boosted the population and drove up home prices that way.
People ate better in the 50s? I'm under the very strong impression that fresh vegetables and fruits weren't available for as much of the year. Also, in the 50s people didn't know as much about which foods were good or bad for them. I like knowing which foods are better for my health and which are worse.
Look, some things have gotten worse. But who is to blame for that? Not just The Powers That Be. Try the vast bulk of the voters. Try those dummies who had lots of babies.
stuart re
'Calls to stockpile http://thearchdruidreport.blogspot.com/2007/11/lifeboat-time.html food are way off the mark in my opinion. We have a huge amount of room to eat more cheaply by eating less processed food and less meat.'
i don't think you are being fair to greer there. .i
think greer's call there is to stock/build your lifeboat
now . it was not related to inflation; it related to signs - housing problems, oil prices[peak oil], drought in atlanta area,- of something bad about to
happen [ala '29,'45].
evidently greer corrected his 20% inflation as i didn't see it in the other link you gave.
as you say their are some healthful ways to fight food costs.
thanks for focus on food & one of the greatest tragedies unfolding ; allowing developing countries to slide intto hunger .
Addendum: Via the Drudge Report, an International Herald Tribune piece "World food stocks dwindling rapidly, UN warns" on the FAO report.
Food vs Fuel? What’s the damage? There are some marginal food consumers in the world, by marginal I mean if the price increases at all, they will be priced out of the market and die. 1st generation biofuels reallocate agricultural capacity from food to fuel. The reduced food supply, all else being equal, will increase the price as the market mechanism allocates what is available to those most willing/able to pay.
If we know the number of marginal consumers, their food-price-sensitivity (deaths per cent increase) and the supply-sensitivity of the price then the deaths per barrel of 1st generation biofuels can be calculated.
0.1 ? 1? 10? I don’t know, but it seems to that simply because there are marginal consumers and because reallocation of supply away from food must increase price, such a relationship, all else being equal, must exist. If it was determined that a tank of corn-ethanol “cost” the lives of three Bangladeshis, would it still be regarded the “green” choice?
I understand your concern but reiterate what I said above. Farmers don't grow crops in order to lose money so the food can be given away to poor people. My impression is that governments purchase(d) a lot of food to be distributed to the third world because most of those people do not have enough money to buy food at market prices.
What I see now is that some governments are subsidizing crops to fuel rather than subsidizing crops to other countries poor as food. The ethical dilemma is "Are subsidies that may help maintain an economy better than subsidies that feed the poor at the expense of the economy?".
Both Chris and NC are hitting the nail on the head. My 2 cents:
- When looking beyond the US, replace "corn ethanol" (which is pure idiocy from the net energy and fertilizer requirements viewpoints) with "soybean biodiesel" and you get the prospect for South American countries. Prices of wheat and corn will be affected all the same, through land arbitraging based on profits per hectare.
- In one of those countries (Argentina), the government is forcing farmers (via export taxes) to in effect give away food to LOCAL poor people. But even in that case, you can bet that, when oil prices rise in earnest (after 2012?) those governments will not feel the "moral imperative" to feed OTHER COUNTRIES' poor people when deciding the share of crops to be diverted into biodiesel production.
So, the ethical dilemma "Are subsidies that may help maintain an economy better than subsidies that feed the poor at the expense of the economy?" will, in effect, have two answers, depending on whether the poor in question are local or foreign.
I'm not saying that's the way things should be. I'm saying that's the way things will probably be.
An interesting linkage is between the high value added of processed foods and women in the workplace.
Is it more economical to have one's wife stay at home and bake bread using 16 cents/lb flour or to work outside the home and buy bread at the store?
Of course, MY wife does neither......
deleted
For years we have heard NGOs and other development organizations decrying the agriculture subsidies in developed nations that allow them to flood the world with cheap commodities. These subsidies have suppressed the development of Third World agriculture, especially in sub-Saharan Africa with its tired, poor unglaciated and non-volcanic soils and its local crops which have not gone through a Green Revolution style breeding development.
We have seen rapid urbanization of the Third World because of rural poverty. Higher grain prices will be good for developing world farmers who have a surplus to sell. It will be hard for the urban poor, but urban areas are more wealthy in general and have greater ability to absorb the added cost. The experience of Malawi, which tripled food production recently by going against IMF agriculture policies is an example of what is possible in the Third World. This is not to minimize the problems of the landless poor, but there is a positivie side in that higher food prices have the potential of revitalizing the rural economy and reducing the rate of urbanization.
Today's commodity prices are high only in relationship to the extremely low prices of the last quarter century. In the last 35 years, U.S. agriculture has had two watershed moments: the abandonment of production controls in the farm bill in favor of maximizing exports, and the mid-80s farm shakeout which eliminated inefficient operators (those who did not have good cash flow and input cost management practices). It was Earl Butz, Richard Nixon's Ag Secretary, who instituted a wide-open planting policy. The primary tool was the lowering of the Commodity Credit Corporation loan rate. The CCC loan rate is the established value of grain as collateral for short-term operating loans. If the market price goes below the CCC loan rate, the farmer defaults on the loan and the government takes ownership of the grain. Until recently, the CCC loan rate effectively set the world price for grain. To compensate farmers for the resulting Depression Era price levels, deficiency payments (i.e., subsidies) were instituted.
Today's so-called high prices are lower than the ordinary prices of four decades ago. To demonstrate, I've taken average annual prices for the years 1958-1966 (when production controls were in effect) for some major commodities and converted them to constant 2006 dollars. Prices are listed in the order: highest year/lowest year/average for the 9 years/and, for comparison, 2004 prices (also in 2006 dollars). These are wholesale farm prices, not grocery store retail.
High Low Avg. 2004
wheat/bu. 12.11 8.48 11.12 3.64
corn/bu. 7.75 6.68 7.27 2.09
soybeans/bu. 17.12 13.19 15.29 5.46
hogs/cwt. 140.90 94.13 112.05 52.75
beef/cwt. 152.10 114.48 135.15 91.91
chickens/lb. 1.22 0.87 0.97 0.48
eggs/doz. 2.66 2.11 2.29 0.60
milk/cwt. 29.54 26.39 27.56 17.26
diesel/gal. 1.13 1.03 1.07
We don't know yet what the average national price for 2007 will end up being, but wheat is now running in the $9 range, corn is in the $4 range, beans are in the $11 range, steers are around $92 and hogs are $55. You can't use Chicago Board of Trade prices because no farmer gets that price. Remember, farmers buy retail, sell wholesale and pay the freight both ways. The farther you are from a major shipping point, the lower the price at the local grain elevator.
For a good view of what food prices were like in the past, there is a very interesting graph on page135 in Fernand Braudel's The Structures of Everyday Life, Vol. 1 of his three volume study Civilization and Capitalism: 15th-18th Century. It shows the price of a quintal (100 pounds) of wheat in France from 1400 to 1950 as measured in hours of manual labor it took to buy it. The post-Black Death era was comparitively prosperous, as it only took between six and seven hours, on average, to buy a hundredweight of wheat in the years 1400-1540. Then the price started climbing, averaging about 100 hours until the 1830s when it started a steady decline, reaching just 3 hours in 1950 (which works out to about $6 per hour -- minimum wage range). By 2004, an American working at minimum wage could buy a hundredweight from a farmer with one hour of labor.
Braudel emphasizes that the 100 hours of labor for 100 pounds of wheat is a critical point. At that rate, one hour of labor will feed one person for one day (at the minimal level of 2,000 kcal). To go beyond it is a danger sign, and to go to 300 is a sign of famine. The high point of 450 hours was hit in 1710. On page 132, Braudel has a pie-chart of a Berlin brick mason's annual budget for a family of five in 1800. Bread, alone, took up 44% of his income, with all food using up nearly 3/4 of it. It's clear that today, far from farmers being subsidized by consumers, it is consumers who are getting the lions share of the benefit of a cheap food policy.
It has become fashionable of late to blame corn ethanol for high commodity prices. Ethanol has a part to play, but its contribution only explains a small part of the variance. The two elephants in the room are inelasticity in food production (a concept TOD readers should be familiar with), and a steadily increasing demand for meat in the developing world, especially in China.
World population has finally caught up with the Green Revolution. The biggest jump in prices happened in wheat, a primarily human food, and is a result of two crop failures in a row in Australia. World strategic grain reserves are dangerously low. This sounds like oil, doesn't it? If we only ate plants, we would not be at the danger stage yet, but we want meat in greater and greater quantities and we have the money to pay for it.
Except in Latin America and sub-Saharan Africa, corn is primarily a feed grain. The feed to protein conversion ratio (consider it agriculture's EOROEI) is 0.08 for cattle, 0.12 for pigs, 0.3 for eggs, and between 0.3 and 0.5 for poultry. At least pigs are scavengers and slop eaters and have a role as recyclers of waste food. Chickens, as seed and insect eaters, are the most efficient and should stay in the mix. But I'm not sure how much longer we can afford to keep feeding grain to cattle. In the U.S. we have a lot of grasslands. That's where cows are born but not where they die. If we would accept less marbling in our beef and eat less of it, we could easily meet half the present beef demand with strictly grass fed cattle. We will, however, need to do a better job of teaching ranchers to be botanists. We already do a good job of teaching them how to be vets.