| Former CEO of Talisman Energy: Peak oil is 'here or hereabouts' | The Oil Drum | DrumBeat: February 1, 2008 |
Satellite O'er the Desert
Posted by Stuart Staniford on February 1, 2008 - 2:33am
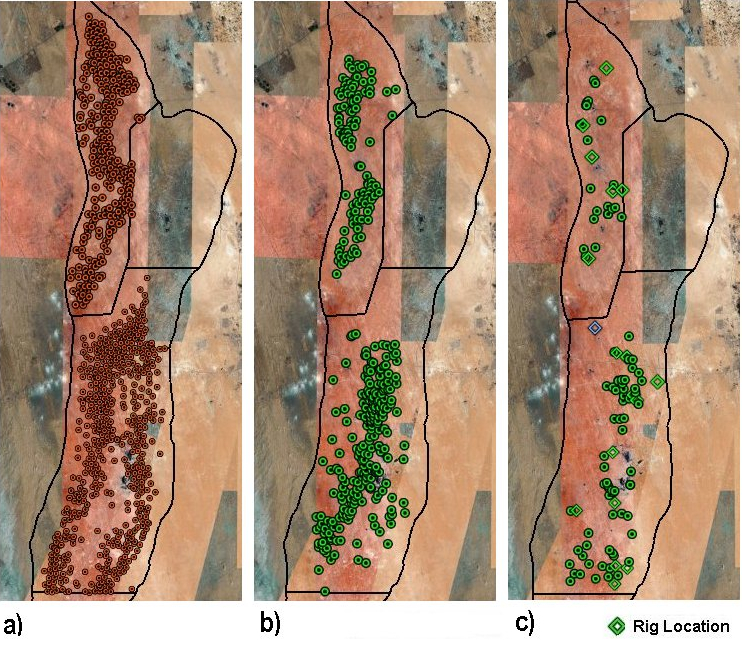
Oil Wells in 'Ain Dar and Uthmaniyah: a) before ca. 2000, b) between 2000 and 2003, and c) developed after 2003 including sites prepared for drilling and those undergoing active drilling in summer 2006. Water injectors are not shown. Source: Satellite O'er the Desert .
TOD editors and contributors have been privy for some time to some absolutely incredible work that TOD commenter JoulesBurn has been doing analyzing Saudi well sites in Google Earth. We've urged him multiple times to summarize his work in a guest post, but he's been taking his time perfecting it - poring over every square mile of Ghawar, to the point where he has identified and classified 3000 well sites in that field - an extraordinary feat of diligence.
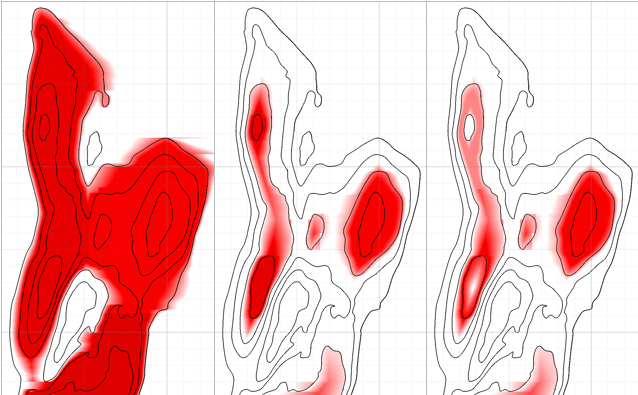
Happily, he is now sharing his work with the world on his own blog Satellite O'er the Desert which promises to be a major resource for students of Saudi oil supply. My favorite image was the one above. For comparison, here's my model of 'Ain Dar and Shedgum's oil level in 2004 from Depletion Levels in Ghawar:
Contact
- Content: editors at theoildrum dot com
- Tech support: support at theoildrum dot com
License

This work is licensed under a Creative Commons Attribution-Share Alike 3.0 United States License.
Can we be in doubt that something similar can not be done by US intelligence :-)
Hence the US knows exactly the situation in SA.
GREAT WORK Jouels :-)
"Can we be in doubt that something similar can not be done by US intelligence "
Just read the book "Legacy of Ashes" and yes we can be in doubt.
FF
Amen. Never underestimate the institutional incompetence of the intelligence community. Just one anecdote: War Story
Ditto.
But great work, Joules.
Interesting work, and I went over and checked out the JoulesBurn blog, very interesting, although it would take hours of study and following out all the links to get the full benefit.
More interesting to me is that this type of work could be expanded to make for an interesting Saudi overview. I have long said that if we assume that Ghawar is beginning to tap out, and if KSA wants to stay in the oil business in a big way, then the frontiers are Khurais, offshore Persian Gulf, and the empty quarter.
Can we get Google Earth images of the above areas, to see if any activity is picking up in these three frontier areas (although Khurais cannot be considered frontier in the normal sense, having been known for a long time and now being developed)
Perhaps we could set up a "volunteer" amateur group, sort of like the amateur astronomers that watch the sky for asteriods, to link up and scan various areas of Saudi Arabia (and the world....exactly what is going on offshore China or South America?).
An interesting project to consider!
RC
Thanks, Roger. I will be posting on the other areas of KSA as well. As far as other areas of the world, one big problem is that with many of the frontiers, one has to see through water as well as "see" through the rock. I have poked around Alberta a bit, but it's just too depressing.
How about Russia? Could Russian production be monitored in this manner?
This is fantastic work.
Well, now you've done it.
Samotlor is visible (but daunting because there are thousands of wells), Sakhalin is somewhat visible, but Romaskino has just low resolution so I haven't found anything yet. Another year, another project.
Hmm. Sounds like a grant application to me. Someone has got to want this kind of information made publicly available. NGOs, perhaps?
I have been reading the Satellite O'er the Desert blog, and the job being done is truly remarkable. We are very lucky that these satelite images exist and are posted for free, so that some of the Aramco secrets can be revealed.
Noob question: why there arent any wells in the top right area of Ghawar (i presume Shedgum), corresponding to the red area on the right of the 3rd image from the modeled distribution? is it a satelite image problem(low res), or am i missing something?
There are wells there in Shedgum, of course, but Google Earth is not covering a big swath of that area. I have identified where the older wells are, so if GE ever gets around to using an updated high-res image (which exists--they are just being lazy!), a similar analysis could be done there.
If you know where to get updated high-res images of that area, then I can forward it on to my former colleagues and they'll get it included. However, I suspect the problem is that whoever it was that took the higher-res images wants to charge Google an arm and a leg to license it. Unfortunately a lot of areas in the world don't bring in enough advertising dollars from local search to justify the expense of acquiring better pictures.
Every last acre of Ghawar is covered in one or more 2006-2007 images from DigitalGlobe, the best out there. I'm convinced that someone is paying DG to take these shots. Why some of them are not being used (2006 Shedgum and Haradh images) is beyond me. A 2006 high-res shot of a small, isolated, but interesting (from an oil standpoint) area of Uthmaniyah was suddenly included a year after it was taken. There is also a 2007 DG image covering an area just south of there that I would like to have.
I would imagine that Google Earth has license to all of DigitalGlobe existing imagery such that they don't pay by the piece. If an image exists (e.g., someone paid for the photoshoot), the bottleneck is GE taking the time to correct for azimuth skew and put it in the right location. I don't think the decision to do that for a particular area is random, either.
Shedgum appears to have two high spots, a smaller one to the west and a much larger one to the east.
The missing high resolution swath appears to be centered on the larger eastern high spot, but the western smaller Shedgum high spot (which Stuarts red & white photo/graph show to be full of oil an not depleting between b & c) appears to be fully in the high area, but with no wells or rigs operating there.
Is this so ?
And if true does this imply that this small high spot is now depleted ? (or held in reserve ?)
Note that the small spot of Shedgum would be a major field in the United States.
Alan
Stuart's model for depletion assumed that the Arab-D reservoir is being depleted evenly from the bottom up. Thus, the higher spots would be the last to go. However, especially for Shedgum, this is not always the case. The remaining oil in Shedgum is to the west of the crest and on over to 'Ain Dar. A figure from Stuart's presentation at ASPO shows that, and I will do a post on Shedgum before too long. Perhaps GE will bless me with an update first.
Stuart's western "high" spot for Shedgum is in a high-res coverage area, but in a small strip dating to 2003 and there are maybe a couple of new wells evident then. Using a low-res 2006 image as an overlay, I can tentatively find about 9 more. There are also a couple of new wells on the west side of the "dead" zone, but it's otherwise rather quiet over there.
Congratulations to Joules in completing this analysis work! I only wish I had had the time to complete the similar work I was doing for comparison - but the real world intervenes unfortunately. Of course it doesn't help when a windows crash zeros all the marker collection...
Here's two scene setting videos from that time that might be of interest:
Ghawar flyover tracing from a well head to the dockside
http://www.youtube.com/watch?v=Uk9rYPGX6UQ
Flyover of Ghawar from north to south, taking in the sites
http://www.youtube.com/watch?v=plrP1lmFDsY
[warning: Ghawar is a whole lot of nothing in the main]
Thanks for your help with this effort, Gary.
You do need a soundtrack for the video. Did you have elevation exaggeration set to max?
"Road to nowhere"?
I was just trying to get Youtube to accept the video at the time. I think I did wind up the elevation exaggeration, but its a long time ago now. Its interesting you can see the dip between Ain Dar and Shedgum on the surface as well.
I'll try and look out my colourful overlay sometime and post it, wherever its go to after the disk crash.
So the current situation is the sum of figures b and c (as c means developed after 2003). So it may not be that bad, but certainly striking compared to a.
Depends on the well lifetimes. They run from about 40 years to 2-3. Anything less than two is probably a loss.
But 5-7 years is quite common for well lifetimes these days. So only a portion of the wells drilled in b are still active. The key piece is of course if he has discerned any wells drilled in say 2003 that are now capped or converted to water injection.
(1) Saudi Arabia claimed they were producing 9.2 million barrels per day. Their addition of massive projects offset declining production elsewhere.
http://www.guardian.co.uk/feedarticle?id=7273207
(2) The increased drilling of Ghawar might steepen its decline rate.
(3) From what I have read I may assume some wells were an attempt to find and retrieve pockets of oil bypassed by the water flood and were not tapping the main pools.
Uthmaniyah has finally got rid of its mohawk.
FF
Hello F_F,
Yep, that huge center area, now punched full of holes, has tremendous implications for KSA going forward when those wells start to water out for good.
Outstanding Work, JoulesBurn! Massive kudos for your efforts!
Bob Shaw in Phx,Az Are Humans Smarter than Yeast?
Recall Richard Heinberg's comment in August, 2006 that he had heard from what he described as a reliable source that the Ghawar complex was down to 3 mbpd?
My theory is that the Saudis were shocked by the increase in the water cut on the north end of Ghawar in the much the same way that Shell was shocked by the increase in the water cut in the Yibal Field. Also, recall the sudden collapse in the Saudi stock market in the first quarter of 2006, when the Saudis announced that they could not find buyers for all of their oil, "even their light/sweet oil?"
In recent years there were four fields still producing one mbpd or more of crude oil--Ghawar; Cantarell; Burgan and Daqing. There is no doubt about Cantarell and Daqing being in decline. And I don't see how there is much doubt that total production from the Ghawar complex is in long term decline. The Kuwaitis have made conflicting statements about the Burgan complex, but given the age of the field, I think that most outside observers believe that the complex is in long term decline.
So, given the near certain decline of every oil field that has ever produced one mbpd or more of crude oil, what is the prospect for increased world crude oil production.
BTW, Leanan posted a new item yesterday that showed a 15% increase in Saudi crude oil consumption in 2007.
I don't think Heinberg's source is right. That comment was made over a year ago, and KSA doesn't have enough capacity in their other fields to make up that difference--particularly of lighter-grade oils. They are producing too much oil for Ghawar to be down to 3 mbpd.
Of course, we don't know what the recent Ghawar complex production was. What if the complex went from 4 mbpd in 2005 to 3 mbpd in 2006?
BTW, to put 3 mbpd in perspective, peak Texas production was 3.5 mbpd, so the 1935 to 1972 average production was probably not much more than 2.5 mbpd or so. With this level of production, Texas was the key oil source for the Allies in the Second World War and it allowed the Texas Railroad Commission to effectively control world oil prices for about 35 years.
For the past two years, Saudi Arabia--like Texas in the Seventies--has responded to higher crude oil prices with a big increase in drilling and with lower oil production (relative to 2005).
Does anyone know what the Saudi production by oil grade is?
The only data I know of is in the IEA OMR which shows imports to the OECD from KSA by grade (it's table 6 if memory serves). However, without knowing what the rest of the world is getting, it's hard to infer too much from this.
The Baqi/Saleri CSIS presentation shows it producing on plateau of 5mbd through 2003. SPE 93439 (the 'Ain Dar water management paper) shows North 'Ain Dar still on plateau in 2004. From Brian's work, we know that there was a furious campaign of drilling in Uthmaniyah and 'Ain Dar in 2000-2003 to maintain the plateau (one imagines the situation in Shedgum was similar). The well profile data we have in these areas (which admittedly is only two well profiles) from IPTC 10395 (the MRC paper on Ain Dar/Shedgum) show plateaus of only 3-4 years in the Shedgum well (Fig 21) and 1 year in the 'Ain Dar well (Fig 22), followed by steep declines tp zero over about 5-6 years in both cases. So I would guess that once the drilling campaign tailed off, production in the whole region would begin to decline within 1-2 years, and would tail off to very little within about 5-7 years years.
It appears from Brian's picture that the drilling campaign has tailed off since 2003. So it seems to me this suggests that North Ghawar is no longer on plateau, and this is well timed to be part of the explanation for why Saudi production declined in 2006-2007. We know that about 2mbd of production went missing from the KSA plateau in 2004 to the plateau in late 2006/early 2007 (1mbd top line production loss, and about 1mbd between Haradh III and Qatif/Abu Safah megaprojects). However, production has now stabilized, and even increased a little bit in late 2007, so whatever is left is not declining right now (on a net basis).
A possible hypothesis is that 'Ain Dar and North Uthmaniyah have gone off plateau and are depleting rapidly or mostly depleted, but Shedgum still has significant oil left (my model suggested Shedgum was in the best case), and drilling campaigns in Shedgum and in South Ghawar have managed to hold production loss for the time being. I look forward to more of Brian's posts with great interest!
Just a point: We don't really know that Saudi production has now stabilized, or that the Saudis managed to increase production a little bit in late 2007. All we have are reports that there was an increase in exports from Saudi Arabia in late 2007. And we have later reports that the increase was followed immediately by a 2% decrease in exports.
It's certainly reasonable to assume that Saudi consumption is rising fast, but that fast in one month?
That's exactly the problem I'm having with this - how did domestic consumptions rise so fast? Either there's a logical reason for that, or they're using that idea to mask reduced production. In any case, it's obvious from the flurry of recent drilling, it represents a desperate, possibly even panicked attempt to maintain plateau production.
Burning crude oil for electricity instead of NG (as KSA is doing on a wide scale) can certainly jump domestic consumption.
Best Hopes for burning NG (from Qatar ?) for producing electricity.
Alan
Why would the Saudis burn oil for electricity rather than buy natural gas from neighbors and export the oil? I would expect their cost in dollars per million BTU would be much lower that way.
Economics is not everything !
The WSJ mentioned 60,000 b/day of crude oil is burned to power a new aluminum smelter that employs 10,000 people.
Alan
The only real chance at the moment is for a sudden rash of political stability to allow for increased production in Iraq, Nigeria, and Venezuela. This combined with a perfect world in new projects and you might see them fight the peak for another couple of years.
One other thing to look at is crude + condensate vs total liquids. In the face of peak oil, you'd better believe everyone is going to try and produce any liquid they can in as much quantity as possible. Biodiesel, tar sands, shales if they can get it, coal to liquids, NGL, ethanol and anything else a good scientist can dream up.
I guess it's possible total liquids could eek out a gain with everyone scrambling for whatever option they can plug into the system. Pressure will also increase for the US to release North Slope oil and you'd better bet the Arctic will see some serious exploration.
The drama isn't over just yet. The world hasn't ever been presented with this kind of challenge. So I'm honestly interested to see how things play out.
Amazing work.
Can you give the Lat / Long coordinates for the Upper Right and Lower Left corners of the area? do you have a kml file?
Here's a Google Maps link to one of the rigs visible in 'Ain Dar (at 25deg 50'45.75" N, 45deg13'14.60"E) :
http://maps.google.com/maps?t=h&hl=en&ie=UTF8&ll=25.846247,49.221215&spn...
Here is a link to a kmz file with the wells. Don't try the Google Maps version, as your computer will probably die.
http://bbs.keyhole.com/ubb/showflat.php?Cat=0&Board=EarthEnviro&Number=9...
Many thanks, this is really an outstanding work!
I noticed that what Digital Globe tile has been updated east of Hawiyah and we can easily see some significant changes (probably consistent with the new Hawiyah NGL plant (http://www.hydrocarbons-technology.com/projects/saudi-aramco/)):
January-2008:

July-2007:

Yep, that would be the Hawiyah NGL plant on the far right and the Hawiyah Gas Plant on the left.
I've wondered if a similar thing could be done in the US with pipeline terminals that use floating roof tanks. You could estimate the inventory level in the terminal by the level of the roofs.
Do you fear for your safety? You are prying into state secrets worth trillions that are classified even to members of the US Senate, after all.
Well, you see, there is another site (for the moment I've mislaid the link) where Joules' vital signs are reported in real time.
They are regarded as a contrary indicator for being long oil.
BTW Joules, you had your flu shot?
At this point, the cat is out of the bag and something as dramatic as a disappearance would just attract attention where it isn't wanted.
Excellent work Stuart
Do you have any way of distinguishing simple vertical wells from complex directionally drilled wells with multiple side wells? e.g., could fewer wells be providing greater drilling and recovery productivity?
When you compare the wells in Haradh III with the simple Ain Dar wells on satellite views its quite possible to tell the difference.
MRC seem to provide 3x simple vertical wells, according to SA numbers.
Gary,
There are no Haradh III MRC wells visible with Google Earth. The imagery there dates to 2004, except for injectors on the eastern fringe. You are probably looking at gas wells.
The difference are subtle, at best. There is no difference in the wellhead. I really doubt that one could tell the difference between a vertical well drilled today and a horizontal and/or MRC.
Here is one that is definitely an MRC (ANDR-534, the first MRC up north):
http://maps.google.com/maps?t=h&hl=en&ie=UTF8&ll=25.918005,49.244685&spn...
See the post on well types here:
http://satelliteoerthedesert.blogspot.com/2008/01/types-of-wells.html
JB
Hmm,
One of the question I meant to ask is how you could be certain what was what.
Given
You would expect to see evidence of Haradh III MRC wells in 2004, such as:
http://maps.google.com/maps?t=h&hl=en&ie=UTF8&om=0&ll=24.150346,49.12164...
In particular, the reason why I think these are Haradh III MRC wells is the sharply defined, recent, construction. Compared to
http://maps.google.com/maps?t=h&hl=en&ie=UTF8&om=0&ll=24.150346,49.12164...
they are very different. A few years of blown sand makes a real difference to definition - and there are so many of them in that area.
You posted the same link twice, but I think I know what you mean. I am absolutely positive that these are gas wells. I'll do a post on the Haradhs soon, but look at the image below and then open up this KMZ file in Google Earth:
http://bbs.keyhole.com/ubb/download.php?Number=927033
You will find that all those wells with those features connect to manifolds and then to gas plants. Ditto in Hawiyah, Uthmaniyah, and the other one is in Shedgum. Oil wells connect eventually to GOSPs. The GOSP for Haradh III is in the middle of the field and is under construction in 2004:
http://maps.google.com/maps?t=h&hl=en&ie=UTF8&ll=24.124702,49.121007&spn...
According to the EIA (USA):
"In December 2006, Saudi Aramco announced its 2007 exploration and drilling budget of almost $4 billion - nearly double the draft budget and full quarter of Aramco’s 2007 capital budget. According to Oil Daily reports, Aramco plans to drill 427 onshore and offshore crude oil development wells in 2007. Approximately 134 wells will be in or near Ghawar, while 85 will be drilled in Khurais, and some 50 drilled in Khursaniya.
One challenge for the Saudis in achieving their strategic vision to add production capacity is that their existing fields sustain, on average, 6 to 8 percent annual "decline rates” (as reported by PlattsOilgram) in existing fields, meaning that the country needs around 700,000 bbl/d in additional capacity each year just to compensate for natural decline."
See source: http://www.eia.doe.gov/cabs/Saudi_Arabia/Oil.html (Govt. publication in the public domain)
This depletion is one reason the Saudis may have reported 9.2 million barrels per day (C+C ?) instead of the 10-15 million barrels a day they once boasted they were likely to attain. According to some forecasts they should have much greater capacity than these 9.2 million barrels per day. New projects replaced depleted areas without substantially boosting production. It is like a gerbil on an exercise wheel. The more they drill in Ghawar the faster it depletes. Their newer projects may not decline as rapidly until they might go back to try to get more oil flow per field as was planned with Shaybah.
If they wanted--and more importantly were able--to match their 2005 net export level, I estimate that their 2008 Total Liquids production, because of rising consumption, would have to be about 11.7 mbpd, versus 11.1 mbpd in 2005.
man, I love TOD just because of posts like this. Fantastic work.
I went here: http://earth.google.com/support/bin/request.py?problem=billing&extra.cus... and requested that they do a higher resolution scan of the whole area. I suggest more people do that.
Looking at the three images paints a compelling picture for a field that is moving to the end of its water-flood production, with reduced production in its future. US intelligence has an excellent satellite-based perspective on the world, and so had likely observed this trend by the 2000-2002 time frame. With oil essential to the empire, IRAQ presented a compelling case of under-exploited reserves. Voila - that oil must be secured!
Great work JoulesBurn. It compliments the other excellent work by TOD leaders.
A most notable contribution to an essential part of the Peak Oil debate and analysis.
Well Done !
Alan