Depletion Levels in Ghawar
Posted by Stuart Staniford on May 15, 2007 - 11:52am
Introduction
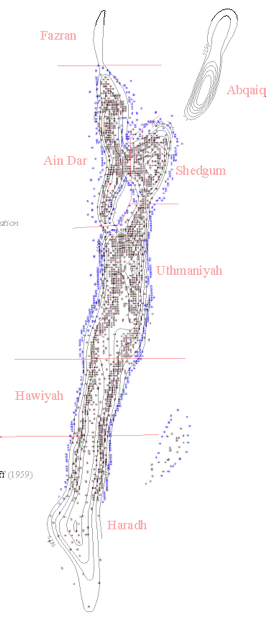
This analysis is a summary of my attempt to understand two pictures, which implicitly pose two questions.The first picture is this:
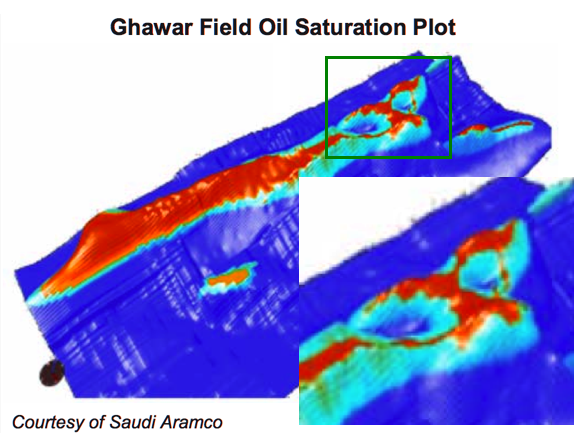
Here the question is: is this an accurate picture of the state of recent depletion of Ghawar? (Ghawar is the world's largest oil field, and source of over half of the oil produced by Saudi Arabia).
And if so, then the second question arises: does that depletion have anything to do with this picture?
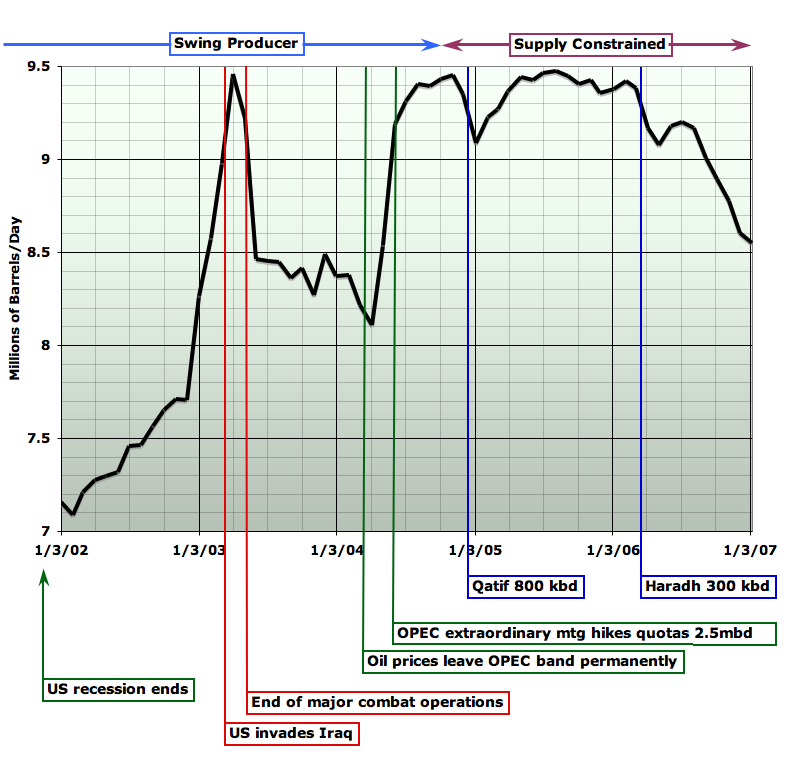
In particular, Saudi oil production has been falling with increasing speeed since summer 2005, and overall, since mid 2004, about 2 million barrels of oil per day in production has gone missing (about 1mbpd in reduction in total production, and about another 1mbpd in that two major new projects, Qatif and Haradh III, failed to increase overall production). That's 2.5% of world production and, if that production hadn't gone missing, gasoline in the US likely would still be somewhere in the vicinity of $2/gallon instead of well over $3.
I will analyze six or seven separate lines of technical evidence, and argue they all point to a consistent picture, which says that the answer to both questions is "Yes". Yes, the northern half of Ghawar is quite depleted. And yes, this probably explains at least part of recent production declines. Furthermore, it is likely that more declines in Saudi production are on the way.
The evidence in question comes from quantitative forensic correlation of hundreds of disparate pieces of data from dozens of technical papers about different aspects of Ghawar. Thus this analysis is very long and detailed - my apologies to the reader. It summarizes 300+ hours of work on my part, and probably similar amounts of work by several other members of the loose Oil Drum coalition investigating Ghawar and (most particularly Euan Mearns, who has posted his own thoughts and Fractional_Flow). It's just a lot of material to document. And in attempting to address both the detail needed by technical readers and the explanations needed by less-technical readers, the length has grown further. Given the importance of the subject, in a choice between being thorough and being brief, it seemed better to be thorough. I will at least do my best to be clear in my exposition.
The Linux Supercluster Picture
Let's first go over a little background to make sure we understand what we are looking at. We'll start with this schematic of part of Ghawar (courtesy of Euan Mearns):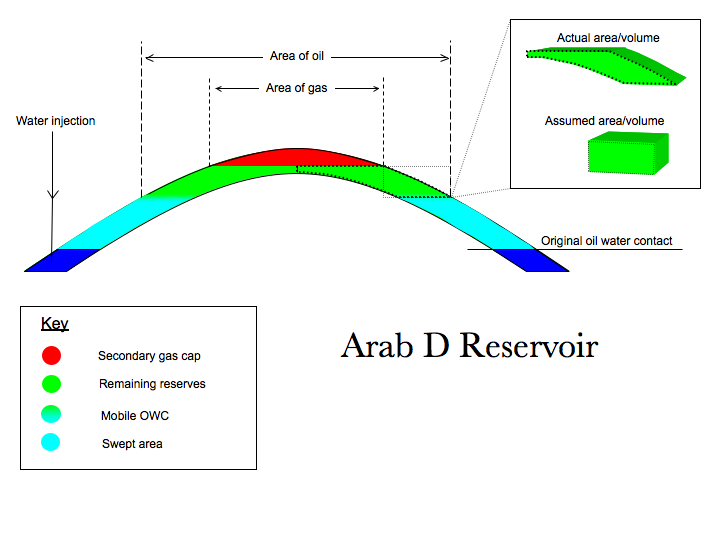
An oilfield consists of some layers of rock, the reservoir, which contain pores, spaces between the rock grains, which contain some combination of oil, water, and natural gas. Above the reservoir is a cap of some kind which will not allow the passage of fluid and which is shaped to trap the oil and gas from migrating upwards. This they otherwise would do because they are lighter and more buoyant than the water that tends to fill rock pores underground.
Roughly speaking, the green volume in the picture above is the oil, and the dark blue volume is the water that was originally below it. This is not quite true, as the oil region invariably has some droplets of water still trapped in the rock pores as well: this is the initial water which cannot move. There may or may not be a cap of natural gas above the oil, depending on which part of the field we are in.
Oil in Ghawar is being produced by peripheral water injection. In this case, in addition to the natural water below the oil, water is being pumped down special injector wells at the edge of, and thus below, the oil area. The pressure of that water is slowly forcing the oil up the structure to wells at the top, from where it flows to treatment plants. The pale blue area in Euan's picture above is the swept area that used to be oil, but now is mostly water. Unfortunately, it's not all water. Just as there was some water in the oil before we started, there will be some oil in the water when we are done. This residual oil, which will not come out from any amount more flooding by water, consists of little droplets of oil beaded up and stuck in small pore channels in the rock.
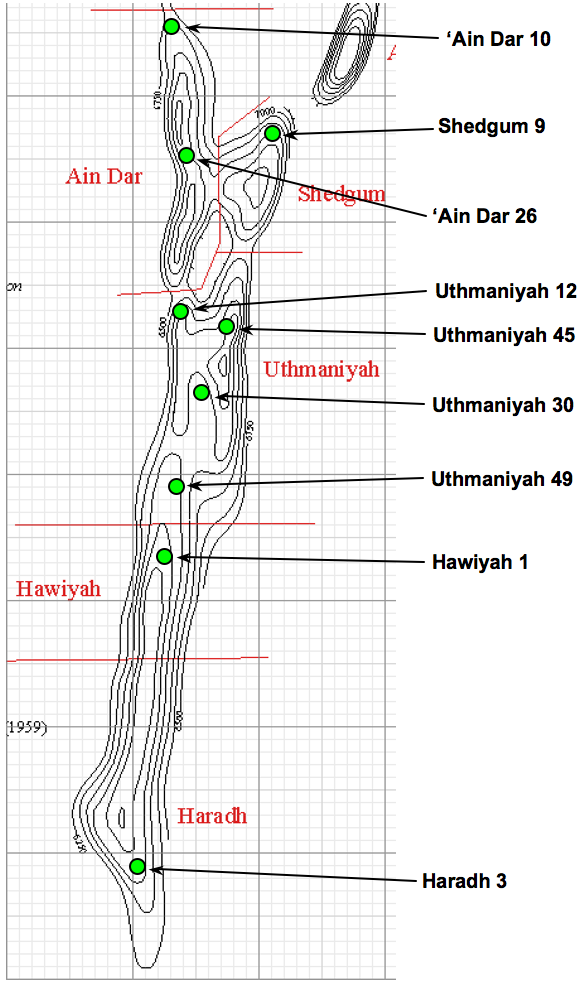
So with that understanding, let's look at the Linux supercluster picture again. By default (or if you click the "Region Labels On" button), we are looking at labels of the division of the field into major operating areas. For readers new to the subject, it will be particularly useful to take a minute to become familiar with these.
- 'Ain Dar is the northwestern operating area, divided into two crest structures - underground hills in the reservoir shape - North and South 'Ain Dar. This area is of very high quality reservoir rock (holds lots of oil and lets it flow easily) and was the first discovered and put on production back in 1951. The picture shows it quite depleted now.
- Shedgum is in the North East, and is also of very high quality, and also shown quite depleted in the picture.
- Uthmaniyah is in the center of the field. Northern Uthmaniyah consists of a distinctive dual crest structure (two north-south running ridges with a lower area between them. Northern Uthmaniyah is also very productive, but southern Uthmaniyah much less so.
- Hawiyah is the area below Uthmaniyah and is of much lower quality. It was put on production in the 1970s, and is not very depleted in the picture.
- Haradh is the southernmost region in the field. It was developed in three phases beginning in 1996, and concluding in 2006 with the bringing on stream of Haradh III (the southernmost portion). Haradh is the poorest quality part of the field and this will limit the rate of production. The picture shows it only slightly depleted.
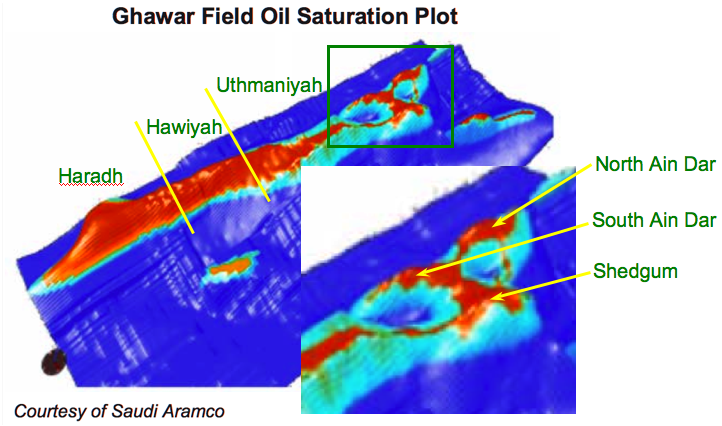 "Linux Supercluster" visualization of oil saturation in Ghawar, with focus region on 'Ain Dar and Shedgum regions at northern end. Use buttons to cycle labels. Source: Figure 3 of Linux Clusters Driving Step Changes in Interpretation Simulation. (pdf).
If you now click the "OWC Labels On" button, you will see labels that show, for the northern operating regions, where the contact between oil and water was before production started - the original oil water contact (OOWC). I've also shown as "OWC2004?" the approximate level of the oil water contact (OWC) at the time the picture denotes (perhaps 2004), and, in yellow, the crest of each structure, which is where the water will reach to when all production by waterflood is over. At that point, this picture would show those "hills" as all pale blue (at least if all oil could successfully be produced).
As you can see, the picture shows quite a lot of the "hills" already being free of oil. Although it's hard to estimate precisely, I don't think you could say that the average height of the top of the pale blue swept area has reached less than 55% of the height of the structure. Similarly, I think it's definitely less than 75% of the way up - overall it looks about 2/3 of the way up. I encourage you to stare at the picture and make your own subjective estimate to see if you think my range is reasonable - I will be comparing this to other estimates later.
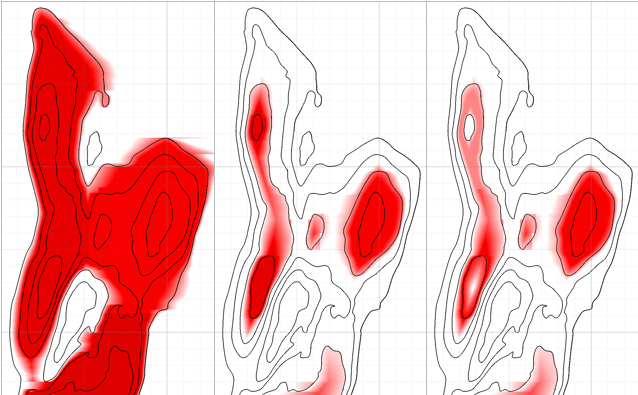
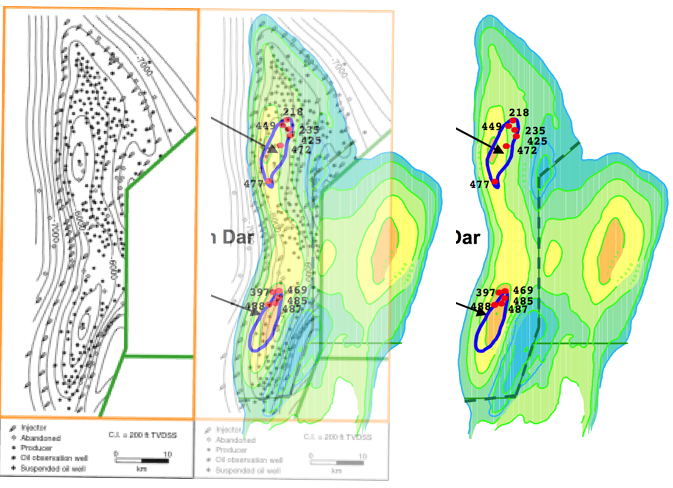
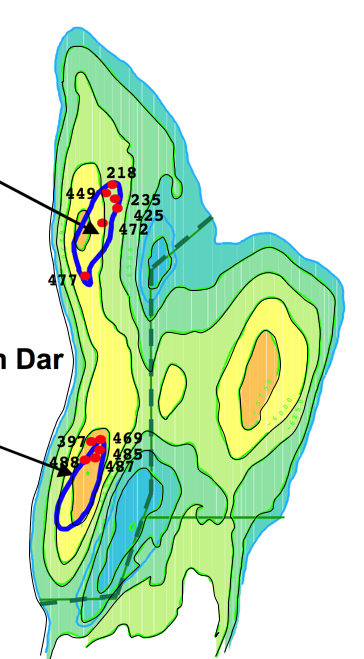
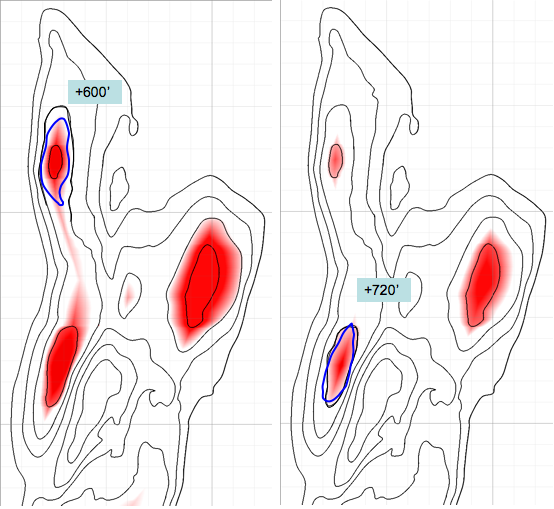
However, something that's important to understand about this picture is that the vertical scale is very exaggerated to make the shape clearer. Ghawar is really enormous and almost flat. It's about 175 miles from tip to toe (ie 2 1/2 hours driving at freeway speeds). And the structure slopes up to the center at only a few degrees. The effect of that is to make it so that 2/3 of the way up the structure is a lot more than 2/3 of the oil gone. This next picture shows a model estimate that I generated (explained later) of the effect of being two thirds of the way up in the 'Ain Dar and Shedgum regions. On the left is how much oil was there to begin with (darker red is more oil) and on the right is how much would be left (roughly) if the OWC were 2/3 of the way up the structure like that.
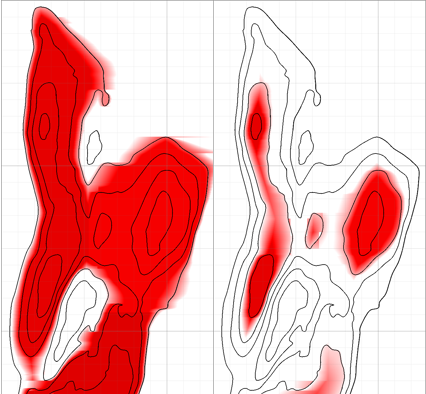
The model doesn't quite distribute the oil the same as the Linux supercluster picture, but it's in the ballpark, and because it allows you to effectively look straight down, you can see how much oil has gone. We will discuss exactly what this model is doing later. For now I just want to illustrate that 2/3 of the way up the structure is a lot of oil gone.
However, after all this discussion of the Linux supercluster picture, you might be wondering whether there's any reason to think it has any fidelity to the true state of affairs in Ghawar.
The paper from which the picture comes is a general survey for an industry magazine of the use of Linux superclusters for large scale computation tasks in the oil industry. The authors discuss as one of their examples Saudi Aramco's use of these types of massively parallel computing clusters to simulate oil and water flow in their reservoirs:
One approach is to not make the assumptions. Instead, brute force can be used to run very large simulations where the best geological understanding is rendered in detail. Already, models run at higher resolution than in the past. In the case of managing the world's largest asset, the Ghawar Oil Field, Saudi Aramco runs its POWERS simulator on a massively parallel HPC. As of 2004, this 128-node Pentium IV®-based machine had run full field simulations with between 10 million and 100 million cells and more than 4,000 wells, with larger runs pending. These simulations are run with multicomponent hydrocarbon models, waterflooding with varying brine chemistries, and dual-perm response to match fracture-flow history. Some runs include CO2 floods.And that's all the text covering Figure 3. So, clearly the picture is not intended as a report on the status of Saudi fields. Instead, it's intended as an illustration of how cool their simulators are. The question is, did Saudi Aramco a) accidentally publish to the entire world, in an obscure publication, a state of the art simulation generated picture that revealed very clearly the status of their biggest oil field as of 2004 (the year that the text references simulations as being done)? Or b) give away a simulation of some other year, maybe far in the future, or some hypothetical scenario that bears no relationship to current reality?This capability not only allows Saudi Aramco to run fairly large models with minimal or no scale up, but also to execute history matches extremely rapidly (in some cases, in hours to days). Saudi Aramco has used this capability for infill drilling, water cut management, breakthrough prediction and other basic reservoir engineering choices (Figure 3). New data can then be incorporated into updated geological models that underpin the simulations.
Clearly, the question cannot be answered beyond reasonable doubt from the text above. So now we will turn to other evidence. First, however, we will have to gain a better understanding of the nature of the reservoir, so that we can better understand that evidence.
Before moving on, I want to briefly draw attention to the mention that some simulation runs "include CO2 floods". This suggests planning for tertiary recovery approaches (low production rate, expensive, final resort ways to get the last oil out of a field).
Geology and Reservoir Properties
The structure of Ghawar is a large anticline - the compressive forces of plate tectonics have caused the almost level strata of sediments to buckle up very slightly. The reservoir rock, which is known as the Arab D layer, was laid down in a large shallow sea off the Arabian coast during Jurassic times. It is essentially limestone formed of the remains of countless marine organisms that lived in that sea, died, and fell to the bottom. In places where the sea was shallow, storms and currents stirred up the sediments and ensured that only larger grains could stay in place - these ultimately formed highly porous rock which could hold a lot of fluid (high porosity), and in many cases allow that fluid to flow freely amongst the pores (high permeability - related to porosity, but not the same thing as sometimes ample pores can be poorly connected to one another). In other places, deeper waters allowed the deposition of very fine particles which formed lime mudstones with limited pore space and even poorer flow properties.Overall, the sea rose at the beginning of the deposition of the Arab D reservoir, and so the rocks at the bottom are poorer in reservoir qualities throughout the field. As the sea gradually filled up with sediments over the course of 2-3 million years, it got shallower and the rock formed grew more porous. Thus the rocks at the top of the reservoir are generally better. However, the southern end of the reservoir was generally deeper water than the northern end, and the rocks there were substantially poorer even in these later stages. However, considerable briefer variations happened at one time and another and there is significant vertical and lateral heterogeneity in the rock. We can summarize the situation though by saying that there is about 250'-330' of total Arab D rock, with more at the northern end. Of this, 140'-200' were traditionally considered sufficiently permeable to allow oil production, and constituted the "net pay". The bulk of the net pay occurs in the upper half of the strata - generally known as Zone 2 - but the balance occurs in a number of thinner layers scattered through the lower zone 3, and even into the rarely discussed zone 4 at the bottom.
Eventually, the deposits climbed high enough and the sea retreated enough that the top of Ghawar became a large salt flat, which eventually formed into a thick impermeable layer of anhydrite. Thus later, when oil from slightly older deposits began to rise up through fractures in the rocks below the Arab D reservoir to replace some of the water there, it encountered the anhydrite layer and could go no further. Zone 1 is a transitional zone between the high quality zone 2 layers of reservoir and the overlying cap which will not support fluid flow at all.
To get a clearer sense of the zones have a look at this next picture (you might want to click on it to get a larger version in its own window). This shows the porosity, permeability, and rock type as a function of depth in one well somewhere in the Uthmaniyah region of Ghawar (the paper from which it comes does not give a more precise location).
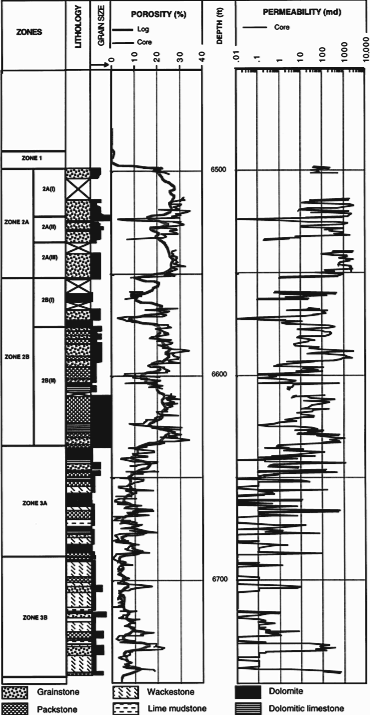
As you can see, there is about 250' of total (ie gross) reservoir in this well, and you should be able to see the clearly higher porosity and permeability in zone 2 versus zone 3, especially the upper part of zone 2 (we will discuss porosity and permeability more quantitatively later, but it might be worth noticing now that the permeability is on a log scale).
For another perspective on the situation, take a look at this next figure which comes from a 1962 analysis by RW Powers of Ghawar rock (with some reconstruction by me). This is how the figures were originally created from samples taken every six inches from an oil well, and then mounted on 1200 microscope slides:
A standard Leitz mechanical stage was converted to a point-stage by addition of a spring clip to engage notches filed in one of the traversing wheels. These notches were spaced to allow a linear slide motion of 0.8 mm between stops. Distance between point count lines was controlled by the second traversing wheel. Numerous experiments were tried to determine an ideal spacing between lines of points for obtaining acceptable results in a minimum of time. Initially a pattern with points 0.8 mm and lines of points 1.0 mm apart was used (about 600 points per slide). Compared with line integration results from the same slides, this point density gave no difference for any one constituent greater than 2 per cent. Using a 0.8 by 2.0 mm grid on slides with irregular particle shape and poor sorting, the maximum difference was 4 per cent. The difference increased progressively as distance between traverses increased. Most slides were finally counted on a pattern of 0.8 by 2.0 mm (about 300 points)...1200 slides, 300 points each, bent over the microscope, click, measure, click, measure, click, measure, day after day, week after week, month after month. Heroic science. All I did was cut and paste his figures together and then measure various things in them.Figure 3 shows the data recorded for each slide. To record this information, a battery of 24 individual hand counters was mounted in lines corresponding to size classes and types of components. For each stop of the point-count stage, a counter appropriate to the component or port type appearing under the cross hairs was punched. At the same time, the apparent long axis of each originally sedimented grain was measured with a micrometer ocular and the proper size grade recorded by counter.
This is a log from a well in Haradh (the southernmost, poorest part of the field):
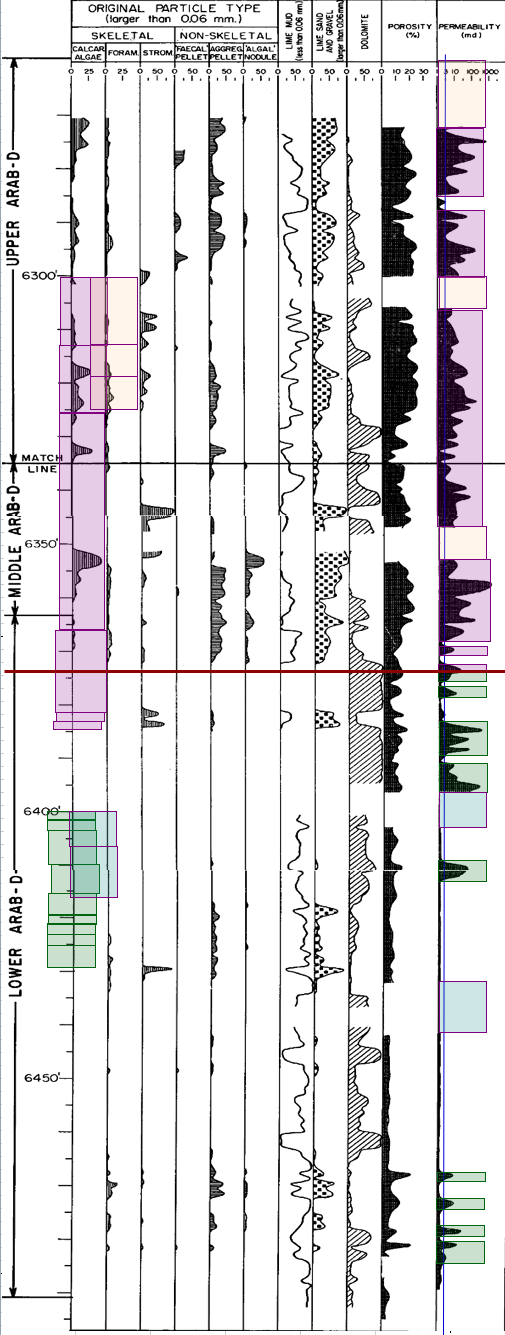
Here we have only about 205' of gross reservoir - significantly less than in Uthmaniyah. The colored boxes represent an analysis to determine the amount of net pay (defined here as rock of permeability 3 milliDarcies or better (anonymous industry experts assessed the boundary between "net" and "non-net" as anywhere from 10mD to 0.3mD, and report that over time the trend has been to count worse rock as included in the reservoir, a point we will return to). You can see that zone 2 has a lot more net pay (the pink boxes) than zone 3 (the green boxes). This well has an estimated 136 feet of net pay. (The "estimation" comes into it because we have to correct for missing data).
Hopefully, the gradient from Uthmaniyah down to Haradh is clear. Everything is somewhat worse - there is less zone 2 in total, less of both zone 2 and 3 are "net", the net there has worse porosity and permeability. Wells further north than Uthmaniyah are roughly of similar nature, but a bit better: they have more zone 2, more net pay in both zones 2 and 3, and the net pay is better (more porous and more permeable).
It's also worth noting the enormous variations in the permeability, which is shown on a log scale. Rock of permeability 1000mD will, at the same pressure difference, carry 1000 times more fluid flow than rock of permeability 1mD, and both extremes are common in the Ghawar reservoir rocks - the reservoir is not homogeneous at all, even in a single well. Porosity varies in the range 5% to 30%, though the upper end of that range is not attained in this Haradh well.
If you study this next picture, it shows a series of well summary pictures from Powers 1962 paper, with the Zone 2 and 3 net shown in overlaid colors (I determined the correspondence between the modern zone 1-4 scheme and Powers upper/middle/lower scheme by detailed correlation of wells in Uthmaniyah - the bottom of his "Middle" cuts off about 10' above the bottom of zone 2 in Uthmaniyah). I cut and pasted Powers pictures together into a north-south spectrum of just the wells he analyzes in Ghawar. Click on the picture to get a bigger version in its own window:

In addition to the trend in the amount of zone 2 to zone 3, you should also look at the "Calcarenitic and coarse carbonate clastic" component. That's the good stuff: big open grain structure that will let lots of fluid flow. You will see that there is far more of this open grained rock in the north than the south. There is also more in the upper part of the wells than in the lower. Thus it is that the rock in the south is significantly poorer than the rock in the north, though this is a continuum, rather than a fundamentally different kind of rock.
The largest depth of gross reservoir in any of these wells is about 270-280'. However, in the literature there is discussion of as much as 300'-330' of reservoir when the very poor quality Zone 4 is included (zone 4 is frequently not mentioned or studied, presumably because it makes a very limited contribution to production in most locations in Ghawar).
The approximate location of the wells in that last picture is as follows:
As you can see, they form a reasonable sampling of the field, though not as good in the south as the north.
Development History of the Field
Logically enough, the development of the field began with the good parts in the north and has gradually proceeded south. Ain Dar, Shedgum, and Uthmaniyah all began production in the 1950s, Hawiyah not until the 1970s, and although there was some limited development earlier, full injection supported production in Haradh has been bought on in three phases - Haradh I in 1996, Haradh II in 2003, and Haradh III (the "toe" of the "boot") only in 2006.An anonymous correspondent recently gave me a hard copy of the 1979 staff report to the US Senate Subcommittee on International Economic Policy on "The Future of Saudi Arabian Oil Production" (the report mentioned in Appendix C of Matt Simmons' book "Twilight in the Desert"). It has the first reliable figures for plateau production in all the operating areas that I have seen. At that time, production was as follows (either actual or planned):
| Operating Area | Production |
| Ain Dar | 1.0 mb/d |
| Shedgum | 1.25 mb/d |
| North Uthmaniyah | 1.9 mb/d |
| South Uthmaniyah | 0.4 mb/d |
| Hawiyah/Haradh | 1.3 mb/d (est) |
| Total | 5.85 mb/d (est) |
The figures for Hawiyah/Haradh were planning assumptions, not based on actual production. We know from a recent paper that Haradh produces 300kb/d from each of three operating areas, for a total of 0.9mb/d. Production of 0.4mb/d in Hawiyah would look about right as it has similar area to South Uthmaniyah, about half the area of Haradh, and quality intermediate between those two.
We will discuss more recent production history in a little while, but this gives a sense of the relative importance of different areas. The important point is that the northern end of the field, from North Uthmaniyah up, has historically been far more productive, with over 2/3 of the productive capacity on these figures. The combination of more rapid production and a much earlier start to production would certainly make it plausible that these areas of the field would become depleted first.
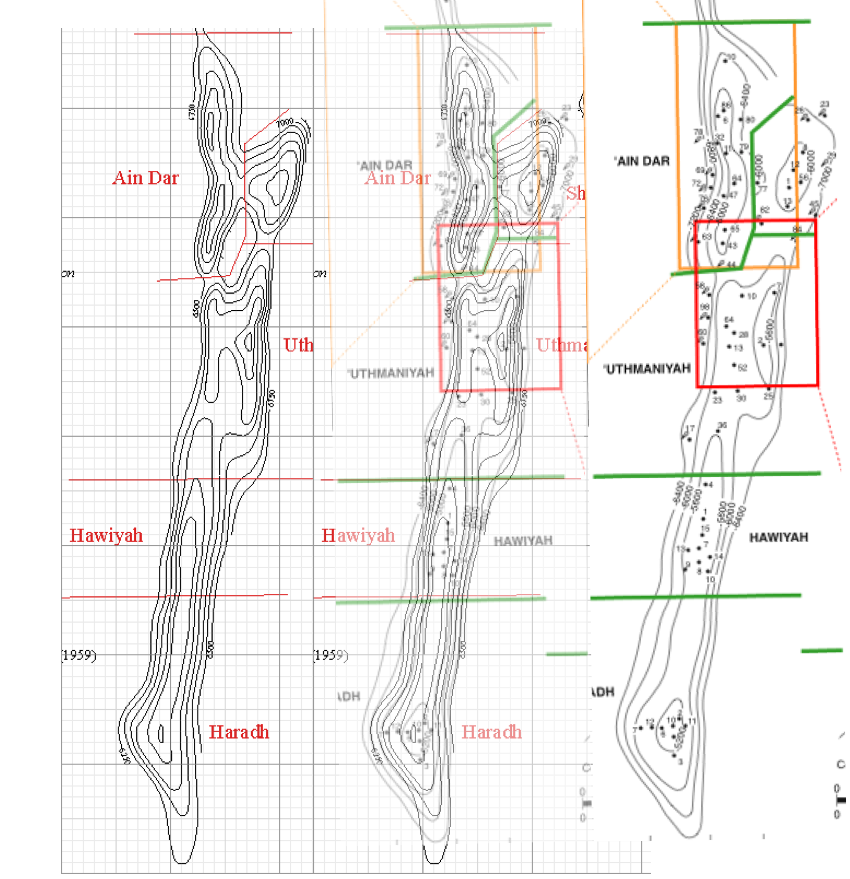
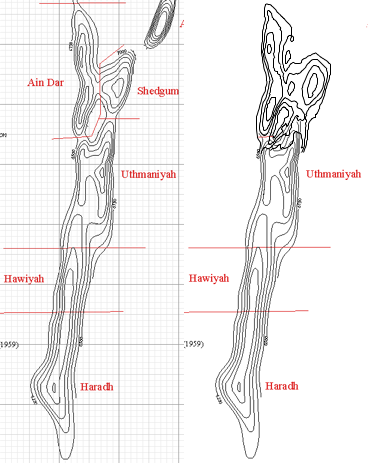
Evidence of Recent Flood Front Location in South 'Ain Dar
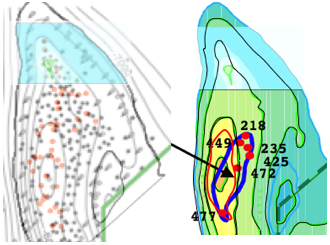
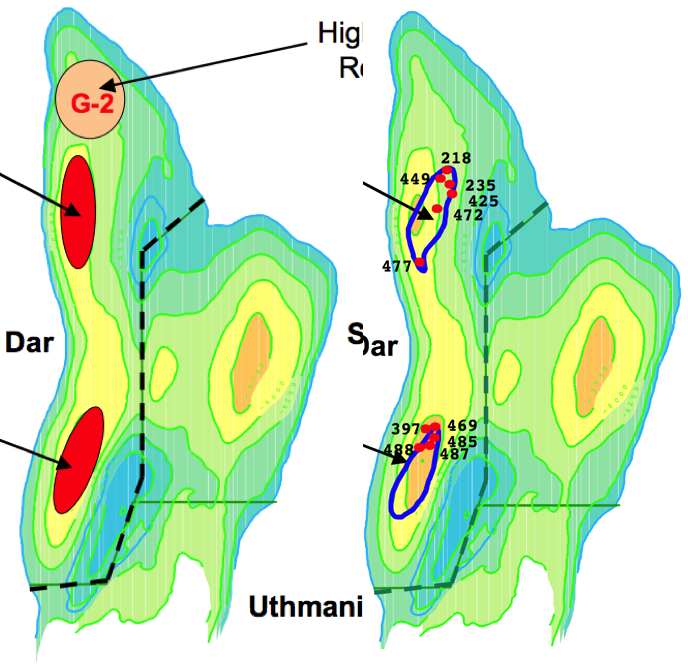
Now that we have a feel for what the reservoir rock layers are like, and the different operating areas of the field, we are in a better position to assess various other pieces of evidence for the position of the flood front in recent years.The first piece of evidence comes from a paper by Hussain et al Optimizing Maximum-Reservoir-Contact wells: Application to Saudi Arabian Reservoirs presented to the 2005 International Petroleum Technology Conference (IPTC 10395). The paper is a discussion of several well planning exercises in Ain Dar and Shedgum. Individual simulations were performed to assess the likely lifetime performance of the wells. However, our immediate interest is in a picture which shows the location of one of the planned wells:
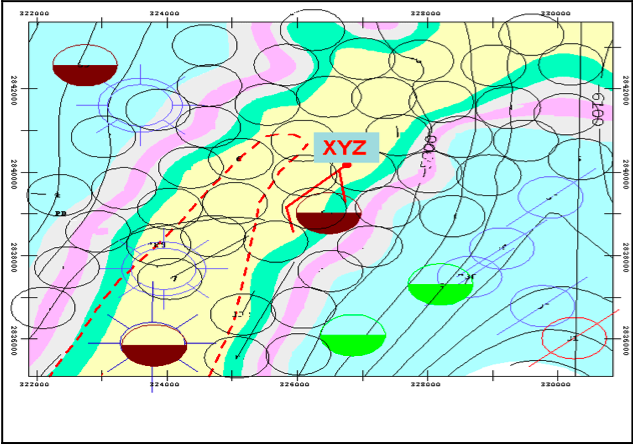
There is no key for this figure in the paper, and nor is the location shown in terms of the rest of the field. Thus, the first time I looked at this it seemed completely mysterious. However, after staring at it long enough, it turns out it can be decoded to determine quite precisely the state of the field in South 'Ain Dar and the saddle between South Ain Dar and Shedgum. The key thing is to look at the contours. I have labelled them more clearly, and shown the relationship to an overall map of 'Ain Dar/Shedgum, a key to the oil layer from Figure 8 of the same paper, and the relationship to the Linux Supercluster picture.
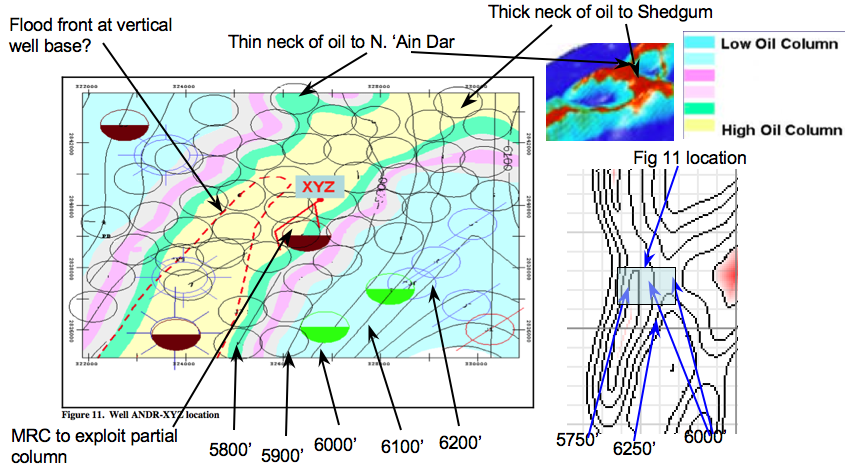
Let me try to explain what you are looking at here. Firstly, it's critical to understand what the contours mean. These are depths below sea level in both Figure 11 and the fragment of the map from Greg Croft's page (on which much more later). The contour heights refer to the top of the Arab-D reservoir. So when looking at a point on the 5800 contour, say, we are looking down on the top of a column of something like 275' (give or take) of reservoir rock. Since the top of the reservoir at that point is at 5800' below sea level, the bottom of it would be at 6075' (in round numbers). Of that 275' of reservoir or so, about 200' or is actually good productive rock, while the rest is marginal enough that, at least in the past, it would not have been considered, but the 200' of good rock is scattered in layers amongst the total 275' of rock column. Within the context of a small area like Figure 11, the thickness of the reservoir probably doesn't vary much. In particular, any variations in structure thickness probably don't have much to do with the variations in structure height, since the thickness is controlled by events when the rock was being laid down in the late Jurassic, while the height is controlled by tectonic distortion of the structure during the Cretaceous, 80 million years later.
Now, if you look at the location for Fig 11 (100' contour interval) I have proposed in the overall 'Ain Dar/Shedgum picture (250' interval), hopefully it is clear that there is really no other candidate location that could work at all. To get those contours to match, you have to be high up on the south side of a east-west saddle that tops out at a little below 6000'. There's only one place like that.
Once you've got your mind around the contours, the next thing to look at is the colored regions, which almost certainly represent the thickness of the oil layer, with yellow representing something close to the original thickness of the layer, and the other colors representing less and less thickness of oil (because water is intruding into that part of the oil layer as the water advances and the oil retreats up the structure to be produced out of wells up there). A key from Figure 8 of the same paper, which shows a well location in Shedgum is included above, and this figure likely has a similar color scheme.
So, given that, it should be clear that the picture above is similar to the Linux Supercluster picture. A relatively narrow ribbon of oil lies along the top of the south 'Ain Dar cap and goes across the saddle to Shedgum, while a much narrower ribbon goes up towards the North 'Ain Dar crest. On the crest, there is no oil column below the 5900' contour, and we don't have a full column below 5800'. However, the oil across the saddle dips down, and we have a full column crossing the saddle down at some level between 6000' and 6100' below sea level.
Back before oil production began, oil in this area went down a little below 6500', while the top of the South 'Ain Dar crest is a little shallower than 5600 feet. So overall, we are about 2/3 of the way up the structure on the crest here, but have some extra oil in the saddle. So this is very much consistent with the Linux Supercluster image being a 2004 image (given this Figure 11 is from a 2005 paper).
A Word on Uncertainties
Before we go much further, I want to say a few words about errors and uncertainties. One of the things I have attempted to do in this analysis is to make quantitative estimates of the uncertainty in all the important things I am analyzing, and you will be seeing more and more of this from here on out. Some folks who saw early drafts of parts of this analysis experienced some confusion if they don't think this way all the time, so let me stop here for a micro-lecture on that subject.When I say, as I will shortly, that I believe the ultimate recovered reserves (URR) of oil from Ghawar via waterflood (that is excluding tertiary recovery techniques) will be 96 ± 8 billion barrels (gb) of oil, that could be translated informally as follows:
- I don't know exactly what the ultimate waterflood recovery will be, but more likely than not it will be in the range 88-104 gb (this is known as the "one sigma" range).
- It's really quite unlikely that it would be outside the range 80-112gb, but it's not inconceivable (the "two sigma" range).
- If my estimate is right, it is for practical purposes impossible for Ghawar ultimate waterflood recovery to lie outside the range 72-120gb (the three sigma range). If it did, my estimation or error analysis would almost certainly be mistaken. In particular, if my estimation and error analysis are correct, then someone claiming that the Ghawar URR will be 130gb, as Saudi Aramco does, must be relying on something other than the waterflood for the last portion of the oil. Otherwise, their view and mine would be statistically incompatible, and one of us would be in error in some fashion.
More formally, in a wide variety of practical situations, the results of a complex calculation that brings together many different unrelated uncertainties will be approximately "normally distributed" - having a special mathematical form originally due to the German mathematician Gauss. If so, then we can say that the odds of the end result being no more than "one sigma away" from the estimate is 68%. The probability of being no more than two sigmas away is 95%, and the probability of being no more than three sigmas away is 99.7% - that is there is only 3 chances in a 1000 of being more than three sigmas from the estimate if that estimate and uncertainty were correct. If the assumption of a normal distribution is in serious doubt (which I don't believe it is here), then a pretty much universally applicable theorem called Chebyshev's inequality guarantees us that the worst case is that the two sigma range is at least 3/4 probable, and the three sigma range is at least 8/9 probable.
Where possible, I have estimated uncertainties in various quantities by using some type of sampling or statistical procedure. In some cases, that is infeasible. For example, we presently estimate the amount to oil in Uthmaniyah by combining three pictures visually. This is necessarily a somewhat subjective procedure. In those cases, I make three estimates: the value that seems to me most likely, the value that seems the least that could possibly be the case, and the value that seems the most that could possibly be the case. I then take the average of those values as my estimate, treating the range from the smallest estimate to the largest estimate as the two sigma uncertainty range. In practice, such estimates work well when combined with a number of other independent uncertainties. There are well established mathematical rules for combining uncertainties, which I have employed.
For example, let's look again at the picture above of South 'Ain Dar, and try to use the less formal procedure to estimate the average height of the oil water contact, and an uncertainty in the average.
My read on the picture is lowest conceivable: 6100', highest conceivable: 5900', likeliest, 6000', so I would quote 6000 ± 50'. Note the latter is intended as the one-sigma uncertainty in the average, not the range of variation which would clearly be greater.
To compare, I then took the first 20 in a list of randomly sampled locations in the picture, and, on the assumption that the color scale runs from zero to 275' ± 25' of gross oil layer above the water, I obtained an average and standard error of 6032' ± 38'. So the two estimates agree within error bars, though the latter is likely a little better estimate.
Flood Height in North 'Ain Dar
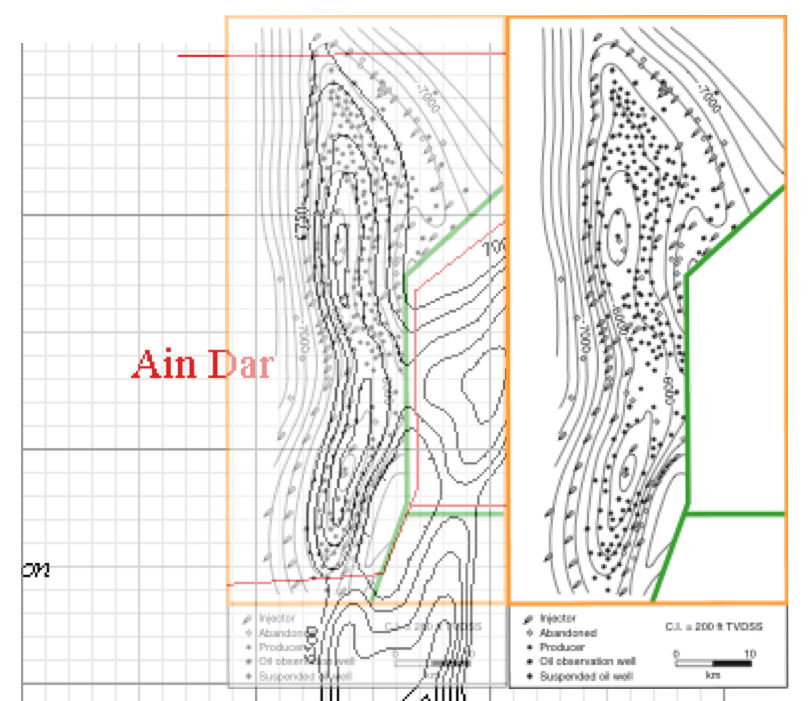
Next, we turn to a more complex line of evidence that comes from the 2005 paper on water management in North Ain Dar (SPE 93439). A number of figures in that paper provide data that we can interpret to constrain the position of the OWC in 2004 for comparison with what we have inferred so far.The first is this picture:
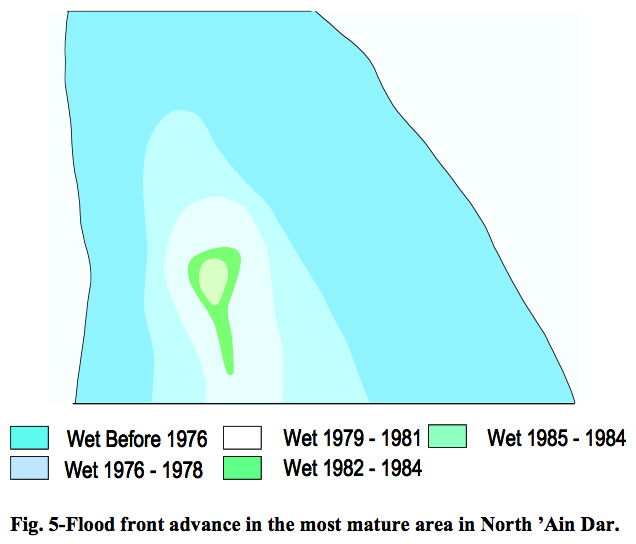
They don't spell out for us where this picture is, but the outline can be fitted nicely into better maps that have contours:
From this, I estimate the following heights for the OWC at different times:
| 1975 | -6550' ± 50' |
| 1979 | -6475' ± 50' |
| 1980 | -6450' ± 50' |
Next, there are several sources that, taken together, allow us to establish the rate that the OWC (oil-water contact remember) has climbed since. For example, there are flowmeter profiles for three different wells in Figure 8. Each of these shows the cumulative percentage of fluid as a function of depth in the well, with green being oil, and blue being water. As you can see, typically the water's contribution is in the bottom of the well, and the oil in the top. The dividing line is the oil water contact in that well, and it rises over time.
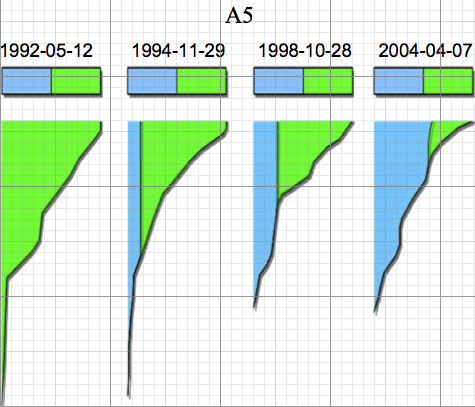 Flowmeter records for three wells in North 'Ain Dar (click buttons to switch wells). Position of flood front was estimated using grid and highest location in which water is emerging from well (as indicated by a right edge to the blue region that was not vertical). Source Figure 8 of SPE 93439
Now, we don't know the exact depth of these wells (no depth scale is provided), and we don't have an a-priori reasons to suppose they are all the same depth, but the form of the profiles, with copious production from the upper half to two thirds and much smaller production in the lower one third to one half suggests that we have all of zone 2 and most or all of zone 3. It doesn't appear we have zone 4 or the copious zone 2 production would make up less than half of the profile. If we thus assume we have 250' of depth in all cases, and then plot the resulting depths versus time on a common graph, the overall agreement is quite striking:

In addition to the three well curves (with linear fits), I have added a blue line, which is in an arbitrary vertical position on the graph, but the slope of which is determined by translating the average 5.096 feet/day horizontal flood front velocity from this next graph in the same paper to a 0.0505 feet/day vertical velocity by assuming the original velocity was a southward velocity up the North 'Ain Dar ridge. The agreement with the velocities determined from the well flowmeter profiles is excellent. This is a striking illustration of the power of correlation to extract useful information from noisy uncertain data.
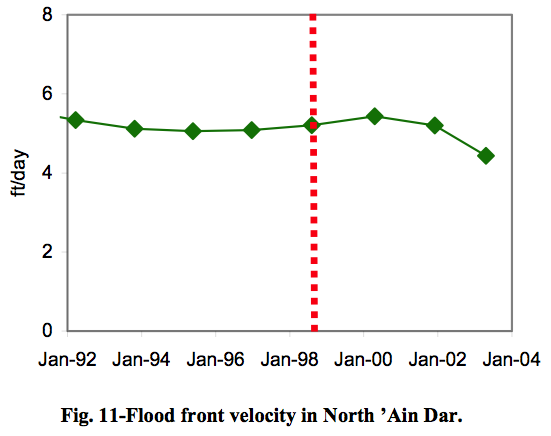
The combination of all this evidence gives an average vertical velocity of the flood front of 18.4 ± 0.7 feet/year over the period during which it was linear. So we can start at the locations back in the late 70s from figure 5, and extrapolate forward at this rate. This next picture summarizes everything we know so far about the level of the oil water contact over time in North 'Ain Dar.
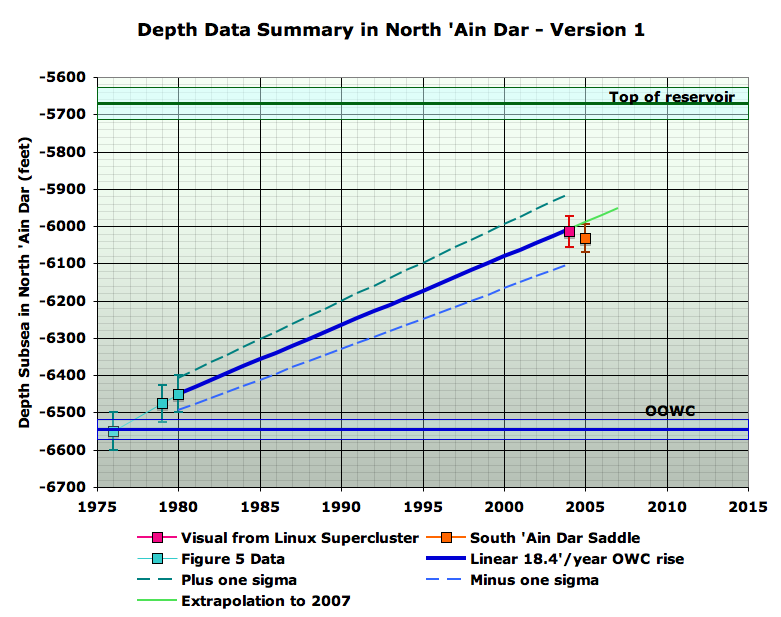
Starting at the left, we have, in turquoise, the SPE 93439 Fig 5 data for the far northern end of the northern 'Ain Dar ridge in the 1970s era. Then we have the fairly constant 18.4' vertical feet/year march up the ridge from the Fig 11 flood front graph and the Fig 8 flowmeter profiles in the same paper. Then, the pink point comes from translating the subjective visual estimates from the Linux Supercluster picture that I gave earlier. Finally, we have the orange point being the South 'Ain Dar saddle estimate from sampling the IPTC 10395 Fig 11. Hopefully, you will agree that a pretty consistent picture is starting to emerge from this various evidence.
I haven't told you yet why I think the OOWC (original oil water contact) is where I show it, and you might also wonder why the OWC was still at the OOWC in 1976, when production in this operating area began in 1951. Hold those questions for a couple of sections. It's time we started to talk about how to estimate how much oil is in these fields, and that will eventually clarify these points.
Framework for Understanding Volumetrics
So the procedure for estimating how much oil a given field might produce, or how much might be left at some point, is conceptually simple. We need to know the volume of rock in the reservoir, what percentage of that rock is pore space (the porosity), and what percentage of that pore space is occupied by oil, versus other fluids (the oil saturation). Porosities of the Arab-D reservoir rock in Ghawar can range from a few percent up to as much as 30% or so. One other wrinkle is that the oil will shrink as it comes out of the ground (due to natural gas coming out of solution in it), and we care about how much oil there is after it has done this. This shrinkage factor is known as the formation volume factor. So if we multiply these four numbers together: rock volume, porosity, oil saturation, and the inverse of the formation volume factor, then we will know how much oil is in the ground at some given time, if it were brought to surface conditions.Some more complications arise. The simplest way to assess the volume of rock would be to measure the area on a map of the reservoir, and then multiply that area by the average thickness of the reservoir rock. But to be more accurate, we will need to understand the shape of the reservoir in three dimensions. Borrowing Euan's nice picture again, we can illustrate the general idea in cross section:
In the case of Ghawar, the main complication arises from the triangular wedges where the oil runs into the water (ie the oil water contact), which can be several miles wide.
When I said "roughly speaking", one of the issues of interest is that not all the porosity in the green zone is full of oil that can come out. Firstly, it is never the case that pores are 100% filled with oil even in the reservoir at the outset. There is invariably at least a little bit of water in there too, clinging as tiny droplets stuck inside little pore channels somewhere deep in the rock. The fraction of such water is known as the initial water saturation. Better, more open rock, will have lower initial water saturation, particularly if it is a long way above the oil water contact. In that circumstance, the water saturation might start out as low as a few percent. However, in very poor quality rock in the transition zone near the water, water saturation can start out as high as fifty percent even in an area that is nominally oil. All cases in between occur.
Furthermore, after the flood front has passed by a given piece of rock, and water has been washing through it for a couple of decades, there will still be oil left in that piece of rock, again in the form of droplets trapped inside pores that cannot move. This oil cannot be produced by waterflood alone - if it ever comes out it will be because of additional (ie tertiary) recovery techniques, should such prove economic. The fraction of rock so occupied by oil at the end is known as the final oil saturation (and the fraction occupied by water is the final water saturation).
Thus, in a given barrel of reservoir rock, the fraction of the barrel that will end up as oil on the surface is given by the porosity percentage (how much pore space there is to hold fluid of any kind), multiplied by the difference between the initial and final oil saturations, divided by the formation volume factor that controls how much the oil will shrink by the time it gets to the tanker.
The remaining wrinkle is the net/gross distinction we briefly discussed earlier. Fluid in the reservoir during production moves because of pressure gradients. The injectors are increasing the pressure below the oil, and this is exerting force on the oil to move upwards and towards the producing wells. However, the amount of movement that the oil makes in response to a given pressure difference depends on the permeability of the rock. As we discussed earlier, this is related to the porosity, but not perfectly so. In some rocks, the pores are poorly connected with one another, and it is hard to force fluid through them. In others, the pores are well connected and fluid flows more freely. Now, some rock has such poor permeability that, even though it contains some oil, that oil will not come out of it in any reasonable period of time. Flow time is measured in centuries rather than the years-decades required to meaningfully contribute to the oil production. Oil geologists and petroleum engineers distinguish net pay from gross reservoir. The former excludes the not-sufficiently permeable rock, whereas the latter is everything. Typically, there are layers of pay interspersed with non-pay, and this is very much the case in Ghawar, as we saw in the well logs earlier.
However, the distinction between pay and non-pay has been shifting over time. The only data on this comes from Euan and I asking our networks of anonymous industry advisors. We got answers ranging from 1mD to 10mD for the 1980 timeframe, but also a statement that at least one company (that you've heard of) will sometimes now consider rock down to 0.3mD as pay, given better technology to access such poor rock (and, perhaps, lack of enough better reservoirs to drill into, meaning companies can't afford to be too picky). The main technology enabler has been precise geo-steered horizontal wells, allowing wells to be drilled horizontally along the low-permeability layers, from whence the oil will slowly drip.
These variables tend to be loosely correlated. Rock of higher porosity is more likely to be permeable, and more likely to have a low initial water saturation. In short, it is "good" rock. "Bad" rock has less pore space, poor flow properties even in the limited space there is, and high water content at the outset.
With that background, let's now turn to the available map data, which is one critical component of the volumetric oil estimation we will do.
Maps and Map Corrections
Unfortunately, the Saudi Oil Ministry neglects to publish complete and detailed maps of its oil fields. In lieu of that, we have a mixture of old maps, and incomplete maps from technical papers. The main thing we are looking for in a map is detailed and accurate contours of the top of the reservoir. As you will see, Ghawar is about 5000'-6500' below sea level.
Six maps are the main useful ones:
- the Greg Croft map
- A map from several Saudi Aramco technical papers, in particular Asphaltene Precipitation in High Gas-Oil Ratio Wells. Henceforth, this is the "asphaltene map".
- a map from an industry report that was supplied to us anonymously, but the component maps are based on other publications.
- the original 1959 Aramco AAPG publication map
- the map of well locations from the Voelker thesis (big pdf)
- this schematic from a USGS report (big pdf)
Euan reported the large industry report map to have a considerably longer Ghawar than the Croft map. Careful measurements based on same contour analysis do not support this. I find the distance from the bottom of the 6000' contour in Haradh to the 6400' line in North Ain Dar to be 143.7 miles in the Croft map, and 140.7 miles in the industry map, a variation of only 2%. My best reconciliation of the two maps, on identical scales, looks as follows:
This does not show an overall systematic scaling error between the two maps in my judgement, but many local variations in the exact structure (note to others trying to work on this problem: it's very important to compare contour-to-contour, not just look at the overall outline, since one map has contours going deeper than the other). Clearly, at least one of these maps is somewhat imperfect. An analysis of the more detailed map of 'Ain Dar turns up more serious problems however:
Even on a equal-contour basis, the industry report map has significant areas above the oil water contact line that are not in the Croft map. This is especially problematic in North 'Ain Dar, where I estimate the area difference to be about 50% (Euan suggested 25%). Euan's reconciliation of the well location map with the Croft map suggests the same issues apply to Shedgum.
For this reason, I decided to use the asphaltene map for estimates in 'Ain Dar and Shedgum. This map reconciles quite well with the industry report map:
Both appear to be more modern accurate maps. The industry report map has a scale, and this was used to establish the scale for the asphaltene map, which is not provided with a scale in Saudi Aramco papers I have seen. I did the reconciliation twice on different days and only came out 1% different in the resulting scale, an error which is negligible compared to other uncertainties in the problem.
In the rest of the field, I used the Greg Croft map. However, reconciliation of the Croft map with the asphaltene map suggests Croft is about 20% too narrow in Uthmaniyah. The approach I have taken to this overall problem is to correct reserve estimates for Uthmaniyah upwards by 20% and to view all regions estimated with the Croft map as having a 20% map uncertainty in their reserves. No corrections were applied to Hawiyah which seems to be about the right size. The special problems in Haradh are discussed later.
Modeling the Structure
As part of this analysis, I wrote a C program to parse an image of the map contours, and for each of the Croft map and the asphaltene map, used it to build a three dimensional model of the reservoir based on the map. This formed the foundation of my estimates of oil reserves and depletion. I linearly interpolated between contour lines, and where I had indications that the oil extended outside the structure in the map contours, I extrapolated from the last two contour lines on that edge of the structure. I placed the top of each crest midway between the lowest contour that no map showed for that crest, and the highest contour that any map showed for it, and linearly interpolated up to that point (ie my crests are conical in the last 75-125').While we will cover more aspects of this modeling as we go forward, this montage should give you some feeling for the kinds of things the code has to do, and hopefully provide visual evidence that it works correctly:

Since my code parses these maps and counts each pixel to estimate area, and since each pixel represents a small fraction of a mile, errors due to digitization of the map are negligible. The way I do linear interpolation introduces a small amount of noise between contours that is different than the noise the real structure would have. This is expected to be small compared to other errors (it's more a visual issue than anything).
Original Oil Water Contact
In order to estimate the volume of oil-bearing rock reliably, we don't just need the map, we also need to know where the oil is, and where the water is. That is, we need to estimate the position of the oil water contact, which forms a surface that intersects the base of the reservoir. You might imagine that the oil water contact would form a level plane, but in fact it is tilted and somewhat uneven. The main reason for this is that the water under the oil varies in its density because of large changes in salt content in different parts of the reservoir. The approach I took to this issue was to fit a tilted plane to available data on the position of the oil water contact. The regression (model fit) provided estimates of the uncertainty in original oil water contact (OOWC) position.Let's first take the case of the Croft map, which was used for estimates of original reserves in the south of the field. Estimation of the position of the OOWC (original oil water contact) was carried out as follows for areas other than Haradh. The map showing OOWC estimates in the 1959 Aramco AAPG paper was reconciled with the Croft map as follows:
The regression resulted in a plane that has the following characteristics:
- It reaches the neck between 'Ain Dar and Fazran at 6560 feet depth (64.7' standard error in the height constant)
- It rises by 2.45 feet/mile to the south (0.45 feet/mile standard error)
- It dips by 8.9 feet/mile to the east (1.9 feet/mile standard error)
- The model has an R2 of 83% (ie 83% of the data variance is explained by the model), the model is significant with p=0.03 (F-test), and the average deviation of data from model is 51.5'.
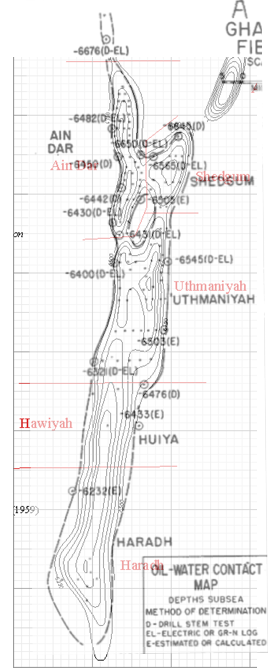
Haradh is known to have its own local OOWC tilt dynamics that are more pronounced than the rest of the field, and furthermore, the 1959 OOWC measurements constrain the Haradh OOWC only very weakly. The best available data come from SPE 71339 by Stenger et al and titled Assessing the Oil Water Contact in Haradh Arab D. The following is a reworking of their Figure 10, with a reconcilliation of the Croft map, and annotations in blue of the absolute depths based on the text of SPE 71339.
Estimation of the position of the OOWC (original oil water contact) was carried out as follows for areas other than Haradh. The map showing OOWC estimates in the 1959 Aramco AAPG paper was reconciled with the Croft map as follows:
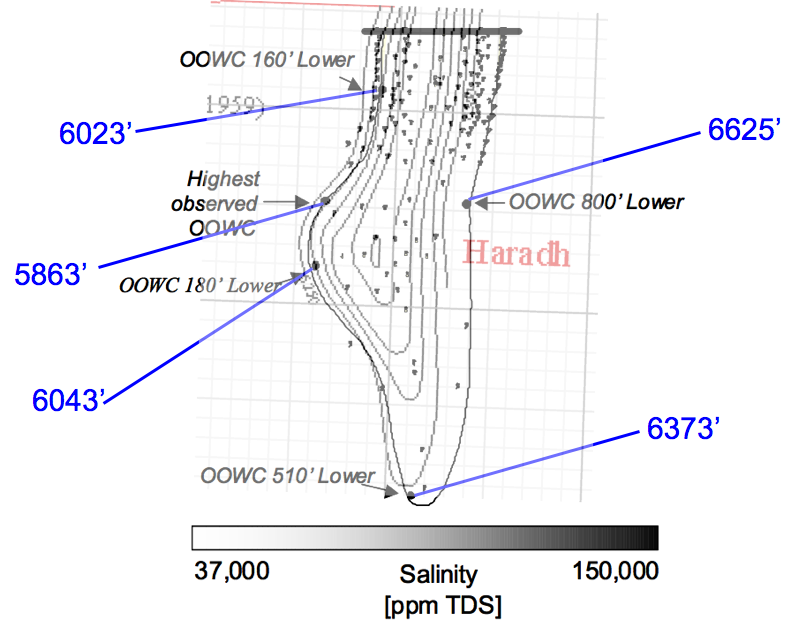
Stenger proposes that the main explanation for the uneven oil column is the presence of very saline water under the oil in the east, and a localized source of much fresher water in the west, close to the point of highest oil contact.
It did not seem practical to base an interpolation model for the depth on these data - clearly any linear model will fail badly, but the data are inadequate to suggest what kind of non-linear model would be suited. It appears that the main effect of the OOWC is to add to the oil filled area to the east of the Croft map. Accordingly, we treated this issue by adding a 20% upwards correction to the Haradh original reserve estimates, with ten percentage points of uncertainty.
Turning now to the northern areas of the field, we use the ashphaltene map shown to the right.
Splines were fitted to the contours, and these splines were parsed to generate a three dimensional model. The map shows the oil water contact as the blue line around the edge of the map, or in places, in the interior of the structure. The regression fitted to depths inferred from this blue line, has the slope of 2.5 feet downward for every mile to the north and 6.6 feet downward for every mile to the East. The r2 of the model was 48%, and the uncertainty in the vertical height was 23 feet (in other words, compared to the whole field, the regression in just the northern fields finds less systematic height variation, less uncertainty in the height of the contact, and so a larger fraction of the variation is noise, rather than systematic trend.
This map is believed to be quite accurate, but it did prove necessary to make some modest corrections to the model based on it, in a manner I document after I have gotten a little further in my development.
Gas Caps
North and South 'Ain Dar both have gas caps which are mentioned in two papers that we have studied (SPE 81567 and SPE 81425). The first of these papers (from 2003) explains the situation:
The Arab-D reservoir of Ghawar Field contains an undersaturated light oil. The bubble point pressure is ~1900 psi at the reservoir temperature of 215oF and the average gas oil ratio is ~570 scf/stb. The reservoir pressure at present is over 3000 psi. In the 1960s and 1970s the associated gases from part of the field were injected back into the reservoir at two locations due to unavailability of gas processing facilities and to avoid excessive flaring. The injected gases have formed two separate gas caps in the field (north and south gas-caps, Figure 1). In recent years oil production has started from these gas-cap regions.The two papers show these images of the gas caps:
Gas caps images from SPE 81425 (left) and SPE 81567 (right) compared.
The left image appears to be more schematic, whereas the right image, although hand drawn, appears to attempt show the actual shape and to be based on wells that have gas production. Both images show the gas caps as similar size, though the left image is about 20% larger in area.
We would strongly expect that gas in the very high quality upper regions of the reservoir in Ain Dar would be able to reach gravitational equilibrium quickly in a static environment. So the fact that the base of the gas is not level in the right hand image is in need of explanation. Fractional_Flow and I developed the following explanation: asymmetries in the amount of oil production in the fields are pulling the gas caps down out of equilibrium. In North 'Ain Dar, the north east flank is the largest and shallowest part of the structure, and production in this area has likely pulled the gas cap down towards it. In the case of south Ain Dar, the south west is larger and less steep that other sides (except for the saddle, which we know hasn't been produced as heavily as some other places since it still was shown as having a full oil layer in a 2005 paper), so that the southern gas cap has been pulled to the southwest, though not by nearly as much as the northern gas cap, the structural asymmetries being less.
The approach taken to estimating the size of the gas cap in this analysis was to create a spline copy of the gas cap outline from the right picture, and then move it to the top of the structure, as though it was in gravitational equilibrium, and then, using my 3D model of the field, find the amount of vertical offset in OWC required to create an oil distribution that just matched the gas cap. The lower boundary of this oil was then treated as missing due to the gas cap in further analysis. This picture illustrates the process:
The error in the size of the gas cap was estimated roughly from the 20% difference in size between the two images of the gas caps that we have.
Note, there is some not-quantifiable possibility that this approach to gas cap estimation is systematically wrong if the gas is smeared out in a much thinner layer than gravitational equilibrium at the top of the structure would suggest.
With the map modeled, the oil water contact modeled, and the gas caps estimated, we now know the large-scale geometry of the reservoir. We turn to the quantitative parameters for the reservoir rock.
Data for Reserve Estimation
Hopefully you have some qualitative feeling for the types of variations in Ghawar Arab-D properties from the earlier discussion, and so let us now turn to the summary data recorded by Greg Croft, but which come from Saudi Aramco, Oil Reservoirs, Table of Basic Data, Year-End 1980 which is the most obvious public basis for estimating how much oil would be under any given square mile of our maps. This data essentially comes from back when Aramco was operated by a consortium of American oil companies, and thus likely represents a best circa 1980 understanding of the field parameters, which would have been based on extensive operating experience and well logs from around the field done by professionals from major international oil companies. In short, this data is not to be taken lightly (as has been repeatedly emphasized to me by anonymous industry advisers).The data we need for this analysis can be summarized thus:
| Haradh | Hawiyah | Uthmaniyah | Shedgum | Ain Dar | |
| Porosity | 14% | 17% | 18% | 19% | 19% |
| Net Pay | 140' | 180' | 180' | 194' | 204' |
| Formation Volume Factor | 1.27 | 1.3 | 1.31 | 1.35 | 1.34 |
| Initial Water Saturation | 11% | 11% | 11% | 11% | 11% |
As you can see, we have almost everything we need now to estimate the amount of oil originally in Ghawar, given a 3D model of the field. But not quite. Specifically, this does not tell us how much oil is left behind after the flood (we need the final oil saturation, or equivalently, the final water saturation - the two together have to add to 100% in this system so if you know one, you know the other (with the exception of the 'Ain Dar gas caps)). And that, alas, will take us on a long digression. But just before we go, notice also that the 11% initial water saturation is a little odd in that it doesn't vary with operating area. We might have expected that number to get worse (ie higher) as we went south into poorer rocks that would trap more little water droplets that oil couldn't displace. So there is some suggestion that perhaps that 11% might be a whole field average, rather than measured in each subfield.
I amassed two general types of evidence that bear on the initial and final water saturations, and I shall give one example of each type.
The first type of evidence comess from looking at simulation cross sections. For example, here is a blown-up portion of a picture of a reservoir simulation cross section in simulated year 2004 in North Ain Dar from Fig 9a of SPE 93439.
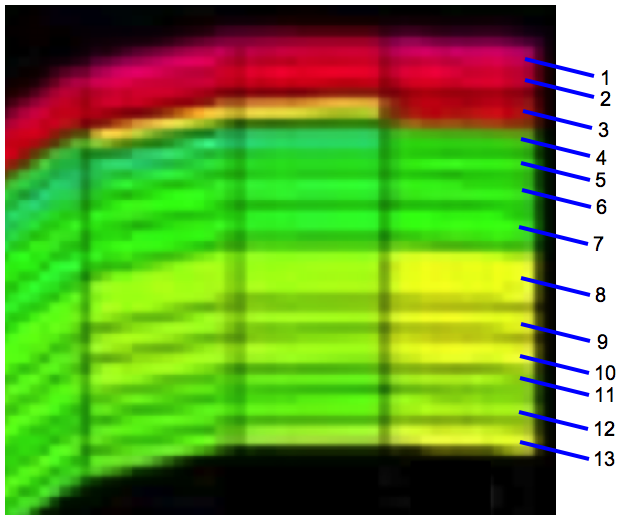
I have numberered the 13 layers that the simulation divides the rock into, and the lateral grid cell index can also be counted off (rather more easily). Once numbered, it is possible to generate a random sample of grid cell addresses, and, using the color scale, measure the saturation in each one. We avoid cells very close to the original oil water contact, and we also avoid cells which have not had the same color for at least a decade (ie where the simulated saturation might still be changing noticeably). In particular, we don't count unswept areas in the final saturation - if any areas are finally unswept we will take account of that in a separate sweep efficiency parameter. This allows us to form a random sample of what the simulator considers the population of block final saturations is, at least for this particular location in the field. Since Saudi Aramco uses state of the art simulation methodologies, has extensive well log data and production history to match to, and since a central point of the simulations is to estimate and maximize ultimate recovery we have reason to think that the simulation's final saturations will have some fidelity to the true situation in the reservoir.
The other type of evidence comes from studies of flushing particular samples of rock either in the lab or rock taken from the reservoir after flooding. For example, this next figure shows relative permeability curves for composite samples of rock from three operating areas:
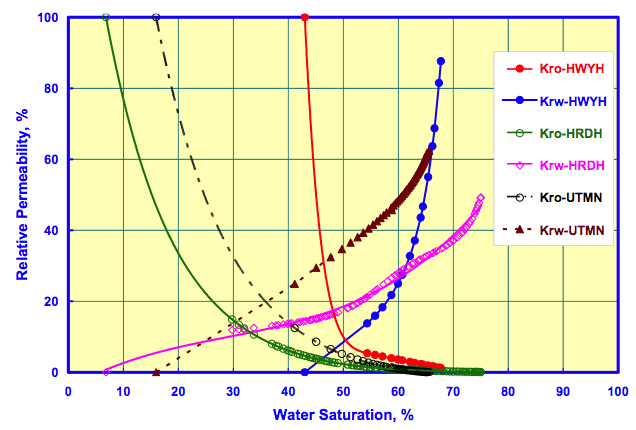
The relative permeability of oil (Kro) represents the ability of that oil to flow as a function of water saturation. When the relative permeability to oil goes to zero (where the oil curves hit the x-axis) then no further oil can flow and the rest will be left behind by the waterflood. As you can see, these particular rock samples had a final water saturation of about 66% in Uthmaniyah, 68% in Hawiyah, and 76% in Haradh. That is to say, that at the end of waterflooding these particular samples, 34%, 32%, and 24% respectively of the pore volume was left with oil that would not come out. Similarly, the initial water saturation represents the point below which water will not flow (ie Krw=0). It is not clear how typical these particular sample are of the areas in question however - there is no reason to expect rock in Hawiyah to be worse on average than rock in Haradh, and we know that in all areas the rock is very diverse and it would be possible to find both good rocks (with a large oil window between the initial and final saturations), and poor rocks with a very small window (such as the Hawiyah sample in the graph above).
Hopefully these samples will illustrate the kind of evidence available on saturations; there is too much data to show all of it, but this next figure summarizes the evidence I was able to gather from Saudi Aramco technical papers.
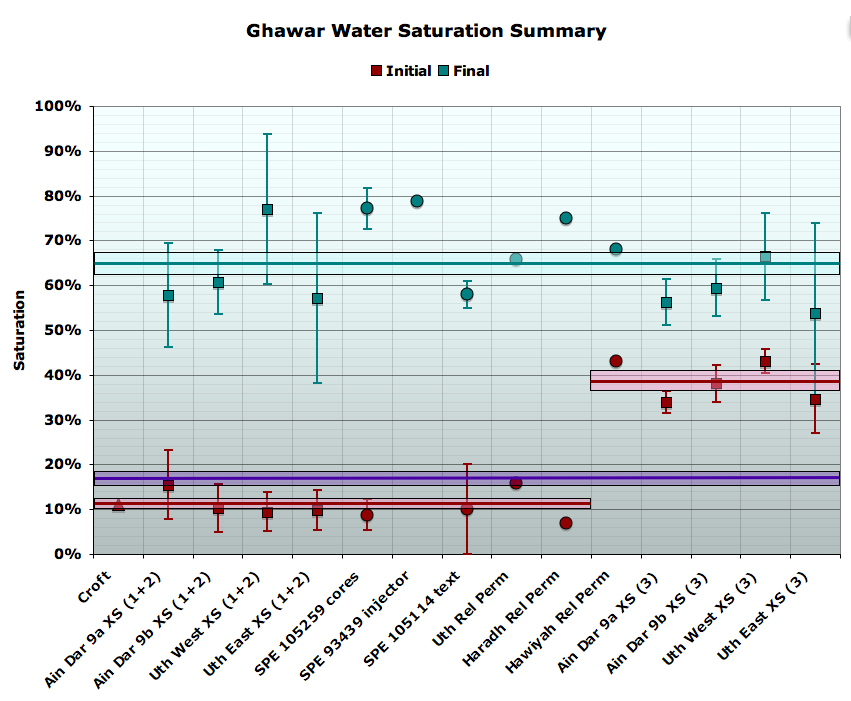
Note that the error bars shown are not the standard error in the mean of each population, but rather the standard deviation of that particular population (whether it be a sample of grid cells in a simulation visualization, or a family of experiments) to better illustrate the variability at a given location, as well as the variability between locations) .
As to the final saturations (turquoise data), although there is significant variation from one place to another, there is no obvious trend in the data. Thus, the approach I took was to treat the points on this graph as equally weighted individual observations around the field average for the final saturation. The spread in these observations allows me to constrain an uncertainty for that average. That gives a final water saturation of 65.1% ± 2.4% (percentage point error, not relative error). This is shown as the pale blue box around the 65% point. The only potential problems with this are if either the Saudi Aramco simulations and experiments lack fidelity, or if this sample of observations is somehow too biassed. Overall, there is quite a lot of geographical spread in the field, but it is somewhat weighted towards north Ghawar. So it may not extend quite as well to the south. However, the data points that we do have for the south do not appear at all anomalous relative to the northern observations.
The initial saturation data (red) is more interesting and gave rise to an extended debate between Euan and I which ended up delaying this post a week. The first thing to note is that the data appear quite bi-modal. There are a number of observations which cluster around the Croft value of 11% (in fact they average 10.9% with a standard error in that average of only 1.0% (percentage points). There are also a number of much larger values that are closer to 40% (mean of 38.6% ± 2.0%). There are no observations in between. In analyzing the initial saturations in cross sections of simulations I divided the cells into separate observations on zone 2 and zone three, since it was obvious the two were very different. The division between zone 2 and zone 3 is based on layer counting and the following scheme from SPE 84371 (A Scalable Massively Parallel Dual-Porosity Dual-Permeability Simulator for Fractured Reservoirs with Super-K Permeability):
The reservoir model is characterized into four zones. Zone 1 is in layer 1, zone 2 is in layers 2 to 10, zones 3 is in layers 11 to 13, and zones 4 is in layers 14 to 17.If the 'Ain Dar simulation pictures came from a simulation with the same layering scheme, then it suggests that, as there are only 13 layers, zone 4 is not important to production in this area (in general, it is rarely mentioned in the literature). It further suggests the interpretation that the bottom three layers are zone 3. If we now look at an example from 1940, i.e. before production, then we can clearly see the difference in the initial saturation in these layers.

As you can see, the lowest three layers are yellow (40% water) or almost so. The picture in Uthmaniyah is similar. It is plausible that water saturations in the poorer rock of zone three would be higher than in the zone 2 rocks above. However, Euan felt strongly, based on his experience, that 40% water saturation was unrealistic in net rock. He argued that those layers must include rock that would not have been considered net in the Croft numbers, i.e. rock of single milliDarcy permeability or sub milliDarcy permeability. He and I explored data from carbonates in other fields were indeed he would be correct, but didn't find dispositive proof that net pay in Arab-D couldn't have initial saturations that high. Hold that potential issue in the back of your mind for a moment. We have a lot of data on saturations, but we might not know quite how much of the oil they are being applied to.
If we average the zone two and zone three values for initial saturation and compute a combined average (using a ratio for net pay based on analysis of the well logs from Powers 1962 paper and simulation cross sections) we get an initial saturation of 16.9% ± 1.2% (percentage points). This gives a saturation change of 48.2% ± 2.6% (percentage points), and a recovery rate of 58% ± 3.2% (before applying any correction for sweep efficiency - blocks that end up unswept). Remember that recovery rate. And remember it just comes from averaging together simulation cross sections and experimental observations that Saudi Aramco has published.
Unfortunately, little public data is available to support estimates of sweep efficiency (how much oil that in theory might have been producible but is left behind because the waterflood moves unevenly and leaves some areas unswept). Based on advice from our various pseudonymous and anonymous industry advisers, I adopted an outer range of reasonableness for this well managed waterflood in north Ghawar of 80% to 100%. Thus my central value is 90%, and I take 5% (percentage points) as the 1-sigma error bar. In the south, with poorer rock and heavy fracturing, I used 80% ± 10%.
Next, an exercise to validate the original reserve model with the asphaltene map was undertaken. This identified one major area where the linear OOWC model and the broad contour interval combine to miss a low-lying area that is above the oil water contact, and which has a modest number of producing wells in the Voelker well distribution, and industry report maps. Based on estimation of this volume, a 5.5% upward correction was applied to North 'Ain Dar, and 4.5% to Shedgum. No issues were identified in South 'Ain Dar.
I compared these estimates with this figure from a 2004 presentation by Baqi and Saleri of Saudi Aramco, endeavoring to refute the concerns of Matt Simmons:

There are a number of very interesting numbers in this graphic. But let's first talk about the recovery rate data. On the one hand for proven reserves we see a claimed recovery rate of 60%, compared to the 58 ± 3.2% we observe by averaging various individual observations in Saudi technical papers. So these numbers are potentially in good agreement (within one sigma) with the exception that proved reserves would be assuming 100% sweep efficiency- a fairly aggressive assumption. More troubling is the estimated ultimate recovery of 75 percent of original oil in place. It does not appear that this ultimate recovery could come from the present peripheral water flood alone. All simulation cross sections in Ain Dar and Shedgum end up at about 65% water saturation - ie 35% of the pore volume is left as oil following the water flood, even in areas that were first swept decades ago. Given that not all the pores began as oil, recovery rates from the flood must be somewhat below 65% under any reasonable assumption. (It's very hard to see how the simulations could be badly wrong on this point, since they would show far more historical production than the actual wells if they were so wrong, making them useless to their owners). If indeed ultimate recovey ends up as high as 75%, it would appear to have to be as a result of extended recovery techniques of some kind, which would of course produce oil at much lower rates.
Now let's take our initial and final saturations, together with Croft porosities and pay heights (which recall are circa 1980 Aramco average estimates). I applied those assumptions to the map based model discussed earlier. Doing so resulted in estimates of original reserves for Ain Dar and Shedgum of 28.3 ± 2.1gb, with an estimate for original oil in place of 54 ± 4gb. (The estimate of original reserves for the whole of Ghawar would have been 83 ± 9gb).
So there are two discrepancies between the numbers I just mentioned and the Baqi/Saleri slide above. Firstly, they reported cumulative production for this area in 2004 of 26.9gb. If the original producible oil was only 28.3gb, then we'd be left with only a couple of billion barrels by 2004, which would imply the field would have had to be already declining, inconsistent with other data showing it on plateau then. Furthermore, they are reporting far more OOIP - 68.1gb, versus 54 ± 4gb. That's a discrepancy over the central value of more than three standard errors - a pretty material discrepancy. Their value is 25% ± 9% higher.
Now, we also have the following graph from the 2004 Aramco presentation concerning the growth of OOIP in the country as a whole:
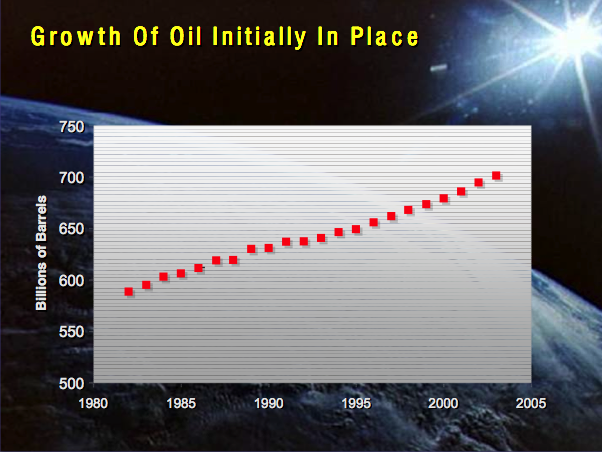
Careful measurement of the first (588.5gb) and last (700gb) data points gives us a whole-country OOIP growth of 19%. So, it would appear the growth in 'Ain Dar at 25% ± 9% is consistent with the whole country OOIP growth. This raises the question of were this extra oil could be? Ain Dar and Shedgum had been in production for three decades by 1980. There would be no potential for growth in the known oil at the edges of the field because the edges of the field had been drowned long ago. In principle, there could have been discovery of additional reservoirs, but this isn't very likely in such an extensively produced and characterized field, and nor is there any discussion in the literature of new reservoirs in Ghawar being studied (though there is ample discussion of deeper Khuff gas reservoirs). This leaves only one real possibility which is that the growth in OOIP is coming from rock that was not previously considered net pay, that is, rock of very low permeability in which oil flows very poorly. Let me at this point remind you of Euan's concern that in the simulation cross sections, the zone three saturations were too high to be net rock.
Could there be enough oil in the poor, formerly non-net, rock to account for this OOIP growth? Well, take a look at this next figure:

I have added the blue line as a visual fit to the trend of the data. Our industry advisers, asked about the likely permeability cutoff for net rock suggested values from one milliDarcy to 10 milliDarcy circa 1980. In my log analysis I used three milliDarcies. As you can see, in the plot above, these cutoffs would leave rock with a significant amount of pore space and a sizable fraction of the rock would be below these cutoffs. for example, the 3 milliDarcy line hits the trend at 14 percent porosity. Overall, this suggests that including all of gross rock in OOIP could lead to about the right amount of growth, though it's hard to be certain based on one well.
At any rate, the stance taken here is that we should give Saudi Aramco the benefit of the doubt wherever there is any, and see if we have established a problem notwithstanding that. Thus, I assume that the saturation figures derived above (from Saudi Aramco simulations and experiments) should be applied to the "grown" OOIP that they say they use, and I use the 700/588.5 change as a basis to estimate that growth factor. As we will see in the sequel, once this is done then all evidence forms a consistent picture of the state of the field.
To begin with, we can examine the implications of the 26.9 gigabarrels of cumulative production to date. Because my model allows me to estimate the volume of rock in the field I can infer how high up the structure the oil water contact must have risen in order to produce 26.9 gigabarrels of oil. It turns out a 511 foot rise is the number required, which can be the basis for comparison with other estimates of the OWC height.
Let us take one more step before we do that. We know the production history in North Ain Dar through 2004 from Figure 1 of SPE 93439 (the North 'Ain Dar water management paper):

With my 3D model and the above assumptions about saturations, etc, I can figure out how much change in the average OWC in North Ain Dar is required for each unit of production. So I can take the 511' offset in OWC inferred from the entire Ain Dar/Shedgum cumulative production by 2004, and then back it down the North Ain Dar structure to give the right production history for that subregion. If I then plot that with all the other data we have on OWCs in this region, it looks like this:

In addition to the data described earlier, I have added the gas cap base (treated as though it was at the top of the structure, which it isn't actually), and the OWC curve inferred from reversing production as just described.
The level of agreement on the state of the field circa 2004, and over the last 15 years or so, strikes me as extraordinary. Given the diversity of approaches summarized in this graph, it seems very unlikely that the conclusions about current OWC could be badly wrong.
Unless the gas cap model is systematically wrong, it's hard to see how production in North 'Ain Dar could not be affected by now.
The production based OWC estimate was divergent from the linear 18.4 foot/year vertical rise line prior to the late 1980s, and follows a more physically realistic track for average OWC. My interpretation of what happened is that during the 1960s and 1970s, under heavy production, water crossing the broad very shallowly angled plateau northeast of the north 'Ain Dar crest was in poorer gravitational compliance, with oil piled up before the advancing water, and water not penetrating the less permeable lower strata of the reservoir as fast as static gravitational equilibrium would have dictated. Thus the ridge areas studied in SPE 93439 did not get water until a relatively late date in the second half of the 1970s. However, in the 1980s, as the OWC got into areas where the structure is steeper, and as production was sharply reduced due to the demand destruction following the 1979-1980 oil shocks, gravitational compliance improved and the OWC in the north ridge area began to track the average OWC based on production quite well.
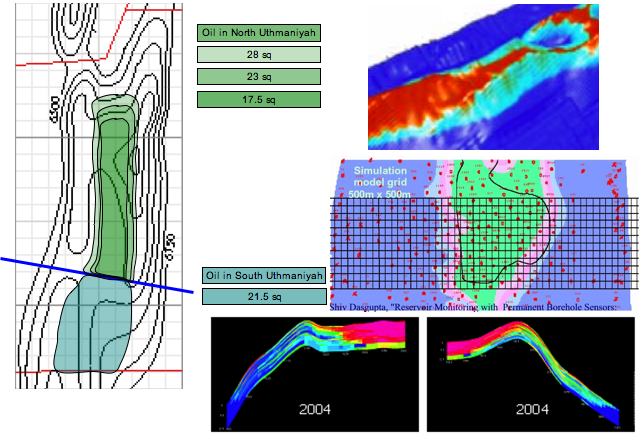
From the 511' offset, I can plot what the distribution of remaining oil would look like. (Note that this is just moving the original OWC plane up 511' without changing its tilt in any way - this is not likely exactly what happened, but is as good an assumption as any, and the Linux supercluster picture suggests it is not very wrong) Here is a comparison of the original and remaining reserve distribution under that assumption:
For comparison, here is the Linux supercluster picture again. Clearly, the Linux picture is either not simulating the gas caps, or is actually plotting "hydrocarbon saturation"
To my eye, this picture is generally compatible in showing oil mainly up in the crests, roughly in compliance with gravity, though with some deviations where the supercluster picture has more oil in the saddles between the crests, while my model has a little more on the crests. However, it is hard to make a more precise comparison than given above, given the different view angle and the small scale of the Linux picture.
This concludes the detailed analysis of the 'Ain Dar/Shedgum regions. I now turn to the simpler treatments I used in the other regions.
Uthmaniyah
Original reserve analysis in Uthmaniyah is based on the Croft map and the global OOWC plane for the whole field, Croft table parameters, the same saturation end points and OOIP growth as in 'Ain Dar/Shedgum, and a 20% map correction as discussed above.2004 reserve analysis in Uthmaniyah is based on visual estimation of the full-oil-layer equivalent area implied by three sources: the Linux supercluster visual, 2004 simulation cross sections from SPE 98847 (the water management in Uthmaniyah paper), and a partial map of the thickness of the oil layer from here.
Based on visual examination of the cross sections, it seems clear that with the dual crest structure in Uthmaniyah almost all the remaining oil is in the saddle between the two crests, and the approach based on gravitational compliance, which worked so well in 'Ain Dar and Shedgum, would fail here. Thus 2004 reserve estimates in Uthmaniyah were based on the area analysis above, Croft table parameters, the same saturation end points and OOIP growth as in 'Ain Dar/Shedgum, and a 20% map correction as discussed above.
Southern Ghawar
Less effort was made to characterize Southern Ghawar as precisely as the north. In general, it is clear that the southern regions will be on plateau for decades at current production rates, and are unlikely to be an important factor in recent Saudi production declines.Original reserves were based on Croft map parameters, the global OOWC map (with correction for tilt in Haradh as discussed above), and a slightly lower 80% sweep efficiency.
2004 reserves were based on the above, plus visual estimation from the Linux supercluster map that oil was 1/8 of the way up the structure in Haradh, and 4/15 of the way up in Hawiyah.
Summary of Uncertainty Analysis
In this section, I summarize all the various strands of uncertainty reasoning discussed above, and combine them into my current quoted error bars.The overall reserve estimates are of the form of a product of six factors:
- An area
- The average remaining net pay height in that area
- The average porosity of the remaining net-pay
- The change in oil saturation from the unswept to the swept condition
- The sweep efficiency
- The inverse of the formation volume factor
Uncertainties in Original Reserves
| North Ain Dar | South Ain Dar | Shedgum | Uthmaniyah | Hawiyah | Haradh | |
| Map | 5.0% | 5.0% | 5.0% | 10.0% | 10.0% | 10.0% |
| Sweep eff. | 5.6% | 5.6% | 5.6% | 6.7% | 10.0% | 10.0% |
| Sat. change | 5.4% | 5.4% | 5.4% | 5.4% | 5.4% | 5.4% |
| OOWC | 4.5% | 4.5% | 4.5% | 5.0% | 4.9% | 10.0% |
| OOIP Growth | 10.0% | 10.0% | 10.0% | 10.0% | 10.0% | 10.0% |
| Combined Uncertainty | 14.3% | 14.3% | 14.3% | 17.3% | 18.8% | 20.7% |
Uncertainties in Current Reserves
| North Ain Dar | South Ain Dar | Shedgum | Uthmaniyah | Hawiyah | Haradh | |
| Map | 15.0% | 15.0% | 15.0% | 15.0% | 15.0% | 15.0% |
| Sweep eff. | 5.6% | 5.6% | 5.6% | 6.7% | 10.0% | 10.0% |
| Sat. change | 4.5% | 4.5% | 4.5% | 4.5% | 4.5% | 4.5% |
| OWC | 52.1% | 26.4% | 17.4% | 25.0% | 25.0% | 25.0% |
| OOIP growth | 10% | 10% | 10% | 10% | 10% | 10% |
| Combined Uncertainty | 55.6% | 31.2% | 24.1% | 30.2% | 31.1% | 31.1% |
The relative uncertainties are largest in 'Ain Dar/Shedgum in 2004, especially North 'Ain Dar. The reason for this is that there is not much oil left there, so small changes in the position of the OWC make large proportional differences in the estimated reserve remaining.
Comparison with Euan Mearns
The other week, Euan Mearns presented his latest thoughts on the status of Ghawar, and its production prognosis. In this section, I compare my subfield estimates to Euan's. Note that Euan's estimates were revised based in part on seeing some of the reasoning behind this post (particularly the 'Ain Dar saddle decode). The largest remaining points of difference in how I estimated original and remaining reserves versus Euan are:- Euan estimated the area based on the boundaries of the Croft structure map. I explicitly modeled the oil-water contact in three-dimensions and used that to bound the area where oil was to be found (this tends to reduce my estimates since the Croft map has contours that are substantially below the OWC in places).
- Euan took the Croft map scale at face values. I, finding the Croft map rather inaccurate, used the asphaltene map in the north, and applied correction factors based on discrepancies in the scaling of the Croft map where I did use it (this tended to increase my estimates).
- Euan used a significantly larger saturation change than my estimates, based on picking the best cells in simulation cross-sections, rather than averaging the cross-sections and other estimates (this tends to reduce my estimates relative to his).
- Euan treated "wedge" effects were the oil reservoir meets the water via corrections. I explicitly model wedge effects (the overall effect of this is unclear).
- Euan relied on visual estimates from the Linux supercluster visualization to establish the 2004 oil-water contact. I relied on data from the SPE papers, gravitational equilibrium, as well as the supercluster visualization. These procedures probably produce roughly comparable estimates - a central result of my work is that the Linux supercluster picture appears to be quite reliable.
- Euan unilaterally moved some of Uthmaniyah into Hawiyah. This doesn't change the whole field estimates, but does move oil from the one region to the other. (Note in Euan's tables I believe he had Haradh and Hawiyah switched accidentally - I have reversed that in what follows).
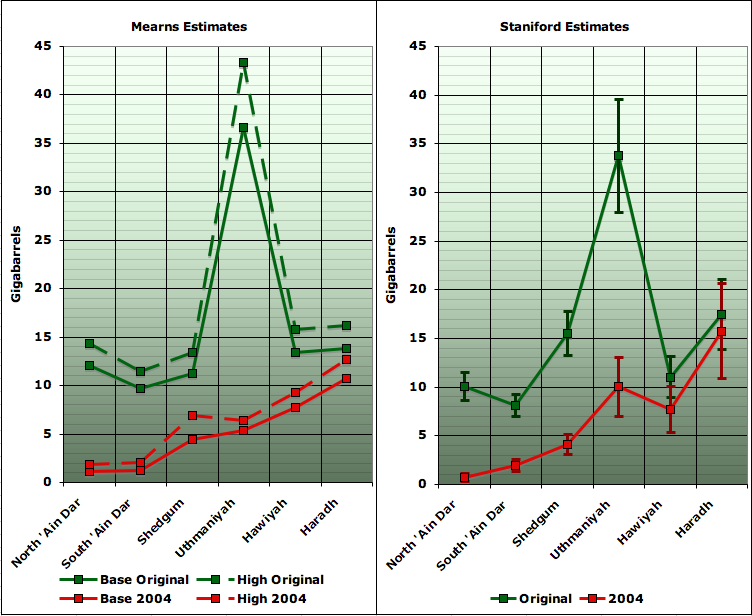
Overall, you can see that our estimates are in fairly good agreement. One of the wonderful properties of independent errors is that they tend to cancel to a significant degree, and here we see the varying effects of our different procedures mostly canceling.
Here is a more direct comparison of our estimated ultimate recovery estimates:
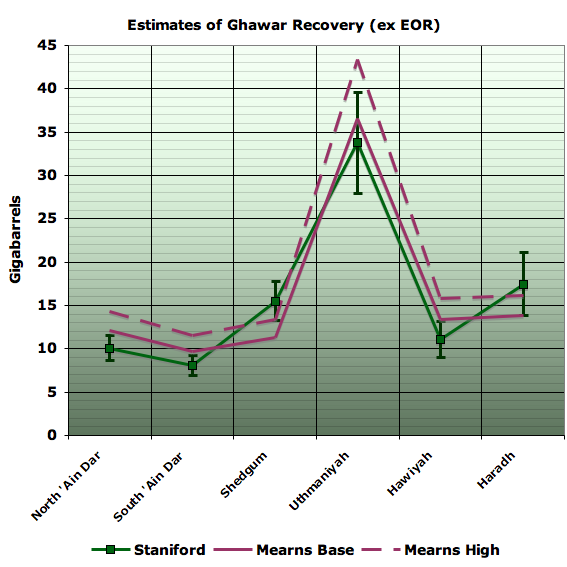
Whole Field Comparisons
Both Euan's and my estimates can be compared to that of others on a whole-Ghawar basis. For comparisons of Ghawar as a whole, the following figure gives estimates by a variety of organizations of original reserves and remaining reserves. Where necessary, I have adjusted from the estimate date to a common 2004 date by adding or subtracting production in intervening years.

- The Jaffe/Elass/Saleri column is an estimate of the Saudi Aramco official position. It is based on combining the 70gb of remaining reserves from the Jaffe/Elass paper with the 48% depletion number from the 2004 Baqi/Saleri presentation 50 Year Crude Oil Supply Scenarios: Saudi Aramco's Perspective. It is unknown how much of these reserve estimates might be attributed to tertiary recovery.
- The "79 Senate 2P" estimate comes from assuming that the "37% of reserves" attributed to Ghawar can be applied to the 177.6gb of remaining probable reserves at the time, and adding an estimate of cumulative production to then. These numbers are all based on Aramco estimates during the period when it was run by American companies and disclosed details to the US government.
- The "79 Senate 3P" estimate comes from adding an explicitly mentioned 17gb of additional possible reserves to the 2P estimate.
- The "Croft" estimate is for cumulative production (quoted on his web page as 51gb at year end 2000, and corrected for 5mbpd production to year end 2004).
- Euan's estimates are his base and high case corrected to 2004. These exclude tertiary recovery.
- The "Staniford" column is the "charitable" method in which we apply average initial and final saturations from various Saudi Aramco publications to OOIP increased as much they say it has increased. Notwithstanding, this is for waterflood recovery only. Note also that the "produced" column here is estimated from "Original minus Remaining" and thus has the combined error bar of both.
- The "W/O extra OOIP" column doesn't grow OOIP at all, but uses the same saturation estimates. This procedure fails to find enough oil in 'Ain Dar/Shedgum to cover cumulative production through 2004, so is unlikely to be correct. I do not include it as an estimate I believe valid, but rather for comparison as it appears to match the "79 Senate 2P" estimate quite well.
Implications for Production
In my view, the best way to assess the implications of the depletion status of north Ghawar as shown in this analysis is to look at the reserve/production ratio. If we assume that declines are uniform after a field goes off plateau, then there is a mathematical relationship between the final R/P at the end of plateau and the decline rate. In essence, the closer to empty an operator can keep the field on plateau, the worse the decline will be when it comes:

In the 1979 Senate report, it was anticipated that Ghawar declines would begin between 1993 and 1995, based on being unable to maintain plateau once R/P was less than 15 or 20 (corresponding to a post-plateau decline rate of 5%-6%). This was based on all vertical wells. Modern technology has allowed maintenance of plateau to R/Ps below 10, and perhaps even below 5 in some cases. This gives rise to very aggressive declines of 10% or 15% or so respectively once plateau is lost.
This next graph gives my estimates of R/P for the Ghawar operating areas. The assumptions made here are that the split between South 'Ain Dar and Shedgum of the 1.5mbpd they are known to share on plateau is 0.5mbd to South 'Ain Dar, and 1mbd to Shedgum. Also, North Uthmaniyah's plateau is assumed to still be the 1.9mbpd documented in the 1979 Senate report. Either or both of these assumptions could be slightly off.
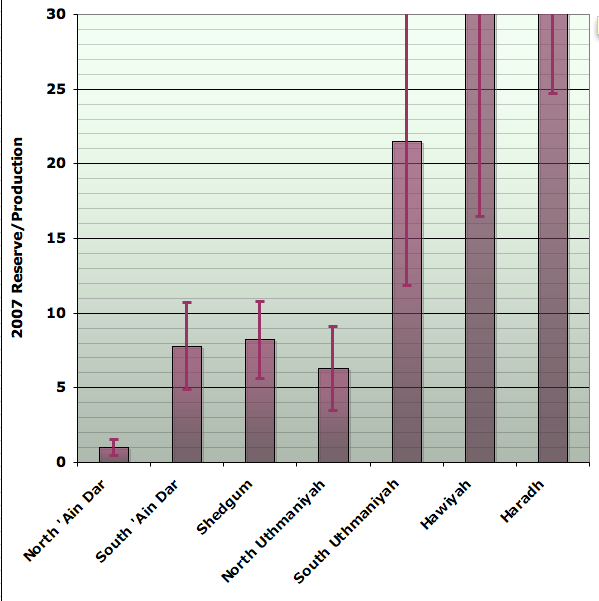
As you can see, the whole of North Ghawar is either off plateau already, or getting close. That is something like 3.9mbpd of production based on last known figures. Whatever of this decline has not already occurred will mostly occur during the next decade.
Southern Ghawar, by contrast, can maintain plateau for decades to come, but there is only 1.7mbpd of production there on last known figures.
While we cannot attribute an exact fraction at this time, it seems likely that not-altogether successful attempts to maintain the north Ghawar plateau to the bitter end explain a significant fraction of the sharp increase in oil rigs that began in 2004, as well as the production declines since that timeframe:
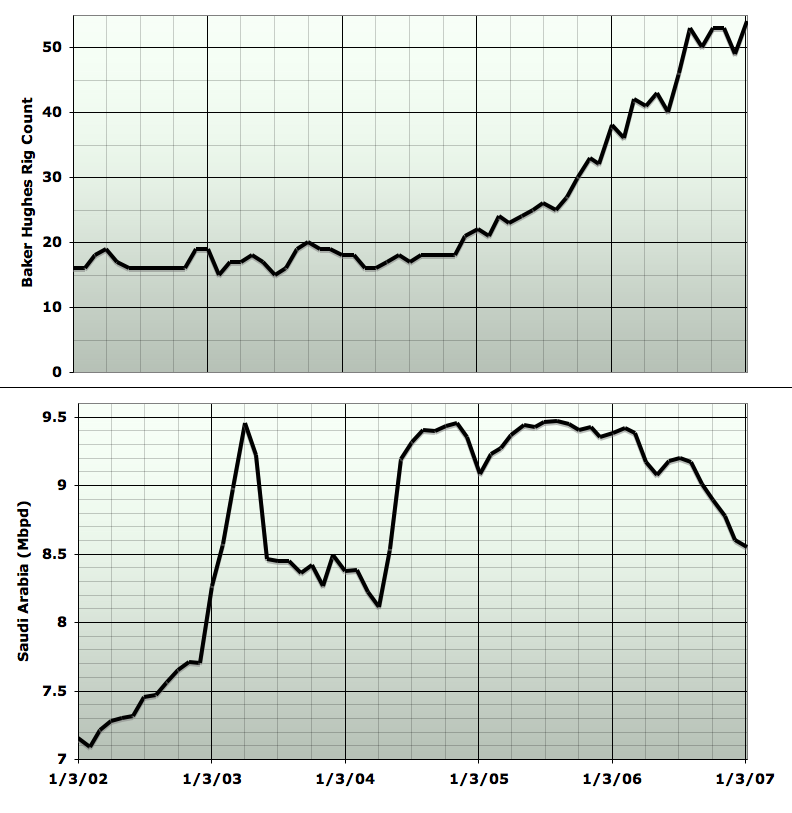
Acknowledgements
It is a great pleasure to acknowledge the enormously fruitful collaboration I have had with Euan Mearns on this issue, as well as with Fractional_Flow. We have exchanged literally dozens of emails a day for months. Euan's deep and original thought, and his insistence on my proving every point of my contentions has immeasurably improved the product - indeed the project likely would not have existed had Euan not challenged my views. Fractional_Flow led us into the Saudi petroleum engineering literature and has been a consistent source of provocative new ideas, professional experience, and references.Additionally, a now sizeable group of oil industry professionals have reviewed parts of this material, helped us understand and debate the issues, and provided key references. Several have contributed quite large amounts of effort to assisting us. They prefer to maintain their anonymity, but their contributions are greatly appreciated.
Finally, numerous commenters at The Oil Drum have contributed critical references, ideas, and valuable critiques over the last two months. Their contributions have been essential.
Notwithstanding, this piece expresses my views alone. Please bring any errors to my attention and I will attempt to fix them.
Recent Oil Drum articles on Saudi Arabia:
Stuart Staniford
- The Status of North Ghawar
- Further Saudi Arabia Discussions
- Water in the Gas Tank
- A Nosedive Toward the Desert
- Saudi Arabian oil declines 8% in 2006
by Euan Mearns
- Ghawar reserves update and revisions (1)
- GHAWAR: an estimate of remaining oil reserves and production decline (Part 2 - results)
- GHAWAR: an estimate of remaining oil reserves and production decline (Part 1 - background and methodology)
- Saudi production laid bare
- Saudi Arabia and that $1000 bet
by Heading Out
- Simple mathematics - The Saudi reserves, GOSPs and water injection
- Of Oil Supply trains and a thought on Ain Dar
by Ace
Contact
- Content: editors at theoildrum dot com
- Tech support: support at theoildrum dot com
License

This work is licensed under a Creative Commons Attribution-Share Alike 3.0 United States License.
Incredible work.
Makes you wonder if there's more to this story than "planned production cuts":
Saudi Aramco to Reduce Arab Light Oil Exports to Asia in June
Leanan,
This is wonderful work and it is confirmed by the work done by M.K.Horn and Associates on their work on the Giant Oil Fileds of the World. As I have posted on previous occasions, they put Ghawar with a URR of 97108 MMBOE.
In 2004 they reported 79332 MMBOE depleted with 17776 MMBOE remaining which ties in with what Stuart is saying. With production since that puts Ghawar at about 86% depleted with approx. 13 MMBOE left and that would include gas.
See AAPG paper 10068 Figure 9
http://www.searchanddiscovery.net/documents/2004/horn/index.htm
18gb left in 2004 for the whole field seems very pessimistic. One would have to assume pretty poor recoveries in the south to get that low, and although there's not that much data that's come to light, what data there is does not suggest grounds for that degree of pessimism.
Well Stuart,
All I can say is those figures are coming from people who are continually upgrading their work on the 910 or so giant oil fields and building on the work of Halbouty, Carmel, St John, Beydoun, Nehring and other highly distinguished geologists as well as the base of Petro Consultants
They also state that the whole Arabian Plate held 900 MMBOE. Beydoun states that 302 MMBO had been produced by 1997. When you take gas out of it and subsequent production, the whole Middle East may have less than we think
Without knowing technical details of how they produced their estimate, there's not much more I can say.
http://slashdot.org/firehose.pl
hit it if you are so inclined...search for Ghawar.
No stories were found that match your query.
Its still on page 1, between the two most recently posted stories. Set the filter colour to cyan to reject most of the junk.
[update between "Science: A detailed plan" and "Linux: The clueless newbie"]
Go over to dKos and recommend Jerome's diary on Stuart's post for front paging.
Downunder - my Base Case had 97 billion initial reserves - so excellent agreement with Horn Associates. But by end 2006 I still have 27 billion left, i.e. 72% depleted. And so like Stuart, I'm scepticle that the depletion level is so severe in 2004. It's hard to see where 79 billion bbls might have come from.
I reckon that Abqaiq may have produced 13 billion. So if 79 billion is right then we have 92 billion from the Arab D - leaving only 20 billion produced from everywhere else (C+C+NGL for a 2004 total of 112 billion). Does that mean other fields are hardly depleted at all?
Euan,
Remember those 79 billion are not all oil, but include gas. When Horn and his associates mention 79332 billion at the beginning of 2004 they are being quite specific. I think the big oil companies know exactly how much oil there was and is in all the big middle east fields, after all BP has been there for nearly 100 years and Chevron over 80.
If you read the link that Stuart used by Martin Ziegler, the Exxon geologist, he explains the whole geology of the Arabian Plate. They know where all the fields are and where they're not. I am currently trying to piece together what was in all the 151 big oil fields in the Arabian Plate and it doesn't seem that there was more than 500 MMBOE in the lot, the rest being gas, which would put Saudi Arabia at about 170 billion URR with 60 left which is what ACE has been saying.
I will talk to you by email about my further thoughts on this.
Nice note from Matt Simmons (posted with his permission, after I sent him a link to Stuart's article. I commented that Matt and Jim Kunstler, et al, tried to warn us.)
(I should point out that I started looking at exports, because of prior work by Matt.)
Jeffrey Brown
From Matt Simmons:
(Matt's a very busy guy. I added an edit for clarity. J.B.)
The Status of Ghawar & Cantarell, the 64 Trillion Dollar Question
Needless to day, superlative work.
Ghawar and Cantarell are two largest producing fields in the world. In both cases, we are seeing rapidly thinning oil columns, between water legs and gas caps (secondary for Ghawar, primary for Cantarell). I have long described these two fields as warning beacons heralding the onset of Peak Oil.
From 2/06 to 2/07, Saudi Arabia declined by 10%, Mexico by 6% (C+C, EIA).
I estimate that Saudi oil exports probably fell by about 15%.
Mexican exports fell by about 11%, the overall first quarter was down 16%, year over year.
Using Brent as an index price, the world paid about 1.7 trillion dollars for oil in the 20 months leading up to 5/05. In the 20 months after 5/05, with world C+C production down by about 1%, the world paid about 2.7 trillion dollars for oil.
Absent an immediate recession, I am increasingly beginning to think that Matt Simmons is probably right, or even conservative, in his estimate of world crude oil prices--$200 in 2010, in constant 2005 dollars.
I would simply reiterate the advice that I have been giving for over a year--Economize; Localize & Produce and assume that your income drops by at least 50% and assume that gasoline is over $8 per gallon in the US.
BTW, just a reminder. Remember that the collapse in the Saudi stock market corresponded to the onset of their "voluntary" production cutbacks in the first quarter of 2005.
Update:
2006 EIA Net Export Data Are Out
Hubbert Linearization Analysis of the Top Three Net Oil Exporters
Posted on January 27, 2006 - 1:47pm
Guest Post by westexas
The EIA's estimates for net oil exports by the top net oil exporters (one mbpd or more, Total Liquids) is out: http://www.eia.doe.gov/emeu/cabs/topworldtables1_2.html
As I predicted in January, 2006, Net Exports by the top three (Saudi Arabia, Russia and Norway) fell.
Production by the top three was down 1.7%, but net exports by the top three fell by about 4%. Note that on a month to month basis, instead of an annual average basis, the decline in net exports is much sharper.
The only increase in consumption for the top three was for Russia (from 2.8 mbpd to 3.1 mbpd). The EIA reported consumption increases for all three from 2004 to 2005.
I'd venture to call this the best ever analysis of Ghawar.
As jeffrey said elsewhere, worth $1000 or more per copy, if it were marketed as a consultancy report.
Though the best-sellers in that field always seem to come to entirely different conclusions, maybe that's the secret.
That is exactly what many reports are made for: to sell/justify actions already decide. One doesn't have to go farther than the Iraq WMD forged reports to find this is often the case. Perkin's book "Confessions of an Economic Hitman" show a whole economic culture based on modeling/reporting exactly with this type of intent: produce what the buyer wants and good things come your way. You give them plausible deniability and you get the money, while they go ahead with the decisions. Everybody wins.
But I digress...
Indeed the work of Staniford and Co is monumental, even I can feel that although much of the stuff is beyond my skill to analyze.
What I find interesting is the relative big margin of error and how little impact it has for Ghaware (estimating).
In the very unlikely case that the margin of error for produced and total would both be pessimistic, the remaining oil would be a meager 23 gigabarrels or so out of 95 or so of total (estimating these from Stuart's graph). That would mean a fairly bleak depletion scenario and by all accounts Ghawar should have crashed already regardless of any technology deployed. That is, if I didn't interpret the data wrong.
In the case where estimates are assumed to be roughly accurate, the field is still just barely hanging there or already started to crash and is being milked for all its worth.
Only in the most optimistic case of error margins working towards Ghawar's advantage, would the field still have some years worth of production (current rate?) before crashing.
All in all, like it has been said so many times before, I don't think the error margins really make that much of a difference (in terms of extra time for preparing or reserves available).
Interesting.
EDIT: corrections
I used to think oil would go pretty high pretty soon, but have reflected on groppe's comment last fall that third world conservation and fuel switching remains sufficient to hold oil at 60 for an extended period. His track record is second to none, and this prediction is therefore worthy of consideration.
EIA's global oil production numbers are out for 2006, too, and it looks like the world produced a little less oil in 2006 than 2005.
Superb and huge post, Stu! What a challenging and huge topic!
I tend to be skeptical about Saudi claims to be swimming in oil with not-yet-discovered reserves and all.
Your post makes me think that (as others have noted) the truth will out soon.
I wonder what sort of cover stories will be invented and circulated to keep a lid on things. I wonder how effective such propaganda will be.
Or will KSA and others simply say -- "Ooops! We were wrong. We're running very low on oil after all. Sorry."
I'm not nearly as prepared as I want to be. And so it goes, eh?
Stuart,
It will take me ages to pull apart this extensive paper. Its interesting to see you have gone for a similar computation model as the one I have.
In the meantime, one or two questions.
1) Read off the graphs, I think you are saying whole field original oil = 98Gb, 2004 remaining = 40Gb giving a depletion percentage of 58%. Is this a correct reading?
2) You seem to be making the assumption that for Ain Dar/ Shedgum the water contact remains essentially gravity bound, thus generating the shapes shown in your plots. However given the statements made elsewhere, particularly for Uthmaniyah, how likely is this? The ANDR-XYZ, even when corrected for distortion, shows a different picture of depletion in the saddle region which is not exclusively gravity driven.
3) The production figures from the 1979 report seem a little strange with 5.85Mb and 1.3Mb from Hawiyah/Haradh. Given the age how could there be an expectation of 0.9Mb from Haradh using MRC wells that were not developed then? We know at that date Haradh was not really producing anything much, so where do these figures come from? If they are indeed aspirational, how realistic are they likely to be for Hawiyah/Haradh 2 decades in the future? The other areas chime with other figures from elsewhere.
4) What, if any, difference in initial water saturation did you find across the field, rather than through zones? I think if I have it right you have one value (16.5%) everywhere?
2) Clearly, we do not have a perfectly level OWC. As you note, there are OWC fluctuations of a couple of hundred feet in the saddle, as well as elsewhere. But I would suggest that the overall rough OWC levelness in Ain Dar/Shedgum (which we can see in the supercluster picture eg) makes the "average" OWC offset a convenient analytic target. The uncertainty in the average OWC is much less than the fluctuations in OWC well to well, since those tend to cancel. In the end, the fact that averages in South Ain Dar/Shedgum saddle, North 'Ain Dar ridge, and estimates for the whole ADS regions all line up suggest it's a good enough approximation to be pretty useful. 3) Production at the time was not 5.85mbd, since the southern portion was not on tap. "We know at that date Haradh was not really producing anything much, so where do these figures come from?" What Aramco execs told the Senate staffers they were planning on. True they didn't have MRCs back then, but they also didn't know all the problems they were going to run into that would make them want to use MRCs. "If they are indeed aspirational, how realistic are they likely to be for Hawiyah/Haradh 2 decades in the future?" Well, if you found some data saying Hawiyah was producing 0.3mbd or 0.5mbd instead of 0.4mbd, I wouldn't be a bit surprised. But I'd be astounded if Hawiyah was doing 1.5mbpd, when it's sitting between South Uth doing 0.4mbd and Haradh doing 0.9mbd, and the reservoir quality is more or less on a gradient between the two.
Absolutely outstanding work. Many thanks for your dedication to extracting the greatest informational value from minimal and fragmented raw data.
An excellent post Stuart.
I actually understood 90+% without being an oil guy. Lots of hours on TOD didn't hurt. I didn't have to learn it all at once. My initial conclusion based on the 3D imagary has held up.
You have rigorously defended the depletion position posted on the site for months now. This post has reinforced the uncertainty of projections based on available data. My hat is off to you for spending an enormous amount of time ferreting out the details. I would have given up and just done my day job.
I look forward to those with a different viewpoints presenting opposing views with the same rigor and facts.
To date the optomistic, peak oil is decades away, camp has said there is still lots of oil available trust us. Well I don't trust them anymore and their forecasts appear to be getting less accurate as we go forward.
Fantastic work, Stuart!
/Kalle
Is there any longer any merit whatsoever to Jeremy Gilbert's recent contention that the "amateurism" inherent in the investigation of Ghawar on TOD could never possibly hope to rival the "professional" level of knowledge that ARAMCO itself possesses?
This is all beyond me - but my gut tells me no
Everyone's hard work is now really culminating. Anyone who wants to refute this, needs to do so by cold, hard data or stop taking themselves so seriously. Congratulations.
Gilbert's point still applies, though he certainly could have used less condescending language. However, how relevant is the concern? We all know that northern Ghawar will eventually water out. Though Aramco staff have all the current data and most up to date models, all they can do is put a finer point on the end result. That doesn't mean that non-oil professionals with modest data can't come to a useful conclusion. We don't need to know at exactly what date production from those fields will drop by X percent. It's sufficient for the original question to know whether production is likely to be declining now in a manner that might explain the decrease in Saudi production and the increase in those oil rigs.
Put it another way. A car is headed for a wall. The NHTSA engineers have all the data on the characteristics of the wall, the characteristics of the vehicle, the exact speed, the rate of acceleration/deceleration, etc. All we amateurs have is the model of the vehicle, the speed at a given location and time, and the knowledge that they're headed for a brick wall. You don't have to be an automotive engineer to figure out at what point the brakes have to be applied, and how fast, to avoid killing the occupants. If the vehicle is doing 60mph 100 feet from the wall, you don't have to have perfect knowledge to know that it's going to be a mess.
Wicked work Stuart!
You and Matt Simmons should co-author a new book. You can catch some rewards just in time to build a bunker :-)
KSA is still "voluntarily" cutting Asia exports for June, not a good sign.
Edit: spelling - broke a finger this weekend working on my fence...ouch.
I would not be surprised if Stuart receives a lucrative contract offer from Aramco - on the condition that he quit publishing!
Wow!
Marvelous job Stuart. Kudos!!
The last curve shows average SA production of 9 mb/d in 2006 vs 9.5 prior (rounded to 1 significant digit), and suggests 8.0 mb/d in 2007, ending at 7.5 mb/d. One could infer 7.0, 6.0, mb/d respectively in 2008,9,- ending at a sustainable SA plateau of 5.5 mb/d.
The Kopelaar/Skrebowski projections do not include this SA Ghawar decline and are therefore probably optimistic.
This is a request for Rembrandt to publish an update to has work with this and now available Cantarel decline rates factored in. Murray
Fantastic work, Stuart. The amount of time you continue to dedicate to this subject is amazing and tremendously appreciated.
It will take me some time to read completely (or, more exactly, to study), but even on the basis of a cursory look, it seems to be the best that can be done with the available data.
Great work, Stuart!
KILLER. Stephen Jay Gould-ian attention to detail. This needs to be distributed far and wide.
TODers have been eagerly waiting for this report. It looks as if you and euan are closing... Thanks for your collective extensive efforts. I assume your posts are regularly read and graded, if a bit glumly, by some in sa, both those in the know and those not.
Pretty convincing. If north ghawar is collectively at r/p 6, then we might expect decline at 15%/y, or 600k/y from the 4Mb/d north ghawar production. I wonder if the recent cut of sweet/light to asian buyers means this has begun.
Hope you find time to show what you think this means for future overall sa production... Don''t know any bottom up analyses that are assuming any sa decline, much less what has already happened and what looks to be coming fast.
Stuart - we should maybe publish all the emails one day:-)
As an opening comment I will add some of my comments to your comments about my approach.
The work you have done modelling the original OWC and contact movement is more technically detailed and correct to my approach. Needs to be noted that the Croft map contains two cancelling errors - one is the deeper contour level (giving rise to more oil if as I did you assume this to be the OWC) and the other is the narrower scaling (giving rise to less oil). Hence there is a degree of cancelling. The main map check I did was with the Voelker wells map which fitted extermely well around N Ain Dar.
This is one set of variables where I will need to revise my numbers - My Swi (initial water saturations) numbers need to be revised upwards in the north (result will be less initial and remaining oil) and my Swf (final water saturation) numbers will need to be revised down - this will lower my numbers for produced oil.
Gut feel versus computing power:-)
This for me is one of the major strengths of your work - tying together lots of fragments of information to model movement of the OWC throughout the production history to end up with a picture that is a good approximation of the Linux map - great!
A life long weakness of mine has been to ignore convention when it flies in the face of common sense - and chopping off the N end of the Hawiyah ridge and including it in Uthmaniyah ruffled my geological sensibilities.
One final and important difference is the sweep efficiencies applied. The main difference between my Base Case and High Case is the Base Case uses 80% sweep efficiency and the high case 95% - and you are using 90±5% (?) - overlapping but somewhere inbetween.
I'l be back with some more technical questions tomorrow - especially about Swi in Hawiyah.
Hello Euan & SS,
I posted this late April 26 in Euan's earlier thread on Ghawar, but I just want to make sure that you guys are aware. You might have missed this with all the email discussion and preparation of keyposts.
--------------------------------------------------
Hello Euan,
I noticed your qualification of fit geometry in your FIG 12:
Croft Bouguer Gravity Map [1959] to Voelker Well overlay
Perhaps this newer Bouguer Gravity Map [1987] might better fit the Voelker Well overlay:
http://perso.orange.fr/brcgranier/gmeop/Esg2001/kluwer/Edgell_1992_09.gif
Figure 9 from original link:
http://perso.orange.fr/brcgranier/gmeop/Edgell_1992.htm
Bob Shaw in Phx,Az Are Humans Smarter than Yeast?
---------------------------------------------------
Perhaps this might be useful for a more accurate estimation of Ghawar volume and contours as you can zoom the link.
Thank you, Stuart.
This is an amazingly comprehensive analysis.
Even granting sigma 2 error; the only thing left is the crying.
Your divergence from Euan on this point sealed it for me:
"Euan estimated the area based on the boundaries of the Croft structure map. I explicitly modeled the oil-water contact in three-dimensions and used that to bound the area where oil was to be found (this tends to reduce my estimates since the Croft map has contours that are substantially below the OWC in places)."
Fantastic work Stewart. Thank you very much.
I have one question. I have to access TOD via a slow dial-up account and can not get the graphs/pictures to load. Is there any possibility that I could pay you to burn a CD of the entire post and send it to me so I could better understand the text by seeing the pictures?
Email me your address and I'll mail you a CD.
Stuart,
Free=PRICELESS.
Thank you, beyond words.
Thanks Stuart
I give a presentation to oil and gas folk in a few weeks on the potential for $150 oil in the near future.
This will help with the "convincing" part.
Incredible work Stuart, with accolades to Euan, FF and everybody else who contributed. Although doctorate level conjecture, it probably is fairly close to to the mark.
Did anybody else notice the IEA April OMR (published May 11), where it said that OPEC supply will tighten 2.5mbpd by Q4? Could the Ghawar situation be part of the picture, or make things worse?
Seems this summer is indeed going to be interesting.
Congratulations - you've forced me to open a digg account.
Amazing work!
Riveting - not since Len Deighton have I been held so spellbound. It takes lots to get me to zone out and this did it. I don't know if I could explain it to anyone, but that's my problem - clear, precise in reasoning, and structured straightforwardly.
btw, even at sigma 3, it's not good news.
This kind of analysis is why I've been lurking here for so long....
Hello SS,
YOU ROCK!!! Is your computer still smoking from all this overload work? =)
This keypost is tremendous, and it was very gracious of you to give full credit to your collaborators mentioned in your acknowledgements too. The TODers and whoever are your anonymous contributors all owe you BIG THXS for pulling this all together.
In short: if you go to the next ASPO conference--> You deserve a prolonged standing ovation. Hopefully Euan and F_F can attend too to receive similar recognition, and help further represent for the growing TOD WWWeb expertise.
Okay, enough sunshine for wazoos....back to work:
Your shown Shedgum crest in Fig 1 [the opening graphic] as not having any gasgap and/or a production void caused by the Shedgum Leak Area. I don't have SPE membership so it is hard for me to find specific maps that precisely shows the Leak location, but I thought it was topcrest and affected about 30 wells or more [see Voelker PDF page 80,frame 110 bottom].
Are the little green dots in your link below the Shedgum leak area? I must admit that I am confused by Shedgum--can you offer some clarification? Is it reasonable to expect topcrest gas reinjection in Shedgum now [2007]?
http://www.theoildrum.com/files/ainDarGasCap2Views.png
Now Uthmaniyah [UTMN]: if you look at Voelker [page 76, frame 106] doesn't that significantly differ from your smooth and rectangular 'valley' UTMN in:
http://www.theoildrum.com/files/uth_analysis.png
I would like the TopToders to analyze this more please. I would have thought you would have included waterflood wavefront variation and DFN voids like the white area in the Voelker graphic.
Bob Shaw in Phx,Az Are Humans Smarter than Yeast?
"little green dots" are a contour label, I think. I didn't model the leak area explicitly, but it goes to sweep efficiency.
I am not aware of any evidence for gas caps in Shedgum, and I doubt we would see this practice today, since KSA now has uses for their gas...
I don't see a way to turn the Voelker picture into an oil layer, though I agree it's an interesting picture. Of course, I don't pretend the oil layer has a smooth edge, it's just a way to get a reasonable estimate for the likely area of remaining oil, and an uncertainty large enough to cover the likely possibilities (including the inevitability of a ragged edge to the true region).
Hello SS,
Thxs for responding. I still look at, and highly zoom with the magnifying tool, the Voelker Ghawar Well Map [page 24, frame 54 of PDF], trying to figure out a 'Rosetta Stone' that could decode it.
We know that Aramco has been using verticals, and offshoot horizontals, and other recovery techniques for some time. It would be helpful to know the more recent installed extent of MPPumps and MRCs since 2004 throughout N. Ghawar [A/D, Shedgum, UTMN]. We already know the gascap program for both parts of Ain Dar and MRCs in Haradh.
I know you specifically excluded tertiary recovery effects from your keypost, but would you like to venture a guess as to how much more this would reduce the N. Ghawar graphic?
From this link below, they[LSU] are getting ready to field test GAGD, not sure where, but it seems to me that this would work perfect for sweeping the lower Arab Zone low perm/porosity layers bypassed by water if they can apply a capping seal to the strati-layer above:
http://updates.spe.org/index.php/2006/12/14/gagd-process-works-with-natu...
Could this also help to speed the oil/water resegregation process along the ridgelines that Euan mentions in a recent posting below? I admit I don't know much about fluid/gas dynamics, but I envision the gas bubbles helping to stir the oil/water mix to speed buoyancy segregation to the crestal tops for extraction; this might help alleviate watercut %s at these crestal wells, and I am guessing that it is easier and cheaper to process out gas/oil than a slightly oil-stained brine solution. Any thoughts from you or other TODers? Thxs for any reply.
Bob Shaw in Phx,Az Are Humans Smarter than Yeast?
Thanks, Stuart and Euan too ! You have really contributed to my overall understanding of the Saudi situation. I particularly want to thank you for the clear, concise and honest explanations of reservoir engineering terminology, and the mathematics.
I just wish the picture were a little more optimistic overall. It looks like our political leadership has driven us off a cliff, and didn't even warn folks to fasten their seatbelts.
Thanks for this Stuart, it's obviously an incredible amount of work.
One thing that didn't seem quite right to me was the North Ain Dar Depth Data Summary chart, showing a linear progression over time. A linear function wouldn't seem appropriate, given that the oil production from this area was throttled down so sharply in the 80's. Is the linear function just an approximation? Maybe I didn't quite understand it.
Well, it's an approximation certainly, but appears to be a fairly decent one. We have the horizontal flood front velocity which is fairly constant from 92 to 2004, so that tells us linear rise. And then the well profiles, while only approximately linear individually, wouldn't agree even on the sign of any second parameter you put in to allow the thing to curve. And the production based OWC curve is linear for quite a long time. And of course the fact that the straight line gets us from the turquoise 70s observations to the 2004 data points tells us that we couldn't put too much of a kink in it without wrecking that agreement.
In other words, I didn't put in a linear assumption a-prior. I just did it that way because it's kind of the only thing the data will support (a straight line plus noise).
Stuart, many thanks to you (and to those who assisted you) for this superb and extremely detailed analysis. It's a real shame that KSA and other key producers still maintain such data secrecy which thus encourages over-optimistic forecasts for future production.
Future output volumes will soon tell us who is right - my view is that it's going to be somewhere between views of Stuart and Euan (which have been steadily converging as the detailed analysis proceeded).
A most impressive body of work Stu - simply amazing.
'Hats Off!' indeed to you and the rest of the contributors.
Stunning. It took me 45 minutes just to skim.
Thank you Mr Staniford, Mr Mearns and Mr Flow for all of the hard work and hundreds of man hours you and your teams have applied to this question. If I might ask a question and if anybody can answer or direct me to a logical explanation t
.
How does oil get into reservoirs? I can not find any reasonable explanation. I understand oil is the product of eons of life dying and falling to the sea floor, then millions of years must pass and tremendous pressures and heat etc. It doesn't explain how it gets pushed into relatively tiny areas in these massive quantities. Just curious, anybody
.
Thank you in advance for you indulgence.
F3
Oil is less dense than rock (or water) and will naturally float up due to gravity. It moves until it comes to some rock that it cannot move through. If the barrier is shaped such that it can trap the oil, you get a reservoir.
I think another piece of the picture is: over the millennia a lot more petroleum gets produced than what was around at the start of our extraction program. Most of it does not get trapped though and just escapes to the surface. A lot of it also gets pushed too deep is destroyed by the high temperatures.
As I recall, Deffeyes's book _Hubbert's Peak_ does a nice job explaining the basics.
Close. Oil cannot displace rock but it can displace water. Some sedementary rock is naturally porous. These pores will naturally be filled with water. Over millions of years, the oil, being lighter than water, will move up and displace the water.
It will continue to move, all the way to the surface, unless it hits rock that has no pores of fractures for the oil to move through. The Orinoco basin ,Alberta Oil Sands an a place called the La Brea Tar Pits in Los Angeles are examples of places where the oil migrated all the way to the surface.
There are many other places, less famous, where oil also reached the surface. In the Bible it is called "pitch". Noah was supposed to have sealed tha Ark with it.
Ron Patterson
My layman's understanding. Oil is less dense than rock, so the oil rises (just like a cork under water). Oil can only move through porous rocks though. In a very few places the oil gets into a porous rock capped by a dome shaped impermeable layer - the oil gets trapped, becoming an oil reservoir.
I guess the majority of oil ever produced will not have encountered one of these geological traps, and will have seeped to the surface, where the volatile fractions evaporate, leaving a sticky tar, which would weather and dissipate, leaving little trace.
other kinds of traps are formed when porous sandstones and limestones are faulted against impervious shales, or evaporites like gypsum or salt. Organic rich shales are thought to be the most common source rocks for oil, and they seem to be richer in undecomposed organics when they are deposited in 500-1000 ft of cold water. As they get buried more deeply the oil and salt water are squeezed out as the rock compresses as it is buried more deeply.
Must of the oil and gas never migrates out of the shale. The unconventional gas wells in the barnett shale and other shales are engineered to get this gas and oil out.
There are also permiability traps. The reason that the above article references the tar in the Arab B is that Ghawar is at least partially divided into different fields by these barriers.
If I could go out to the middle of Ghawar, and dig an immense open-pit mine, going down 7,000 feet (into the oil layer), what would I actually see down there. Surely not a vast underground tank of crude? But would it be solid rock impregnated with oil, or gravel and sand and oil amixed and possibly with water and natural gas thrown into the mix? While I doubt that there are any substantial underground reservoirs of liquid crude, just how large is it likely specific accumulations of crude could become?
Antoinetta III
Basically it's solid rock impregnated with oil for the most part. Sometimes pores get big enough to be termed caves, however, if water dissolved the rock enough before the structure got filled with oil. See here for a nice discussion of carbonate reservoirs.
Stuart, really an amazing post, I was waiting with some trepidation for this and it didn't dissapoint. Quite possibly the most significant "300+ hours" of graft ever undertaken.
Euan provided a couple of production depletion graphs -I was wondering if you agreed more with his 'base case' or 'high case' graph -or are we perhaps likely to get something a little more unexpected as the Saudies 'throw more wells' at the problem??
Nick.
Another fragment of information y'all may find useful. A few days ago I attended a talk by Nansen Saleri at MIT, titled "The role of technology and peak oil." (The title used in his powerpoint presentation was different, of course.) In his talk, Saleri stood by the CERA outlook, saying the world would see an "undulating pleateau" in hydrocarbon production.
Anyway, his presentation used several of the images from the Linux supercluster paper and described them as being representative of the Ghawar oil field and not a mere simulation. He also had some other images (I should have photographed the screen..) mapping the southern end of the Ghawar and marking locations of monitoring wells meant to track the progress of water into the field.
So it's 2007, and Saleri stands by those images as being data, not fudge. I challenged him directly on the issue of opacity in the industry and cited the Hirsch Report as a reason not to take any of his claims at face value unless Aramco started releasing more data. He responded by claiming that Aramco is the most open of the national oil firms and that Aramco would be releasing more data in the near future in order to avert panic over oil sources. The bad news is his first claim is arguably true, and Aramco is more transparent than anyone else. The good news is we may have more data coming.
Well done my friend..
I only wish to ask him about his statement that Ain Dar/Shedgum will "be producing 2 million barrels per day at modest water cuts for decades to come" at the 2005 CSIS presentation.
FF
You may get the chance. Keep Googling him over the next few weeks. He may pop up for a talk of this type at another school with an OD reader in the neighborhood.
Cool! I wish I had his current slide deck. If he comes out to California, maybe I can have lunch with him :-)
Hello SS,
IMO, he should extend a full invitation to the TopTODers, plus Simmons, Deffeyes, Colin Campbell, and other ASPO notables to a full KSA 3D computational fly-thru of all their oilfields.
I wish! =)
Bob Shaw in Phx,Az Are Humans Smarter than Yeast?
"...Aramco would be releasing more data in the near future in order to avert panic over oil sources."...say what?
What event or info might cause a need to avert panic?
There are too many festering candidates...Ghawar is in focus; there are others.
I do learn a lot at TOD from you all. Thanks
For starters, the constant talk in America about getting off "foreign oil" is something that is unnerving the Saudis.
Thanks for going! I was in Boston the week before and happened to run into (yes she was cute and eating alone at local Mexican spot and yes I am lucky) the MIT post grad assistant in charge of sending out the email for the event and we spoke at some length about peak oil, Saleri and MIT's relationship to Aramco. I encouraged her to attend the event and ask Nansen the tough questions. As with all discussions concerning peak oil it was hard to explain the importance of oil in society as it is equated with technology. She indicated that Aramco recently had 30 MIT students over too Saudi to discuss alternative energy projects. I told her that nothing can replace oil and I think the Saudis have an inferiority complex and should step to the plate and lead the world discussion about how best to use this declining resource.
Her boyfriend arrived (Red line train fire stranded his girlfriend within my reach) and he is a part of the marketing arm for MIT's Ocean Engineering. His group appeared to be working on two issues associated with energy - the problems associated with drilling equipment in high pressure environments and extracting energy from the motion of the ocean. I encouraged him to attend the talk and then I polished off my Margarita and watched the Red Sox pull one out late again.
PS - Were you the only one to ask any tough questions? Did anybody talk to him after the presentation? Did you go and listen?
The question period was pretty brief, and followed up with a reception I had to skip on and return to work, so I asked the toughest question. The crowd attending had several folks from Schlumberger and I suspect Saleri spent most of the reception talking to them.
http://blogs.wsj.com/energy/2007/05/14/blog-roll-peak-oil-in-saudi-arabia/
DO WE HAVE CONSENSUS THEN?
Stuart's remarkable work of research has been referenced on the energy blog at the Wall Street Journal. When I left there only about 10 minutes ago, there was only one other comment referencing the work, so I attached my own comment, (text at close of post, below)
We are in agreement then that we have consensus between the big players here, Euan, Stuart, Fractional Flow, Westexes, Khebab, and others that Ghawar is peaked? This would leave Robert Rapier abstaining. Anyone else?
Given the quality of the work, and the number of extemely talanted researchers working the subject, The motion seems to be giving it to them, and conceding any argument on Ghawar. All that is left now is to attempt to work the depletion rates.
Given that, I ask that they open a similiar inquiry on:
(a) Khurais "Production from the Khurais Field is to be increased to 1.2 million barrels per day in 2009. Khurais is located on a large structural trend to the west of, and parallel to, the Ghawar trend. Because of this superficial resemblance to Ghawar, there were very high hopes that Khurais would be comparably large. It turned out that the reservoir at Khurais was much smaller and not as high quality as Ghawar, though it is still the largest of the proposed projects. Variable reservoir quality has also been a problem at Khurais. Pilot-scale production at Khurais began in 1963, but the field has never been fully developed. It produces Arab light crude." Article by Greg Croft, republished in Energy Bulletin, March 20, 2005
http://www.energybulletin.net/4785.html
(b) The empty quarter (from same article quoted above, by Greg Croft
"In 2008 production from the Shaybah Field and the Central Arabian Fields is to be increased by 300,000 barrels per day. The Shaybah Field is located in the Empty Quarter, near the boundary with Abu Dhabi. Because of its remote location, production did not begin until 1998. The initial development was a very intensive, state-of-the-art development with waterflood and numerous horizontal wells. Shaybah produces Arab extra light crude at a rate of up to 590,000 barrels per day. The first oil discovery in Central Arabia did not take place until 1989 and these fields produce from older rocks than the other fields in Saudi Arabia. They produce Arab super light crude, which resembles diesel fuel. Production comes from several smaller fields and the oil is pumped, a procedure that is not needed elsewhere in Saudi Arabia. Although these fields are quite small by Saudi standards, they are relatively new and additional discoveries are likely."
(c) Persian Gulf offshore
Full analysis needed NOW
If we are throwing our towel in on Ghawar (and I am, what about everyone else?) then these areas become of EXTREME IMPORTANCE FAST.
Stuart, you know the rule, right? "Never do something very well that you don't want to have to do again." :-)
In the meantime, the U.S. had better start trying to tell it's people that we need a 10% plus reduction in consumption, FAST.
----------------------------
Comment at Wall Street Journal energy blog:
If you have not gone to the oil drum and taken a look at the post referenced, written by Stuart Staniford, by all means do so.
It is an extremely involved work of research, and indicates a growing consensus amont outsiders (non oil company and Aramco experts) that Ghawar, the largest oilfield in the world is either peaked, or very close to it. If one accepts the view of Stuart and others after VERY involved analysis on their part, we are seeing a drop in production now, and one that will grow to critical levels within 7 to 10 years. Time is running out.
What does this mean for you? We are at the point that we must make plans to begin removing some 10% plus from U.S. crude oil consumption immediately.
The political leadership of the United States is seeking any way possible to avoid having to tell the American people this, but there is simply no other path available.
The biofuels are not ready to fill such a large gap. Hybrids and plug hybrids are still a very small part of the total market. New oil drilling prospects in the deep sea and in new found locations are years away, and the world market will compete hard for that oil.
Right now, we are going to have to resort to the only option that can come online fast, conservation. Summer driving trips must be reduced and shortened, if taken at all. If you have multiple vehicles, park all but the most efficient one, and combine driving trips until we can clearly establish where we are.
Set aside savings and try to reduce debt to the lowest possible level. Have funds to spare for energy costs if possible, and assume that fuel costs are only going up. If they don’t, then you have money.
Right now, until more serious mitagation can be brought online, try to help buy the country all the breathing room possible on fuel and energy.
We need a decrease of consumption of 10%, or approximately 2 million barrels of oil per day in the U.S. NOW. This is no longer a “tree hugger” political issue, it is a matter of national security.
Thank you.
Roger Conner Jr.
Comment by Roger Conner Jr - May 14, 2007 at 7:35 pm
Hello Roger,
Kudos for this posting and bringing the WSJ Energy Blog into TOD's headlight--I will be posting there shortly and hope other TODers will too.
If the WSJ has any balls: they will print SS's keypost on tomorrow's frontpage. Or else a huge glossy pullout section with much more graphics, photos, and other info to help beginners to understand what TOD has been analyzing for so long. But that is delusion on my part.
IMO, what is more likely to happen: Another WSJ/CERA interview with Yergin saying the good times are ahead and if you buy his report$$$: CERA will prove that what TOD is giving away for free is wrong.
Of course we all remember: one Yergin unit = $38/barrel, promised for the enjoyment of all so very long ago.
...and Zimbabwe, Sri Lanka, and Iraq are just like Disneyland. So it goes while the mothers cry as their babies die. Such is Life.
Bob Shaw in Phx,Az Are Humans Smarter than Yeast?
Bob,
I think I spend my Yergin tonight on a nice steak, some baked potatos and a few beers.
How about that?
We are in agreement then that we have consensus between the big players here, Euan, Stuart, Fractional Flow, Westexes, Khebab, and others that Ghawar is peaked? This would leave Robert Rapier abstaining. Anyone else?
Didn't Ghawar peak in 1981? What's really being debated here is whether Ghawar's extended plateau is ending now or a few years from now.
This would leave Robert Rapier abstaining.
I am not abstaining on Ghawar. The Saudis themselves admitted last year that it was 48% depleted. I am abstaining on the subject of whether the country as a whole has entered a permanent, involuntary decline.
Robert,
Sorry to have misspoken and or mis-stated your position.
Then I hope you will endorse what I was asking for, a complete rundown on Khurais, the empty quarter and offshore of the extremely involved type we have seen on Ghawar.
If Ghawar is flat and declining, do you see any other place that the oil needed to level production can come from in Saudi Arabia not in the three catagories listed above?
It is interesting to note that if you take out Ghawar, Saudi Arabia now produces more oil offshore than on. That's a bit of a stereotype breaker, isn't it? :-)
I still hold that for the next 5 years at minimum, everything seems to revolve around Khurais. If it cannot deliver, and deliver big, then KSA drops fast. The offshore and empty quarter can help fill in, but Khurais is now the lynchpin.
If you believe that KSA knows there is a lot of oil there (and we mean a LOT), but that it wasn't worth going after at $30 a barrel, especially when you were still producing all the market could stand from easier fields, then KSA can perhaps hold at least flat or near flat on production.
But, if you believe, as Matthew Simmons says in "Twilight", it is essentially a dud that will never deliver, then it's ohhhshiii###!!! time in Saudi Arabia.
Greg Croft's words in the Energy Bulletin article concerning the empty quarter and the so called "Central Arabian Fields" are enigmatic at least, tantalizing at most:
"Although these fields are quite small by Saudi standards, they are relatively new and additional discoveries are likely."
What exactly is "quite small by Saudi standards". That's like saying flat chested by Dolly Parton standards! :-)
Either way, I am holding to my position of needing to reduce by 10% U.S. oil consumption immediately. 10% is not really that much, and is only a first emergency step. I get 30 miles per gallon with an old outdated Diesel, am looking for a smaller car yet (Diesel Jetta or Golf makes sense as a commuter, still almost more car than I need), and did you see that Toyota is now throwing out incentives in the form of discount options packages on the Prius Hybrid?
Roger Conner Jr.
Remember, we are only one cubic mile from freedom
Re: Greg Croft's words in the Energy Bulletin article concerning the empty quarter and the so called "Central Arabian Fields" are enigmatic at least, tantalizing at most:
"Although these fields are quite small by Saudi standards, they are relatively new and additional discoveries are likely."
If Jean Lahèrrere's Parabolic Fractal Law holds for Saudi Arabia, they have already squeezed the low hanging fruits (the king and the queens), the rest would be increasingly smaller and remote oil fields. Let's not forget also that Rub' al Khali, the Great Sandy Desert, is nothing but a walk in the park:
Yet to be discovered!
BTW, the empty quarter is one of the most beautiful place on Earth, check this National Geographic presentation:
http://magma.nationalgeographic.com/ngm/0502/sights_n_sounds/media2.html
Read Arabian Sands by Thesinger (and everyhting else he wrote) This is a guy who truly went native and is considered the last of the great classical explorers. He was the first European to to do a true transect of the empty quarter on foot (close to 300 miles in 18 days. They had camels but they were mainly for carrying supplies. Most of the time they walked.) He was there in the 30's when the oil guys were first poking around. Dubai was a small port along the lines of Portsmouth,NH. RIyadh and medina were small cities like Lewistion ,ME (sorry i am using examples i know) None of the current geographical borders (Yemen,Oman,SA,Qatar,UAE,Dubai existed). it was just "Arabia" w/ different sheiks and tribes controlling different areas. The politics that was involved in travelling there is mindboggling and makes up a large part of the content. It's frightening to imagine what would be involved in rapidly returning to this level.
mMtt
A random elevation profile from north to south:
Robert, I am curious. Given that Ghawar is admitted to be more than half of KSA's total actual production and given the list of known projects expected to come online in the near future, isn't the critical variable Ghawar's rate of decline? We clearly do not see sufficient production expected to come online to offset a high rate of decline in Ghawar but it might offset (and even grow) production if Ghawar declines very slowly. I just do not see how what we know about ongoing KSA projects can be reconciled against a declining KSA total production unless you assume a decline rate that is extremely low.
Given the above, can you publicly comment on why you continue to abstain on KSA production declining overall? If not, that's ok. My other question would be, lacking any proprietary information that you currently have, and reading the discussions thus far about Ghawar, what would you expect your outlook to be on KSA's total production going forward? In other words, is it your access to proprietary data that preserves your belief that KSA overall is not in decline? If you did not have that proprietary data, would your outlook on KSA be better or worse?
Thanks in advance.
Ghawar Is Dying
The greatest shortcoming of the human race is our inability to understand the exponential function. - Dr. Albert Bartlett
If I thought I could answer that question without opening up a can of worms and inviting many more questions, I might jump in there. But I don't have time at the moment for a debate on this. I have a "to do" list that seems to be growing exponentially.
My reasoning probably warrants a post. After all, I certainly don't intend to get into a situation where I am just stubbornly denying the obvious. I try to objectively look at the facts and come to conclusions. But there are reasons that I don't think Saudi has peaked, and they have nothing to do with propietary data. In fact, I don't have any proprietary data at all on KSA.
Not the answer you were looking for, I know, but one intended to save me a little bit of time on an evening in which I have many more hours of work in front of me.
That's a perfectly fine answer. You did clarify that in the case of KSA you are not relying on proprietary data there so that's helpful. I do look forward to you eventually explaining your position versus that of Stuart when you have the time. I'll continue to keep an eye on your blog too.
Ghawar Is Dying
The greatest shortcoming of the human race is our inability to understand the exponential function. - Dr. Albert Bartlett
Roger - I'm still wary of using the term peak in relation to Ghawar - though I am in agreement that the field is coming down off a long, managed plateau.
Ghawar was never produced at maximum but has been managed at around 5 million bpd for decades. This has allowed the field to continue producing at plateau deep into depletion.
The relevance of this lies in how future production from the other supergiants is modelled. Most production forecasts I have seen for KSA seem to show most fields entering a decline phase now or soon and I wonder to what extent that is justified if fields are maintained on artificial low plateau and are less than 50% depleted. My feeling is that the heavy oil northern fields may chug along at current or higher volumes for a good number of years, and that new developments may plug the gap left by falling production in Ghawar.
I think it is possible that in KSA we do actually see an undulating plateau - but I don't think we'll see 11 million bpd C+C+NGL. There will of course be a major shift away from Arab light produced from Arab D towards heavier oil and NGL.
Just curious:
What would Ghawar's maximum production have been if it HAD been produced at maximum?
And how long would it have taken to extract, say, 99% of the total original reserves if it had been produced at maximum from day 1, in 1948 or whatever?
I believe that Euan has previously stated that Ghawar could have produced a theoretical maximum of 15mbpd by itself, not counting the rest of KSA. Doing so would have depleted it at least three times faster than it has though. If I have incorrectly recalled Euan's comments perhaps he can provide the correct number.
Ghawar Is Dying
The greatest shortcoming of the human race is our inability to understand the exponential function. - Dr. Albert Bartlett
I passed this one over to Khebab with this question:
and Khebab's reply:
If you do a by hand integration you have about 5 1/2 real squares vs 5 for the Logistic high indicating the Ghawar is effectively empty. These leads precedence to what I call a production crash with a 15-30% annual decline rate. If you believe the URR estimates. Whats cool is it looks like to get back on the HL curve requires production drop to 7.5 mbpd this year which is inline with estimates. But it looks like the drop is steeper as I said before it it will plummet to around 4 mbpd or less within 2-3 years not something I think others are predicting. This is of course driven primarly by the fact that Ghawar is effectively empty and everything seems to add up.
Thanks very much to Khebab, Euan, and Grey Zone.
It is quite important to remember that far from being bad guys, the oil companies (both American previously and Saudi Aramco since) carefully managed Ghawar in order to get the most out of it. We are seeing extraordinary recovery rates from northern Ghawar and the entire picture appears to be one of incredible petroleum engineering.
Ghawar could have been managed far worse than it has been. Thankfully those engineers, geologists, and hard hat workers have literally worked their rear ends off making Ghawar go as far as it has. That era though is now drawing to a close and a new era is about to dawn for the Kingdom of Saudi Arabia. And I fear that the new era may have other wildcards (non-petroleum wildcards) that come to the fore when the greater KSA population realizes that their particular party may be starting to wind down. It's not over yet but just the realization that it will be over eventually may bring serious political forces into play shortly.
Ghawar Is Dying
The greatest shortcoming of the human race is our inability to understand the exponential function. - Dr. Albert Bartlett
I agree with this. The 79 Senate report paints a picture of the US companies aggressively selling the Saudi's that there was lots of oil and they should produce it faster, and the oil ministry pushing back that they wanted it to last a long time. Eg (non-Saudi) Aramco wanted to produce via in-field injection, and the oil ministry wouldn't sanction it - they wanted to stick to the more leisurely peripheral waterflood as they viewed it as maximizing ultimate recovery. The US companies ended up pushing the field below the bubble point for a while (ie pulling oil out faster than it could be replenished by oil moving through the rock, causing the pressure to drop too low), which doesn't seem to have been an issue for a long time now. (In fairness, this was perhaps as much a matter of coming to understand how the field worked as anything).
I guess authoritarian kingdoms may actually be better at taking a long term view sometimes, since the ruler knows his own children will inherit the place if he looks after it, whereas in a democracy, the President has no such guarantee (Bush dynasty notwithstanding). So we've used up most of our oil, whereas they've produced theirs at significantly below the maximum rate, and now they still have some to sell us (albeit maybe not quite as much as they've been promising, and much less than our energy agencies have been fantasizing).
In the meantime, the U.S. had better start trying to tell it's people that we need a 10% plus reduction in consumption, FAST.
When I pulled up at the 76 pump in Vancouver, WA today and paid $3.67 per gallon (my first over-50-dollar fill-up ever) I got the message loud and clear. Tonight I will finish the overhaul of my commuter bicycle, and go back to commuting a nearly oil-free 26 miles a day.
I apply a rough statistical analysis to the steps of analysis.
If A > B > C > D > E then the overall probability is multiplying the probabilities of A*B*C*D*E
One of the strengths of the approach in this article is the parallel approach to each region. If, for example, a critical step in the analysis for Shedgum is wrong due to misinterpreted data, this does not necessarily affect the other areas and should not moderate our alarm.
And I am still searching for a critical step that has a high probability (say 30%) of error.
I do question how good our data is on Ghawar production since 2004. Oil types sold by KSA to not seem to have radically changed (earlier Aramco cutbacks were for non North Ghawar oil) in the last few years. Can anyone with more detailed knowledge on Aramco sales comment ?
Stuart, this series is the best analysis I have ever seen on ANY subject in my life !!
Alan
Congratulations to you and Euan for your amazing work!!! I will read it more detail later.
Due partly to your incredible work on Ghawar, my confidence levels in my production forecasts for both Saudi Arabia and the world have increased.
Updated Saudi Arabia and World Forecasts
The chart below shows forecast production from Saudi Arabia to Dec 2020. The chart shows that Saudi Arabia has passed peak production in mid 2005.
Fig 1 – Saudi Arabia Forecast to Dec 2020 -Click to enlarge
Saudi Arabia’s forecast crude oil and lease condensate (C&C) production is assumed to occur under responsible reservoir production. This requires that the depletion rate of remaining reserves is not allowed to exceed 5.5%/year. Future production from Aramco’s announced megaprojects will not be sufficient to stop the decline.
The depletion rates of remaining reserves from different countries vary greatly. For example, North Sea is about 11%/yr and Nigeria about 3%/yr. The Fig 2 world forecast assumes that the production, from each country’s remaining reserves, continues at a depletion rate which is appropriate to that country’s remaining reserves.
Peak C&C remains at May 2005, 74.15 Mb/d. The decline rate is -0.9%/yr to May 2009. Due partly to the maximum depletion rate constraint, the decline rate changes to a steeper -2.6%/yr from May 2009 to Dec 2012. This steeper decline rate is due mainly to forecast falling production in Saudi Arabia, Russia, North Sea, China, USA and Mexico.
Fig 2 – World C&C Forecast to Dec 2012 -Click to enlarge
Fig 3 forecasts world total liquids production at 85 – 86 MB/D on a peak plateau from 2006 to 2009. If Saudi Arabia, the only country with “claimed” surplus capacity, cannot fill the demand supply gap later this year, then oil prices will increase sharply.
Technology, include horizontal/MRC wells, has helped to maintain production rates at a high levels. Unfortunately, this has been achieved at the expense of higher depletion rates of remaining reserves. These high depletion rates have caused peak total liquids to be in the form of a plateau. It is likely that the drop in production rates could be sudden at the edge of this peak plateau.
This peak plateau is later than the May 2005 peak C&C due to offsetting production increases from natural gas liquids (NGLs) and biofuels. If the United Nations Biofuel report limits further ethanol production increases, then the end of the total liquids peak plateau could occur next year, 2008. The total liquids peak plateau is not directly affected by solar, wind and nuclear energy sources which produce mainly electricity, not liquids.
Fig 3 – World Total Liquids Forecast to Dec 2012 -Click to enlarge (photo is Mount Conner (Atila), a 700 million year old table top mountain in the Australian outback)
Correcting ethanol's reduced btu content, or useful work, means peak liquids occured about the same time as peak c+c. This is a real effect, either reducing the available gasoline mix available, or expressed as increased gasoline volume demand, of around 400kb/d... even when a portion of this increased demand occurs overseas, less gasoline is available for import to the us.
Hmmm. I'm not sure the assumptions behind that KSA production forecast make sense. I think operators generally strive to maintain production at or close to the facility capacity, until they can't, when production declines rapidly. In KSA, plateau's have been long - the resource was not developed as rapidly as it could have been, but rather somewhat conservatively. But there's every sign of them doing whatever they can to maintain plateau, so I don't think we are going to see a slow gradual decline like you show. Also, your megaprojects are not big enough. Khurais is a 1.2mbd step up, for example.
Hi Stuart,
You should receive an honorary petroleum engineering degree for your thorough work!
Khurais is assumed to be an optimistic 1.1 mbd because that is the number used in Robelius' list. I was going to use 0.8 mbd as Matt Simmons stated that "The Khurais complex is still being touted in 2005...that Khurais could produce 800,000 barrels of oil a day for decades. Occasionally, reports of production of 1.2 million barrels per day have been mentioned by unnamed sources" source:"Twilight in the Desert" page 214. It's amazing that Aramco announced Nuayyim (0.1 mbd) which is an insignificant project which will make no difference to total production. However, Aramco has to announce even small projects as that's all they have left!
Given your estimates of Ghawar reserves (geological), I estimate that total economic recoverable reserves (C&C) for Saudi Arabia are 175 Gb. Do you agree?
I have also estimated that the total Aramco C&C reserve depletion at 64% which is equivalent to Aramco producing 112 Gb to May 2007. This leaves remaining URR of 63 Gb. Do you agree? (estimated from Saleri's Feb 2004 presentation)
Recent EIA data in show actual production of 8.6 mbd C&C. This represents an annual depletion rate of remaining reserves of 5%/yr. ((8.6*365/1000)/63 Gb)) I have assumed that Aramco will produce at less than an optimistic 5.5% annual depletion rate of remaining reserves. If they produce at only 5%/yr then the production rate declines faster. This would make my assumptions too optimistic.
The general shape of the decline curve will probably be more jagged than my chart but it should still broadly follow the red exponential decline curve in the chart. Please note that I do not include NGLs in the forecast.
Aramco's remaining megaprojects are simply too small to offset accelerating production decline rates from their really old tired fields of Ghawar, Abqaiq, Berri, Zuluf, Marjan and Safaniya. Even projects with capacities less than 0.30 mbd such as Shaybah exp Ph 1 or Al Khafji (Neutral Zone) don't make a significant difference when Aramco's total production rate of 8.6 mbd is in fast decline.
In addition to their announced megaprojects, Aramco needs to announce at least two more megaprojects of 1.5 mbd each to maintain production levels. Unfortunately, I don't think this will happen.
I think that Aramco's surplus capacity might be 0.5 mbd at the most and some of this capacity might be 2008 future capacity relating to Shaybah exp Ph 1 and AFK.
Aramco's recently released 2006 Annual Review gives lots of "above ground" future excuses for their future oil production decline
http://www.saudiaramco.com/irj/portal/anonymous
I haven't developed an opinion on the whole country remaining reserves. Well, I don't consider the addition of the 200gb to the existing 260gb of proved reserves to be very likely :-).
Do you have a basis for the view that Safaniya is tired? Baqi/Saleri say it's only 28% depleted...
Hi Stuart,
Baqi/Saleri say, in their CSIS Feb 2004 report, that Safaniya’s reserves are 26% depleted. Jaffe/Elass Mar 2007 report says that Safaniya’s reserves are 60 Gb and neutral zone is 5 Gb. As Safaniya often includes the Neutral Zone, the Jaffe/Elass Safaniya reserves are estimated at 55 Gb (60-5). The IHS data extract from the reference at the end of this post says 55 Gb (41.2+13.8) total reserves. That means that Safaniya has produced about 14.3 Gb (26% of 55 Gb) up to the year ended Dec 2003.
The 1975 Rand Table A.59 gives Safaniya’s reserves as a range from 18 Gb to 25 Gb. Matt Simmons “Twilight in the Desert” p 372 gives Safaniya’s reserves as 25 Gb in 1973 but only 14.5 Gb in 1977. Based on optimistic total reserves of 25 Gb and Safaniya’s estimated cumulative production to Mar 2007 of 15.5 Gb (14.3+1.2), the reserve depletion would be 62% (15.5/25).
Safaniya’s production is mostly heavy crude which is difficult to move and extract. If the true reserve depletion of Safaniya is closer to 62% then Safaniya is getting tired. Safaniya’s production capacity is about 0.9 mbd as shown below. On a positive note, if Safaniya does have 9.5 Gb remaining reserves, the 0.9 mbd rate could be sustained for many years to come.
The story below analyses further Saudi Arabia’s production status in relation to the medium and heavy crude fields of Zuluf, Marjan and Safiniya.
Evidence of the End of Saudi Arabia’s “Swing Producer” Status: Decreasing Medium and Heavy Crude Production from Zuluf, Marjan and Safaniya
The chart below shows the cumulative production of Zuluf, Marjan and Safaniya (ZMS) in the context of all Saudi Arabia fields. Note the large cumulative production of Safaniya of 14.3 Gb. This year, production from Ghawar and Abqaiq should continue to decline as Abqaiq is over 75% depleted and Ghawar is over 60% depleted. Consequently, to help offset the production decline, the focus turns to producing the less desirable medium and heavy ZMS crudes.
The references used to estimate these cumulative productions are from Baqi/Saleri CSIS Feb 2004, Jaffe/Elass Mar 2007, Matt Simmons, Rand 1975 and the IHS excerpt at the end of this post.
Other cumulative production of 5 Gb includes Khursaniyah, 1.0 Gb; Abu Hadriyah, 0.5 Gb; Dammam, 0.6 Gb; Khurais, 0.2 Gb; Harmaliyah, 0.2 Gb; Manifa, 0.3 Gb; and Fadhili, 0.3 Gb.
Fig 1 – Saudi Aramco Cumulative Production to Dec 2003 - Click to enlarge
The figure below shows Aramco’s estimated current capacity split by field and grade. Aramco supplies mostly light crude. Most refineries are configured to more easily accept the light grades rather than medium or heavy.
The total capacity is estimated at 8.8 million barrels/day (Mb/d). The light crudes are mainly from onshore fields and the medium/heavy crudes from offshore fields. Total Ghawar 2007 capacity is 4.3 Mb/d including 0.3 Mb/d from Haradh III.
Fig 2 – Saudi Aramco Capacity by Field and Grade, 2007 - Click to enlarge
The last chart shows Saudi Arabia’s total production rate, in the upper third of the figure, and the Saudi medium and heavy spot prices as percentage of the Saudi light spot price, in the lower part of the figure. The vertical shaded columns indicate time periods when the relative price of Saudi medium and heavy oil dropped. It is assumed that these relative price drops occurred because Aramco was supplying more medium/heavy crude oil, primarily from Zuluf, Marjan and Safaniya (ZMS).
In the Mar 2003 Iraq invasion, Aramco produced an extra 1 Mb/d, assumed to be from ZMS. To take advantage of strong oil prices in 2004Q4/2005Q1, there was a significant draw on medium/heavy ZMS oil as shown by Saudi heavy crude prices trading as low as 80% of Saudi light. The new capacity from Qatif/Abu Safah helped total production to reach a peak of 9.6 Mb/d during the devastating USA 2005 hurricane season.
In 2006Q1, during high oil prices, Aramco failed to continue high total oil production because oil production from ZMS could not be increased as it was in 2005Q4. Consequently, total oil production decreased due to ZMS oil production staying constant and light crude production resuming a natural decline rate. When oil prices dropped in late 2006, Aramco cut ZMS oil production, some of which was voluntary. This is indicated by the Saudi heavy price rising to 95% of Saudi light.
The price differential, between Saudi light and heavy crudes, has shown a strong decreasing trend from Jan 2005 to May 2007. This indicates that there is very little surplus capacity from the ZMS fields, which in turn indicates that Saudi Aramco has decreased surplus capacity.
Fig 3 – Saudi Aramco Price Differences and Production - Click to enlarge
Conclusion
Saudi Arabia’s current capacity is about 8.8 Mb/d and their actual production in Feb 2007 was 8.6 Mb/d (EIA). This means that their current surplus capacity is well under 0.5 Mb/d, due significantly to the reduction of their surplus heavy/medium crude capacity from Zuluf, Marjan and Safaniya. Oil demand will continue to increase and some supply disruptions will probably occur this year. It is unlikely that Saudi Aramco will be able to significantly increase its production to meet the supply demand gap which could easily exceed 2 million barrels/day in late 2007.
Text from IHS Data Extract
I don’t have the IHS latest report on Saudi Arabia so the information below cannot be verified, but the extract appears legitimate. I have not contacted the author.
This is a newer post by the same author about OPEC status
http://www.investorvillage.com/smbd.asp?mb=2234&mn=56151&pt=msg&mid=2070770
This is the IHS post
http://www.investorvillage.com/smbd.asp?mb=2234&mn=55981&pt=msg&mid=2058548
Ace - I've been working on doing the same job on Abqaiq as we have just done on Ghawar. Provisional findings:
Initial reserves: 15 to 18 billion
Produced: 13.4 to 15.5 billion
Depletion: 88 to 90%
So I quite like your number of 13 billion produced for Abqaiq - how did you arrive at it.
Jaffe and Elass say this:
Its quite clear they are talking about initial reserves here - though I'm not sure that they realise this.
Do you have a feel for how reliable these numbers might be as 2P initial recoverable reserves? Abqaiq looks OK to me - but what about the others? Also, this field Manifa with 11 billion bbls - has never been produced? Do you have any data on that?
A few points of interest from the '79 Senate report. At that time, Ghawar, Abqaiq, Berri, and Safaniya were assigned 61% of probable reserves between them. We now have a decent understanding of Ghawar and Abqaiq, which are both in trouble to various degrees. Berri looks to have a good bit of oil left based on a quick scan of the papers Phil Hart found. Safaniya I don't have a handle on yet.
Both Berri and Safaniya were projected to begin decline by now - Berri in 1989, and Safaniya by 1994 (ie at the same point as Safaniya). This was on assumption of declines setting in at R/P of 15-20. Ghawar was projected to decline in 1993.
I'm definitely wondering whether there's a possibility of declines in some subset of Zuluf/Marjan/Safaniya being part of the picture as well.
"For the eight year period 1970 to 1977, the amount of new oil discoveries which eventually will be classified "proven" reserves is not expected to equal the cumulative production for that period."
"The prognosis for future discoveries in Saudi Arabia is uncertain. Shareholder companies do not believe vast amounts of oil remain to be discovered in Saudi Arabia. One company believes that there is an undiscovered reserve potential of 33 billion barrels in the whole of Saudi Arabia. For the five-year period ending in 1980, the shareholder companies believe they will be fortunate to obtain an additional 5 billion barrels of "proven" reserves from discoveries of new oil fields."
This for me is the most significant part of the IHS release - which I agree with 100%. Remember the story from the gas isotopes?
This also has bearing on exploration potential. Its almost like you have a 2D exploration framework defined by the Arab D anhydrite - and once all the bumps on that have been drilled thats your lot. There are of course other plays - Cretaceous limestones and sandstones - but its the Arab D that is King in KSA.
My concern with Berri is that while the depletion level may not be as bad, the high permeability zone looks to be well swept. What's left could produce much slower, which perhaps puts Berri in the list of vulnerable fields, even though it may maintain a lower level for much longer.
cheers
Phil.
Stuart, I think that Fig 3 above, which shows the price difference between heavy and light crudes decreasing since Jan 2005, gives strong indirect evidence of heavy/medium crude production declines at Zuluf/Marjan/Safaniya. These fields may have sizeable reserves left but if the oil is heavy and the reservoir has poor flow characteristics, then the oil can only be produced at low rates which decreases Aramco's surplus capacity. (eg Canada tar sands - lots of marginal economic reserves but very slow to produce - due to water and gas input constraints, tar sands max production might only be 2 million barrels/day)
Hi Euan,
Abqaiq - Depletion rate of 73% from Baqi/Saleri CSIS 2004 and the IHS total reserve number of 18 Gb (13+5), instead of Jaffe/Elass 17 Gb. Cum prod = 13.1 Gb (0.73*18) to Dec 2003.
I don't have a feel for the Jaffe/Elaas initial total reserves numbers for Abqaiq, Shaybah, Berri, Manifa, Zuluf and Abu Safah. Abqaiq might be OK. Generally, I think that the reserves have been artificially inflated over time. For example, Berri had total reserves of about 6 Gb in 1975 - now it's 11 Gb, but it's only produced 3.1 Gb to Dec 2003. Remaining reserves for most of Saudi's fields to be produced probably consist of low ERoEI reserves which can be produced at low rates for many years.
Manifa is interesting. Rand 1975 states cumulative production to Dec 1975 as 0.13 Gb. IHS data above state that Manifa has produced 0.3 Gb to Dec 2003. I have included the 0.3 Gb number in the "other" category of Fig 1 above. Rand 1975 gives a huge range of Manifa's reserves from 1Gb-11Gb! Since Manifa was discovered in 1957, it has only produced 0.3 Gb out of 11 Gb. Now, Aramco expects to produce 900,000 barrels/day of less desirable Arab heavy crude by 2011! In addition to heavy oil, associated sour gas will need to be processed. These are good reasons for scheduling Manifa as the last megaproject.
http://www.allbusiness.com/services/business-services/3979694-1.html
Ace - another couple of questions / points. I think Abqaiq is probably semi-retired. OK to include this as reserve capacity, but I doubt they would want to produce this at 400,000 bpd for too long. Also, Jaffe and Elass list Khursaniyah as a new project coming on 2007 at 500,000 bpd - have you included that? Any news? And why have you cut the capacity of Safaniyah from 1.2 million bpd produced in 2004 to a capacity of 900,000 bpd in 2007?
Seeing this fills me with confidence that the Saudis will be able to boost production of C+C+NGL to between 10 and 11 million bpd if needs be:-)
Lastly, you have Haradh listed separately from Ghawar at 300,000 bpd ???
How do you get between 10 and 11 mbpd, Euan? If we look at what is happening right now, it appears that KSA will drop to about 7.5 mbpd by the end of this year and as ace mentioned above, their space capacity looks to be about 200,000 barrels per day. That would imply a max capacity of 7.7 mbpd. You mention 3 projects that have a maximum optimistic rate of 2.1 mbpd. That appears (to me) to add up to 9.8 mbpd at the very most optimistic hopeful Santa Claus best. And mind you, that is only for a brief time (less than a year) as continued decline in Ghawar eats away at those additions too. And this says nothing about potential declines in other fields, which are now starting to look possible too.
So I guess I am missing something here. Would you mind summarizing how you see 10-11 mbpd? And could you explain if that is just a short burst or a figure you expect to be maintained for years?
Ghawar Is Dying
The greatest shortcoming of the human race is our inability to understand the exponential function. - Dr. Albert Bartlett
Ace has a forecast capacity of 8.8 million bpd for 2007 which includes a 700,000+ bpd decline in Ghawar.
I think he may be low on Safaniyah, too agressive on Ghawar decline, has not included Khursaniyah (?) but is optimistic on Abqaiq.
If we take Ace's 8.8 and add the 1.9 million bpd NGL production we get 10.7 million bpd capacity (C+C+NGL) - correct me if I'm wrong about the size of NGL production and where this fits in the overall picture - cos this is something else I need to look more closely at (if I'm wrong about the NGL then all bets are off).
My base case production model saw Ghawar losing 3 million bpd between now and 2015. As I see things, new projects may compensate for most of this loss.
What I don't know is what is going on in other giant fields. Abqaiq I believe is semi-retired. If there is significant decline in other fields then this clearly colours the future (and the present) and I need some time to look into these other fields to get a feel for likely direction over the next 5 years.
Ok, I see my error. Now I wonder where I got that 7.5 figure? I'll have to go dig. Thanks. But also, isn't that 8.8 mbpd capacity right now with continued declines through the rest of the year? I'm not sure how that ends up as average capacity for the year or capacity at the end of the year going into 2008 either. I could see IF they brought all these fields online today THEN they would have 10.7 but those fields are not projected online for a bit and there is going to be further declines along the way. Also, as ace suggests, Ghawar may not be the only field in decline so what does that do to the decline rate overall? Let me say I certainly hope you are right, Euan, because the picture looks a bit worse than that to me.
Man, it's amazing how much we are focusing on rate of decline these days rather than date of peak. I guess that is a telling little indicator of its own.
Ghawar Is Dying
The greatest shortcoming of the human race is our inability to understand the exponential function. - Dr. Albert Bartlett
February EIA data has Saudi NGLs at 1.51 million bpd.
Khursaniya adds another 0.25 in the last quarter, if it arrives on time.
Euan, the Jaffe/Elass Mar 2007 pie chart does not show Abqaiq as producing any oil (maybe it's included in Ghawar's production number of 5.5 mbd?) My own view of Abqaiq is that it has about 2 Gb of good quality easily producible reserves left as of May 2007. Applying an annual depletion rate of 5.5% gives a long term sustainable daily production limit of about 300,000 bpd. 400,000 bpd is possible for a short period but not for a long period.
Jaffe/Elass do list Khursaniyah coming online late 2007 with 0.5 mbd. This capacity is not included in 2007 as I think this capacity will be available as actual production in early 2008. (I think Phil Hart agrees).
I doubt that Khursaniyah's actual production will stay at 0.5 mbd for very long. The Khursaniyah (AFK) project consists of developing not only Khursaniyah but also the smaller fields of Abu Hadriyah and Fadhili. IHS and Rand 1975 show total reserves for Khursaniyah of about 4 Gb. IHS states cumulative production to Dec 2003 of 1 Gb. This gives remaining reserves of 3 Gb. Abu Hadriyah might have 0.5 Gb remaining (1 Gb initial(Rand 1975) less 0.5 Gb cum prod (Rand 1975 and Matt Simmons)). Similarly, Fadhili might have 0.5 Gb reserves left. Total AFK remaining reserves are 4 Gb(3+.5+.5). 500,000 bpd is equivalent to 4.6% (.5/1000*365/4) annual depletion rate of remaining reserves at the start of production! That means that AFK production would decline below the 500,000 bpd plateau in just over 3 years.
Jaffe/Elass showed Safaniya with 1.2 mbd in 2004 - I think that this might be overoptimistic capacity. Matt Simmons, p 191, Twilight...Desert 2005 states that Safaniya capacity is 500,000 bpd. I used a rounded up average of 900,000 bpd as 2007 capacity.
Saudi's production of NGL is positive as NGL production is increasing and not subject to OPEC quotas.
Haradh III was listed separately because it was a recent project and also was identified in Fig 3.
Ace - Jaffe and Elass say that Safaniyah produced at 1.2 million bpd in 2004. So if that production didn't come from Safaniyah you need to ramp up the production somewhere else.
Also, just a note on Saudi crude oil grades:
Heavy (Safaniyah) has api gravity of 27 deg.
Light (Ghawar) 34 degrees
Extra light (Abqaiq) 37 deg
Super light (Hawtah trend) 45-50 deg
The main point is that the heavy Safaniyah oil is not actually that heavy. Oil currently produced by BP from W of UK reservoirs is heavier (Foinaven / Schiehallion) and it is still pretty runny oil - consistency of engne oil versus gasoline. Given reasonable reservoir quality there will be no problem producing this - though recovery factors will be lower.
http://www.eia.doe.gov/emeu/cabs/saudi.html
http://www.allbusiness.com/technology/computer-software/816535-1.html
Ok, hypothesis:
KSA seeks to remain the "swing producer" in the world. To do this they must have spare capacity. It appears that they believe they need at least 2 mbpd of spare capacity and more is better up to some point.
Could we be seeing voluntary declines from KSA in anticipation of Northern Ghawar going down? They would be doing this to ensure that they retain spare capacity? In a sense the declines are voluntary but they are being driven by involuntary factors. In other words, they either reduce production now so that they can increase spare capacity or they reduce production later due to declines and have no spare capacity at all.
Is the value of being the "swing producer" that large that KSA would act in this manner?
Ghawar Is Dying
The greatest shortcoming of the human race is our inability to understand the exponential function. - Dr. Albert Bartlett
Unfortunately I don't have all the links handy but in reading various reports on KSA's spare capacity you see 2mbpd for 60-90 days as a common motif. This is information is in various statements from both the US and KSA. So they have publicly stated that the swing production from KSA has for some reason a time limit on production.
Here is the best link.
http://www.theoildrum.com/node/2429/178505
You should find this alarming. It means that at some point KSA announced a time limit on spare capacity. Now this may be stored oil and wells that have to be rested for some reason. The important point is it does not represent real production that can be sustained. They are known to have about 30 million plus barrels of storage capacity so assuming the storage tanks are full at the start of a surge period a so about 15 days of the surge can be met from storage alone. We have to assume that as the fields have decline KSA as expanded internal storage capacity since this can be done at a large number of sites its almost impossible to know for sure how much they have today and even its exact location. But you can see that a combination of storage and straining the system can readily allow KSA to deliver 2mbpd of oil for a 30-90 day window. Next of course to fill the storage tanks before the start of a surge you need x amount of real production directed to storage for n days this would be available during a surge period. And obviously the surge can be ramped up over a number of days so the peak rate is only held for a smaller part of the overall KSA surge period. In addition a shell game with Tankers can be used to
cause reporting of shipments to happen within a given month.
And of course they could short the local markets and any oil going into their own refineries to meet targeted demand.
You can envision a number of rob Peter to pay Paul tricks.
They are already doing this with Asia.
This is why I don't agree with people that believe some sort of short surge in oil delivery from KSA for less than 90 days is representative of their real production capacity. It would need to go for a extended time period closer to 180 days before I'd believe it was "real" production. So using what seems to be the current definition of KSA spare production we see that at most they are on the hook to produce 2mbpd for 90 days or 180mb of oil some how to exactly meet what they have claimed. The US SPR is authorized to 1billion barrels for example. And they are working with china to create a 30 mb reserve.
The end result is that 180 mbd or less for about 90 days is doable without a significant amount of sustainable or real production capacity off line my best guess is they need to maintain 200kbd-500kbd of real spare production to create this sort of fake surge and they need about the same in temporary strained production plus the storage etc. Also of course they are continuing to lower the base rate that would be used to measure the increase. Whats important is that they try and actually do a surge this summer and we pay close attention to the shape of the curve to see if it contains any indication of the nature of the spare capacity.
The biggest signal would be that in the past when they increased production it went strait up if this does not happen this summer its a telling signal. I expect them to step it up in 200kbd increments on a weekly basis this would be a new approach to "surging". And it enhances the political effect of the surge over real oil shipments.
And I expect that their announcement will be that they gave it the old college try to surge production to contain prices and it failed so they will back down to "sustainable" levels at the new prices that world demand has set. So they are going to try and help cool prices then give up in defeat and accept the fact they are going to make a lot more money.
At that point they will be pressuring consumer countries to practice conservation since it takes time to bring new production online to meet demand. Expect a lot more statements out of KSA insinuating that the consuming countries are "wasting" precious oil and causing high prices. So the shell game will continue for some time.
This is pretty much how I see it. It is clearly not plane sailing for them to produce 11, 12 or 13 million bpd (C+C+NGL) but I still think they will manage 10 to 11 million bpd if called upon to do so for a short period. The comments made by Memmel regarding storage etc also make some sense. If they have been filling storage in recent months - how do you reconcile that with falling production?
Hi Euan,
Safaniya's actual production in 2004 was probably much less than its stated capacity of 1.2 mbd.
The Jaffe/Elass chart, shown below, is titled “2004 Saudi Oil Field Production”, but the word “Capacity” is missing. Qatif and Abu Safah didn’t start producing until very late 2004. The sum of all the production capacity numbers from the chart equals 10.35 mbd. Aramco’s 2006 press kit gives 2004 actual oil production of 8.63 mbd, which is 1.72 mbd less than 10.35 mbd. http://www.saudiaramco.com/irj/go/km/docs/SaudiAramcoPublic/ExternalFile...
For the chart to show actual oil production, the following estimated changes can be made:
1 Qatif and Abu Safah total 0.8 mbd reduced to 0.0 as production started probably in Dec 2004.
2 Ghawar down 0.5 mbd to 5.0 mbd.
3 Safaniya down 0.3 mbd to 0.9 mbd.
4 Zuluf down 0.1 mbd to 0.7 mbd.
5 Marjan down 0.05 mbd to 0.4 mbd.
The sum of these downward adjustments equals 1.75 mbd, which is close to 1.72 mbd figure from above.
(I still wonder why Abqaiq is not shown in the chart. Is it included in Ghawar or was it being redeveloped with smart wells in 2004? Aramco's 2006 Press Kit says "the company completed 24 smart well installations in 2005 (versus two the year before), and 55 maximum reservoir contact (MRC) wells, more than double the year before."
http://www.iran-daily.com/1385/2566/html/energy.htm
Mohammed Al-Qahtani, manager, production and facility development department, Aramco said in May 2006 that "Abqaiq field still produces 400,000 bpd and the water cut is only 40 per cent. We’ve been able to recover so far 50 percent of oil initially in place and we estimate in excess of 70 percent of recovery of oil initially in place with water flooding and without enhanced oil recovery, and with the help of enhanced oil recovery and other technologies in the future we will be able to increase this to up to 80 percent and maybe more." Article also says that Aramco has been using advanced and smart well technology at Abqaiq.
It seems that Abqaiq is producing its last difficult to extract oil.)
Click to enlarge
In addition to Safaniya’s crude being heavy, it has an undesirable very high sulphur content of almost 3%.
http://www.hpiconsultants.com/crude_assay/viewlist.htm
This chart shows refinery outputs for different types of crude inputs. Refinery output using Safaniya crude can be represented by the vertical column labelled API 27. The yield of gasoline is significantly less than the yield for Arab light. However, the increased distillate yield for API 27 compensates for the gasoline loss. Unfortunately, almost all of Safaniya’s 3% of sulphur must be removed, at high cost, to meet USA and Europe’s new standards for ultra low sulphur diesel at 0.0015% (15 parts per million, down from 500 ppm). http://www.eia.doe.gov/oiaf/servicerpt/ulsd/
The above explains why Matt Simmons, “Twilight in the Desert” page 191 says “most refineries cannot process Safaniya’s heavy oil, thereby limiting demand for it in the marketplace to around 600,000 barrels per day”.
source: http://infocarburant.rncan.gc.ca/reports/2005-07/overview/crude_slate_e.cfm Click to enlarge
Ace - good points. I'd already added up the Jaffe and Elass production figures - but it didn't dawn that they were too high to reconcile with published production data. The IEA, C+C for 2004 was 8.74 mmbpd and BP 10.59 mmbod for C+C+NGL. So the J+E total of 10.35 mmbpd (C+C) is clearly too high. This J&E paper is really beginning to bug me. They clearly have little clue what they are talking about when it comes to production data - I'm planning to put the boot in, in my piece on Abqaiq.
Abqaiq I believe is semi-retired. I have 1.4 to 2.1 billion remaining in 2002 - and some of that is in thin layers on the ridge axes. You got to be careful about selecting some news releases and not others. No doubt Abqaiq could produce 400,000 bpd at 40% water cut - but my feeling on this one is that this currently forms part of their reserve capacity.
The points you make about S content on Safaniyah are of course valid. But this brings us back to a marketability rather than production constraint. Total are building a 400,000 bpd heavy crude refinery in KSA - and I will have that as 400,000 bpd new capacity on my forecast when I get around to making one.
One thing I'd find really useful is a big Table detailing all the first hand reserves and production data for all the fields - I started to make one.
Euan
Ace, nice graphics! I think the Demand Curve in Fig 3. needs to be ammended though. At those prices we will start to see demand destruction in NET importing countries, in fact we are seeing it already.
-So if the supply curve turns out to be true then as the price rises developing importer nations will be less and less able to buy the oil they need long before richer Nations.
This will have the effect to lower the Demand curve towards towards the horizontal more.
Will you maintain these graphs so we can see how accurate they prove in the coming years? Even if they prove incorrect it could provide useful information.
Regards, Nick.
You don't need to amend the demand curve as it is forecast in BAU model.
In the case of supply shortfall, demand always moves to meet supply and increases price to demand destroy.
Going forward in a supply shortfall situation, demand will equal supply...even as supply falls.
Ace, how do these curves look if you update SA for faster depletion of North Gahwar to a sustainable 5.5 mb/d about 2010, and recognize that Cantarell's decline in 2006 was much faster than hed been forecast, about 20% vs 12% if memory serves?
There may be enough new projects in the pipeline to support a low world decline rate through 2009/10, but beyond that I am much less optimistic than you are. Murray
Can you include crude grade in your estimate? Heavy Crudes require more energy and more time to refine. A lot of the newer projects are to develop fields that contain heavy and sour crudes. IIRC Light sweet crude peaked in late 2002 or 2003. Some of the bottlenecks in refinery has to be caused by the decreasing quality of crude available. This is will only become more amplified in the future as more light production replaced with heavy sour.
Geopolitical issues will likely eskew any production forcast. Such as efforts to nationalize, restricting production to extend future production output, or political instablities (eg Nigeria, Angola, Iraq, etc). I don't believe the world will continue to produce flat out for too many more years.
Perhaps you can include curves with several likely geopolitical events that would shape future production. For instance what would happen if the US pulled out of Iraq in June 2009 (Assuming the next president orders a pullout) and production in Iraq stops because the country falls into anarchy and a prolonged civil war. Consider the scenerio is that the US attacks Iran in Feb-March 2008 and Iranian production declines by 80%. Consider the scenero that Russia ends exports in 2009 (as they had publically discused last year).
Finally I think your price estimates are way off (no offense or cheap shot intended!). As the price rises, demand will fall as people begin to cut consumption and the global economy falls into recession. I don't believe prices above $80 bbl are sustainable. It looks like prices above $70 where probably not sustainable since the price of oil fell into the $60's back last fall.
Perhaps we would see spikes up into the $140-$175 bbl range (aka US attacks Iran). The higher the spike, the higher demand destruction it would cause. Businesses dependant on fuel will simply close their doors. When business goes under, it stops consumption and its laid off workers consume less (at least until the find another job, which may be months or years depending on the state of the economy).
Only in the liminal space between what we've known all our lives, and something coming that we don't understand, but intuitively want to be prepared for and learn more about, would an individual spend 300 hours of unpaid time, to post a free manuscript of natural resource forensic work on the internet to be shared by others of his species, in hopes of beating the (oil) drum that society has a big problem. I'm guessing for Stuart (as is true for me) the detective work in itself is part of the reward, but from the beginning, Stuart Staniford has been challenging the mainstream paradigm of long turn around time peer reviews on scientific papers and pay-to-view analysis by consultants.
One hopes that this collective effort on TOD, in which Stuart has been the lead writer, enables humanity to discard outdated rules and roles and take intellectual shortcuts that will accomplish what needs to be done. I dont know who or how many people will read this post. But I imagine that more than a few oil and policy people might be 1% or 2% or 40% closer to understanding and thereby accelerating the pace of needed mitigation.
Theoildrum exists for pieces like this. Technology and human tribal altruism circa 2007 were the raw materials - the rest has been organic. It is yet to be seen how this grassroots information and discussion source will influence policy and if the change in the aircraft carrier will be slight, abrupt, or even noticeable. But it's been a special baby to watch grow up. Im working on a 'conventional' scientific paper this week, which if it gets accepted, might be in the press in 3-4 months, at the quickest. Stuart and Euan have in effect written a half dozen online peer-reviewed papers in 2 months - they policed themselves, with help from (qualified) strangers, only after the truth, and sharing their findings. Really amazing and inspirational....
The basic point of my comment is In a world of Ghawar depletion, time may be more valuable than oil. This type of online research paradigm is pushing the envelope. (I wish we had a cognitive neuroscientist on staff...;)
Great work Stuart. (unfortunately you've again raised the bar for us mortal contributors)
Well said. + they have the balls to be wrong.
gpor surging on hackberry, +I'm now more bullish on tar sands potential.
Crashing canadian ng production per link will boost gmxr.
http://www2.nrcan.gc.ca/es/erb/prb/english/View.asp?x=449
I second Nate's comments. Excellent work indeed! This paper is truly of the same quality as a peer-reviewed journal article, and a good one at that.
It also represents archival knowledge, because it doesn't only present a glimpse of the current situation of Ghawar, but also explains the methodology used to obtain that information.
For this reason, it is a pity that the paper will quickly move on to pages 2, 3, ... of TOD. Soon it will only be found by those who explicitely search for it.
Is there an easy way to make papers like this one more visible over an extended period of time?
I am fairly new to TOD, thus I don't know whether this issue has already been discussed among you guys, but surely, this paper deserves all of the visibility that we can give it.
Unforunately,
Facts and analysis are often trumped by politics and agendas. TOD stories get 'buried' on DIGG and Reddit. We don't know by whom or why. We need a critical mass of acceptance for these ideas - but they are very dangerous to the mainstream - think about it - for major journals to be printing some of the stuff on this site, kind of calls in to question where their funding will come from in a few years, etc.
Once enough facts stare people in the face, then they will clamor for things like this - thats why we have to reach the decisionmakers now, while there is still reasonable time. Beliefs are hard to change. If I dont believe in sabre tooth tigers, no matter what you say to convince me will fall on deaf ears until I find one in my kitchen..
The question is simply, how many full archival articles TOD is publishing per time unit. Let us say, TOD publishes 24 such articles per year, two every month.
In that case, TOD could create an electronic journal of its own, called the Transactions of TOD, get an ISBN number for the publication, link to it from TOD, and re-publish four full archival articles every two months in PDF format, just like any other electronic journal, with page numbers and proper table of contents. The journal would only contain the articles, not the discussion, but each article would link back to the website, where the article including the discussion can be found in HTML format.
In this way, the authors of these articles could include them on their respective CVs in the same way as they would list any other journal publication. This would hopefully encourage more contributors to write complete articles of high quality that can be properly peer-reviewed and, if accepted for publication in the Transactions, be included in one of the next editions.
Time delays wouldn't matter all that much, because the material is already available on the website, but it would give these articles a higher profile and a more archival character.
Steve's article would certainly qualify to become article #1 of issue #1 of volume #1.
There is relatively little cost/risk involved, as long as we can guarantee a proper flow of articles through the system.
That's a very interesting idea.
We definitely need some process for creating more archival versions of stuff. By having a lower bar to get something on the web site, but then a higher peer-review bar to get it in the archival journal, we might end up with the best of both worlds.
Even the additional work for the editors and the delay through the system would be minimal.
All the editors would need to do is to select those papers that contain sufficient archival material to be worthy of a re-publication in the Transactions. The peer review gets done automatically.
Whereas other journals always must pull teeth in order to get reviewers to reply on a timely basis, and whereas a lot of the time delay in publishing papers is not caused by the width of the pipeline but rather by the tardiness of the review process, here we would get the reviews for free. They consist in the comment section. Hence rather than receiving two or three reviews of his or her paper, the author would have the entire discussion section to work with.
The process could thus be implemented as follows: Once a paper has been selected for inclusion in the Transactions, the author is being informed of the decision. He or she is then provided with a template file (preferably we ought to provide template files for Microsoft Word and for LaTeX to choose from), and is asked to convert the paper to the template format, taking into consideration the comments received.
Every paper will require a bit of re-formatting. Especially, the web version usually does not contain a formal reference section. Instead, references are spread throughout the paper in the form of hyperlinks. Also, the paper usually wouldn't have a formal acknowledgment section, but rather, the author thanks other people informally throughout the paper. Finally, the paper doesn't have an appropriately written abstract section (indexable, without figures or references, limited to 150 words). Yet in addition, the author should be given an opportunity to upgrade his or her paper on the basis of the feedback received in the discussion section.
Just some thoughts ...
I totally agree with you that this post should remain at or near the top for a while. It's got to be the most important paper published at TOD, ever! What do the editors think?
Wow. Great heavy lifting. Thanks.
--
Authentic learning ends where faith begins.
Are Humans Smarter Than Yeast?" (video clip: 8.5min)
Outstanding work!
Before, the only piece of information about Ghawar was Greg Croft's webpage, now we have you and Euan amazing investigative work.
It's pretty clear that the Northern part of Ghawar is crashing with less than 7 Gb of 33 Gb left (~78% depleted). I don't see how production can be sustained from that part of Ghawar. The only question is can the Shouthern part compnsate for that loss? Only time will tell, pressure is already increasing on OPEC to rise their production.
Wow^2. Amazing work!
One thing that occurred to me, is the role of KSA versus the other OPEC members. If only KSA has excess capacity, and all other members are pumping effectively flat out, would the other members be keen to let KSA take a bigger market share, and depress the overall market price? The other members would not benefit, indeed if they are pumping flat out the only way to increase revenue is to allow the price to rise. Therefore, even if KSA had excess capacity, they would not be encouraged to put it on the market and spoil the party for the rest of OPEC.
This is a rather moot point though, as it doesn't look like KSA do have that excess capacity they have been promising.
According to Simmons in Twilight in the Desert, the permiability of Hawiyah, Haradh, and probably South Uthmaniyah is about 1/10 that of North Ghawar from Uthmaniyah northward (pg 156).
Does that mean there is 1/10 the oil in place in column in the south compared to the north? Were there any gas caps in the south? Gas caps were not color coded on the computer generated blue and red shaded model. Did gas caps sometimes grow in time as more oil was produced?
There were numerous reports of the water-flood bypassing oil that was previously assumed to be recoverable. Am not sure if bypassed oil is a part of the calculations for remaining recoverable reserves.
No, permeability is directly tied to how fast the oil flows, not to how much there is. If you take the product of the porosity*payheight, you'd have a rough first index of how much oil is there good enough for back of the envelope works. So on that basis, with Croft table figuress: Haradh is 14%*140' = 19.6, while 'Ain Dar is 19%*204' = 38.76. So 'Ain Dar has roughly twice the amount of oil per unit area as Haradh.
What the permeability gradient means is that it's harder to produce the oil fast in the south.
Stuart, Thank You!
Wow. What an intense document, time invested... good work everyone! Reading this felt like having a sit-down session with Simmons and SA engineers.
TOD is the new hotness!
Too bad no countries will be signing onto the Depletion Protocol... only the poorer countries. So it goes.
Can Kuwait help ?
Sheikh Ali also confirmed to Al-Wasat newspaper that the state's proven oil reserves have fallen to 48 billion barrels, as reported last year by Petroleum Intelligence Weekly, down from an announced 100 billion barrels. However, he said Kuwait has additional probable reserves of around 150 billion barrels, especially after recent discoveries. Last month, Kuwait announced a significant oil and gas discovery in the northern Dhabi area, without giving details of quantities. The state also announced a huge free gas discovery in 2006.
http://www.kuwaittimes.net/read_news.php?newsid=Mjk4NTc3MTEw
In your view, Stuart, what is Saudi Arabia's spare capacity now?
Euan has a piece in the works on Abqaiq, so maybe we'll all get more educated soon.
You have really done it this time Stuart,
You are going to have some very powerful people yelling and screaming about this post!
EDIT: Thank you.
Incredible Stuart.
Standing & Clapping
Ghawar is Dying, Long Live Ghawar
This is the Internet.
THIS is TOD
Just an incredible Post & Site.
You Rock.
John Carr
I have a problem with Figure 11. It has obviously been compressed in the Y dimension. When georeferenced it actually looks like this, with the same scale for the X and Y axes:

I agree that the general area depicted is Ain Dar. The scale factor and positioning, however, are incongruous with the Croft map.
Do you have a larger image of Figure 11 that shows the numbers along the edges more clearly? In particular, is the significant digit of the numbers at the top and bottom a 2 or a 3?
I agree with you that the aspect ratio has been changed to fit the page better. I relied on contours for placement, not scale, however, since I don't trust the Croft scale in the northern half of the field anyway.
Here's a larger image with a quick first reconciliation of the asphaltene contours onto it. I don't see any doubt at all on placement myself.
Here's my problem with Figure 11. The problem actually may be with the Croft map. Here's a few of the contours I traced on the Croft map
Here are the same contours (in blue) overlaid on Figure 11.
I would tend to treat Figure 11 as "gospel" with respect to the location of not only the wells, but the contours. In doing that I seek to re-align the Croft map in the same world space coordinate system (UTM Zone 39 WGS84) as Figure 11, and thereby fix the Croft contours in 3D space with great accuracy. To date, I have overlaid the Croft contours on several other maps that show the location of Ghawar, and fixed it where it seems to match "best". A subjective assessment.
In any event, there is no way to make the contours of the Croft map (for -6,000 ft and -6500 ft) coincide with the same contours in Figure 11. Not without some heavy duty mangling of the Croft contours. If I have to, I will update the Croft contours to match those of Figure 11, but first I would like to translate them in X and Y to obtain the "best match" of position.
That's why I am curious as to the numbers along the top and bottom of Figure 11. If the leading digit is a 3 then my position for Ghawar is only off by a kilometer in the E-W direction and 5 kilometers in the N-S direction. If the leading digit is a 2, as it appears to be, then my assumptions are incorrect about what those numbers represent.
Finally, as for the length of the field, there is no -6,400 contour line on the Croft map. I measure from the bottom of the -6,000 ft line in Haradh to the top of the -6750 line in Fazran and find 169.0 miles. From the same point in Haradh to the top of the -6,500 ft line in N. Ain Dar I measure 151.1 miles. From the same point in Haradh to the top of the -6,250 line in N. Ain Dar I measure 146.67 miles.
The Croft map is only a rough approximation - you are trying to treat it as more precise than it is. See comparisons to other maps in my post above.
I linearly interpolated to get the 6400' position.
Indeed it is rough, being almost 50 years old. It's not even lined up correctly with the direction of North. I found it matches other references much better if it's rotated 2.7 degrees clockwise. At first I thought a magnetic declination correction for that area of the world in 1959 would account for it. But then I discovered the correction for declination was on the order of 20 degrees in 1959; way too much to account for the slight error in the Croft map.
Yet it seems to be the Rosetta stone for a lot of discussion and study here. What if it's off by 10% in any given dimension? If you go from 10% too small to 10% too big in some areas, doesn't that greatly impact any volumetric estimates? I would think even a 5% variance would have a huge impact.
cryptex,
Here is an extract from the image I sent Stuart a few weeks back. You can position the figure exactly on the plot, giving a location for the actual XYZ well of 25°40'11.86"N, 49°16'25.63"E
ANDR-XYZ overlay on satellite, well sites and height map
Its interesting to note that semi-vertical line seems to correspond with the division between S Ain Dar and Shedgum. The area of high oil saturation follows the high areas of S Ain Dar exactly, but then extends into the lower saddle region at the same oil depth as the peak.
[If I ever stop this machine crashing and losing 10 hours of work, I'll send a paper in with my other findings.]
Thanks. Is the well midway between the two red "arms" that descend from the XYZ label, or the center of the half-filled circle?
Neither, its the dot at the root of the arms, just below the label.
MRC wells are like a root system where you can shut off particular tap roots when they encounter water. Everything feeds back to the main root/well.
Thank you. I'm not familiar with the symbology, as you can see. That also answers my question about the numbers along the horizontal scale as well.
Sorry, that was meant to be on its own level, not as a reply to John Carr's post.
First great work !
Next I originally questioned the fact that the Linux Super Cluster image was for 2004. I maintained it was probably older data used to test the super cluster simulation. Since the focus is on hardware one would think that the picture would represent older test data. So my suggestion of 2002. Now Euan it seems may have made other mistakes primarily because of the problems with the Croft map that you have corrected for.
The reason I bring this up is your current estimates seem to place Ghawar slightly less depleted than your previous work.
And it does not quite match up with the decline rates we seem to be seeing now. If I understood your current paper it seems to be putting major declines in 2008-2009. Where it seems they have started already.
Now with this said your analysis seems to have enough information to prove that the super cluster paper is 2004.
Overall I'm not sure if its a huge issue or changes the results all that much but its seems to me that pushing primarily the super cluster data back a year or two from where your suggesting seems to match current production profiles better.
I don't know if it matters but I'd be interested in your opinion of the effect of assuming the Linux cluster data was actually one or two years older than you have suggested. And also if you feel that in the data you have published that you have proof either way.
Assuming my math is correct and production is around 5 mpd
Its 1.8 Gb per year which represents a few percent of remaining reserves so its not clear that a error in the years is enough to change your analysis since its well below your error I think.
Next you did not include the Super K zones or bypassed oil in your paper both will lower overall production at peak and are related. I suspect that bypassed oil is actually significant and will both cause the production at peak to decline greater than your suggesting and also allow more production at lower levels as these bypassed areas are produced. They may have to turn of water drive or turn it down I think to produce some of this bypassed oil via gravity lift or other methods. The reasoning is simple they are producing too much water to effectively produce these zones now with the current water drive.
I believe I understand your conclusion to be Ghawar is past at or close to peaking taking your error considerations into account it seems your error in terms of peak production is over at most a 4 year period. In short once they hit peak production they will decline within four years. Assuming peak production in 2004 this gives 2008 as the last year that they could produce Ghawar at a high rate.
My question on the timing of the linux super cluster would suggest that the date is earlier by about a year or two which puts decline starting in 2006. I don't see how you get a initial 2006 decline out of the date you presented in this post. Instead you seem to favor a slightly later decline.
Not that its clear you have the resolution to make a call less than this 4 year window.
In the big picture its not too important but with the overall world declines and this information we are down to a few years or less before we probably will see major strain from peak oil. So at this point its a matter of paying close attention to my personal plans and this are influenced by one or two years difference in opinion. I'm hoping that the increasing strain in supply and rising prices along with mega projects coming online will give us a bit more of a plateau out to 2010 if possible. So on a personal not it looks like 2010-2011 will be when we start having serious problems. I hope so since even three more years of a reasonably functional society is important.
I would maintain that, in the absence of other evidence, that all of the published 3D images are simply representative of what the models are capable of. There is nothing that suggests any of them was the result of using actual data as input.
I accept that actual numbers in the reports we have seen are real. I do not accept that the graphical outputs are anything more than eye candy.
That's kind of why I amassed all that other evidence....
Where you say
that's not evidence. 75% of the way up what? 2/3 of the way up what? The height of the structure?
Have a look at this and tell me "how far up" the structure the boundary between yellow and green occurs.

It depends where the floor is, doesn't it? And this image is color coded for height. When the color represents an independent variable like saturation you practically have to pull an elevation number out of thin air to state with any certainty what that might be. That's handwaving, not evidence. (I'm not denigrating the other, real evidence you've assembled - much of it appears to be solid.)
Where the floor is depends on the data points used to model the surface. They, presumably, are derived from contour data (unless there's a uniform grid of holes in the ground every kilometer at Ghawar). My 3D map there was generated from the Croft map, but in order to realize any surface that was recognizable I had to practically double the number of contour lines, extending them outward in a concentric fashion until all the contours were closed. I had to guess at a lot of it.
Figure 11 still bothers me. I can't get it to fit in my model at all. Can you tell me if the first digit of the numbers on the horizontal axis is a 2 or a 3 please?
I don't think we can say with precision how much decline has occurred so far, unfortunately. Assuming the gas cap is more-or-less as I have modeled it, and I'd be interested if anyone can think of a physically plausible alternative, then I don't see how North 'Ain Dar cannot be in decline now. However, North 'Ain Dar was on plateau in 2004, so that would argue that they managed to keep it on plateau to an R/P of around 4. If everywhere else was kept on plateau as late, then the other areas might still be on plateau. But whether they could keep all those balls in the air at the same time... And that oil in Uthmaniyah with all that water sitting in the crests above it trying to find any super-K to sneak down...
So I suspect North Ghawar is where a lot of the declines are already. But I think only in North 'Ain Dar is that case somewhat solid. Elsewhere, I can imagine a colorable argument that declines might still be a couple of years off.
That's why I didn't make production profiles - I can't constrain them well enough when I'm comparing an R/P of 7 +/- 3 to an unobservable Saudi Aramco plateau maintenance ability.
At a minimum, you can certainly see why they'd need a bunch of rigs...
Memmel,
As you are aware I revised my opinion on the Linux map from 2004 to 2002, partly based upon your earlier comments and partly based upon Stuart's interpretation of this map on S Ain Dar which I find quite convincing.
It struck me that the S Ain Dar picture was more depeleted than shown on my transposition of Linux to Croft - infact Stuart showed that I had interpreted too much oil for 2004.
In comparing Stuart's modelled 2004 OWC with Linux, I'd say Linux has got more oil and that placing it a couple of years earlier might make more sense. I don't think this makes much / any difference to Stuart's interpretation as he uses Linux for reference and not source data in the N.
However, I wonder if Stuart might humour us and provide a plot of the conact in 2002 just to see what difference this makes?
I agree it would be great to at least see how shifting the data around by a few years effects the results. Sort of a simulated annealing. Stuart is using the overlap of independent sources to draw a strong conclusion but whats missing for me is the "stability" of this conclusion. I see it as the conclusion is a potential well with sides that slope.
If changing one variable results in a big change in the conclusions then ...
Its to complex of a problem for me to see.
Next of course I think that North Ghawar will simply collapse decline is not the correct word. As the water front causes the water cut to zoom in some wells whole regions that could produce at high water cut will have to be shut down. My opinion from what I can gather is they will have to
practically shut the field down and change extraction methods once they move to a higher water cut regime. I think the traditional method is call 5 spot ? In any case it would be moving to local injectors around wells that are in bypassed oil pockets with the side water drive turned off.
I could be wrong but consider that Ghawar cannot be produced as it is now once the water cut goes above a certain threshold which means it will effectively be taken off line for a number of years before its produced again at a lower rate without side water drive using some other method thus my collapse scenario.
Stuart sent me this with this text:
So by my reckoning that's 2002 on the left and 2000 on the right.
and Memmel said:
One thing I found out was that once I got my general framework in place, I made a lot of second order changes but none had a drastic effect on the model results. I'm looking at making a few Rev 2 changes, some will add to and some will subtract from estimates. Sure, timing of events may move back and forth on Ghawar by a couple of years, but the big picture of sharp decline in the north some time now stays in place.
I'm awestruck - this was an impressive piece of work - !! –
Ppsssst, I’m not paying for the overtime – BUT my hat is firmly held over my chest - by both my hands...and I am looking slightly down and with my knees bent …
Say- if the situation is as suggested, I mean as in "it is so" (hypothetically spoken, though) –
And then adding in the plummeting situation for various regions like the North Sea (down 25-30% since 2000 and the Norwegian side are downscaling as we speak), Mexico and so forth…
In the lights of these petro-down scenarios we start to see clearly today as of 2007 –
I CAN’T HELP THINKING OF THE OIL PRODUCTION CURVE FOR THE WORLD – which had a severe “DOWNWARD BUMP” in the 1980’s ….. due to Afghanistan and more.
(Negatively perceived at the time for sure – in today’s retro view definitely positive ... or ??)
I WONDER were we would have been today – as a global society – IF we had the PEAK of OIL say in 1995?
My guess is MUCH BETTER OFF – for plenty reasons
1- Less people on the planet, less food needed less of all …. Less worries ... Less ugly to mitigate more time to do it and so forth
2- Less globalization – less fish would be sent Norway – China return for gutting and square packing – how much energy doesn’t that take?
3- 12 years less of oil extraction and exploration – rendering a much WIDER plateau (peak oil plateau- that is)
4- AND last - 12 MORE (???) years of FIGURING OUT WHAT NOW? The speed on the gluttony today is very scaring, at least to me …
And as put forward somewhere – The GW Bush first-term took 10% of the first half of ALL oil – RENDERING the GW Bush second-term to take 10% of the last half of ALL oil –
WuZZ up ,?
::speechless in awe::
gulp...
Thank you (and everyone else involved) for your comittment to piercing the veil known as Ghawar.
Excellent work!
I think the chart of Ghawar original and remaing reserves should be viewed in the context of the Kuwait oil minister's apparent comments over the weekend that put Kuwait reserves at 48 bb versus the offical state number of 100 bb
Oil minister puts Kuwait's proven oil reserves at 48 billion barrels
"Kuwait's Oil Minister Sheikh Ali al-Jarrah al-Sabah confirmed on Saturday that Kuwait's proven oil reserves are 48 billion barrels -- a figure conflicting with the previous official estimates of nearly 100 billion barrels."
What is the difference between showing this curve and just stating that the DeclineRate=P/R to first order?
i.e. the production is proportional to the remaining reserves, which is a type of Markovian approximation.
Swi Hawiyah
Stuart, well done!
For the first time I think I begin to understand the 50 years water saturation data chart - which confirms lingering concerns I have about Hawiyah.
The first curious observation is that the rel perm data point to Hawiyah having much higher Swi than Haradh, even though Hawiyah has marginally better reservoir properties. The second point, and correct me if I'm wrong here, is that the rel perm data for Hawiyah should be applied to the net, active flowing reservoir, and using the 17% average (applied to gross rock?) would be inappropriate here. Taken at face value, the data you present suggest a 44% recovery factor in Hawiyah (Soi=57%, Sof=32%, mobile oil = 25%, recovery=25/57) and I wonder if this may not be true? An Swi of 43% is IMO uncommonly high and is unlikely to represent a primary reservoir filling feature - and an extraordinary explanation may be required.
A more general point. You have worked out average saturation values and recovery factors and applied them to the whole field (right?). Do you plan to refine this by applying area specific data? - which should weight recovery (and depletion) towards the N.
Finally do you have an initial STOIP number for the field?
My interpretation of the "Fifty years" relperm curves is they should be seen as the relperm for some particular (a-priori unknown) strata in some (unknown) well, rather than being a scaled up quantity suitable for modeling the entire operating area.
"You have worked out average saturation values and recovery factors and applied them to the whole field (right?). Do you plan to refine this by applying area specific data? - which should weight recovery (and depletion) towards the N."
Not at present. I don't see enough of a pattern in the data to constrain any model more complex than a constant. I admit that not what I expected to find going in, but unless we get a bunch more data that would support some model with statistical significance, then I don't see doing that (throwing parameters into models that aren't statistically well constrained is always bad practice IMO).
Stuart and I differ in opinion- greatly on this. Not that it has a material impact except to point to the low end of his Hawiyah projected reserves.
Three authors inside Aramco are responsible for the chart... they probably spent their lives studying the relative permeability characteristics of the Arab D and take a lot of pride in what they know. They have to choose "representative" core plugs for each of the areas and conduct numerous tests to massage out a "typical" curve for each area. Then they get to leave the lab and present an SPE paper maybe every 10 years. You have a lot of PHd level interpretation at your disposal here. Probably combined 50 years experience as well.
They present a very pessimistic (nearly unfloodable) curve and it is subject to the standard Aramco review. It makes it through. How reasonable is that???
Now you have a Haradh 1 in 1996, a Haradh II in 2003 and a Harad III redevelopment in 2006... Where is the Hawiyah redevelopment???? It is skipped over even though its 30 miles closer to the export terminal. Something doesn't jive.
FF
FF - I'm inclined to be with you on this point. The difference between Haradh and Hawiyah on these ff curves is striking.
I'm still disinclined to accept 43% as a reservoir fill related initial Swi for Hawiyah - and so if this is correct, feel inclined to postulate some secondary process at work.
The most likely candidate would be a structure breach (a natural fracture of the top seal allowing oil to escape and water to enter from below) followed by healing of the breach, and renewed charge to raise oil saturation (So) from the Sor state following breach.
Once the sand settles, and I get around to Revision 2, I'll proabably use Stuart's Swi and Swf results on a region by region basis, combined with an estimate of reserves and recovery from "non-net" - i.e. less than 3 mD rock.
Euan
Euan-
I am perfectly willing to accept that geologic time... is the one thing that cannot be replicated in the lab.
Connate water saturation in field would be easily quantified by induction/ porosity suite and archie's equation. Thus I feel it is as low as Croft...
But waterflood mobile oil is a different animal entirely due to the bimodal nature of this pore space. And there is an SPE papers that says the same. And it was published in 2007.
But reasonable men of good conscience can differ and what are we arguing over but what I find to be an interesting academic point in the end.
The interesting thing that the forum can take from this is that there are some really basic parameters in the Arab D... residual oil saturation, connate water saturation, rock wettability, capillary pressure, net pay cut-off porosity... that Aramco is publishing on today (March 2007). If you think just because they have a 100 million cell simulator and 60 billion barrels of oil behind them they have this reservoir figured out, think again.
It's like someone has said "let's go back to the basic assumptions we have made, and find out where we went wrong".
Makes you wonder about that 130 billion barrels they have waiting for pipeline hookup (undeveloped). Wonder who's working on that??
FF
Well, Aramco have a recruitment road show in Aberdeen next week. My family say I should go along - but I couldn't stand the daily commute to Bahrain for beer and wine!
The King Fahd Causeway from space. I've been to border crossing in the middle from the Bahrain side.
There's two problems with your position that I see. One is, the supposedly "typical" rel perm curves don't match the text description in the paper of the range of Swi/Swf values. That, and a number of other small inconsistencies and sloppinesses in the paper don't suggest to me a picture of enormous care in the prep of the paper.
The other is, in all other important respects (porosity, perm, payheight, lithology), Hawiyah is intermediate between Haradh and Uthmaniyah. So the idea that the whole-field Swi is wildly worse than both it's neighbors seems implausible to me.
I'm more inclined to the theory that they were throwing the paper together hastily right before the deadline, and grabbed whatever relperm data happened to be lying around handy in their computer directories from some other project.
That may be a difference between you and me- I've drilled a lot of "inside locations" in my career.
FF
FF
Quick related question. In your experience where you have difference in porosity, Sw, etc. between connected areas, what does the transition look like?
In particular are we looking at gradual transitions between measured states, or are the transitions abrupt on large scale transitions in the underlying strata? (I'm guessing the second)
As far as Hawayah being worse than the rest, where is the transition to the other fields? Is it likely to follow the defined boundaries, or somewhere else?
Water flood recovery mechansim
Stuart - a couple of charts I like a lot. My understanding is that you propose the flood front advance up the N Ain Dar ridge is less rapid than on the flanks - and I think you're probably right.
WRT my recent email about oil buoyancy driving secondary recovery I'm quoting Plucky Underdog here, and have no axe to grind - but wonder if this may provide an explanation for slower sweep up the ridge axes. As I see things, once the flood front passes through an area, fractional flow of water steadily increases, and the water clearly moves laterally through the reservoir from injector to producer in response to the pressure gradients established by injection and production.
I'm not sure, however, that oil gets carried along in this flow of water - I may be wrong - and I'm quoting PUD. If the oil doesn't get carried along - then what happens? If buoyancy is the driving mechanism, then the oil would move vertically until it met the top seal (on the flanks of the structure) and it would then move up the dip angle of the top seal until it reached the ridge axis. It would then move more slowly up the lower gradient of the ridge axis?
This way the ridge axes may act as conduits for oil that is resegregating from water behind the flood front. It has struck me as odd that the Linux map shows all ridge axes still oil saturated well below the height of the gravity contact. This is particularly evident in Abqaiq.
So do you think it is possible that the ridge axes could represent the migration route of oil from behind the flood front?
Euan-
Obviously the axis is a lot lower dip than the flanks... so if it moves up 20'vertically on the axis and 20' vertically on the flanks... it moves 2000' North South and 330' pinching in from the East/West. It is a pure aspect ratio geometry thing.
I assumed that the flood front velocity Aramco presented in the SPE paper had to be the flank velocity (this is the principal flux area on that long structure)... I had to be wrong because it would have been gone long ago... it is the axis velocity.
FF
FF - what I'm really thinking about here is the long period of time available in these fields to allow resegregation of oil and water to occur in flushed zones and for the oil to find its way into the ridges.
Also the fact that Fig 5 of SPE 93439, located on the N Ain Dar ridge, may, by virtue of this secondary resegregation process, present an over optimistic view of flood front advance at this northern ridge outpost.
Euan
Euan-
I understand what you're saying and that is I believe the high-tech water cut management technique used in North Uthmaniyah (cyclic production).
As to whether Figure 5 is optimistic/pessimistic, I wouldn't give the skeleton key a good prognosis for life in either case.
FF
Hello Euan,
Call me ignorant, but could a modified version of GAGD help speed the crestal resegregation process and improve extraction economics? See my link upthread please.
Bob Shaw in Phx,Az Are Humans Smarter than Yeast?
That sounds like Matt Simmons. You know, you ought to seriously think about putting this all together in a book.
I haven’t made it all the way through, and even when I do I will read it again, but the following overlooks an important factor:
In mid-2004, average OPEC oil prices were $35/bbl. Right now, they are $64/bbl. In a 42 gallon barrel, that is an increase of $0.69/gal. But gas prices are actually higher than they were in mid-2004 by $1.21/gallon. The reason for that is the tightness in the U.S. refinery system. Without this, we wouldn’t be close to $3/gallon. In fact the crude inventory situation in the U.S. is pretty healthy right now. Also recall that just 3 months ago gas prices were hovering around the $2/gal mark. Saudi’s production 3 months ago was about what it is now.
So, while the run-up in oil prices does explain part of the run-up in gasoline prices, we wouldn’t be near $3/gal on the basis of just the oil that has been taken off the market.
One could easily make the argument that the tightness in the US market for gasoline is also caused by the lack of imports of refined gasoline, which in turn could be caused by lack of crude oil for refining outside the USA.
Lets face it, World Oil production has remained constant at best for the last 2 years, meanwhile demand for gasoline has increased by 2% in the USA and by a lot more from China.
One could easily make the argument that the tightness in the US market for gasoline is also caused by the lack of imports of refined gasoline, which in turn could be caused by lack of crude oil for refining outside the USA.
One could, except for the fact that gasoline import levels are quite normal. We had a very high spike of imports last year, but right now they are running historically well above normal levels.
Well first I think the argument that things are fairly normal is a strawman if so why is gasoline not 25 cents a gallon and oil 10 dollars a barrel. The point is take it down to its logical conclusion and the result is supply of oil is constrained. Next up the ladder since you can import gasoline in large quantities even the issue of US refining capacity is a dubious if gasoline is fungible. Now you do have a local or regional problem of refineries not running at full capacity and a bit of backup of oil but this should have no effect on gasoline reserves if we have plenty of refining capacity world wide. Next if the US is well supplied and we are the biggest importer we would expect the rest of the world to be awash in oil leading to spot prices dropping for other markets.
So the argument that all is well and we are only having local refining problems in the US does not seem correct.
What does seem to be happening is that supplies of both oil and refined products are tight worldwide otherwise the US would be flooded with gasoline or the refiners are acting as a cartel and should be investigated.
In my opinion what is happening is what I predicted the effects of peak oil are like the gopher game where you hit them on the head. Problems snowball as the strain of peak oil causes the oil industry itself to collapse. The oil industry sets around pointing fingers and claiming that if they only had X amount of investment good time will return but the economics of the oil industry esp for large investments gets worse faster than peak oil causes supplies to drop. So above ground factors will be the dominate effect of peak oil over the next 18 months. Then prices will go to the moon as the wealthy nations compete in earnest for the remaining oil. The initial effect is what we see now a premium for refined products over oil as the reserves of refined products are much less than those of oil and are drawn down faster. By next year we probably won't have enough oil for the current refining capacity and with 18 months it will be heading towards 90% of capacity world wide. At this point oil prices will start increasing strongly but gasoline or better refined product imports should continue to lead oil price by a healthy spread.
In a sense the gasoline market is in double contango. Gasoline prices are increasingly pricing in a future shortage of oil as the bidding wars for oil/gasoline will drive the price to unknown heights once the wealthy nations compete in earnest. As this happens the strained oil industry simply self destructs.
Back to local markets I think you will see the wealthiest nations continue to have reasonable supplies of gasoline and oil with local issues predominate as market forces become volatile but in general heading upward. For the US the issue is when we simply don't have enough gasoline for export worldwide to supply us. I think we are already in this scenario its just that the market has not figured it out.
If so expect gasoline to go to 5-6 dollars a gallon this summer and 10 the next. Effectively the US will be immediately forced to compete with Europeans for gasoline and the EU has a large tax cushion they can lower if they wish. The US will in effect be paying EU taxes for gasoline.
The reason is pretty simple we have larger storage capacities for oil and the oil market itself is in contango so we will for some time seem to have enough oil while for mysterious reasons we won't have enough gasoline and this is caused by the need for imports into the US. So gasoline imports into the US are the feet of clay for the oil industry leading to a faster collapse then would be predicted on oil supplies alone. And I don't expect US oil supplies to drop for some time since the driving factor is the price of imported gasoline not oil.
I think the problem is we have always looked at the demand for oil and in reality its the demand for finished products thats the issue for a given price the oil will effectively always be available and in storage it the super contango of the finished product market that will drive who and how this oil is consumed since refineries can vary their product mix and export finished products. We missed the boat a bit by focusing on oil inventory peak oil effects are complex.
Stuart, the image above as I view it at roughly midnight my time is of a huge black square. Is there a different image I should be seeing?
Ghawar Is Dying
The greatest shortcoming of the human race is our inability to understand the exponential function. - Dr. Albert Bartlett
Sorry - I have fixed the image problem.
Likewise, did not come through for me. But I will say that historically this is certainly true. But if you were to plot the past 2 years, you wouldn't find such a high R-squared. In fact, you would probably find a decent relationship between refinery utilization and price.
I'll respond in detail in my next post.
So, the correlation between crude prices and wholesale gas prices has an R2 of 96.5%. Therefore, the relationship is very close to deterministic, and indeed the effect of 2mbpd of missing production on gas prices is very significant
I don't mean to imply that it isn't significant. Even the analysis I did showed that the increase in oil prices would have added around $0.70/gallon to the refinery input. All I am saying is that this alone wouldn't have put us at $3/gallon. It took the capacity issues - reflected in the inventory levels - to push the price on past $3. That is probably adding $0.50/gal to the price of gasoline at the moment.
I'll have to agree with the gist of Robert's argument, though I think the numbers may sway just a bit if we actually did the analysis in detail. We've had crude prices in this range before without reaching pump prices in this range. Close but not where we are now. So obviously something else is a factor and capacity is a good candidate.
Ghawar Is Dying
The greatest shortcoming of the human race is our inability to understand the exponential function. - Dr. Albert Bartlett
But this should have not happened if our refineries are operating reasonably well even with the problems we have had since we could rely on gasoline imports to make up the difference. So the real question is where are our imports and why is the rest of the world paying a significant premium on for oil over the US WTI price.
The US has always imported quite a bit of gasoline and imported gasoline should have ensured prices remained tightly coupled to oil price. Where then our our gasoline imports and why are we not getting them. So why no imports ?
Current US refinery capacity is not a problem if we had the imports.
Memmel, I am not certain but I believe that gasoline imports (not raw crude) are running near the same rate they have for the last 2-3 years. The problem appears quite simply to be increased demand against a flat production plateau. We've outbid all the poorer nations and the rest aren't just going to give us their gasoline so we're going to have to outbid them next. This leads to Jeffrey Brown's bidding war concept and that we may be experiencing the next round of bidding wars.
Ghawar Is Dying
The greatest shortcoming of the human race is our inability to understand the exponential function. - Dr. Albert Bartlett
Where then our our gasoline imports and why are we not getting them. So why no imports ?
Greyzone is correct that import levels are running where they have always run at this time of year, with the exception of last year, when we saw a sharp spike of imports. However, this week's import numbers took a big jump up, and were the 6th highest gasoline imports on record. So, the "no imports" theory is not supported by the data.
At what price ? Thats the key point remember its a supply and demand equation at a certain price. USA consumption is leading to rising prices world wide and I'm sure demand destruction in some parts of the world as these prices are passed off including the US. So the US gets flooded with imports and ever higher prices yet we have plenty of oil and gasoline ? And more telling the argument that their is not enough refinery capacity becomes suspect since how is the US getting all the imports when refinery capacity is supposed to be the bottle neck in the first place ? Where did this gasoline come from if the rest of the world was straining their refineries to meet local demand ? We should have zero exportable gasoline available. Or wait is their enough refinery capacity ? How can we suddenly increase gasoline imports if its a refinery capacity bottle neck ?
My point is that its not trivial how peak oil effects the world supply of finished or final products derived from oil we have a myriad of different products produced from oil and refineries themselves have quite a bit of control over the final output. Whats happening is the bidding war for gasoline and thence for oil is on.
As and example look at how corn ethanol is effecting agricultural products we are seeing pricing pressure across a broad range of finished agricultural products and other production such as wheat and soybeans. No one seems to have a problem with the obvious complexity of the result of shortages on agricultural products yet we treat oil as a one dimensional problem. Looking at the US and claiming that everything is fine is not correct you have to look at the big picture and how the market is responding. Considering that this is really our first real post peak year I'd say its not looking good for the soft landing crowd.
Whats going to happen seems obvious the price of gasoline will continue to rise until US demand is capped this is important since we have hit a hard ceiling immediately on how much gasoline is used in the US we will essentially never consume any more gasoline than we do today price will force this. Next year it will be less. So a bit later this summer will mark peak gasoline usage for the US it will never exceed this amount. Consider the implications.
>, the correlation between crude prices and wholesale gas prices has an R2 of 96.5%. Therefore, the relationship is very close to deterministic, and indeed the effect of 2mbpd of missing production on gas prices is very significant:
This likely has more to do with the quality of crude received, not necessarily the supply. As supply of crude becomes heavier and sour, it naturally takes more energy and time to refine into fuels.
Wow. I tried to read this at one sitting, but couldn't do it. I am reading it slowly, to make sure I comprehend everything, but after having absorbed a ton of information I found that I was only about 1/4 way through the essay. This is simply the most comprehensive essay I have ever seen posted at TOD. Well done. I reiterate that you should consider writing a book. These analyses are at least as good as those Matt Simmons has done.
I have a "to do" list that is growing by the day, but I will keep coming back to this until I finish it.
Heck, it's almost long enough to add it to my 2007 Books Read list. :-)
Re: I reiterate that you should consider writing a book
I totally agree, this work should be published at least in a journal with a large readership (Oil&Gas journal? Scientific American? ).
This is an incredible amount of work. Congratulations Stuart and to everyone involved.
What strikes me if that there is a lot of Oil left in Ghawar after the secondary flood has finished. What are the prospects for further extraction technology?
After all the Oil-sands of Canada are being mined in a very energy intensive fashion. They're currently essentially turning Natural Gas into Oil and have plans to throw Nuclear into the mix.
Can injection of steam or gas break up those oil droplets or reduce their viscosity so the remaining Oil can be pumped out?
At what price does it make sense to mine it?
Zero.
To try and pound the point home. Once side water injection is no longer producing a substantial amount of oil in my opinion the field will basically be shutdown even though a significant amount of producible oil remains. The reason is the costs are enormous for attempting alternative recovery on such a large reservoir and water handling is a huge expense. Consider the costs once side injection is no longer profitable with the current water cut and you will see that it makes more sense to shut the field down until prices rise significantly. One reason their may be some truth behind some of what KSA says in that they are "resting" large parts of Ghawar and its still producible but what they fail to mention is they don't have the infrastructure in place to produce it. And they probably will never produce it.
I suspect they may open it up to foreign investment to pick the bones.
So why can't they just drill hundreds of mrc wells in the southern half of ghawar to maintain 5mmbpd of production? Maybe that's the real reason for the increased rig count.
The MRC wells go for kilometers draining a region.
Also I'm sure their are fractures and other defects that they need to avoid. A MRC is not a silver bullet. And as far as I can tell thay have put in at least a reasonable density of MRC's to get the current production rate. With everything I'm sure their are a number of trade offs. Foremost is these wells are horribly expensive. If they could extract without them they probably would have. Off the top of my head you also have to manage the pressure you probably get nasty pressure variations in tight rock like this so more wells closer together may not matter. I'd love to here from someone with experience but its not hard to think of a number of issues that suggest a optimum number of MRC with price/production rate being a big one.
With that said and now that you mention it this is what we generally do with off shore production and almost all of the last 20 years of oil supply has been offshore. So once the biggies are done Ghawar etc expect thousands of offshore wells to crash in rapid order over the next few years. The death of so many smaller fields will add up quickly to cause a higher global decline rate than most people anticipate.
I'm guessing 10:1 loss to new production for small fields.
This will eventually cause a few percent drop in overall decline rate say 2-3%. With the giants going down. I think we will easily see a 6-8% global decline rate in 2-3 years.
This swarm of dying offshore fields is the next big issue tm. Hopefully the powers Stuart/Khebab/Euan etc will be interested in the issue most of these fields came online in the late 70's-90's and large groups are going to die at about the same time and the later the field was put in the better the extraction technology leading to shorter field life thus compressing the whole mess to crash over a short time period that just about now.
"With the giants going down. I think we will easily see a 6-8% global decline rate in 2-3 years."
I would say even larger - maybe 10-15%
Why?
Because everyone at the Oil Drum tends to think in "best case" scenarios (except maybe FF and you) and never account for the "above ground" issues. Just look at Nigeria. There's every possibility they will be exporting NO oil by the end of this year, who knows?
But I think that once the decline starts then all parties, govt, rebels, crime lords, corporations, etc... will see that as the cue to get what you can as fast as you can, before the next guy. All hell will break loose and who knows how much oil there will be. I would say that the 6% decline would be the optimistic scenario with no "above ground factors".
This is IMHO the biggest Pandora's Box of all time and the major govt's of the world cannot afford to let it out. Namely, that Peak Oil is here, production will NEVER recover, and we are going backwards down the energy curve for the first time in history. With the biggest overhead in history. (Overhead being population, living standards, enviromental problems, etc.) This is contrary to EVERYTHING that 99.99% of the people in the world believe. It is worse to hear than a death in the family, since it means that the whole family is now at risk.
And when Joe Sixpack finally gets his head around this he will Demand Action! Grab those stinking Arabs and squeeze the oil outta them! Throw everything we got at the Middle East and get me $1.00 gas again, and so on....
So then, whatever the decline rate is you will never hear TPTB mention that we have peaked. Not for a while yet. And when you do, know this; the game is up. Run.
That could very well be true.
If oil price rises to 100 US$, then who knows what kind of violence breaks out in places like Nigeria. We just increased the jackpot by then. These fights will be even more unforgiving.
Scary.
One point to keep in mind is that it took a massive drilling effort to keep the Lower 48 post-peak decline rate down to about 2%. Worldwide, I don't think that we are capable of anything like that effort.
And then we have the export situation, where single digit decline rates in exporting countries will, in most cases, translate to double digit decline rates in net oil exports. For example Mexico, where we see a single digit year over year decline in production, but a 16% drop in oil exports, first quarter of 2007 relative to first quarter of 2006.
A 16% per year decline = a 50% drop in 4.5 years, which is what my simplistic Export Land model shows (not applicable to all exporters): http://static.flickr.com/97/240076673_494160e1a0_o.png
memmel,
That's actually a very good point. When/if KSA or any other major producer simply throws it open and says "give it your best shot", that would be the final chime of the clock.
RC
Remember, we are only one cubic mile from freedom
Thats what Libya did so I expect each of the NOC's to do when its not worthwhile for them to develop a region.
Remember the NOC's need insane profits to fund their social programs when oil extraction simply becomes reasonable profitable they have no reason to do it easier to take a hefty royalty and let more efficient commercial companies do the extraction. For the commercial companies who will also have basically no reserves at this point its a matter of paying a hefty royalty and makes a ok profit or going out of business.
So at some point all sides will see that the most profitable approach for all is to let the commercial companies spend enormous amounts of investor money upfront for dubious long term returns.
Fantastic work by all, simply amazing.
Regarding the KSA inviting foreign investmen.
It's already happening a little longer down the pipeline to the customer.
http://news.dow.com/corporate/2007/20070512a.htm
The KSA is starting to invite foreign investment and trying to sit on a larger part of the petrochemical value chain.
kind regards/And1
Memmel, while I agree in theory about NOCs throwing open the door in many locations, I am not sure that this would work in KSA. The political situation in KSA is unlike anywhere else in the Middle East of which I am aware, with perhaps Kuwait only coming close. KSA is a vastly rich Sunni minority ruling over a large (and rapidly growing) Shiite working poor majority. Throwing open the game to IOCs would be taken as an open admission that the royal family has lost control of the oil market and that might be enough to bring about serious civil unrest.
I am just very uncertain about KSA being able to do this. Libya? Certainly! Iran could even do this (and probably get away with it easier than KSA). But KSA? I think the "above ground" factors will outweigh the geologic factors in this particular case.
Ghawar Is Dying
The greatest shortcoming of the human race is our inability to understand the exponential function. - Dr. Albert Bartlett
KSA is a vastly rich Sunni minority ruling over a large (and rapidly growing) Shiite working poor majority.
Are you certain of this? My understanding is that the oil regions of KSA are indeed majority Shia but that the KSA as a whole is very much majority Sunni.
You are correct on that! I was thinking primarily of the oil rich provinces where the Shiite population is both rapidly growing and densely concentrated. Even there though they are not the majority though its getting closer so mea culpa!
However, not all the Sunnis participate in the riches of the kingdom either, hence the activity there by Al Qaeda fomenting rebellion amongst Sunnis as well as Shiite unrest.
I still believe that KSA is badly positioned to ask for external help on its fields because of the massive welfare state they've created and the growing number of poor (with a fertility per woman over 4!!).
Ghawar Is Dying
The greatest shortcoming of the human race is our inability to understand the exponential function. - Dr. Albert Bartlett
Stuart,
Could you please clarify what CURRENT reserves and production numbers you are using for the sub-fields of Ghawar? You give historic reserve numbers (in the comparison with Euan's numbers) and your R/P graph implies that you have estimated current numbers. I'd be interested to know what numbers you're using - I'm aware that any such numbers will have big uncertainty attached because of the fact that we don't know for sure what the production split by sub-field is.
Thanks very much (and congratulations again on a phenomenal piece of work),
Cuchulainn
Congratulations everyone. What an epic moment Stuart and Euan's posts represent in an already very interesting year.
Would anybody care to guess what sort of reserves 'growth' we could see if Aramco did go ahead with a CO2 recovery effort after the water has done all it can? Or are the properties of this field such that there is little benefit in EOR?
cheers
Phil
ASPO Australia
Amazing, simply amazing! Thank you, and Euan, F_F, others, you make TOD a daily read.
This post will get wide viewing in upper circles without a doubt. I hope sounds the alarm bells with a statagy to mitigate. I hope congress hog ties GW, this could get really ugly.
Reading this is like watching someone who loves playing music for the music not the money. It is simply the best.
Stuart, your long article, in which you have put a tremendous amount of work, deserves an executive summary, to be inserted before the introduction, together with a table of reserves, production data, decline rates etc. for the different parts of Ghawar
Very good detective work.
At the moment I'll just take the net decline figure of 2% for all Saudi fields released by Aramco in Nov/06(150m to 200m bl/da/yr).Whether it increases,we will have to see.More interesting is the position taken by N.Saleri who proclaimed in Feb/07 that an average recovery <60% of OOIP from all its fields was unacceptible.Their target is 75% recovery!The 260B bl of reserves would make sense if that is their position on recovery factor.I would point out that the avg recovery of fractured carbonate oil reservoirs worldwide is 31%,higher for sandstone.
They have great faith (expectation)in todays technology!!
Because so many posts on the oil drum reference the "Linux Supercluster" images, it would be helpful if someone would do a post about the provenance of these images, an article that could be referenced whenever they are.
Why do we think these images were created?
Why was this information released to the public?
By whom? To what end?
I'm guessing that it may have been released as a demonstration of oil geology modeling... and accidentally revealed to contain real data about Saudi reserves. Is that true?
In any case, I'm sure it has been dealt with somewhere, but an article about the provenance of this specific set of oft-referenced data... and more broadly about the scientific epistemology of oil reserve data... how do we know what we know about oil?... would be a great background contribution here.
Excellent paper. As a non-geologist I was able to understand most of it. I have sent details of the paper to several colleagues.
In 1987 Albert Bartlett (Am J Phys. 46. 876-888), gave estimates for the exipration of fossil fuel reserves. His estimated dates for 'oil' were 2016 - 2022. Given the current state of our knowledge about probable recoverable liquid fuels, should these esimates be updated?
In respect of the plot showing a steady increase in use, against a decline in production, and an increase in price, at what point would 'users' start to reduce their consumption in order to minimise their expenditure? This would extend the depletion time somewhat.
At what point would the actual amount of the fuel available cause a disconnect with the pricing - you cannot stuff dollar bills into your fuel tank! Rationing!!
Brian P Woods (Dublin Irl)
Records
Judging by US consumer spending for April, disposable income for 60% of the population has declined at a much quicker rate than oil production, down towards zero. The US's high exposure to gasoline price rises (without Europes high tax base reducing percentage rises), and to a lesser extent electricity costs, is taking its toll. I expect May's consumer spending to be worse still, and to undermine the much trumpetted 'Goldilocks' economy, and put an end to the delirious Wall Street Rally. I fear reality maybe restored with a crash bringing Ace's predicted relatively smooth world demand curve down with it.
Am I alone in thinking that the Feds core inflation rate, stripped of energy and food costs, is the most perverse notion known to man. What kind of a person lives without food and energy- what/who are the FED trying to run the US economy for? Sure inflation is low if you blinker yourself to Chinese manufactured goods, but the resultant property/capital bubble from low interest rates is even less
sustainable than emptying the well. You can only see no evil, here no evil, until the reaper reaps. The economic bubble will burst soon as peak oil pressures build.
Crap. I just blinged up the Tahoe, and now this? Seeya later, I gotta go find some
suckerprivileged American suburbanite to sell it to.having seen this geological analysis, might i suggest a follow-on concept for economic analysis: peak money.
just as the world economy has been forever affected by peak oil, the oil-producing nations face peak money-some sooner than others; especially if more and more production is unavailable for sale, and is consumed domestically instead.
it seems reasonable that further information regarding the state of these fields going forward could be inferred based on factors such as saudi currency and "investment" reserves, and the changes in capital spending patterns in the oilfields and downstream. (for example, if the saudis stopped adding new wells to maintain current production levels, or if extensive tertiary production became economically unreasonable.)
is anyone here qualified to offer information regarding where the monoy is going once it reaches saudi arabia?
You pose the question of what happens to money in light of this reality? Depends on what backs your particular form of currency. If its a piece of paper with ink on it, or a few binary bits in someone's computer database, then slow devaluation as long as everyone goes along with the game.
Most likely your 'Federal Reserve' (google to make sure its truly 'Federal', and really a 'reserve') creates more out of thin air as needed. That liquidity makes it to the 'haves' first. You'll notice the markets doing well as evidence of this liquidity.
So more money = up market = richer rich and at the same time poorer middle class since. You need to know that ultimately you are talking about a fiat currency with nothing backing it but "faith". So now you can fill in the rest of the story.
BTW, I seem to recall a great piece on inflation/stagflation on TOD and a link here would be great. Anyhow, just wanted to add my two dollars. (oops 2 cents).
while i concur there is an excellent argument that oil prices will create a further transfer of wealth to wealth (and frankly, the chinese are in it deeper than we are, but will presumably be able to trade manufacturing of goods for oil), my real question was whether we could use ksa spending patterns as a way of measuring their preception of when peak oil has arrived.
it would be reasonable to assume that ksa interests (and other producing nations' as well) would start directing money to non-oil investments if there was a perception that the "well was going dry", so to speak, and that is the effect that i was referencing.
Sorry, but I don't see where you explained away the first drop in production back in 2003. Why is that drop a voluntary reduction but the current drop represents peaking?
I'm generally on board with TOD hypothesis, but I tend to question arguments supported by claims of this time being different. The new economy in 2000 was false. House prices rising to the sky forever was false. The current dismissive attitute regarding the world-wide credit bubble will most likely be false.
So, why is KSA peaking now? To date, they have never not responded to a supply crisis, so why does it have to be peaking today? It seems like you're hanging your hat and 16000 words on what very well may be a piece of refridgerator art done in crayon.
Perhaps we are post peak, but if it turns out to be another 5 or 10 years from now, I think TOD fatigue will set in.
All in all, it's a remarkably compelling argument. But an argument nonetheless.
See here.
OIl has tripled in price and rather than going back down like it always did before, a floor has been established around $60. Why? Supply is lagging demand and hence there has been a secular shift in prices. Don't miss the forest for the trees. We're over the hump.
matt
Indy
Gentlemen thank you very much for accepting my challenge and
quantifying the resource.
I personally wish to thank Stuart and Euan and Fractional Flow for a successful and fruitful collaboration.
As mentioned, the production decline is one important piece of the picture, and increased domestic consumption is the other.
This gives rise to much steeper declines in exports, as shown by the large cuts in Arab Light destined to Asia in June.
I hope one and all will now realize that we don't have much time to dilly dally on alternatives.
For the remaining doubters, go back to the comment mentioning ~ $7trillion through 2000..???? with $2.7trillion spent since then....
An economist would attribute this to inflation of the US Dollar, or deflation if the currency is a barrel of oil.
Regardless everything uses energy in its production, and everything.. will escalate in price....
Hello SS, F_F,& Euan,
Goosebump time?
Hey guys--found an interesting YOUTUBE video that shows some very interesting whole Ghawar and North Ghawar 3D simulations [although very brief flashes] circa 2006? the video is titled: The Magic Shaybah Oil Field in Saudi Arabia.
Go to 7:53 on the video counter clock, then make it freezeframe or move slowly. First is whole Ghawar, then a briefer flash of N Ghawar. What the hell does it tells us about Haradh and Hawiyah?
I would be interested in what you think, but does N Ghawar appear to match SS's keypost top graphic? Is the yellow topcrest in Shedgum the leak area or is it a gascap? Cheers!
http://www.youtube.com/watch?v=RJztP-Zy7zc
Bob Shaw in Phx,Az Are Humans Smarter than Yeast?
Yeah - somebody sent me this before, but IIRC, while it's definitely Ghawar, the color is height, not saturation.
Tried to /. this and,
Title Datestamp
Depletion Levels in Ghawar w/ Linux clusters Tuesday May 15, @05:24PM Rejected
:~[
Those geeks over at the cult of /. still think "technology" is going to save us.
where is the bumpy plateu update????
is the global production over 85 million/day????
i checked the EIA and IEA but there stuff
seems old, any better places I should look?
please tell me about the plateu!!!!
I'm working on updating those graphs for a piece soon.
Stuart, I found an error early on in the article...
Sorry, that's simply not right.
There are only 2 'e's in speed. ^_^
P.S. I only only noticed it when pulling a quote to reference this important work on my Blog. Thanks. I honestly think this is a signular example of using the internet precisely the way they envisioned it at CERN. Standing ovation.
Very nice work. The cross-validation with multiple data sources is especially impressive. It appears that if Saudi Arabia has spare capacity, it's not hiding in northern Ghawar.
Based on your figures, I get estimated R/P for the northern fields of:
From your depletion-rate figure, that leads to year-on-year depletion of:
From your production data, I get (mb/d):
Hence, the estimated decline in production over the first year is...
...and over the second year:
Total decline is thus predicted to be 0.7mb/d over the course of the first year after your analysis, 0.5mb/d over the second, and about 0.4mb/d over the next few.
If we're positing that your analysis explains the recent drop in Saudi production - i.e., the first year after your analysis was 2006/2007 - then we get a couple of conclusions:
Based on that, it seems that your analysis does not support the idea that Saudi production is going to plunge at a rate of 10% or more per year.
(Based on your average case analysis, of course. The (per-field) 1-sigma bounds are 0.41-0.97mb/d first year decline and 0.41-0.65mb/d second year, based on the error bars in your R/P plot, suggesting it is significantly unlikely that Ghawar's problems alone can cause Saudi production to decline at a sustained 10% year-on-year basis.)
Edit: put it in a spreadsheet. SS's analysis with no other changes to production suggests Saudi decline rates of 8%, 6%, 5%, 4%, and 3% over the first 5 years, with worst-case (all R/P at their -1 sigma level) of 11%, 8%, 6%, 4%, and 4%, and best-case (+1 sigma, per-field) of 6%, 5%, 4%, 3%, and 3%.
Well, not quite.
North 'Ain Dar is very unlikely to have stayed on plateau till an R/P of around 1, so it must actually have started to decline (with the remaining caveat about the gas cap model - if that was badly wrong, the picture might be a few years better).
The graph above relates the *final* R/P when plateau can no longer be maintained to the decline rate following the plateau. Basically, the sum of all the declined years production has to add up to the R at the end of plateau.
But what we don't know is exactly how long Aramco will be able to maintain the plateau outside of North 'Ain Dar. So we can't say exactly how much of recent declines should be attributed to north Ghawar. It's very likely some of it, may well not be all of it, and we can't say much more than that, unfortunately. At least on the evidence to date.
My gut feel is there's a little too much oil left in 2004 for us to be seeing 2mbd of decline already from this area. So either we've got some "save the last bit for a rainy day" behavior, or something else is declining too. But I can't be positive on that.
We can be a lot more definitive about the picture in the future. If plateau is maintained as long as possible, then in a decade, north Ghawar (north Uthmaniyah, Ain Dar, Shedgum) will be producing relatively small amounts of oil post flood and/or on tertiary recovery).
Of course.
I was just pointing out that the worst-case scenario for short-term Saudi production from northern Ghawar - i.e., everything in the north suddenly went into terminal decline all at once - isn't actually all that bad.
(That being said, a better case for short-term production - longer plateaus - may well be a worse case in terms of producing an oil shock, due to faster declines.)
How old are the non-Ghawar wells? Most of the production is off-shore, and the North Sea has shown us those can decline quickly.
On the other hand, it's always possible that they're telling the truth. Their production started dropping last year about a month or so before the price of oil started dropping, and that's roughly the time it takes an already-loaded oil tanker to get from the Persian Gulf to a buyer. If the oil's paid for after the journey rather than before, that could suggest clever timing on KSA's part.
Or merely a coincidental start to their decline. We're likely to know more in a few months, though.
Thank you very much, Stuart.
BTW, here is a nice overlay of ghawar over google maps. You can easily appreciate how big it is.
http://maps.google.com/maps?q=http://bbs.keyhole.com/ubb/download.php?Nu...