| The Big Crew Change: Turnover in the Oil Workforce | The Oil Drum: Europe | From sweet on the table to fuel in the tank: the millenary history of Sugar Cane |
Saudi production laid bare
Posted by Euan Mearns on March 19, 2007 - 10:00am in The Oil Drum: Europe
A couple of weeks ago I made a comment saying that we needed data on producing wells and drilling history in order to further analyse Saudi oil production. In answer to my wish Kyle posted a comment with this link to the OPEC Annual Statistical Bulletin which contains all this information - well almost.
So is Saudi production about to nosedive?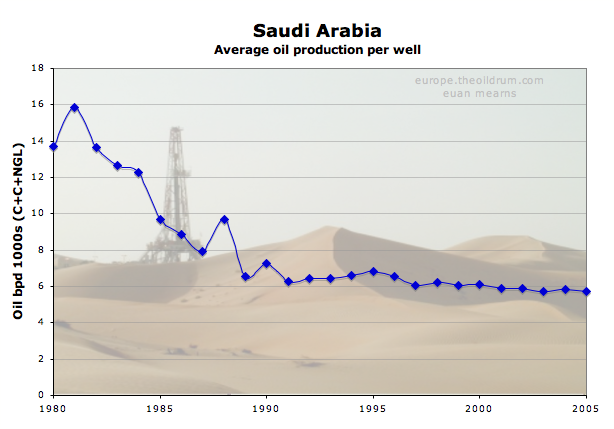
Background
This is the fourth article on Saudi Arabia in this recent series on The Oil Drum. Stuart Staniford set the ball rolling with his post:
Saudi Arabian oil declines 8% in 2006I responded with:
Saudi Arabia and that $1000 betTo which Stuart replied with:
A nosedive toward the desertThere's nothing like a good controversy to stimulate research. But where does the truth lie?
Stuart's position Oil production peaked in Saudi Arabia in 2005. Recent sharp declines in production are involuntary and Saudi Arabia has switched from swing producer to supply constrained producer.
My position Sharp falls in Saudi production since April 2006 are in part voluntary achieved by retiring wells. I say "in part voluntary" because it seems likely that the Saudis will welcome the chance to rest wells with high water cut or low reservoir pressure. When called upon to do so, I believe Saudi Arabia will increase future production through bringing wells out of retirement and a rolling program of drilling new wells.This post looks in detail at the drilling and production record of Saudi Aramco since 1980.
Summary
- Cross checking OPEC production and rig count data with International Energy Agency (IEA) and Baker Hughes data shows excellent agreement suggesting there is no reason to doubt the reliability of the OPEC data source.
- In 2005, Saudi Arabia had 1923 producing wells that on average produced 5740 barrels oil per day per well. This is astonishing high well productivity for an area that has been producing oil for over 50 years.
- The average well productivity has drifted down from just above 6000 bpd in 1991 to just below 6000 bpd in 2005 (Figure 1). There is no sign of a looming productivity crisis in these data and it would appear that increasing production may be achieved quite simply by drilling more wells.
- The data provide insight into Saudi Aramco reservoir and resource management in relation to their roll as swing producer. In the past, production has been reduced by retiring production wells and raised again by bringing wells out of retirement. All the while, Aramco have a rolling program of drilling new wells thereby increasing the total number of wells that are available for production.
- In my post of 7th March I suggested that the most likely explanation for falling Saudi production since April 2006 was voluntary restraint executed through a program of resting wells with high water cut or low pressure. The data presented here contain no evidence of a pending production crisis and voluntary restraint is still considered to be the most likely explanation for recent falls in Saudi production.
Data
The OPEC Annual Statistical Bulletin provides access to many data tables pertaining to OPEC and global oil and gas production. Click on the Oil and Gas Data tab to access Tables 36 and 37 which are the source of data presented in this post. Amongst other things these tables provide information on "The number of producing wells" in Saudi Arabia from 1980 to 2005 and the number of wells drilled each year.
As is often the case, not all the data you may wish to have is provided. In the drilling statistics, wells by type (oil, gas, dry and other) are specified for 1980 to 1991 and for 2002 and 2003 but for the other years only a total number is provided which slightly obscures the oil well drilling history. Furthermore, the producing wells are not broken out by oil or gas which adds marginal uncertainty to the data presentation.
The production data used in this post is that taken from the 1986 BP statistical review. These production figures are for crude oil, condensate and natural gas liquids (C+C+NGL). In the OPEC drilling data, I have combined the number of gas wells and oil wells. This meshes with the BP data - as a growing amount of liquids production in Saudi Arabia is from NGL that is produced from gas wells. This adds marginal uncertainty to the data analysis but does not prejudice the validity of the overall conclusions.
One data anomaly, deemed to be a data error, is present in the 1985 producing wells (table T37) where a figure of 731 is recorded. 1985 was the production nadir for Saudi and this figure is highly anomalous compared with the adjacent years. It has been arbitrarily changed to 371 to bring the data in line.
Data reliablity
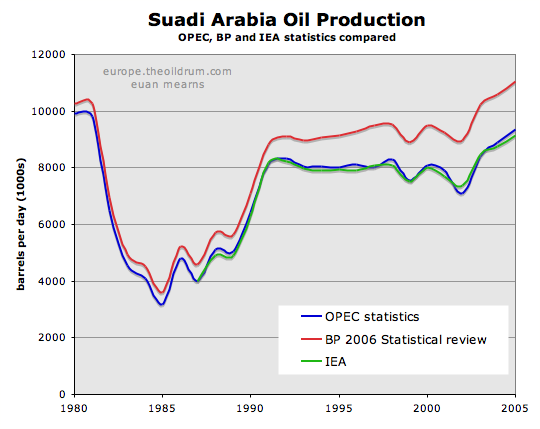
A number of commentators are sceptical about the accuracy and reliability of information produced by OPEC. I have therefore conducted a couple of cross checks between the OPEC data with other sources. In the charts below, the OPEC production data for Saudi Arabia is compared with BP and IEA data and information on Saudi rig counts are cross checked with Baker Hughes international rig count.
Figure 2 Saudi Arabian oil production. OPEC (Table T38), BP and IEA sources compared. The OPEC data is "Crude oil" and shows excellent agreement with the IEA data which is crude + condensate (C+C). The BP data includes natural gas liquids (NGL) which explains why this data tracks well above the C+C. Note how the contrbution from NGL has grow in importance since 1990. Click to enlarge (applies to all charts).
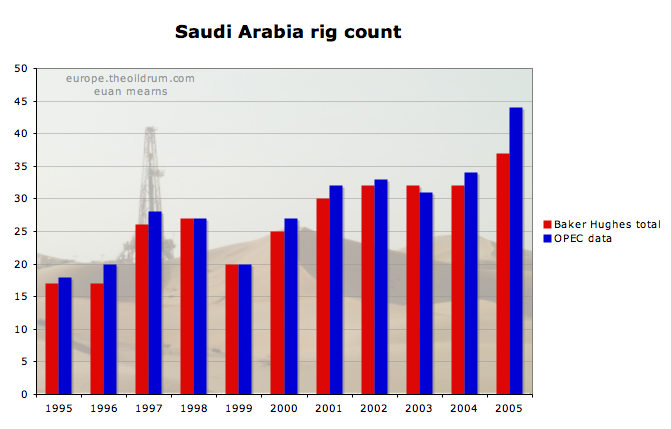
Figure 3 The number of active rigs in Saudi Arabia. OPEC (Table T35) compared with Baker Hughes (oil+gas+miscellaneous). The agreement is generally excellent apart from 2005 where the OPEC count is significantly higher than Baker Hughes. Note how the total rig count has been rising steadily since 1995, suggesting that the Saudis have been winding up their oil and gas activities steadily for the last decade.
In general terms there is excellent agreement between the OPEC data and other sources and I see no reason to doubt the validity of the drilling and well data provided by OPEC.
Producing wells and production
There is a close correspondence between the numbers of producing wells and oil production (Figure 4). But as discussed below, the correlation between these two variables is complex and masks a story of shifting reservoir management strategy, global supply and demand, swing production and geological constraints.
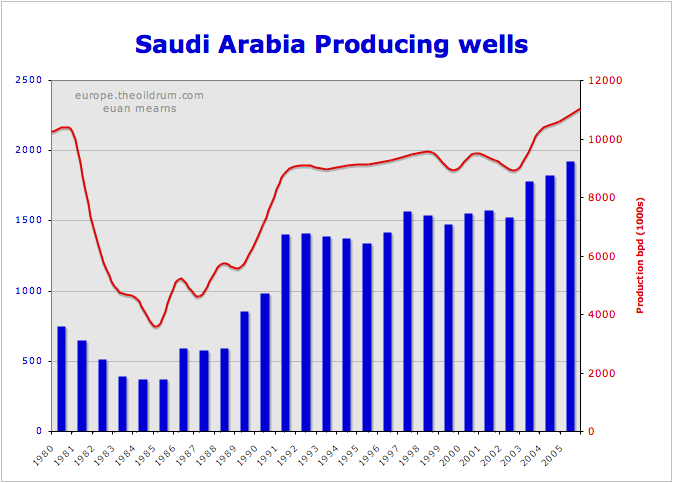
In broad terms, the number of producing wells was reduced from 1980 to 1985 in order to cut back production and constrain global oil supply at a time production was building in the North Sea, the North Slope (Alaska) and other areas. In this period, new wells were still being drilled and the reduction was achieved by mothballing wells and production capacity. Following the 1985 production low, wells were brought out of retirement and from 1985 to 1991, production was built back towards 10 million bpd.
Note how production dips in 1990 and 2002 correspond with dips in the number of producing wells. These are voluntary reductions in production brought about by retiring wells that may be brought out of retirement to boost future production as needs dictate.
In 2003 there was a surge in global demand and the Saudis helped meet that demand by drilling more oil wells that year (Figure 5) and by retiring fewer wells (Figure 6) resulting in significant jump in the number of producing wells (Figure 4).
Drilling history
Figure 5 provides some fascinating insight into the workings of Saudi Aramco. In the period 1980 to 1985 production was cut from 10 to 4 million barrels per day through a program of well retirements discussed above and yet they continued to drill new oil wells at a rate of around 100 per year throughout this period. It was only in 1986 that drilling activity was cut back (oil price crash) and the drilling low point of 1988 is offset by 3 years from the production low point of 1985.
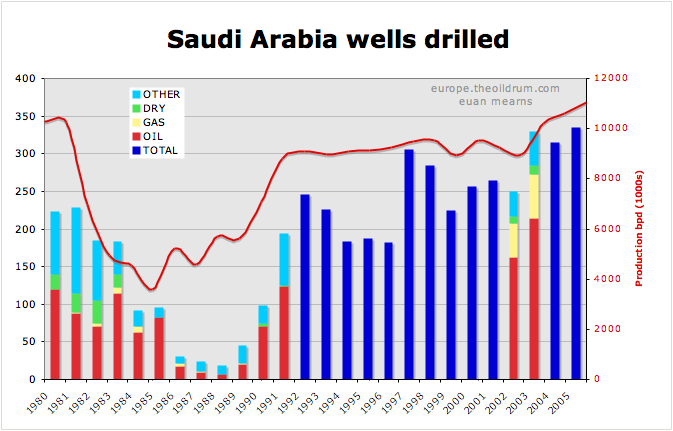
The overall level of drilling activity has been rising since 1991 (GW1) and it is a great pity that we do not have the breakdown by well type for most of this period. By 2002-2003 it can be seen that the number of oil wells being drilled each year had approximately doubled from the pre-1985 era and that there has been a substantial increase in the number of gas wells drilled. The rising number of oil wells drilled combined with more or less flat production in the period 1991 to 2003 is a sure fire sign that the average productivity of new wells is falling. This is perfectly natural, not surprising and does not signal an immediate crisis. The average productivity of new wells will most likely continue to fall. For example the Khurais development has target production of 1.2 million bpd using 300 wells. This suggests a minimum target well productivity of around 4000 bpd as some of the wells will be water injectors.
Well retirement pattern
What is meant by well retirement?
Saudi Arabia, as the biggest producer in the OPEC swing production cartel, have a long history of raising and lowering production to suit market needs. Part of the mechanism used to achieve this control is to shut down production in perfectly good wells. The other mechanism for lowering production is to choke back producers (lower production). Production may then be raised at will by re-instating retired wells, opening the chokes on restricted wells and drilling new wells. Saudi ability to raise production will be dependent upon the inventory of retired wells available to them at any point in time and to the capacity of production facilities. In his comment here, Kyle suggested that the Saudis may be retiring wells that were producing at 4000 bpd. This would be unheard off in the OECD and in most other OPEC countries. In my post of 7th March I suggested that the Saudis may elect to retire wells with high water cuts or low reservoir pressure. Resting such wells is good reservoir management practice. It must also be noted, however, that some wells that are retired may eventually be abandoned if their productivity is no longer profitable or if they have become obsolete.
Combining the data shown in Figures 4 and 5 enables an estimate to be made of the number of producing wells that are shut down each year.
number of retired wells = number of wells drilled - YOY change in productive wellsThis pattern is shown in Figure 6 and in Figure 7 the cumulative tally of retired wells is stacked on the producing well tally.
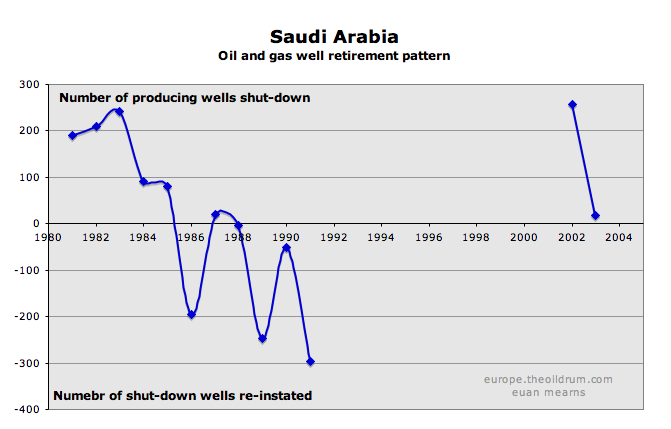
In the period 1980 to 1991 the Saudis essentially went through a cycle of retiring wells and then bringing those wells out of retirement (whilst continuing to drill new wells all the time). The peak cumulative tally was reached in 1985 (the production nadir) when the Saudis had mothballed 814 wells! By 1991, when all production was required during GW1 the tally of mothballed wells had fallen back to just 40.

So what might the current tally of mothballed wells in Saudi Arabia be? The paucity of data since 1991 makes this impossible to say. However, in 2002 a staggering 257 wells were mothballed. In 2003, which was the first year of the recent production surge, the Saudis still had capacity to mothball or abandon 18 wells. The production increase that year was achieved by adding 214 new oil wells and not shutting down a large number of older wells to compensate.
The period 2004 to 2005 I imagine may replicate the pattern of 2003, where new production was added by simply drilling wells without retiring older wells. If there was any production shortfall then the Saudis will have had 257 wells rested in 2002 to fall back upon. 2006 saw the commissioning of the Haradh III project, although this only has 32 production wells. Haradh III was a high profile mega project development but the number of producing wells is not hugely significant compared with the annual drilling program (unless of course a trilateral is counted as 3 wells).
Production history
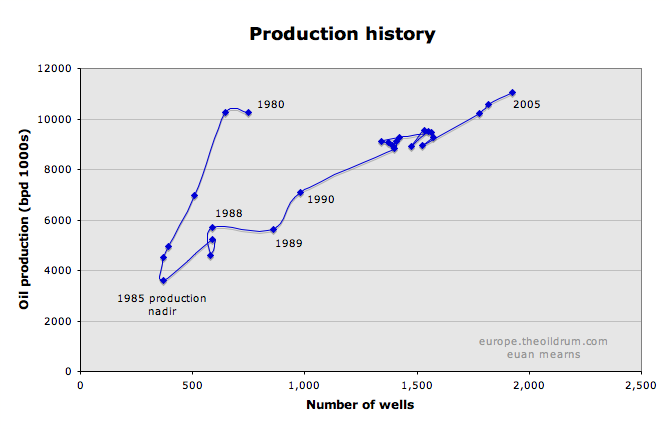
Saudi Arabian average daily production per year is plotted against the number of producing wells in Figure 8. This provides fascinating insight into Saudi reservoir management practice. From 1981 to 1985 production did nose dive from over 10 to below 4 million bpd through a program of planned well retirement. Then in 1985 Saudi policy was changed in order to maintain market share, production was raised and the oil price collapsed in 1986.
Between 1988 and 1989 production was held constant even though the number of producing wells was raised from 590 to 858. This would seem to signal a new approach to reservoir management with lowered flow rates and production sustained from a larger number of wells. The constant trend of 6000 bpd per well was established in 1989 and it would almost seem that this has been a target well productivity for the Saudis since then.
The great knot of data points at around 9 million bpd represents the "plateau years" of production from 1991 to 2002. Then in 2003, with rising global demand and falling production in the North Sea and other areas, the Saudis were called upon to ramp up production which was achieved with relative ease by simply adding more wells through drilling and reducing the well retirement rate.
That $2000 bet
So where does this leave Saudi oil production, peak oil and the end of the world as we know it? Regular readers of The OIl Drum may think I have become a cornucopian. I assure you not at all, I'm simply looking at data and drawing reasonable conclusions.
Saudi ability to sustain and grow production is dependent upon the availability of new good quality mega projects to develop and the cupboard in this respect is beginning to look rather bare. Khurais due on by 2009, some off shore field developments and further development of gas resources (NGL) should provide sufficient resources to sustain production, and perhaps modest growth, for a few years at least. And as Stuart pointed out the Saudis will likely have a huge number of smaller fields to develop, though I very much doubt many of those will be brought on stream by 2008.
Hubbert linearisation suggests that Saudi Arabia is in the vicinity of 50% depletion of their ultimate recoverable developed reserves. Declining Saudi production therefore is probably only a few years away.
In his last post Stuart raised the stakes on his wager to $2000. So let's have a reminder what that wager was:
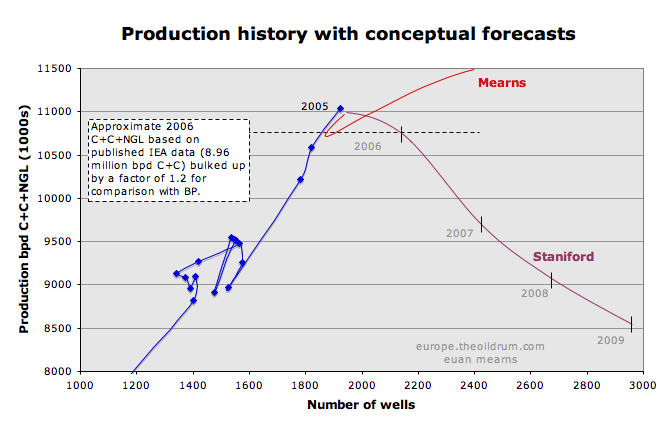
I'll bet $1000 (now $2000) with the first person who cares to take me up on it that the international oil agencies will never report sustained Saudi production of crude+condensate of 10.7 million barrels or more.
In BP currency of C+C+NGL that equates to around 12.8 million bpd. Figure 9 shows the fundamental difference between my position and Stuart's and also illustrates why I'm not about to take on Stuart's bet. Stuart has called a peak in Saudi production in 2005 and no matter how many wells they now drill, he forecasts that production will continue to slide in a manner similar to that shown. My position is that recent falls in Saudi production reflect voluntary restraint achieved by retiring wells and that production may rise again in the future, dependent upon global demand picking up.
So what difference does this make for global energy markets? A look at the oil demand forecast for 2007 from the IEA gives some insight.
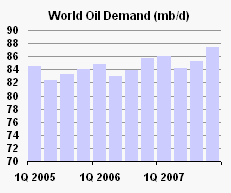
The IEA are forecasting demand to rise strongly by around 3 million bpd between the second and fourth quarters. Saudi Arabia would normally be the main country called upon to meet this increased demand. If Saudi production falls instead by around 1 million barrels per day, as modelled by Stuart, then a supply crunch and energy crisis will likely unfold. According to my view, Saudi Arabia, together with other OPEC countries will raise production to meet this demand challenge. We will see another squeeze on reserved capacity, higher prices and demand destruction, essentially repeating the cycle of 2005 / 2006. Every squeeze such as this will bring us one step closer to peak oil which I still see as 2012±3 years.
Personnel
Editors
Contributors
Peak Oil Primers
Archives
- November 2010 (3)
- October 2010 (6)
- September 2010 (4)
- August 2010 (7)
- July 2010 (6)
- June 2010 (7)
- May 2010 (2)
- April 2010 (8)
- March 2010 (4)
- February 2010 (6)
- January 2010 (3)
- December 2009 (5)
- November 2009 (8)
- October 2009 (12)
- September 2009 (6)
- August 2009 (5)
- July 2009 (11)
- June 2009 (8)
- May 2009 (16)
- April 2009 (10)
- March 2009 (7)
- February 2009 (10)
- January 2009 (15)
- December 2008 (9)
- November 2008 (9)
- October 2008 (9)
- September 2008 (13)
- August 2008 (10)
- July 2008 (14)
- June 2008 (23)
- May 2008 (16)
- April 2008 (12)
- March 2008 (16)
- February 2008 (9)
- January 2008 (13)
- December 2007 (13)
- November 2007 (16)
- October 2007 (22)
- September 2007 (8)
- August 2007 (9)
- July 2007 (16)
- June 2007 (8)
- May 2007 (7)
- April 2007 (7)
- March 2007 (10)
- February 2007 (10)
- January 2007 (12)
- December 2006 (9)
- November 2006 (15)
- October 2006 (4)
- September 2006 (5)
- August 2006 (5)
- July 2006 (9)
- June 2006 (5)
- May 2006 (10)
- April 2006 (9)
- March 2006 (13)
Vital Trivia
License

This work is licensed under a Creative Commons Attribution-Share Alike 3.0 United States License.
Forget ye not the diggs, the reddits, and the linkfarms!
The average production per well, since Saudi production is 100% under secondary recovery, shares an inverse relationship with the stability of the production stream. Anyone who has been in this business for any time would rather have 10,000 wells making 100 bopd than 10 wells making 100,000 bopd under waterflood. This is especially true of Saudi since most of their developed oil is of low viscosity and individual well breakthrough is a dramatic, career ending event.
In addition, anybody who knows anything would also rather have 10 MMBOPD at 90% water (Russia) than 10 MMBOPD at 20% water (Saudi). Ten million a day at 20% water is 1.2 MMBOPD at 90% water, capeche??
The ballgame in Saudi Arabia is Ain Dar/Shedgum and Uthmaniyah areas of Ghawar. They represent 50% of every production curve that gets thrown up here 3 times per day. By Saudi's (Saleri's ) own admission, they are 70% depleted. I have graphics of a fractional flow curve overlain with Saleri's pie chart of the Ain Dar/Shedgum reserves to show how aggressive their reserve forecasts are. Even still, Saleri tacitly provides a 60 Bbbl reserve estimate for Ghawar at 1/1/04 and the most I can come up with from the individual areas is 30.
P.S. The reason the HL for Texas in 1960 is 20 billion barrels low is that secondary recovery was not widespread at that time. The 20 billion barrel shift is probably pretty close to the waterflood oil displaced in the state of texas. Saudi HL is a waterflood case. No such shift expected.
I need someone to post some graphs (not charts those are marketing) or teach me an easy way how.
Drill or Be Drilled
The reason the HL for Texas in 1960 is 20 billion barrels low is that secondary recovery was not widespread at that time.
No, that isn't why. Those are rationalizations that people are offering to explain the data, but I am about to show that this is not the case. I am working on this essay right now. I don't want to give too much away, but I will say that the HL has a predisposition for underpredicting URR. In fact, in some of the idealized cases I have plotted, the HL is underpredicting URR by more than 90%!
Knock yourself out.
I question the ability of the daily oil production curve manipulated in any manner to accurately predict ultimate recovery anywho. By the time it works nobody cares anyways.
The key lies in the pore volume.... So+Sw+Sg=1. Hubbert knew this better than anyone. And those answers are out there if you look hard enough.
And the Saudi's have an Sw problem in their principal producing areas.
"The key lies in the pore volume.... So+Sw+Sg=1"
"the Saudi's have an Sw problem in their principal producing areas"
Fractional Flow, I would greatly appreciate if you could explain to the uninitiated what So, Sw and Sg are. #
Also, what is the "Sw problem" and is this publically available information or something you have come across in a professional capacity?
many thanks
So= Oil Saturation, % pore volume occupied by oil
Sw= Water Saturation, % pore volume occupied by water
Sg= Gas Saturation, % pore volume occupied by gas.
1= So + Sw + Sg
whether your talking about 1 ft3 or the total of Ghawar
for Ghawar, always operated above bubble point so Sg=0
So
1= So + Sw
And for Ain Dar Shedgum Soi= .85 (initial oil saturation)
Sor= .21 (residual oil saturation)
And the pore volume is 105 Bbbls.
The Field has recovered (1/1/04) 27 billion barrels and the oil shrinks 34% from the reservoir to the stock tank so the current oil saturation is
So= . 85- 27*1.34/105= 50.5 %
and the current (1/1/04) water saturation is
Sw= 1-.505= 49.5%
And at 2 MMBOPD, the water saturation is increasing about 1% year or it is now about 53%....
Producing the field by drilling horizontal wells in the top or shutting in high water cut wells doesn't change any of this....
and this is a problem
Thanks, as I suspected, the explanation has led to more questions....
Is "pore volume" the same as "oil originally in place"? For Ain Dar/Shedgum am I correct you are saying that is 105 billion barrels? Where did you get the 105 billion barrel number and are there similar numbers for other parts of Ghawar (and indeed all other Saudi fields)?
When you talk about shrinkage, are you talking about "non-recoverable reserves"? IE a 34% shrinkage implies that of the 105 billion "pore volume", shrinkage will be 34%, or approx 36 billion barrels. Which in turn would mean that recoverable reserves would be approx 69 billion abrrels, of which 27 billion barrels have already been produced?
As Sw increases, I assume there is a knock-on detrimental effect on daily oil production capacity. Is there any way to quantify this?
thanks again.
Pore Volume is not OOIP.
OOIP= Pore Volume * Initial Oil Saturation/ Formation Volume Factor
(Boi)
Yes I am saying that is the Pore Volume for Ain Dar/ Shedgum.
I am not aware of other numbers... except 38 billion for Haradh... but
Uthmaniyah is unknown. Let's stick to Ghawar for now.
Shrinkage is the loss of volume in the oil due to the dissolved gas an
is expressed in the formation volume factor. For Ghawar, it requires
1.34 barrels of oil in the ground to make a barrel of oil in the stock
tank after the gas evolves.
If you have Saleri's 2005 CSIS presentation, he presents a pie chart of
the reserve classifications for Ain Dar/ Shedgum and 17.1 billion
barrels is contingent resources. Any reservoir engineer assumes that
this is residual oil to waterflood. You then have everything you need
from that pie chart to derive the residual oil saturation, the initial
oil saturation, the current oil saturation..... and there is only one
pore volume which makes it work it is approximately 105 Bbbls.
Yes there is a technique to calculate water cut behavior as a function
of water saturation and hence oil producing rate it is called the
fractional flow curve.
I can only speak for myself, but it appears to me that you have a core competence (reservoir engineer?) that I have not seen before on TOD and believe you could add a lot of technical colour to some of the discussisons that take place here. I am certainly fascinated by your numbers and apparent expertise with regards to Ghawar fields and would love to see you expound further on this, perhaps with a full length post?
Could you give us some background on what you have done professionally?
Thanks again.
What he said.
Perfect Leanan
:-)
I agree. But Fractional_Flow needs to append a translation at the top or bottom of his work so that mere mortals can at least understand the gist of what he's talking about.
Thanks.
I am a reservoir engineer and oil company owner who has done nothing but waterflood work for essentially 21 years.
I have an MSPE from Stanford. I am running a reservoir simulator simultaneous to answering your post right now. Although I run reservoir simulations, I am a back of the envelope kinda guy. You have to know what makes the simulator do what it does... a good simulation hand knows what the answer will be before he makes the run.
Saleri's presentation is actually the holy grail. There are also 2 aramco spe papers from 2005 that would scare the crap out of you if you know what you are looking at.
This is the most onerous, pandering statement in the entirety of the peak oil debate.
Bye for now.
Interesting bio, thanks for sharing.
Any chance of a link to the Saleri presentation or the Aramco SPE "crap expellent" papers? Alternatively, and appreciating that your time is precious and that you have a company to run, an insight into what these papers discuss.....
Pushing my luck now, I know, but I am sure it is worth the effort....
I believe that the article being refered to is to be found here and was the debate between Matt Simmons and the ARAMCO folk at CSIS in 2004.
HO
Saleri preso here:
Saleri preso
From a thoughtful and detailed critique of Simmons by petroleum engineers:
Simmons critique
The critique includes a caution against generalizing SPE papers to the whole of Saudi production. To paraphrase: "SPE papers represent technical challenges, not a survey of overall practice or operations."
CW
Global peak: 2007 - 2010
Global decline rate, Post peak: 2%
Economic response: Severe global recession, ~5 years, then slow recovery
Simmons critique-
Simmmons technical editors killed him.
The whole bubble point/reservoir pressure dew point think- he couldn't have missed the mark any further.
The critique is a bunch of drivel that doesn't get any closer to the actual problem- which is 4 MMBOPD at Ain Dar/Shedgum and Uthmaniyah resting on the precipice.
What is? What Euan wrote?
No- I am sorry.
This is the text from Saleri in reference to Ain Dar/Shedgum
I got locked up on a cut and paste and had to go.
"Well, compare that with the reality. The reality is you're producing two million barrels and probably going to be producing two million barrels for a few more decades at very modest water cuts. So obviously your reserves are much much higher than 40 percent. That's the explanation for the type of reserves we're carrying which again are very conservative on the basis of actual field performance.""
Thanks for the clarification.
I thought he meant his reference to the Saudi's own work being the "holy grail," as in pandering to the Saudis themselves. But I'm probably wrong.
Cool.
So I have a question for you. The only reason I believe in HL is that the concept is similar to statistical thermodynamics.
The equations of classical thermo dynamics and the physical interpretation are completely bogus but correct. The reason it works turns out to be because of statistical thermodynamics and the fact that the quantum properties measured by thermodynamics average to a bulk number. Classical physics fails miserably when the number of quantum states is small so a statistical population cannot be built.
A laser for example even though its population dynamics are statistical the small number of states result in a quantum phenomena unlike a regular light bulb.
You should be able to do a similar analysis connecting the real geology to a ensemble and thence to statistics.
The problem is to make this connection you have to really know what your doing. Its one of those cases where the result is obvious and beautiful but knowing how to set up the equations requires brilliance and a deep understanding of the problem.
The only reason I believe in HL is that the concept is similar to statistical thermodynamics.
Let me ask you a hypothetical question. Give it some thought. If I show a case in which the only information that we know is an oil production rate, and that it increases by some increment every year, what do you think the HL is going to look like? Would you begin to have doubts if, when fed this information, it actually predicts a URR and a % Qt?
To reiterate, we have a rate that increments upward every year. What will the HL show?
How is that? I observe an asymptotic function that never intersects the x axis.
I do have strong reservations about the information content in a period of flat production, though.
How is that? I observe an asymptotic function that never intersects the x axis.
That's true when you run the production out to infinity. But if you stop and then extrapolate - say 20 years into your production - you do indeed predict some weird stuff. The problem is one someone mentioned on the other thread: We are attempting to linearize a non-linear function.
That's not quite it, I don't think.
The HL method is making an Ansatz (assumption) about an underlying functional form of oil production over time which is an essentially empirical one, but one with some support.
If you have production increasing every year, then you are still on the exponential upgrowth phase of a logistic curve and therefore the fit is indeterminate on distinguishing a HL based logistic production curve (which peaks later) or one which continues upward.
In this case the HL method is not suitable because in a Bayesian sense, many curves are compatible with data observed so far.
A logistic production curve of course has an functional form of an exponential at the beginning, so this degeneracy is not surprising.
Now the fact that in some regimes a fit to the HL Ansatz is unstable or not precise does not mean that the same is true in other regimes, namely fitting a curve with data which have peaked. Here, that instability/degeneracy/large Bayesian posterior uncertainty which would be present in the "early growth" circumstance would not be present now if we believe world oil production to be reasonably well goverened by the logistic model.
The fact presently is that the world production of conventional oil has peaked roughly 18 months ago.
A number of explanations which explained the prior world false peak (early 80's) are not tenable this time:
* There are few very large involuntary shut-ins (Tanker Wars)
* economic growth during this period has been strong
* oil prices are sustained and high
Only the supposed Saudi voluntary shut-in (which is reasonable but uncertain) can be a mitigating factor.
Even though the HL is unrealiable in some circumstances, it does not necessarily follow that it is unreliable in all circumstances and this is where people are talking past one another perhaps.
The flaws can be:
1) mathematical fitting problems
2) non-economic non-geological disruptions
3) fundamental flaw of underlying Ansatz to describe real data
In some limited circumstances of subsets, in the absence of (1) and (2), then the real data tend to be compatible with (3), which is why it was proposed to begin with.
An interesting exercise:
Suppose one were to "back out" a decent guesstimate for how much additional, and voluntarily waived, production potential the Saudis had at any time recently, and added that as "virtual production" to the world production curve, "as if" they were producing all out.
What would a HL estimate for a peak and ultimate reserves in that circumstance? I'd take that as a reasonable 'optimistic but not delusional' upper bound for peak oil. Who has the models ready to go here?
My wild ass guess: 2015-2020.
The connection to statistical mechanics is essentially not to concentrate too narrowly to the individual particles, which can react unpredictably, but instead look at the collection of particles as a whole, which tend to follow a statistical average.
But I think you know this.
In a way, I find it kind of pointless to ponder the dynamics of a few oil regions in Saudi Arabia when we have the statistics of the rest of the world and historical data to consider. In other words, a few extra energetic particles won't sway it too much one way or another.
I agree the only reason that KSA stands out is because they have made what many believe to be outrageous claims.
I'm sure you could find someone today with mathematical skill and if you gave them the HL theory and various blind data sets and let them calculate they probably would reasonably predict the same peak date for KSA as we have.
The troubling aspect is one of the cornerstones of the oil society seems to have literaly told the lie of the century.
Increasing QT.
The whole point of the model is that production does not increase every year it peaks. So HL has some predictive power pre-peak certainly open to debate. Next post peak it seems pretty good until you get into the long tail where production is constrained by the nature of the recovery method. Water handling nitrogen handling steam etc. Enough oil is left in the ground from primary and secondary extraction that given enough money you can produce the fields for a long time at low production rates and EROI using advanced methods.
I've said a few times you have to bracket the HL using other information if you don't accept this then you can prove HL is wrong all day long. Since it is a empirical model the connections between HL and the real geology are complex at best.
And finally if you read my post about stat thermo all I'm saying is that the real geology can be treated in the same manner as stat thermo treated using statistical methods to derive higher order equations that describe the bulk this can be extended to groups of fields etc. It would be nice to have a solution developed from first principals but for now the logistic curve is good enough. We know from other processes that the bulk behavior is statistical.
To use another example consider a pile of sand the forces that effect a pile of sand vs a bucket of water are quite different and operate on different scales. But they both average to overall fluid equations for flow. HL is simply a proxy for these unknown fluid equations which are themselves only valid withing a given range.
Now with all that said if the bracketing of HL is simply to contrived then I'd say drop it. If a reasonable set of methods can be used to bracket HL then its useful.
I don't know what your going to write by my interest is in HL applied within say +/- 20% of peak. I could care less about its behavior outside this range. On the front side the data may be too noisy on the backside you have obviously peaked so you don't need HL nor does it apply as production moves to technically constrained.
The trick and the part your rejecting is that you have to have other information to determine if you think your within 20% or so of the peak. And even after this you need additional information to narrow down the actual peak year.
Now if someone comes up with the equivalent of stat thermo for the problem and can derive the real equations from first principals I'd drop HL in a heartbeat but I suspect they won't be all that different. Without this HL is the only method we have does not result in parameter explosion and bias.
I've said several times that most people modeling peak oil get sucked into the long tail region where a lot of oil will be produced at low flow rates. Just about everyone that starts doubting HL seems to focus on this region. We do have a lot more oil to produce and advanced methods may increase URR but its not going to change the fact that post peak we will consistently have demand exceed supply and thats all that matters. Once the economics of oil change the party is over.
So I could care less about 75% of the oil left to produce its the first 25% or even 10% post peak thats useful the rest is irrelevant since the geopolitical/social issues will determine if this oil is produced and what it is used for. Basically once we have a supply/demand wedge develop greater than say 4mbpd forget about the models since above ground factors will control oil production.
The whole point of the model is that production does not increase every year it peaks.
Yet I will show you it calling peak even as production is increasing.
The trick and the part your rejecting is that you have to have other information to determine if you think your within 20% or so of the peak.
No. I have debated this other information plenty of times. I have repeatedly addressed the Saudi cuts last year. That is "other information."
Without this HL is the only method we have does not result in parameter explosion and bias.
You might change your mind after my next essay. It may turn out that we just don't have a working model. If I am using a model to make decisions, and it only works part of the time - and I can't tell when it is actually working - then that is no better than having no model at all.
I look forward to your contributions.
I have no problem throwing HL out if it makes sense to do so.
For now we lack a better model and I'm not yet convinced HL is
useless.
With that said a model like HL should work if producing oil behaves in the same way as heat fluid dynamics etc where bulk properties arise from intrinsic micro physical constraints.
I don't agree with the multi-parameter macro models simply because we don't have enough information. The bottom up approaches however seem to make sense except its hard to justify the decline rates used and they don't predict URR.
They do give us a good idea of production rates.
In any case we will see.
Yet I will show you it calling peak even as production is increasing.
Robert: of course you can make up contrived fake data that would throw HL off. That does not disprove HL for real data.
Memmel's point is that in the real world, for a large enough region, due to statistical aggregation, real data usually tends to behave like Hubbert's curve.
I'm not sure this holds for Saudi Arabia though, due to so much of their output coming from one huge field. But perhaps that's still OK, since one field is not one well, and Ghawar is large and varied enough that it conforms to some statistical trends. Like the East Texas field.
To be exact its a empirical proxy for the real equation that could be derived from first principals "in theory".
Without the real statistical equation derived in a manner similar to how thermodynamics is derived from quantum mechanics via statistical thermodynamics its ...
Good enough :)
Statistical mechanics is used to derive bulk properties from molecular models - including "classical" molecular models.
I understand your analogy, but quantum mechanics at the molecular level is not required for statistical mechanics to apply.
I suspect that if such a technique were used, the "fixed" parameters would be critical, and depend on information that no one will agree on, like URR, etc. If the model got at all complex, the math probably would become intractable... so you would do what the stat mech people do... run simulations.
One reason in one post I said "in theory" you can calculate this. I don't think its as intractable as you claim. And it does descend to the quantum level because the wetting of a porous hydrophilic surface by a hydrophophic long chain hydrocarbon is a quantum event.
I think its doable since in chemistry we have a theory about a very similar process used to separate chemicals in chromography. Its called theoretical plates. Note the theory part is prominent in its name.
http://en.wikipedia.org/wiki/Theoretical_plate
A theory for oil extraction would be similar. A key point of this theory is that two things remain close to constants
regardless of how you change the parameters.
1.) The time it takes for a particular chemical to elute i.e
its peak.
2.) The overall volume i.e URR is a constant.
The curve can be sharper with a higher peak or broader but the time is basically a constant and the total volume is a constant.
I know this theory well or better used too. I'd expect and basic theory of oil extraction to end up with the same basic result. If you produce a region close to its natural rate you will peak at a certain time and next the URR is basically a constant.
All your doing by being a swing producer is flattening the peak over a few more years and the use of advanced extraction just makes the peak sharper. KSA has used both approaches in addition to secondary water drive on the fields. In fact in my opinion the two factors of using horizontal wells and secondary water drive makes the swing producer argument mute its lost in the noise compared to the other two effects.
With my understanding of Theoretical Plates I'm happy to be quite stubborn about the peak date and total URR being practically constants I cannot see anything changing this since it can't be altered in chromatography.
HL fits as a approximate model for oil extraction related to theoretical plates and it is trying to measure the two conditions that are known to be constant from a similar theory chromatography.
Even better the theoretical plate model fails in about the same places where HL fails for basically the same reasons.
Now with that said the theoretical plate model is not the right model for oil extraction but a similar model is needed and it will behave in a similar fashion.
In fact I would have to assume that a model like the chromatographic one has been developed for oil any chemist that works in the oil industry would see the equivalence in about ten seconds. The first time I read anything about a real oil reservoir I said hey that's just like our chromatographic columns. Someone in the field should be able to dredge up a reference this is too obvious.
Agian I think its premature to throw out HL.
Robert: of course you can make up contrived fake data that would throw HL off. That does not disprove HL for real data.
I am not talking about feeding it just random data. I am talking about feeding it specific trends and seeing how it behaves. For instance, if I feed it a consistently increasing production rate, and yet it predicts an imminent peak, we have a problem. Would you disagree?
Robert,
I think you have to make sure you don't apply the HL model too early. In your hypothetical case, you are applying it too early because your production rate is still "consistently increasing." You need to wait until the data settles down, i.e. probably until some point at which production is continuing to increase, but at a steadily decreasing rate. (From what you've described about your hypothetical model, it will never exhibit this behavior and therefore never produce a valid HL.) Khebab and others have some good rules of thumb for this.
I had occasion to pull out Beyond Oil a couple of days ago to find a passage for Asebius, and I just ran across another passage which indicates that Deffeyes had the same question of Hubbert's 1956 prediction:
From Beyond Oil, Chapter 2 - Where Oil Came From: The Hubbert Outlook, pp 29-30.
That sounds about right. He would still need to be aware of discovery in the region and have some idea on how much of the discovered areas had been produced. But yes I'm saying once it settles down you should have a good number.
My rule of thumb is within 20% of peak but decline but sustained production is enough or it seems to have been enough for Hubbert.
THank you thank you.
I can't understand how people, Peak Oil Cognizant people talk about how much oil will be produced in 2015 - 2025 or something as if it will be business as usual. Those who aren't getting any will just sit down and say "Darn It".
As you said, After it Peaks AND ALL the PLAYERS KNOW it has PEAKED... Game over. The masks will come off, and true raw emotions will prevail I am afraid.
It will be like ten guys all oiled up and trying to be the first one to climb a greased pole. Each hand that grabs for that nigerian sweet crude will have to run the gauntlet.
BTW and I think you know this in chemistry we have the theoretical plate model to normalize chromatography.
http://teaching.shu.ac.uk/hwb/chemistry/tutorials/chrom/chrom1.htm
A similar sort of model should hold for oil extraction.
A couple of comments on that:
I understood that the logistics model was originally observed to follow the behavior of a single oil well, and then on that basis, was predicted to describe the behavior of fields (countries, the world...). This logic is reversed from the stat. thermo analogy.
Also, one could ask if any oil-producing region is a large enough ensemble to average out the differences. In particular, KSA has Ghawar which is the elephant in the field, unless it is argued that it behaves as the statistical average.
On a related note, you state (further down) that HL is not a physical model, and that is strictly correct in that one doesn't derive it from first principles. However, it relates the production rate to the total produced relative to how much was there originally, and one could see how this could arise from real physical parameters (pressures etc.).
Not sure about reversed :) Historically we had thermo first then figured out why it worked much later.
The right statistical model for Oil fields needs to include or derive from the field geometry factors and should include at least some way to model changing well technology. HL does neither actually thats why its really a empirical model semi derived from real data. My point is that I don't see how HL is all that different from the "real" statistical model done from first principals since using real production data tends to take into account these factors. If and this is a big if you feel you have interpreted the data correctly. I'd hesitate to make any real connection between HL and physical production.
The macro relation of produced OIP in place and production rate could be fitted to any Gaussian like distribution so the correlation is weak. We could easily find another macro model that works better than HL but I don't think considering the noise in the data it makes a big difference.
How to say this ...
From first principles we know something like HL will result if we modeled the system correctly and the data has a lot of error so why not just use HL ?
My point of contention if any with Robert is that such a model does and must exist I'm not overly concerned that we have not developed the exact model since it does not change the ramifications of peak oil and the bottom up methods tend to agree within the error range with HL. Picking the exact year of peak is simply and art if we are right then fine if not no biggie we can't confirm world peak until we know the world decline rate is hight enough that we will never bring projects online fast enough to recover. This is at the minimum two years after peak. I've said a few times that even then it will be controversial but its important to build a strong case that peak is behind us. HL may or may not be useful for this case. Post peak its seems pretty good so I'd say its useful.
To repeat myself its the decline rates that come out of HL that I like foremost and the URR estimate of what I call easy oil second which is the oil recovered from beginning production till say 20% post peak or the stuff we can get at high production rates.
Not overall URR which I have zero interest in KSA may be producing 1mpd in 100 years for all I know I don't see how that effects us today.
memmel,
I did not completely follow this and several of your other posts about the analogy between HL and thermodynamics, but it sure reminded me of some Central Limit Theorem discussions here on TOD a while back. See
Predicting US Production with Gaussians
Yes Guassian would probably work also. Several different curves have been used. In general we don't have a strong reason to choose one method over the other. In this case the data has enough error that the detailed shape of the curve is probably not all that important. If someone comes up with good reasons for using another model and it is in agreement with the data from known regions that are in decline switching models is probably the easiest thing we can do :)
The point I've come down to is pretty simple regardless of the shape of the curve the date of the peak and URR are pretty much constants. How you produce the fields and other factors are simply changing the shape of the curve but the total URR i.e the area under the curve and the position of the peak are fixed.
A simple triangle might even give good results.
I might add that if you think about it picking the peak year is not that onerous its basically picking the peak date within 1-2% if the field is produced for 50-70 years.
Now picking the peak month ....
Man, I LOVE THIS SITE!!
You never know who is going to post some really pertinent details about the oil business. And for Peak Oil as in all else, the devil is in the details.
Thanks for sharing your expertise Fractional_Flow.
(addressed to fractional flow) i can agree that a fundamental understanding of reservoir engineering is more useful than the results from a simulations study. however, if you already know the results, aren't you wasting your time running the model ?
Hi f - welcome to the board...
If you have Saleri's 2005 CSIS presentation, he presents a pie chart of the reserve classifications for Ain Dar/ Shedgum and 17.1 billion barrels is contingent resources. Any reservoir engineer assumes that this is residual oil to waterflood.
Nice analysis, but if it has a weak point then this is it. I don't think you'll find "contingent resources" defined in either the SEC or the SPE definitions - which of course is just what Saleri wants, as most of the scribblers in his audience would be arts graduate scum (economics at best). What happens to your calculations if you assume a more conventional waterflood RF? I won't start an argument by suggesting a number myself...
Cheers,
PUD
I'm totally comfortable with the analysis.
SPE 93439 "Water Management in North Ain Dar, Saudi Arabia"
Here, Aramco twins an injection well lost due to mechanical failure and cuts a sponge core as well as carbon/oxygen logs the Arab D to result in a residual oil saturation to waterflood of 21%.
It all matches with a pore volume of 105 (it's actually 109.. I'm sorry about the round down) but I did this quite a while ago.
And if you look at Saleri OOIP for Ain Dar/Shedgum, and use the 109 and an 85% Soi and 1.34 Boi, it all matches.
Can someone translate this ?
Was er sagte, war, dass wir in der tiefen Scheiße sind.
Damn near made more sense to me :)
Actually from my chemistry degree we do similar stuff to perform separations. A oil field has a lot in common with HPLC. High Pressure Liquid Chromatography. But we actually want breakthrough while the goal with oil is to not let the system separate or fractionate. It seems everything I was taught to try to do in chemistry is wrong for oil.
As a chemist I'd probably de-pressurize the reservoir let the gas bubble out first then extract then oil with a strong water drive causing the oil components to fractionate. Completely and utterly wrong :)
He said we're in the deep shit.
That's what I thought he said. :-(
Guys-
I'm sorry but here goes.
Poster Lucky_Underdog questioned my assumption that 17.1 billion barrels of "contingent resources" provided by Saleri in May 2005 CSIS is the Waterflood Residual oil.
He rightly but tacitly asserts that no one in their right mind would have the balls to call any type of actual field reserves right up to that limit. Which is actually the point of this whole discussion.
THe waterflood residual oil is the oil left behind in the rock due to the trapping by interfacial tension forces by the water.... it is unrecoverable by any practical pressure differential you can put across the rock... even a core in the lab. By the process of waterflooding.
I provided as proof for this assumption an SPE paper in which Aramco drilled a well right next to an injector which they had to abandon for a mechanical failure. They did state of the art diagnostic analyses on the pay zone in this well to derive the fact that 21% of the pore volume contained oil. Which is the residual oil saturation by definition. Which is what Saleri calls contingent resources when you apply it to a 109 billion barrel pore volume. Aramco sees everything else as possibly recoverable, indeed almost 85% of everything else is proven. Which is actually quite ludicrous and takes very big balls. Which was the original premise of this discussion.
It may come to pass that 85% of the available mobile waterflood oil is recovered... as of 1/1/04 over 50% of the available mobile waterflood oil was recovered. But I think Lucky will agree a lot of that will come above 90% water.
Any chance you'd write an article about this for us? I think this deserves a thread of its own.
This is my point about Ghawar, Cantarell, Burgan and Daqing being on their way to where East Texas is now--1.2 mbpd of water per day, with a 1% oil cut.
Like East Texas, these fields will practically never quit producing, but their production, compared to the flush production, will in time be just a small fraction of their peak sustained production.
If, as I believe, Ghawar is in decline or crashing, every single field that is, or was, producing one mbpd or more is in decline or crashing.
The only new one mbpd and larger field on the horizon is Kashagan, which--at best--won't hit peak production until some time after 2020.
FF, First of all, Some KICK ASS stuff there.
2nd if I understand you, what we have left is that patena coating of oil on the sand particles (a soap bubble thickness), that you can NEVER actually get out, across miles and miles of sand.
It adds up to 17 billion barrels or something.
Basically, they are running their production of stained oil across their whole field and running up to 85%ish of what was originally there?
Again,
It's not a Peak Oil Crest,
Not a Peak Oil Cliff,
It's a Peak Oil Bluff.
WOW
kaufst du diese Schätzung... 105?
Wirklich sagte er, dass die Zahl unten von 109 - nicht wirklich eine Schätzung rund gemacht wurde
Keine Ahnung.
No notion???
Come on .
We have a model. A model that is probably peer reviewed and found in any number of reservoir textbooks.
The parameters have been explained and the data has been pulled from established sources. It's a plug and chug operation.
And you have "no notion"?
You either dispute the model's relationships or you dispute the data... WHICH?
You should not bang Hubbert's model as subjective without addressing this.
That's not a model, it's a mathematical identity
This deserves a cogent keypost.
I bet the data Cheney gets from the Saudis is based on the fractional flow curve.
No notion???
First thing, while “no notion” may the literal translation that you get from a translation program, Germans use it in exactly the same way that we shrug our shoulders and say “No idea.” That would be the colloquial meaning.
You either dispute the model's relationships or you dispute the data... WHICH?
I don't know anything about this model, and don't have time to investigate right now as I am busy with something else. So I don't dispute either. I just don't know, which is what I said. I don't believe in reading a couple of references and then responding to claims I haven't seen before. I know there are some who have no problem developing instant expertise by reading a few sites, but that's not my style. It would take more time than I have right now to investigate. Furthermore, the issue here is something that I have never disputed: Whether Ghawar is close to peaking.
The Saudis themselves have acknowledged that it is close to 50% depleted. So that has never been the issue for me. The issues are: 1). How long?; and 2). What other production do they have to be developed?
You should not bang Hubbert's model as subjective without addressing this.
This is not Hubbert's model, now is it? Whether FF is correct or not has no bearing on whether the HL model works, nor any bearing on my position at all. That’s why I can shrug my shoulders, say “No idea”, and not feel the need to go grab some instant expertise to address his claims. One thing I do know, is that his claim from why the HL didn’t work in the case of Texas is wrong. I will address this in the essay I am working on.
This is not Hubbert's model, now is it? Whether FF is correct or not has no bearing on whether the HL model works, nor any bearing on my position at all.
I understand .
Entschuldigen Sie mich. Tief ist nicht genug.
Heres the link to SPE 93439 "Water Management in North Ain Dar, Saudi Arabia"
http://freeoil.1111mb.com/spe/spe93439.pdf
HL is not by any means a physical model so I can't see how you
can claim it does not handle certain physical aspects. It was never intended too. Its purely a empirical observation with the requirement that the fields be developed and produced close to their maximum rate.
As far as URR predictions as long as the URR predicted by HL is true say 35% after peak the amount of oil recovered in the long tail both does not follow the assumptions of HL and is not that important for why you would do a HL analysis.
I've said a few times that I'd consider the URR from HL as the URR for easy oil. Which is all I care about the amount of oil that can be extracted at great expense is irrelevant to the world and especially irrelevant to the NOC's ask Libya. I could care less about 40% of the oil recoverable post world peak only the 20% near the peak.
KSA may well be capable of producing 4-6 mbpd for decades but it does not matter at that point we are either riding electric trains to work or were dead.
Non-expert remark here: I haven't seen anyone mention the case of using the negative case of HL. Envision an oil province in which 'other' indicators lead us to believe that peak will occur at X point of time + or - a margin of error. If HL on this province did not show peak within this margin, using any set of normally used sets of data points, would this not be a fairly convincing negative case? Or is a situation like this simply unlikely to occur?
Generally you can always construct a HL plot that gives the right answer. Along of course with any number that give the wrong answer. Asserting you have the right one is based on information not included in the model and maybe not known at the time you constructed the model. As Robert mentioned this is because we are attempting to linearize a non-linear function.
This is what is driving Robert crazy.
WT is stating that models that correctly predicted the decline of Texas and the Lower 48 can be mapped to models of KSA and show a decline in the near future. WT is using this mapping as proof. Robert disagrees. I think the secondary evidence enforces WT claim even though the claim itself may not be provable. So I'm ok with using previous HL analysis of other regions that declined as predicted as constraints on new regions. I might add even though no one has done it you should be able to mix production from any number of regions and run HL's on the mixed and individual regions and get the same basic answer. In fact Russia is done this way it really should not be treated as a single region.
But HL should be if I remember my algebra commutative and additive ?
This means you can take the North Sea Lower 48 and Alaska add them together and construct a HL plot that should give the same answer as each region taken alone.
"But HL should be if I remember my algebra commutative and additive ?"
No. Consider computing HL on crude + condensates + whale oil. Whale oil followed a lovely Hubbert curve in the mid-1800s -- you would have been screaming "peak", when in fact peak C+C+W wasn't for another 150 years.
OK silly example, but the point is that HL is only going to work well for roughly-well-behaved production vs. time functions, e.g. monotonic rise to peak, then monotonic fall after peak, with noise that doesn't swamp the signal (HL makes me uneasy for countries like Russia for this reason). It should work well enough if you're combining two or more production functions that peak at about the same time, or at least overlap enough that their sum looks roughly-well-behaved, so it's probably legit for "world peak oil", but it's not additive in an algebraic sense.
peace,
lilnev
Right ...,
Thats what I meant :)
Semi-additive ? :)
New math terms for HL just to drive Robert crazy.
By god we will make it work even if we have to change the laws of addition :)
Would you care to comment on the dual porosity / permeability system I undersatnd exists in Ghawar and how the Sw problem you refer to relates to these dual / multiple systems?
We don't have to make it any more complex than it is to be concerned.
The principal concern I have with regard to the natural fractural is the crest is all that's left and Ain Dar/ Shedgum. And anybody would recognize that the stress and therefore fracturing if a problem, would be most severe here.
"The principal concern I have with regard to the natural fractural is the crest is all that's left and Ain Dar/ Shedgum. And anybody would recognize that the stress and therefore fracturing if a problem, would be most severe here."
This sounds ominous, but unfortunately I haven't a clue what you're saying. How would yoou explain your statement to a layman (such as myself), please?
Think of the reservoir as a curved rock arch. Curvature is strongest at the crest (the pointy bit at the top) so this is where the rock is most highly strained. So this is where fracturing is most likely to occur. Natural fractures are generally bad news in a waterflood because water runs along them and arrives at the production wells sooner than you'd like.
At this stage I don't think it's going to make much difference - even without natural fracturing, the it's-all-over look is all over. Plus the matrix (unfractured rock) permeability is pretty high, which tends to mitigate the effect of the fractures (allows the waterflood in the matrix to "keep up" with the fractures). Plus I've never heard fracture flow invoked as an important mechanism in the Arab/Minagish/Zubair Cretaceous limestones of East Arabia (not to be confused with the Eocene Asmari Limestone of Iran, which has completely different characteristics).
curvature may be greatest at the top of this particular reservoir, however it is not generally the case. flexure (or curvature) is greatest where the rate of change of dip is greatest (first derivative of dip). this can occur around the flank of the structure. Puerto Chicito field in the San Juan basin for example.
On March 8, 1956, at a meeting of the American Petroleum Institute in San Antonio, Texas, M. King Hubbert, in the preprinted version of his prepared remarks, had the following statement,
As more and more people are learning, Lower 48 oil production, as predicted by Dr. Hubbert, peaked in 1970, and it has fallen fairly steadily since 1970.
Note that cumulative post-1970 Lower 48 crude oil production has been 99% of what the HL model predicted it would be, using only production data through 1970 to construct the model.
If we focus solely on the Texas HL plot, the post-1957 data are clearly consistent with a URR estimate in the vicinity of 60 Gb.
In any case, we had three predictions for lower crude oil production, most likely in 2006, based on the HL method: Deffeyes/World; Brown/Saudi Arabia and Khebab/Mexico. Result? Three crude oil production declines.
But that was just three simultaneous "coincidences," like the 99% correlation between the post-1970 HL model (using only data through 1970 go construct the model) and post-1970 cumulative Lower 48 production.
http://lifeaftertheoilcrash.net/
Dude, only 24 of 44 of the top oil producers in confirmed permanent decline? No problem right? Where's the market's magic hand?
Saudi Arabia is about to do a oil production belly flop due to their implementation of "advanced techniques" - the decline WILL be steep, and the only real question is are we up shit creek without a paddle NOW or in a few years? That's not even mentioning runaway global scorching and oil exports dwindling faster than cash at a tittie bar.
There you have it, and as I thought. Good work, Robert.
The simple fact that issues Robert is currently investigating are not well known---they should be fully understood---shows that the HL method is not robust. It's an early-stage tool, and a good idea worth pursuing. But it's not a predictive tool in the state it's currently in.
Dunno I think its more and issue of defining how its been used. A lot of external parameters not included in the model are used to deduce the correctness of a particular HL plot.
This filtering has been ad hoc as far as I know. The question is can it be made rigorous and if so does HL retain predictive powers.
See my other posts why I think its a proxy for the right model and close enough. I don't believe Robert will be able to show HL does not work simply because I think that a correct model similar to HL exists and can be derived from first principals.
Until/If we get a better model developed from physical constraints HL serves a purpose. With that said Roberts work could easily be the key to determining a better model so I don't discount it in the least.
And finally if we do get it I expect the new model and HL to be in pretty good agreement.
"Captain! Is that an iceberg straight ahead?"
"Depends on how you define iceberg, and what methodology you're using to detect said iceberg."
"Damn it, Ensign, is it or isn't it?"
"Well, we really shouldn't jump to conclusions. As you know, we do not have certainty to within twenty decimal places. I much prefer to see if we hit the iceberg after we pass it."
"Ensign, you are retarded."
These analogies suggesting that it doesn’t matter whether the Titanic sinks in 2 hours or 4 hours, or that the only thing that matters is that we are hitting the iceberg, are an incredible display of intellectual shallowness. Of course it matters when it sinks. Of course it matters when you are going to die. After all, you are going to die some day, right? Does it matter to you whether it is today, next week, or 10 years from now? Or does the fact that you are going to die render the timing completely irrelevant to you? From responses such as yours, I am left to wonder.
What more time gives us is at least the opportunity to become a little more prepared. It doesn’t mean we will use the opportunity, but at least time gives that to us. We may have some lifeboats on the way that can rescue a few. If you are convinced that we will sink in 2 hours, and you jump in 2 hours, it might have mattered to you that we didn’t actually sink for 4 hours, and that a few lifeboats arrived in 3 hours.
It is very important to know how much time we have, and it is important that we don’t burn up our credibility in confidently arguing that peak is now, if it isn’t 5 years from now. This will become painfully obvious to some of you if production turns up and we set new production records. I think the point might finally reach even the dullest of minds.
Of course I have to make the obligatory statement that this doesn’t mean I think we should delay action. Of course I have made my position on that clear numerous times.
"What more time gives us is at least the opportunity to become a little more prepared. It doesn’t mean we will use the opportunity, but at least time gives that to us."
Robert, I would like to think that you are correct, but I see little evidence of it. I doubt many people will change livestyles until they are forced to by price.
And as for "losing credibility," what difference does it make? What I mean by this is, once we peak and decline, everyone will (presumably) know, which may feed our individual egos by being proven right, and may improve your personal employment chances, but I'm not sure what practical value it has on a larger level.
IMHO, a lot of people still won't believe that we are in a true resource constraint. They will blame it on those crooks at Big Oil and those evil foreign countries that won't give us their oil. They have been told for so long that there is plenty of oil and we will never run out -- and they have accepted it on faith without giving it any real thought. Many people think cheap gasoline is our birthright. Please pass the Koolaid.
And frankly, I'll likely will be one of those "I told you so" jerks. After all of the flack and utter dismissal I've experienced regarding the subject of peak oil, there isn't much else to say once they see the light. I've had people compare peak oil to the year 2000 doomers. Yeah, right. Peak oil is the same thing as, "the world is going to end because the computer clocks won't roll over correctly." Sorry, the data is out there -- enough so that any thinking person should be concerned and investigating/preparing. The only exceptions would be those that don't have access to the internet since our media does an overall lousy job of covering the subject.
Hi Jim,
And thank you to everyone for this discussion.
re: "I doubt many people will change livestyles until they are forced to by price."
Some Qs:
My take on what Robert is saying in regard to time is - having some time to do something is good. What we do is another (I would say crucial) issue, of course. That's the first part of what he's saying, as I understand it. (Second part in a minute.)
Instead of taking your point above as a reason why time *doesn't* matter, I'd say this could be a starting point for some mitigation planning. It does matter.
Or, let me put it this way: What *if* it *does" matter?
For example, okay, let's assume "I doubt many people will change livestyles until they are forced to by price." Good assessment.
1) So, what next? What is the next step? Yes, price will "force" change. Okay. (AT least we've identified something that will force change.)
Can we envision policies, which put into place the price changes - (do you mean on gasoline, by the way? or, something else?)- that might have the desired effect?
2) And, (working a bit backwards), what *is* that desired effect?
I'm asking for your thoughts on this, with as much sincerity as I possibly can.
By "policies" I mean both gov't. policies of any kind...
And I also mean...are there any other actors or "stakeholders" who might be able to influence *"price"* in the desired direction? If so, how?
3) What is the end result of the direction of "price force"? What is the exact "lifestyle change" you are speaking about here? Can you talk about it? Can you describe it? Is there a positive version - (or a "least bad")- version that might result if "price forcing" is done in advance, as opposed to post-peak?
Part II: If I may be so bold as to continue w. my interpretation of Robert's point.
"Credibility" is good to have, if one wants to take positive action in the time allowed. Wouldn't you say?
4) "...everyone will (presumably) know..."
Well, I'm not at all sure. It's difficult to understand the implications of "peak" (for all kinds of reasons - emotional, education-wise, and who knows what else...). I'm not sure this will change post-peak.
In any case, it seems to me that the point of what Kjell Aleklett and many others say- (and devote their lives to)- is to "warn the world".
People who know, who understand, are in a position to act in a positive fashion. Who else possibly can?
It seems that means "us". To begin with. And the credibility "issue" is to establish a basis for there to be more of "us".
The easiest way to post images is to upload them to a free image hosting service, such as ImageShack.us or Flickr. Make sure it's one that allows "hot linking" (linking directly to images - Blogger, for example, does not allow it).
You can then post them here, by linking to them using the HTML img tag.
<img src="your image url">
thanks

this is a test
You are using the BBcode tags. This board uses plain HTML.
<img src="http://img122.imageshack.us/img122/903/aindarshedgumfractionalok4.th.png">
Gives you this:
Hit preview to see how it will look before you post.
Key got cropped - what do those two fw curves refer to? With and without gravity? (I assume that's why you quoted permeability in the graph title).
Given that fw at breakthrough is about 80% for either curve, giving a surface watercut in the mid-80s, way below even the worst claims of the pessimists, doesn't that tell us that they're probably flooding the thing out one row at a time, so the curve by itself gives us no real information about the overall state of the reservoir?
I see that you were right about "contingent resources" being Sorw, though. I'd expect to be fired for cause if I tried to pull something like that.
Sorry for the image quality.
fw res and surface Honapour correlation carbonate intermediate wettability 220 md.
Look at this image and tell me what you see as abandonment Sw if you can.. it looks like .65 to .66 to me.
The bottom line is Saleri is giving essentially 100% of the oil behind the flood front as reserves.... with no detriment for efficiency. I don't think you can slice it any other way.
Not to mention that I see breakthrough fw above 90%... but the tangent on this wide a mobile saturation is a difficult point to capture. Reasonable men of good conscience can differ on this.
This is the ideal water flood. A coarsening upward sequence with the oil viscosity less than the water with purely downdip injection. But the collapse will be abrupt.
Thanks for your questions.
I've put it this way: Ghawar, Cantarell, Burgan and Daqing are well on their way to (or beyond) where Prudhoe Bay is now (75% water cut) and ultimately to where East Texas is now (99% water cut, i.e., watered out).
But the collapse will be abrupt.
Boy, when I just read that, it came with a THUD.
Once every so often, you read something, even if it is something you have read before, but this time... This time, the hairs stood up on the back of my neck.
Thank You FF for that. I even heard Beethoven's 5th in my head.
JC
OK, then...if what FF says is all true...collapse will be abrupt...what the hell is keeping the lid on everything right now?
Markets are not going nuts...price of crude is dropping (although gasoline is edging up...strange)...DOW is setting records.
I am playing devil's advocate here, but what is it going to take to see through the cracks here?
FF...stop talking formulas for a moment and tell how KSA is keeping lid on this?
Lol.
The concept of a collapse in the Ghawar has been related here for many moons. That it is using the same EOR techniques as the Yibal should have raised alarm bells for anyone with any sense of reasoning. Check out the history of the Yibal if you really want to see the hairs stand up on the back of your neck. Just imagine the same collapse in the Ghawar.
You people never have been very adept at listening. I appreciate FF dropping a nice load of sweet, sweet, sci-talk to make you hapless geeks get all gooey and drop your defenses and perhaps start to believe what was oh so obvious two years ago.
So, if that is what it takes, my hat is off to you FF.
Is there a single history of Yibal? Or better yet does there exist an archived debate of the field's ongoing performance and subsequent decline. Something like this?
peter
Its a combination of poor field management and lack of water flood as you say. This oil is being extracted now. The problem in a sense with Texas is technology was not applied smoothly to production since the technology was developed to extract this bypassed oil in the first place. I'd say Russia is in a similar situation with basically two waves of technology pre and post Soviet Union plus of course the collapse period.
In the case of Texas these problems where rectified post peak so it did not effect the date of peak all that much instead it lead to a later increasing URR in the tail if the technology had been applied earlier before peak then the Texas URR would have been higher and the peak higher not sure it would have been much later. The HL URR is increasingly low as you pour more and more resources into extracting the remaining oil at lower and lower URR. Recovery factors creep up but the production rate is technology bound not geology and generally low. My example is a well that 90% watered out its constrained by the water handling abilities.
Hi f,
In addition, anybody who knows anything would also rather have 10 MMBOPD at 90% water (Russia) than 10 MMBOPD at 20% water (Saudi). Ten million a day at 20% water is 1.2 MMBOPD at 90% water, capeche??
So when did Russia ever produce 100MMstb/d dry oil? That liquid production rate is the result of several decades of incremental installation of pumps and treatment plants. As you know perfectly well, I'm sure. Though I'll concede the larger point that nasty surprises are a lot more likely in Saudiya than in Russia. There's a lot less spare capacity in the oilfield equipment business than there was five years ago...
I agree. I did well testing in Ghawar from 1982-87. The only way you could get a well that produced 6,000 on average would be to average in the water injectors. The average well in shedgum produced 18mbd through a 1 7/8 choke.
Fractional_Flow,
If Saudi Arabia is at 53% water cut and climbing at 1% per year. How many years until cliff. What was Oman's water cut before the cliff?
'...that production may rise again in the future, dependent upon global demand picking up.'
And that is the crux, isn't it? To the extent I have a forecast about the next decade, it fits into the data presented here - Saudi production will remain flat, but their 'productive capacity' will be on par with the North Sea's productive capacity in British oil production forecasting today - that is, a number based on what is politically desired (like Reagan/Bush era USGS reserve numbers), not reality.
A plateau based more on economic than geologic conditions is looking ever more likely, though one subject to some serious disruptions.
The one thing lacking in your information, though, are numbers related to the quality of the oil now being produced, however. A fairly minor point, in the broad picture painted here, but having to construct a refinery's facilities to handle the oil from one of KSA's remaining megafields is not really an encouraging sign of having that much in reserve.
Nice one Euan. A solid plausible contribution.
I would say that just because three sets of data agree on rig counts doesn't mean that it is solid evidence, unless we can see that they are indepedent. The IEA is probably just repeating OPEC stats? How Baker Hughes arrive at their rig counts would be an interesting question to answer?
Also, why should we treat OPEC rig and well data with greater respect than we do their Reserves figures? I agree that saying "they are lying" is not a very helpful argument either way, but the quality of data may not support such a detailed level of analysis? (although you present some convincing points).
Might be interesting to ask Cantarell field operators how their well productivity has changed in the last few years, or how many wells they have had to retire. It's true that well productivity is not going to drop from 6000 to 3000 overnight. But if productivity declines in some fields and numerous wells water-out in other fields, a steady fall in overall production is not hard to envisage.
Still, your analysis does seem to indicate that Saudi Arabia are doing a pretty amazing job with what they have. Hard to rule them out just yet. A few months of a strong "call on OPEC" is what we need. We shouldn't have to wait long?
cheers
Phil.
I'd actually accused them of being lazy earlier this show they are not which actually bothers me more since it tends to confirm the lack of great opportunities.
Regular readers of The Oil Drum may think I have become a cornucopian. I assure you not at all, I'm simply looking at data and drawing reasonable conclusions.
First of all, Euan, great post. This is exactly the sort of debate we need to fit the pieces together and figure out what’s going on in Saudi. Like you, I am trying to look at data and draw conclusions. I have come to similar conclusions by looking at different pieces of data. These posts of yours, and of those of Stuart, help me to fit all the puzzle pieces together and better understand which ones fit and which ones don’t.
This sort of discourse is what I enjoy most about TOD. I intend to make another contribution in the near future by looking at the HL of Saudi over time. I have an idea that I will find that Qt has been getting larger and larger as time has gone by. That is my hypothesis.
"I have an idea that I will find that Qt has been getting larger and larger as time has gone by."
I agree. Was there not an article demonstrating this recently, perhaps for the US?
Anyway, what would be interesting would be to find out if the rate that Qt has been increasing is getting smaller, and whether this could be a predictor for the final Qt.
Cheers, Euan.
What would interest me is the situation before (around) 1980. Should I consider the late '70's production numbers as "noise" for the HL graphs? I'm still sitting somewhere in limbo (or should I call it nirvana?-) about where to draw my lines...
Thanks, Dom
...pre 1960 numbers would help a lot too.
I tried emailing you but your address failed. Send me an email and I'll send you the data.
Sent you an Email, updated my profile:
My grandfather pumped oil with an engine-house,
my father pumped oil with a 20 lb. electric motor,
can't I just pump it online?
Thanks Euan!
what struck me was that your production curves do not show the recent drop in production (?).
Why is that? Would it change the analysis?
Cheers,
Davidyson
Davidyson,
The main reason is I am using annual production data and BP as the source. The latest BP stats are for 2005 - as are the latest OPEC stats. Figure 9 does indicate the small fall in Saudi 2006 production.
Confused? Well here's the latest annualised production figures for Saudi from the IEA:
2005 C+C = 9.06 million bpd
2006 C+C = 8.96 million bpd
By my reckoning the year on year drop in Saudi production is 1.1%. Follow the IEA link in my post, find the report from Feb 13th 2007, Table 3.
The other reason I like the BP data is that it includes natural gas liquid (NGL) by default. NGLs are part of natural petroleum systems and have growing importance in terms of global production - as gas production is rising.
Thanks!
Here are the figures from the EIA. They make the drop from 05 to 06 a little greater.
2005 C+C = 9.550 million bpd
2006 C+C = 9.152 million bpd
While the IEA has Saudi production down 100,000 barrels per day in 06 the EIA has them down 398,000 barrels per day, almost four times as much.
Ron Patterson
Ron,
As you know, but as a reminder for everyone else, the Saudis themselves have admitted that they were virtually producing at 100% of capacity in 2004 and 2005, and they themselves have admitted that their crude oil production rate is now down to about 8.5 mbpd.
However some people spin it, producing at virtually 100% of capacity from a group of old oil fields sound a lot like Peak to me.
Jeffrey and Ron, thanks for calling by.
I'd be interested to know how you would spin a bad news story out of the data I've presented in Figure 1? Had the picture been one of rapidly falling well productivity - I'd have told a bad news story. But the fact is that the data to my mind suggest astonishingly robust production - in light of all the bad news rumours that circulate.
So how do you manufacture a crash out of these numbers?
Euan
If I understand Fractional_Flow correctly...he doesn't seem to see this data as a good sign.
I can't help but to think...
The bulb burns brightest right before it burns out.
This is just ringing around in my head after reading this for some reason.
================
It's all about population!
Euan,
Correct me if I am wrong, but didn't you recently argue that the month over month Saudi decline was too sharp to be voluntary?
And didn't I recently argue that the year over year Saudi decline was about 4.3% (EIA data) and thus in the same range as the long term decline rate for the prior swing producer, Texas?
When Texas peaked, they didn't go to a 100% allowable across the board (East Texas and one other large field were still constrained because of pressure problems, if memory serves). So, Texas, in 1972, was "virtually" at 100% of capacity.
But in any case, the Saudis have admitted that they were virtually at 100% of capacity in 2005, with most of their production coming from a group of elderly oil fields. And, based on EIA data and Saudi admissions, they have gone from 9.6 mbpd in 2005 to about 8.5 mbpd currently.
As I have increasingly suggested, this whole debate is verging on the bizarre, it's a question of whether the Titanic sinks in two hours or four hours, even as the water is pouring in at a very high rate.
"As I have increasingly suggested, this whole debate is verging on the bizarre, it's a question of whether the Titanic sinks in two hours or four hours, even as the water is pouring in at a very high rate."
Actually, it's more like we are debating the true rate at which the water is flowing in and whether we can actually predict with any acuracy the actual time of sinking.
As I see it, *my* situation is analogous to a passenger on the Titanic who has recently discovered that she is steaming recklessly fast into iceberg waters. The captain won't slow down. He and all the rich passengers are smoking cigars and laughing. We haven't felt anything yet, but the crew is concerned.
Some of them shout that, any minute now, we'll hit an iceberg and sink. Others argue that we don't know when we will hit an iceberg, but we should prepare because it *is* likely to happen. Others claim that the ship is unsinkable and can survive hitting an iceberg. Still others assure me that if we do hit an iceberg, another ship will certainly come by to save us.
My suggestion is to do what I'm doing. In my case my father has 20 acres in Arkansas 10 miles outside of Little Rock in living in a pretty tight community of 30-40 small farms.
On the other side of the Arkansas River is some of the best farmland in the country and it stretches for miles. And the region is close to the oil producing regions on the gulf but not close enough for major hurricanes. The main problem is the area is tornado's. My point is its a region that's capable of feeding itself has excellent access to trade via the Arkansas/Mississippi rivers and so its on on those places that will naturally have a city for years to come.
Basically anywhere along a navigable river in the Mississippi flood plane is relatively lightly populated and contains abundant natural resources.
For the more cold tolerant along the great lakes and upstate New York are good regions along with Maine. and the southern costal regions.
I guess its easier to say where you don't want to be.
The Boston/NY/DC region.
Southern Florida
LA/Phoenix/LV
The SF bay area is iffy at least early on.
Houston/Dallas are also a bit iffy.
In general any city over a few hundred thousand if you can stay away.
So if you have relatives or friends outside of the danger areas you should contact them. You can easily buy a few acres of unimproved land fairly cheaply somewhere in the US.
And a mobile home or manufactured home can be used as temporary shelter in a pinch. If your serious you should build your own house anyway. If you can't do that you have no business trying to make it on your own.
You can spend your vacation time and if your close enough weekends working on your house/garden and getting to know the neighbors as well as putting out feelers for work in the area. Generally these places will have a small number of jobs open up every few years in various areas. If you make yourself known then you will get one of the jobs if you want.
I'm not saying go out and be a mega farmer but I'd certainly make sure I hade enough land to grow a good vegetable garden and raise some chickens and a orchard.
Room for a potato/wheat field would be cool plus you need a wood lot of a few acres. I'd guess that 4-5 acres is about the minimum you would want to have. You would still want staples such as wheat but you could live without if needed.
20-40 acres is better. You have to do crop rotation stuff so you would be surprised how much land you could use.
I highly suggest this series of books they are great and they are real.
http://www.foxfire.org/prodFFbooks.html
By yourself a good set of hand tools and learn how to use them. Learn welding some basic machining etc. Metal working is actually really important. You can make anything from old spring steal. A good approach is to take a old cars apart and salvage every piece. The windows can be used to make a wicked cool sun porch for example. The sheet metal for roofing or gutters. The seats are of course classic Arkansas couches and easy chairs. But you can chop up the coushins to make pillows and the spring steel inside the seats is a very nice steel. Axles make great pry bars.
You can see you get dammed good at knowing the various steels.
I grew up fairly poor in Mississippi/Arkansas so I'm probably a lot different from other Americans I'm no stranger to outhouses and hand pump kitchen sinks and wood stoves and oil lamps. Getting electricity was still a big deal in parts of Arkansas well into the 70's. All your really need is creativity and some basic skills, land and access to a junk yard and the world is yours :)
Outside of picking a place you would want to move to and at least buying the land I'm not saying you should do any of the above but I have these skills and combined with my chemistry degree I could live very comfortably scrounging of the junk we have thrown out over the last 100 years.
Whats important is too build confidence in your own abilites. Saving money helps but all your really need is enough for the land and a cheap trailer and the various tools etc needed to start work. I'd say if you had 100,000 dollars you would be set but you could get by with as little as 20k if you bought wisely and of course you no debt. More money is nice but the concept is to live basically whithout money so its not as useful as you would think after you buy your land and get your well drilled.
Last but not least hydroelectric is the best if you can get on a stream with enough head. I'm actually more intrested in finding a place with good hydroelectric capabilities and putting this in than anything else.
If I'm on the Titanic and she is sinking I want to be that guy in the bottom of the boat boinking that babe in the backseat...her hands running wildly down the steamed up windows...
now that is a great way to die...with your boots off.
Hi WT,
I dont really think he is comparing apples with apples. The wells twenty years ago were different than there are today, no? If I am sucking a drink with a straw and I keep needing to get bigger better straws to keep the flow up, then the rate of flow might give the "illusion of sustainability", but obviously it is not... Surely figure one doesn't tell us anything about the future production??
HKT.
Yes you're wrong Jeffrey. I argued the monthly decline was too steep to be natural. Voluntary decline can be as steep as you want it to be.
Euan, I noticed that chart ended in 2005, the very year Saudi peaked! I think that pretty wells explains it, or "spins it" as you put it.
Now let me ask you a question. How would you "spin" this:
Ron Patterson
"Euan, I noticed that chart ended in 2005, the very year Saudi peaked! I think that pretty wells explains it, or "spins it" as you put it."
Yes, it looks like you caught him. That didn't take long.
I have parsed that comment with an unspoken qualifier: "our fields which are in decline show 5-12% decline rates" - which doesn't imply that their overall production is declining at 5-12%...
CW
Global peak: 2007 - 2010
Global decline rate, Post peak: 2%
Economic response: Severe global recession, ~5 years, then slow recovery
A key question is the data that you do not have (or chose to not show). What did KSA do with wells in 2006? Did the number of wells increase? Did the number of wells being retired decrease?
You've built your case up on historical data but have not yet demonstrated that the current situation mirrors the past. Show us the data for wells for 2006.
Ghawar Is Dying
The greatest shortcoming of the human race is our inability to understand the exponential function. - Dr. Albert Bartlett
Great work as always.
I was confused by the "BET" portion. Are you taking the bet?
Your numbers suggest you should...but then you say production will increase IF demand increases?
Are you suggesting that demand will not increase to that point and therefore can't take the bet on those grounds?
The data is cloudy for both you and Stuart, so really its a confidence game, Stuart put his money where his mouth is...he appears confident.
==================
It's all about population!
My last post on the subject I don't agree with comparing flow rates from vertical and horizontal wells and worse multi-branched horizontal wells directly. You need to weight against the flow from the original vertical wells. So their is a huge difference between getting 6000 bpd out of a simple vertical well and a multi-branched lateral km's long. If you do the division then on a vertical well weighted basis I'd say KSA's production rate has dropped off substantially per baseline vertical well. Only the advanced methods are keeping production rate up for the time being.
I've got this scattered all through the post so maybe someone will respond.
But were they drilling new wells and getting a 1.1% drop in production, or were they retiring wells and getting that drop? That would seem to be the big question.
An interesting scenario, just as Stuart's was. However, one thing I would say is that it hinges on the difference between 'retirement' and 'closed down'. There is nothing to say which category any particular shut down well may fall into. You are assuming that wells are being rested (which they may well be), but like stuart you have no data to know which is true.
As the fields get older, you would expect the "it's dead jim" pile to grow at an ever increasing rate.
I would call your attention to your Figure 6. Its interesting to note that the maximum in either direction is ~300 wells. In times when SA wants to reduce production, or times when it wants to increase, it never seems to escape those bounds. That might equate to a retirement/reactivation crew and equipment limit - a maximum rate of change. If you assume your 3000bpd individual well production rate, that yields 900,000bpd as the maximum rate at which old production capability can be added back into the mix. In reality its likely to be lower than that, old wells are unlikely to gush.
Add in new capacity from new wells and you reach a maximum surge rate for any year. Taps may be able to be turned on, but only so fast. That may end up being important.
Nice post. My assertion is that the move to horizontal wells gives a growing bone pile of its dead jim. Leading to a greater reliance on new wells and new development to maintain production.
Great post Euan.
Simmons in Twilight said that Aramco was a very well run and highly professional company that practised the very highest level of responsibility.
This post would seem to confirm that view and it seems the Saudis have managed their endowment well.
This seems to help confirm the views of Skrebowski, ASPO and many other commentators that production may Peak at around 90mbpd in the 2011 timeframe.
In truth I do not think the precise date of peaking is relevant. We are at the top of the bell curve and where exactly we are on that flatish bit at the top doesn't really matter. There is a growing gap with demand.
I agree with Professor Hatfield, it is too late to do much about it. Nobody wants to talk about it, it's an embarrassment to raise the subject in polite company. It's not a political issue and people continue their lives as if nothing at all is wrong. Even people who know something about Peak Oil don't care.
And therein lies our failure. The readership of Oildrum, EB, LATOC and a few other sites is almost a closed loop. We write to each other and connect the dots etc, but column inches in the broader media are rare. What exposure our viewpoint does get is then muddied by the usual suspects, so people tune out more convinced than ever that we are just a bunch of single issue loons and that life will go on as now for pretty much as far ahead as they are prepared to think about.
Hi SailDog,
Frankly, I don't see the failure that you are referring to. The whole concept of Peak Oil is such an unpleasant one that it is not surprisisng that it takes a while for people to accept it.
For example, below is an article in today's Financial Times. The writer, who made a fortune in the DotCom era, is implicitly accepting the concept of Peak Oil, although his article is about something else altogether.
I think that once references like this become much more common. people will insist that their politicians address the matter. It does not work the other way around as politicians are the last people to wish to publicly discuss it!
One question it is my understanding that the new horizontal wells drop production rates significantly once they water out.
You have not broken out how many of the new wells are horizontal my understanding from what I've read is this has been common practice in KSA for some time 1990 ?
The reason I think this is important is that in the past KSA achieved 6000 bpd with regular wells then although they kept about the same flow rate it was done with horizontal and more advanced technologies. I tend to equate a horizontal well to some multiple of a regular well say 4:1. This means in regular well terms i.e wells used before say 1980 the real production rates weighted by well type have dropped significantly over the last few years. And horizontal well benefit little from resting compared to a regular well which can easily cone. This would mean the wells taken of line that where horizontal probably have a high water cut that is not easily remedied by resting.
If you use my weighting scheme then per regular well productivity has dropped from 6000 to 1500 bpd.
With their latest wells my scheme could easily be over optimistic with a weighting closer to 10:1 and note that the
newer wells drilled are probably not simple wells so they are probably redeveloping the fields with advanced well where possible.
The premise is simple a horizontal well drains a lot larger region than traditional wells a more through analysis by someone who understands the technology better could give
a better weighting but 4:1 is I feel a reasonable number.
Next how many of these are producer wells and water injection wells thats not clear to me.
Also on another thread I accused KSA of drinking their own kool-aid since they would have needed to start working 10 years ago to keep production up now. It seems that I was wrong and they did.
Memmel, yes, there's been a lot of chat about sudden watering out of horizontal wells. I think you need to look at this from differnt angles:
1. Horizontal producers do have the geometry to water / gas out quickly if they are hit by a rising water or falling gas front.
2. Many giant fields are very complex and will have multiple oil-water and gas-oil contacts and so it is unlikley that large numbers of horizontals will water out simultaneously.
3. This link to Haradh III gives a good description of shifting drilling strategy. Haradh I (1996) was developed with vertical wells, Haradh II (2003) with single horizontals and Haradh III (2006) with multilaterals.
4. Horizontal wells are allowing low permeability reservoirs to be produced that may otherwise be uneconmic with old technology.
The Haradh III link gives a good overview of the various types of wells that are drilled. The sustainability of Saudi production will be dependent upon how successful projects such as Haradh are. If this produces at 1 million bpd for 5 to 10 years then the Saudis will be in better shape than if the reservoir pressure and production drops in 2 years. Only time will tell.
Great Link to Haradh III.
Saleri says Ghawar total 48% depleted 1/1/04.
Cumulative recovery 55 billion barrels so remaining reserves are 60 billion barrels.
Says Ain Dar/ Shedgum is 13.9 Billion.
Nothing said about Uthmaniyah... but it is lower quality than AIDs with the same amount of cumulative... plus "no dry wells in Uthmaniyah" is the insider comment from a year ago. Plus I have SPE paper written in 2005 which shows crest of Uthmaniyah being overrun with water. So Uthmaniyah is a question.
Harad total is 900 MBOPD for 30 years. Haradh III is 300 MBOPD for 30 years. That's 10 billion barrels. Thirty years we can all agree I hope is the effective reserve period... when we're talking peak oil.
SO how do we get to sixty??
Thanks and I pretty much agree with you on all your points.
My point was that resting a horizontal well does not seem that useful where resting the old vertical wells allowed them to de-cone and then be brought back into production. Thus the move to horizontals has dropped the amount of old wells that could benefit from resting.
Next I disagree with what I consider a key point in your presentation that KSA has kept its well production close to 6,000 bpd the reason is that initially this was done with vertical wells and later they have moved to more advanced horizontal drilling for the same flow rate.
Since a horizontal well drains a much large area of the field compared to a vertical well you need normalize the number by counting a horizontal producer as equal to multiple verticals even what I consider a conservative estimate of 4:1 leads to a normalized flow rate much lower than what your suggesting so in reality they have not kept
the flow rates up.
In Texas the drilling campaign around peak was done with vertical wells similar to what was used in the fields initially so its close to a 1-1 comparison, you do have to account for more injectors being drilled.
If you use my approach and weight the horizontal wells higher you see a similar drilling campaign is being undertaken in KSA your just getting more productive wells
per rig with the horizontals. Thus the change in the nature of the wells has a big effect that not accounted for by just counting wells drilled.
Excellent post, Euan Mearns, well explained and well referenced. :-)
Of course, what your suggesting is that the OPEC countries do not always pump all the oil they can pump. This may not sound controversial to you, but as little as a half year ago, it was regarded as a "conspiracy theory" here, and not to even be suggested (I know, I made the argument of Saudi constraint, {but of course I don't have your credentials}, and was pretty much chopped to pieces for it The only "conspiracy theory" allowed was "the iron triangle" because of course we all know that it involves Americans, and Americans were invented by Lucifer himself to stink up the planet, and are willing participants in any and all evil that befalls the planet...:-)
All major parts of your article seem well researched and supported by good references, except one, a big one..., what I will call the "bare cupboard argument", to quote you:
"Saudi ability to sustain and grow production is dependent upon the availability of new good quality mega projects to develop and the cupboard in this respect is beginning to look rather bare. Khurais due on by 2009, some off shore field developments and further development of gas resources (NGL) should provide sufficient resources to sustain production, and perhaps modest growth, for a few years at least."
This may in fact be true, but is almost impossible to prove or to substantiate.
Right now, the argument seems to be built around the premises that:
(a) Khurais is junk, a bluff by the Saudi's, and the Saudi's are just plain wrong or lying about what can be produced there...
(b) Saudi offshore prospects for increasing production are marginal at best and virtually non-existant at worst, and will have no real impact on Saudi Arabia being able to increase production.
(c) The Saudi's are simply wrong when the refer to fields yet to be developed or even discovered in the so called "Empty Quarter", and there are no other large or mega fields there.
(brief aside: Most Westerners do not understand exactly how empty the "empty quarter is. For a fascinating beginning read, I would suggest the Wiki article:
http://en.wikipedia.org/wiki/Rub'_al_Khali
Imagine a 300 mile by 600 mile block of real estate that was not even mapped on the surface until 1946-1950, and which for all practical purposes remains completely unexplored for geological purposes (at least as far as any Westerner knows...and there's the rub) and for good reason, to quote Wiki,
"With summer temperatures up to nearly 55 degrees Celsius (131 F) at noon, and dunes taller than the Eiffel Tower — over 330 meters (1000 ft) — the desert may be the most forbidding environment on Earth.
( a few square miles of oil could hide in that kind of terrain pretty easily, no? :-)
The Rub' al Khali which sits at the southern end of the greatest known producing oil field in the world....should this be at all of interest to those who now profess to know exactly how much easily extractable oil may still be in Saudia Arabia? You would think so, but any discussion of it is met with a yawn)
So, we are back where we were in 1982. The predictions of doom are on the table, if not now, very soon. Of course, we still don't know:
(a) What Africa can do (and when we say Africa, right now we mean mostly Libya, light sweet crude fields rested nicely since the last time they were worked hard in the 1980's), Angola (under pressure from it's new OPEC overlords not to be too ambitious in producing), and Nigeria, which is a geo-political trainwreck, but has a fair little chuck of oil, no?
(b) How much is available on the Outer Continental Shelf of the U.S. because no real exploration has been done since the 1970's, or how much may be off the coast of Brazil (a huge chunk of real estate, and already the Brazilians have essentially removed themselves fromt the contest for world oil by producing it, even though ethanol has wrongly been given the credit for this feat)
The U.S. coast is currently off limits, but if things get tight, that could change...but, frankly, with oil in the $50 dollar range, and natural gas around $6 to $8, we may be better off to buy from abroad, burn theirs first, and save ours....
(c) Southeast Asia is still a great mystery, although we have to assume the Chinese will intend to lock that oil and gas down for their own use, but that would remove pressure on the OPEC nations to produce for China/India consuption)
(d) Of course, unexplored areas of Russia are vast, despite frequent predictions that Russia is peaked, almost all based on currently developed areas of Russia, which are indeed mature fields.
(e) And back to the Persian Gulf, the Empty Quarter, Persian Gulf offshore and developing fields. Saudi Arabia offshore is the absolute DREAM place to do offshore drilling, in a sheltered gulf with no hurricanes, no ice, and warm balmy waters....compared to drilling in the helll that is the Atlantic North Sea or hurrcane prone GOM, drills are rightly and smartly being moved to the Persian Gulf. Only political and geopolitical issues create any difficulty, and being where it is, to bet that some very large fields might not be found there is a poor bet indeed. I wouldn't take it.
I think the theory that the world is an "empty cupboard" can be accepted only as a matter of faith, not evidence, and the same can be said for Saudi Arabia.
-----
Is this a good thing? I would make the argument that while the fact (yes, I accept this as FACT) that there is certainly NOT going to be an "end of the world as we know it" or "dieoff" or collapse due to a lack of crude oil or natural gas (and especially not due to a lack of "energy" per se), and that "The Olduvai Theory" of a rapid slide to the stone age does nothing, NOTHING but discredit real and very important concerns about energy that we must deal with now, it creates a whole list of concerns, which are complex, but can only be stated in the broadest terms here:
(a) Are we facing a potential "1982" scenario, in which the world markets could be flooded with oil in a bid by various contenders to hold onto market share and world power by way of the favors and concessions that oil can buy (witness the brilliant use of this by the Saudi's. If any other nation had provided the world with the 9/11 terrorists, as most were Saudi, they would have been bombed almost out of existance)-but Saudi Arabia, as we know, has an "exemption" to almost all rules)
If so, will even a flood of oil be able to keep up with world demand, including China and India, and the developing world which is now modernizing and incorporating automoblile and truck traffic at a rapid pace?
How can we know for certain that the "flood" scenario is out of the question, or at least a marginal enough possibility to be dismissed as not worth making contigency plans for?
(b) Could the world eco-system and atmosphere withstand another "luxury carbon bath" by the industrialized and industrializing world, which would easily pump untold amounts of carbon into the environment and possibility accelerate world climate instability, and pass "tipping points" leading to sudden and completely unpredictable changes in climate?
(c) Would another period of cheap oil and growing economies essentially destroy all financial incentive to develop alternative energy, efficient transportaton, and what has been called the art and science of "elegant design" and conservation engineering? If oil holds where it is inflation adjusted (i.e. around $60 to $70 dollars per barrel) is there any real incentive for large scale change, especially in nations with aging populations who will vote and purchase on a "business as usual" basis (i.e., Japan, U.S. and Europe)?
(d) Lastly, and this one is big: Can the industrialized nations withstand the money export and balance of trade deficit to the oil producing regions (Saudi and OPEC in particular) that would come from massive and increasing oil production in those regions? It would be by far (even compared to today) the largest transfer of wealth and power to a small unstable region of the world in history. The possibility of human rights abuse, instability and powr and wealth grabs by warlords and dictators increase as the stakes go up. And the stakes are now becoming very high.
IMPORTANT DISCLAIMER: I am not suggesting, as such groups as CERA seem to, that all will be well, the "globalization" of energy will fix everything, and technology will save the day. Quite the contrary: I am repeating what I have often said here: The absolute blindness we run in destroys consensus on real development of alternatives and conservation, and creates an investing environment which can destroy wealth in a heartbeat. There is no easy path.
In one way, the surity of knowledge that would come if we could know that we are truly at or very near peak oil is comforting. We would then be able to proceed on with an overarching known factor resolved. I contend that it will be many years before such a factor will be known and accepted by anyone who is versed at all in the complexity of the world energy situation.
It will be very much a "surfing the change" environment of gluts, shortages, speculation, market runs, power shifts, technical and market breakthroughs, and "alarms" followed by "alls well" on such a repeated basis that the public at large is left with no really reliable price signal or source of information. Such is the world we live in. The only bet is to hedge every bet. Remember, you heard it here first.
Roger Conner Jr.
Remember, we are only cubic mile from freedom
Well Roger I ain't yawning, tell me about the Rub'_al_Khalit if you have a minute.
1) Was the area ever prospected by the yanks in pre-Saudi Amaraco days?
2) Does Simmons mention it in his book? If so what does he say?
3) Surely geologists would have a view as to whether the neighbouring fields extended under the Rub'_al_Khalit ? Sure it sounds a yucky environment (but then so is the North Sea when there is a Force 10 blowing.
4) Could Google Earth tell us if any test drilling was going on there?
Thanks in advance.
Can I also say - excellent piece Euan
Now I am confused - the link you provided says that the Shaybah oilfield is in the middle of the Rub al Khalit and was developed in the 1990s by the Saudi's. surely this suggests the area is not as unprospected as you suggest?
Ahhh, Shaybah! That's a bit of jewel in the desert crown, isn't it....let's have a look, and this will also answer your earlier question about whether Simmons mentions it, and why I did not specifically in my post, which as you may have noticed, was running a bit long...:-)
First, to Wiki, for an intro....
http://en.wikipedia.org/wiki/Sheyba
And then to the Saudi embassy, on the inaugural of production at the development:
http://www.saudiembassy.net/1999News/News/EneDetail.asp?cIndex=1098
Most of the materials and services needed for the project were provided by Saudi contractors. The project involved 50 million man-hours, 12,500 tons of prefabricated steel girders, and 200,000 cubic meters of reinforced concrete. Over 30 million cubic meters of sand were moved. When development activities began, there were no paved roads in the area, only the rough tracks used by early exploration teams. There were also no services available, so anyone traveling there had to take along all of the necessary provisions.
A long article including Shaybah and other developments:
http://www.allbusiness.com/mining/oil-gas-extraction-crude-petroleum-nat...
And now, Simmons in “Twilight In The Desert”:
"New Discoveries In The South. The Sheybah field was discovered in 1968 in Saudi Arabia’s Empty Quarter at the southern end of the Easter Province very near the border with the UAE. Over the next several years, Shaybah was the subject of extensive delineation drilling and economic study because of the large volume of of the estimated original oil-in-place: 25 billion barrels. Given the remoteness of the field, which lies amid sanddunes of immense proportions, and the reservoir’s complexity, it was left un-tapped for the next three decades. The field would finally come onstream in 1998, just as the twentieth century was winding down, the first major Saudi Arabian oilfield to be brought into production in almost 30 years. Shaybah cold also turn out to be the last giant oilfield discovered in Saudi Arabai, despite continuing efforts and the use of increasingly more sophisticated technology.”
Simmons then discusses, under “The Difficulty of Developing Shaybah” under a heading by that name on pages 206 through 210 of “Twilight”. This is a very interesting set of pages, but is a great read in that it discusses something else being discussed on this string of posts, that being the use of horizontal drilling, which in the case of Shaybah, proved essential in extracting the oil. Also essential was the use of MRC (Maximum Reservior Contact) wells, and Simmons says: "All 105 wells drilled at Shaybah are horizontal, and many of the final 45 wells are MRC multilateral competions with as many as eight or more laterals."
According to Simmons, this has to do with the porousity and "wetability" of the source rock in the area.
However, all of this changes little about what we in the West know of "The Empty Quarter". What it does prove is that there is at least a fair amouont of oil there, if Shaybah is any indication. But how much, and how hard is it to extract, both from a geological drilling standpoint, and the sheer problem of getting materials and people into the area to Explore and Produce the oil?
I would differ with your assertion however, "surely this suggests the area is not as unprospected as you suggest?"
We in the West still have very little idea how much more exploration/prospecting has gone on in "the empty quarter".
It is a vast area. And if Shaybah proved to be so difficult and time consuming, we must ask if Saudia Arabia even made much of an effort in the 1980's, 1990's given that oil was givaway cheap. Or did they make the effort, find out what they wanted to know, and then kept their mouth shut?
That was why, in my earlier post, I made the little remark, that "the empty quarter" and offshore Saudi was virtually unexplored, at least as far as anyone in the West seems to know, and there I said with tongue in cheek, "there's the rub".
I cannot dismiss the way in which the Saudi's speak of being able to deliver the oil they want to deliver (again, there's the rub! ;-), with such assurance, almost cockiness, as if they KNOW what they can do, and we simply do not. Information in these situations can be a fantastically valuable weapon. And yet, the one place WE KNOW they went to work in the empty quarter, they turned up with the a giant field...(!). Simmons says it may well be the last...but how can he, we, know that? Again, I would be leery of betting my retirement fund on it....
Roger Conner Jr.
Remember, we are only one cubic mile from freedom
Roger:
In some of the ARAMCO Alumni magazine articles they have written about doing the aerial surveys over the Empty quarter, which they had to have done to have found Shaybah in the first place. So it might be reasonable to assume that if they had found a similar prospect somewhere else in the Quarter that they would now be developing it, rather than looking out in the Gulf to find other fields.
The only problem is that these fields would need to be developed regularly after they are discovered to cover declines in existing fields. I understand that KSA has a lot of resources so they could bring the fields online at their when they are ready although it looks like the constraint was technical in other words the moment technology developed they developed the field. Note that they suffered some failures before trying to develop fields with vertical wells.
Even if they have all this oil they would have had to start development of these magical fields four years ago to cover the coming supply/demand gap. Thats why claims of 15-20mbpd of production for KSA have been made. Since they have not we are going have a supply/demand gap from now on out and its no-longer physically possible for KSA to close this gap if they can.
Put it this way discovering a whole new KSA 15 years from now does not do us any good.
Once this gap develops and the world is permanently under supplied we have to change.
Regarding C we have in Sweden efficiency standards and investments that have survided since the 70:s oil crisis. A lot of momentum is lost during a few years sale on crude oil but surely it becommes more obvious with time that the cheap oil will be gone some day?
The main problem for todays energy planning in Sweden is not peak oil but global warming. I would expect a lull in oil prices giving a few years of realy good economy to lead to more investments in rail, roads, district heating and cooling and so on. That we need to get this into place to make our urban areas nice and cheap to live in and travle between before our population has aged is also used as a serious political argument.
Roger, thanks for this thoughtful contribution - worthy of a post in its own right. I tend to agree with most of what you say. Especially regarding "Olduvai". I have a post in prep that looks at this and my feeling is that we have lots of energy - the real issue is what will be the consequences for climate if we use it all.
WRT to what's junk and not junk, I think the Saudis have been blessed with such a huge volume of fantastic reservoirs that they have not had to try that hard to date.
In future they will have to make do with the same junk that has fueled UAE, Kuwait etc ;-)
Euan:
In my earlier calculations on this I made the assumption that the new wells that are drilled at more likely to be closer to the 4,000 bd level, rather than higher numbers, since this equated to what is being achieved in their latest field developments (production target divided by number of wells drilled). With the number of rigs drilling steadily rising, then the overall potential number of wells that can be achieved each year will also rise. However drilling the multi-laterals takes a longer time period, and particularly if they are concurrently inserting the valves that are needed for waterflood control in the "smart" wells, so that it seems reasonable to assume that a rig will not be able to achieve more than 6 wells a year. Then it just becomes a matter of arithmetic.
HO
Would you be willing to respond to this. I think that comparing the flow rates of and advanced multi-lateral well to a classic vertical well is not correct. Technically you need to compare flow rates/per area drained. So if you do things like say one lateral well === four verticals you get a much larger decrease in well productivity than is suggested by comparing well counts.
Virtually all the wells that are being drilled over there at present are presumed to be multilateral or maximum reservoir contact (MRC) but the more recent ones also have valving (see Saleri presentation) to allow segmental shutoff to control waterflood and to allow production from areas that would otherwise be lost. So when I use the 4,000 bd it was based on 1.2 mbd of production divided by 300 wells (roughly) - as Euan had mentioned earlier - these are the anticipated numbers for the Khurais Field
Hi Euan,
Thank you for all your work (and everyone's).
re: "...my feeling is that we have lots of energy..."
Here's the thing, though...what are the hierarchical relationships of dependency among the different "energy"/fuel sources, though?
Can we analyze these relationships? And do so in a way that's meaningful? (So, if oil is not there by a factor of X...what is?)
What kinds of dependencies am I talking about? Just as an example, take energy production, say. Or, development of new energy production technologies as a function of...available capital? (What else?)
I mean...what relies on what? (and for what purposes?) This seems to be the bigger problem, really. (One of them.)
(Does this make sense?)
The Rub al-Khali
Saudi has been exploring for oil in the Rub al-Khali for almost half a century. In 1969 they discovered Shaybah deep inside the Rub al-Khali. It was the twenty-eighth oilfield found in Saudi Arabia and the last of any great size!
Nevertheless they did not stop looking when they found Shaybah. They have been looking almost constantly in the Rub al-Khali for almost half a century. I have heard rumors that they are concentrating their efforts elsewhere as of late.
A very small field was found a few years ago about 70 kilometers southeast of Ghawar. Though it is tiny and water injection and oil pipelines must be laid over the dunes, Saudi is so desperate for oil they are going ahead with the project.
So no Roger, it is highly unlikely that a few square miles of oil is hiding in the Rub al-Khali. Saudi has been constantly looking for oil, in the Rub al-Khali and elsewhere, since Shaybah was discovered in 1969. In all that time they have found only one discovery of any size. In 1989 they discovered the Hawtah Trend fields. It was the only significant discovery of oil in Saudi Arabia between 1969 and the present. Also the Hawtah Trend fields were the only major discovery, ever, outside the Eastern Province.
My point is, if you are talking about future oil production from Saudi Arabia, you are very likely talking about fields that have already been discovered. Oh a puddle might be discovered here or there but all major or even all minor fields of any size has already been discovered.
The very fact that Saudi has been actively looking for decades and only come up with one tiny patch of scattered fields, the Hawtah Trend fields, and one tiny field deep in the Rub al-Khali in all that time is a pretty good indication that all the fields of any significance have already been found. And that includes the entire Rub al-Khali.
Ron Patterson
Hey now Ron, stop with the Big Picture thing you're posting about - this thread is for the cornucopians, don't ya know? :) People should remember that this data ends at 2005, and that the preponderance of the available evidence reveals that the world is at or near peak. Is that iceberg 1 hour away, or 4? Cuz if it's 4 I'm just gonna party as if world oil discovery didn't peak in FRICKEN 1962! Hell, it's not like we're using 6 or 8 barrels of oil for every 1 we find, right?
Nah, fast food and SUVs forever!
I see what you are saying. Change the tone a little, and your meassage will get through with impact! I believe the cor#nucioians are just scrolling by right now...
Roger,
Excellent points.
Also consider that given vast sums of money available to oil producers (IOC and NOCs, insignificant fractions of that money could be used to buy up and control patents to any and all emerging competing technologies. And IMHO it will.
It is going to be burnt until there is nothing left to burn. Then a switch to renewables will be permitted.
rc, "burn their's first and save ours" isnt that a little absurd ? are we, have we or will we save (conserve) anything until we are forced to ?
Are we talking about well productivity before or after water cut, this data is C+C production per well after separation, yes? Also, why wouldn't production in a given well (since the are now mainly horizontal and increasingly MRC) fall precipitously once watered out? Can we really assume that retired wells if brought back on-line will now pump anything but water?
Euan a very good post indeed. Once again let me stress that I’ more inclined to your side than Stuart’s, and that the numbers favour you.
But let me also add some wood into the fire. Your reasoning is sound but ends up in 2005 – Stuart’s claims are focused on 2006. So only when we get the number of wells drilled, mothballed and in production in 2006, may we get a clear picture of what’s going on in Arabia.
There’s one little point that you ignored and that might make all this much denser: the rise in drilling rigs operating in SA. Too early to tell, but I fell that since 2005 the number of retired wells available to bring back into production has probably shrunk too close to nil.
Luis,one thing that struck me about looking at total rigs as opposed to just oil rigs is that the rise has been more constant and not just a phenomenon of the last 2 years.
I would expect to see the Saudi rig count rise continuously now for so long as they have an oil industry. There is no doubt that the average productivity per well is falling (e.g. Khurais) and so they will have to drill more wells to maintain the status quo. The big problem will hit when they run out of production prospects to drill - and as I said this may not be too far away. And generating 1000 prospects / year will not be the easiest thing to do. They will probably end up drilling Ghawar on a grid - and get lucky with some wells.
WRT to retired wells - my feeling is that they have retired wells in 2006 and some of those may be brought back on in 2007 if a production spurt is required. We will maybe find out in September.
Euan,
Thank you very much for all the effort in collecting and analysing the data!!
The more data we have about Saudi Arabia, the better for everybody. When liquids demand increases later this year, we will find out if Saudi Arabia truly does have available surplus production capacity.
Horizontal wells are much more than a vertical well rotated 90 degrees
A well can be vertical or horizontal. However, a horizontal well can be one single well or a maximum reservoir contact (MRC) well like the one below. Should it be counted as one well or many?
The quote below is from this link.
http://www.welldynamics.com/press_releases/2007_jan_24th.pdf
“Saudi Aramco pioneered intelligent Maximum Reservoir Contact (MRC) wells, which attain more than 5 km of contact with the reservoir through intelligent laterals off the main wellbore that can be partially or fully opened and closed from the surface. Saudi Aramco’s most recently developed field, Haradh Increment III, completed in early 2006 with a production capacity of 300,000 bbls/day, relies on 32 intelligent MRC wells that utilize WellDynamics’ SmartWell intelligent completion technology.”
Treating these MRC wells (>5km reservoir contact) the same as a normal vertical well gives an average of 9,375 barrels/day/well!
The next type of horizontal well to be jointly developed by WellDynamics and Saudi Aramco is an ERC well that could have an unlimited number of laterals.
“This joint development project is part of Saudi Aramco’s overall vision to develop Extreme Reservoir Contact (ERC) wells,” said Amin Nasser, Vice President of Petroleum Engineering & Development, Saudi Aramco. “ERC wells are intelligent multilateral wells that do not require individual control lines from the wellhead to each lateral or zone, and therefore, theoretically allow an unlimited number of intelligent laterals,” added Nasser.
The presentation below is
“Maximum Reservoir Contact Wells” by Salam P. Salamy – Saudi Aramco
http://netherlands.spe.org/images/netherlands/articles/26/spsalamy.pdf
It may be quite valuable in understanding Saudi Arabia’s potentially desperate production situation.
Here is a Saudi Arabia horizontal well chart from the presentation. Note the large number of horizontal wells drilled since 1997.
Your figure 1 “Average oil production per well” shows average oil production per well declining slowly from 1991 to 2005. Starting in 1992, the chart above shows Saudi Arabia starting their horizontal wells. New horizontal wells cannot be aggregated with old vertical wells to create a total number of wells. That's why your figure 1 shows a steep decline first when wells were mainly vertical, followed by a gentle decline when horizontal wells were introduced.
I wonder if it’s possible to do a chart titled “Saudi Arabia – Average oil production per kilometre of reservoir contact with the well”? This chart would probably show a nosedive representing Saudi Arabia’s desperation to maintain production.
Salamy’s presentation that some single MRC wells (SHYB-220 Hybrid) have 12.3 km of pipe! That’s an impressive well. SHYB-220 (Hybrid).
A big advantage of MRC wells is that they can extract oil from thin reservoirs while minimizing water and gas breakthroughs. However, when water channelling starts to occur the decline rate of an MRC well can be very high. Saudi Arabia is probably very concerned about this fact.
It’s also useful to compare your figure 5 with the Saudi Arabia horizontal well chart from above. Note the big increase in horizontal wells in 1997 and 1998 which correlates well to your increase wells drilled in 1997 and 1998.
The chart above shows that in 2003, about 120 horizontal wells were drilled in Saudi Arabia. Your figure 5, shows that in 2003, 210 oil wells were drilled. If it is assumed that horizontal wells are all oil wells, then in 2003, 120 horizontal oil wells were drilled according to the chart above. In other words, 57% of oil wells drilled in Saudi Arabia in 2003 were horizontal (including MRC wells).
Matt Simmons, in his book “Twilight in the Desert” says on page 323
”Such complex wells (MRC wells) now represent the best way Saudi Arabia has of extracting the oil that remains in its aging fields, and probably the only way available to maintain production rates high enough to keep export capabilities around 10 million barrels per day.”
Horizontal wells are not limited to Saudi Arabia
Since horizontal including MRC wells are a relatively new technology, they could be a serious “below ground” factor for peak oil.
This is a presentation by Saudi Aramco
http://www.saudiaramco.com/sa/webServer/general/Presentation_Fifty_Year_...
which discusses the use of MRC wells.
OK, so the reported production per well, practically constant at around 6000 bpd for more than a decade, is meaningless? Or phony?
Because if it's accurate, it's pretty extraordinary!
If there are around 2000 Saudi wells in production, and presumably, by now, more than 1000 of them are horizontal, the constant production rate per well surely demonstrates a huge decline in the average production rate of the vertical wells. Or are these new smart wells, which are capable of producing 10 000 b/d, throttled back to produce only 6000?
I'm confused.
I'll bite, since Euan doesn't seem to want to....
When I first started looking at the Saudi well issue, my picture was that they would put wells into play at 10,000 bbl/d, and run them down to roughly 1000 bbl/d and shut them down. I'm now convinced that this organic picture is totally wrong - instead, they have a regular rotation that they go through, keeping a given well on-line for somewhere around 5 years and then cycling it down. The statistics that Euan mentions seem to indicate that the wells they are taking off-line have no production differences from the "average" producer. What's been changing is the nature of the rotation - more MRC wells and trending away even from horizontals, with verticals totally dead (except in small fields like Hatwah).
This leads me to believe that the Saudis are deathly afraid of gas/water breakthroughs on these big horizontal/MRC wells, especially now that basically all producing wells in the kingdom are of this type. I assume the cycle time is based upon experience - Simmons in one of his talks shows an example of a horizontal well from Shaybah that had gas breakthrough - and by cycling and resting the wells the water/oil/gas interfaces remain as far from the well bore as possible, and as level as possible. My inference is that they will need to cycle more and more frequently as time goes by and the interface creeps closer to the well bores, and that this is the real reason for the expansion/increase in number of wells drilled/new fields developed. In contrast to Simmons' contention that the Saudis are cavalier with their fields, I now believe they are ultra-cautious. The question, of course, is why - evidently they were getting burned, particularly with the attempt at verticals with Haradh I and even the horizontals with Haradh II (they are evidently infilling with MRC wells for that project now).
The issue to me (I so far have no stand on whether the Saudis are throttling down or depleting) is whether the Saudis have altered this resting cycle, and we won't know that until the 2006 OPEC data come out. If they have broken their pattern of recent behavior, namely mothballing about 130 producers/year, then it's a total production blowout and Stuart is right. Of course, it is possible that both Stuart and Euan are in a sense right - if the rotation cycle has sped up so that they need to take wells off-line more frequently to protect them, then their sustainable capacity has been reduced, even if the actual capacity and per-well productivity remain the same!
As far as numbers are concerned, Saleri at the CSIS talk said that the average well productivity for a vertical well would be 300 bbl/d, where the MRC wells do about 10 kbbl/d. So, probably about a factor of 30:1 would be right?
Thanks !
worth considering is the likelyhood that Sauidi production has entered a new era of rapidly increasing decline rates and water cuts marked by the sharp rise in horizontal wells in late 90's. The costs associated with keeping up with and replacing decline volumes will continue to rise as they walk the decline treadmill.
First, thanks for a nice post Euan. Great for alternative view and getting the debate centered on production.
Second, I agree with Ace and Alistair that horizontal wells and lack of post 2005 data introduce a lot of gray to otherwise black and white data.
Ultimately in my mind Euan's post clarifies how SA HAS maintained high output per well in the past. But it does little to FORECAST output from those same wells.
The key is that using very sophisticated horizontal wells in combination with water injection may have maintained high extraction rate in the past but may force rapid decline in the future particularly in Ghawar. This is the great unknown.
Will the design system employed in Ghawar (for ultimate extraction efficiency of the oil layer) during the last two decades provide little or no warning for a collapse of many wells simultaneously when the gas cap and water get to close to each other? Have to wait and see.
I've been flicking back and forth between Euan's "average oil production per well" graph and Ace's "growth of horizontal wells in Saudi Aramco" and find it quite suspicious that the productivity of the wells was in a fairly steep decline right up until the point where the horizontal wells started coming in and productivity has been about flat to slightly declining since then. It went up a little from there until it topped out again in 1995, then down a little bit in 1996 into 1997 when there was what looks like a bit of a panicked boom of horizontal drilling in 1997 which brought things back to flat again. Then the amount of horizontal wells, and their growth since 1997 and especially around 2002 when there's another jump are rather frightening.
Can anyone manufacture a graph that has the number of horizontal wells drilled in KSA along with average oil production per well, price per barrell, and world GDP (or whatever appropriate economic indicator) ?
This seems pretty damning to me, rather than reassuring.
Ive been asking for someone to show me how to create a graph series with price per barrel coupled with barrels produced and a few other items to compare the ramping up of heavy equipment with higher oil prices and falling production. That's what gets me. I know of no human who would choose to decrease production in spite of higher prices. Doesn't make much sense to me.
http://thefinancedude.blogspot.com
But that is exactly what the Saudi's have done for decades - that's what "swing producer" means. They learned the hard way in the 1980's that flooding the market with too much oil is not smart - the price drops faster than their production increases, so they get _less_ revenue, and use up _more_ of their treasure.
Read the text of the presentation to CSIS 2002 - the Saudi rep states quite explicitly that they keep their production rates very low by world standards, to conserve their resources.
CW
Global peak: 2007 - 2010
Global decline rate, Post peak: 2%
Economic response: Severe global recession, ~5 years, then slow recovery
First, thanks for a nice post Euan. Great for alternative view and getting the debate centered on production.
Second, I agree with Ace and Alistair that horizontal wells and lack of post 2005 data introduce a lot of gray to otherwise black and white data.
Ultimately in my mind Euan's post clarifies how SA HAS maintained high output per well in the past. But it does little to FORECAST output from those same wells.
The key is that using very sophisticated horizontal wells in combination with water injection may have maintained high extraction rate in the past but may force rapid decline in the future particularly in Ghawar. This is the great unknown.
Will the design system employed in Ghawar (for ultimate extraction efficiency of the oil layer) during the last two decades provide little or no warning for a collapse of many wells simultaneously when the gas cap and water get to close to each other? Have to wait and see.
ace,
your first chart about the number of horizontal wells seem to contradict the conclusion from Euan!
During the late 90ies, the Saudis have increased the number of horizontal wells dramatically according your graph.
Nevertheless, Euan's first graph about the average productivity of an oil well remains flat between the 90ies and now. You wrote, the horizontal wells should increase the output of one well quite a bit, which I guess is undisputed. Therefore, a bump in the average well productivity would be expected if the other wells would maintain their productivity. According to Euan's graph, it is not.
This you make me believe, considering that new horizontal wells have a high productivity, that the other well's productivity has declined over the time as otherwise a basically flat average could not emerge.
More stunningly, even during the drilling in the last few years where more and more horizontal wells were drilled, the average productivity did not increase. This again makes me believe that even the horizontal wells from the later 90ies seem to drop in productivity.
Bingo. At first glance it was wath ? Then you think about it and get kinda a sick feeling in your stomach.
Great posts.
Horizontals in sa means that the end is near. Production/well might even climb right up to the end, but this is apples and oranges...
Think about it like this: a vertical well has a reservoir contact equal to the oil column height. A horizontal well, from the various posts, has a contact up to 4000'. So, if the column is down to 100', then the horizontal well has 40x the contact area of a vertical well. In this case, the 3x more expensive horizontal well has become cheap, and is equal to 40 vertical wells.
I have long thought that the key to future sa production is their move to horizontals. If you have a 1000' oil layer, you don't need expensive horizontals... cheap verticals are more than good enough. ANd, they were good enough for sa for nearly half a century.
But, high tech horizontals are the perfect solution for when water approaches the gas cap and one wishes to extract the last bits... but, when these go, it is time to produce the gas because the oil is gone. And, not 'gone' in the sense US oil is gone; in the us, oil was produced without horizontals and without water flood, so the opportunity remained for secondary production, and the resulting us depletion rate is low. In sa, water flood was introduced early, so secondary is produced along with primary. Horizontals + water flood = very high decline rates, around 1.5%/month as the horizontals water out.
And, the water flood itself, as posted on this site before, is rapidly tightening its noose around ghawar's productive north end. Shut in oil wells are steadily converted to water injectors (these 'resting' wells will not revert to oil producers any time soon), steadily reducing the field size as water rises from below. What might this mean for the field depletion? Might the field area be down 75% as the column height is down 90%? Production/well provides no clue, as horizontals produce at full rate until they water out.
The fact that horizontals have become so popular world-wide is not because they have become cheaper but because the world's oil columns are thinning fast. Combining prmary with secondary, and the world-wide move towards horizontals, mean the back side will be steeper than some are hoping.
Ace, one of the best damn posts I have seen in years. I am awaiting Euan's reply with abated breath.
Thanks, thanks a million.
Ron Patterson
Ace, this is a positively scathing rebuttal to Euan's points. Horizontal wells cannot be compared to vertical wells and KSA changed from vertical to horizontal wells in the time frame he tries to cover. I believe that this analysis totally blows Euan's points out of the water and further reinforces Stuart's - that KSA is at or near peak and the recent declines are not voluntary at all.
In fact, well data for 2006 might be the key component in finalizing this argument.
Ghawar Is Dying
The greatest shortcoming of the human race is our inability to understand the exponential function. - Dr. Albert Bartlett
So, as I understand it, horizontal wells are skimming the oil off floating on the top of the water. If they start producing almost totally water, that means the oil is gone, right? Any remaining oil would be floating on top and if it's not there, it's not there. Does this not mean, when they water out, it's gone. Not peaked then decline but peaked and depleted?
Correct. And with horrendous field decline rates.
As posted else where the wells don't generally go all at once. And generally you can still drill new wells.
Also the biggest trick is to cutoff portions that have break through in the mult-laterals that have a valve to turn off a watered out lateral. For normal wells they insert I think a sort of ballon or sleeve that cuts of the portion where they have water break through.
I'm not and expert on this I could well be wrong on the details. In general the well does not get break through along it whole length till its fully watered out but production begins to drop steeply basically immediatly.
One reason any hint of water problems in a field drilled with horizontal wells is a problem. Even a 30% water cut in Ghawar with horizontals is a signal that a big problem is starting.
Yes and no.
The oil will be gone, at which point the world's greatest oil field will convert to a major gas field. Some oil is produced with the gas, and this oil will become the tail.
Ace - thanks for posting this information and for your comments. It seems half the TOD readership are waiting for me to reply. I've not had a chance to read your links yet, but will do so and hopefully get back later if needs be.
Deploying horizontal wells
This is true in many cases but I'm not sure this is the principal use of horizontals in Saudi. In Saudi the first use is to target thinning oil columns squeezed between advancing (multiple) water and gas contacts - and yes here there is serious danger of getting sudden watering / gassing out.
The second use is to target the vast reserves contained in low permeability reservoirs. These need to be produced slowly (per foot contact with reservoir) or the pressure drops below bubble point and your screwed. Using long multilateral completions in this environment allows high well productivity with oil bleeding into the well bore. So I think application of this technology to Haradh and Khurais shoudl be seen as Saudis adding reserves and production through technology. Sure, these are second tier assets - that most OECD companies would die to get their hands on.
Dog leg Figure 1
I'm not sure your explanation is bang on here - though it may contribute. I see the dog leg at 1991 brought about by the completion of the well retiral cycle that culminated in GW1. In 1990 they had 980 producers and in 1991 1400. So the settling on 6000 bpd is in part adjusting flow rates from an increased number of wells to the desired output.
So, then, we agree that horizontals in the old giant producers are an indication of thinning oil column/approaching gas cap... in which case the old giants could go any time, certainly including 06/07, and simply can't have long to go before the crash.
Regarding near virgin low permeability reservoirs with a thick oil column, I would still think that verticals would be cheaper/foot of contact area than horizontals... but don't know for sure. Maybe somebody could comment on this? Another reason to prefer verticals would be that perimeter wells can be converted to water flood, as has been done for the giants. Don't see why permeability would affect this point...
I agree sa is moving towards heavier oils from lesser permeability rock as the better regions wind down... slowing production over a longer time may be in their long term interest, but probably not planned...
Ace - so what I've done here is adjust the chart on a basis of 1 horizontal = 3 wells, cumulative, no horizontal retirals.
Very worth while exercise IMO. It confirms what I said that the shift to horizontals is part of the story but the dog leg from the retiral cycle is still there.
You are entirely right to point out that mixing horizontals with verticals on a single chart has limitations. But so does this chart - an important factor is the longevity of wells - and now we wander off into imponderables. If a horizontal lasts 3* longer than a vertical the you are justified in making a direct comparison.
So where does this leave us? I still don't see a nose dive - though I suspect some folks may point out that I've not plotted 2004 onwards - so I'll book a flight to Riyadh first thing!
Hmm 30:1 was mentioned as a good number for mult-contact Hz-Verical. I used 4:1. Dunno about the life times your right its important but its a tough call. The problem is when a Hz waters out its dead while in the case of a vertical you probably can drill a new producer. Next a vertical probably benefits more from resting that a horizontal well.
In any case 3:1 seems low. I'd say its anywhere from 4:1 to 10:1 or 30:1 for a multilateral and thus ambiguous. I don't see a rosy picture here but its not obvious one way or another.
Your right about horizontals working a lot better in tight formations this has been documented in many fields. But in other regions these tight fields tend to be the last ones produced for this very reason.
Its interesting that Russia and KSA took to different approaches to producing oil in large regions. My understanding is Russia uses mainly normal vertical wells and deals with the water while KSA seems to do everything they can to avoid water. This is why I think Russia will last longer than predicted and KSA will decline faster.
A tortoise vs the hare scenario ?
Memmel - I did a chart with 30 showing a nominal average well productivity of 400 bpd. So for those who want to have it that way Saudi well productivity nominally crashed some time mid-1990s. This IMO is just plain daft. The Saudis have probably never ever produced that little oil from a well and the fact of the matter is that on Haradh and Shaybah they have a large inventory of wells with a significant life ahead of them and in Khurais a stack of new wells not yet used. The fact is the Saudis have opted to use a small number of large contact wells instead of a large number of low contact verticals and the average production per well in 2005 was just below 6000 bpd as a result of this.
The problem as I see it is that this configuration of wells is designed to provide efficient sweep, so when they do start to go you would be hard pressed to develop an infill drilling program. Also, they need to drill a couple of hundred of these things per year - and as I said in my post they may soon run out of development prospects of sufficient size that are worth drilling this way - and it is at that point that I see major problems arising.
Wow. All I can say is wow. You've deliberately chosen the least optimal ratio of horizontal wells to vertical wells. And you admit this without any apparent knowledge of the field.
KSA is a carbonate reservoir. In carbonate reservoirs the ratio is 3.9 to 1 for medium contact wells of length under 5000 feet horizontal!!! My gosh, man! As others have demonstrated KSA is taking this beyond what American experience has done and is extending these horizontals 3 or more kilometers at a time! We're talking 10,000 feet and longer!
Under such circumstances projecting KSA production as only 3:1 over horizontals is pathetic. At a minimum, I'd guess that we are looking at 8:1 production. And that is at the very minimum. The reality is likely to be even higher.
And if you plot THAT in your graph, your production per "virtual vertical" well catastrophically declines, further supporting Stuart's contention.
Ghawar Is Dying
The greatest shortcoming of the human race is our inability to understand the exponential function. - Dr. Albert Bartlett
Thanks again Euan and also Ace for this great discussion. Going to the Horizontal Well paper that Ace mentioned it is interesting to note that Aramco have to go to an MRC contact of more than 3 km to get above 4,000 bd/well.
Euan,
Your assumption of 1923 wells producing 5740 barrels per day of oil cannot be correct as that gives a daily production of over 11 million barrels per day which Saudi have never achieved, 9.9 million being the highest in 1980
If you saw a post I made some weeks ago M.K.Horn and associates in their work on the 930 odd giant fields of the world, done in conjunction with a group of highly qualified geologists and geophyscists over many years, gave a 2004 figure of 97 bboe of URR for Ghawar of which 79322 bboe had been produced showing the field over 80% depleted
DU...I was wondering when you'd show up in this thread...I think you and FF need to partner up here and give us a decent article of what you know about KSA!!
Wow that clears up a certain number of things.
BUT BUT BUT we don't have the numbers for 2006!!
Euan, if we postulate that SA peaked in 2006 and is in decline, could we in fact test this hypothesis by looking at the number of wells in production, and the productivity per well in 2006? I'm not clear on this.
If there are 800 wells sucking the juice out of Ghawar (I just made up that number for the sake of argument), and Ghawar goes into steep decline, how does that affect the statistics on number of wells producing, and production per well?
If the remaining bubble of oil in Ghawar is shrinking towards the centre, I suppose that wells on the periphery will water out and be shut down. Or, on the contrary, would it be a matter of rising water cut diminishing the quantity of oil, while the volume of liquid extracted remains constant? Or of diminishing the rate of liquid extraction in order to maintain the same water cut?
Or all of the above, or something else?
It seems obvious that if they report a relatively constant number of wells in production, with production volume down, that would point to a major problem with Ghawar... but I'm not sure that a major problem with Ghawar would necessarily show up like that.
i.e. if they had to retire 200 watered-out Ghawar wells but managed to keep up the production rate on the others, then it would look like they were managing things as they usually did when shutting in production voluntarily...
When will the 2006 statistics be released by OPEC, and what will be able to deduce from them?
i would like to comment on the idea of "resting" wells. imo, it may be effective to a limited extent but in my experience it doesnt keep the water cut wolf from your door for very long. if the reservoir was perfectly homogeneous then a well would produce 100% oil and then water out in a relatively short time. but of course these carbonate reservoirs are not homogeneous so "resting" wells may work for a limited time. water advances faster in the high permeability zones and eventually reaches the wellbore. then, if the wells are shut in water "imbibes" into the lower permeability rock. the imbibition process is quite effective in displacing oil (the irriducable water saturation increases). displacement by imbibition is very limited (as a % of pore volume).
so on balance, it appears the saudi's have been able to increase production from time to time by bringing shut-in wells back into production and drilling new wells in a more favorable position (and configuration). we cant assume this can go on forever and probably not very much longer, if at all.
not much has been said about artificial lift. sooner or later the saudi's will be forced to begin pumping and/or gas lifting the wells. i dont have experience in artificial lifting horizontal or multi-lateral wells. i know it can be done but presents additional challenges. on the other hand if the saudi's can install artificial lift fast enough, they may be able to actually increase production (who knows ? 15 million bpd may be possible for a brief time - i doubt it).
Intersting you shoud make this point. OPEC do provide data on free flow versus artificial lift:
Some examples from table T37 for 2005:
Saudi Arabia flowing 1795 artifical lift 128
UAE flowing 1174 artifical lift 401
Indonesia flowing 1149 artifical lift 6609
Venezuela flowing 625 artificial lift 13271
So basically the only help Saudi oil flow gets is vast amounts of water injection. In 20 years time they will no doubt have thousands and thousands of wells that are pumped.
If one considers WELLS as entities that appear, produce, and then die, in complex conditions, as they ‘evolve’ in function of human decision making / action (resting on a more or less static ‘natural’ base - e.g. recoverable reserves and the laws of physics) what one would want to know is:
a) the time span of Saudi WELL life (subtracting time out, taps turned off time) in conjunction with rate of production over that lifetime in some way. Then, these time spans could be matched to WELL characteristics that are considered important (eg. deep/shallow, in which field, technology A/B; x, y, z...) - some new characteristics might even emerge from the data itself. This would provide at the very least some broad, typical categories of WELLS, where the factors that account for variance are ‘grouped’ in some way and matched back onto real-life examples. Presumably, about a third of WELLS would turn out to be particular in some way, ‘outliers’ of some kind, noisy or fuzzy.
b) One would then relate these life profiles to the birth, or here, appearance rate, and some of the characteristics of the entity that was created, taking into account somehow, as Euan (thanks for the post, v good) did above, that appearance is linked to death.
With all that in hand, I at least would be willing to bet for or against Stuart’s prediction. (I would still be betting in a situation of high uncertainty, but I like to bet.)
The data just ain’t available. Partly, I suppose, through secrecy, but partly too because the energy field is dominated by economic analysis, geared to output and dollars; biological metaphors such as this clash with the idea that it is human capacities (technology, etc.) and human decisions, human will that account for the whole process, with Nature as a ‘free lunch’ in the backdrop. However, the multiplicity of human actions, no matter how interactively complex, can be seen as ‘organic’ in a way. The metaphor is also useful in the sense that it might serve to better delineate the relation between Nature seen as ‘geological postulates not amenable to change’ - the inevitability, for ex., of peak oil as a quasi-logical, certain fact - and human actions that do, undoubtedly, transform the meaning, pertinence, relevance, of these facts.
Hello Euan,
Terrific keypost--great job on data organization and charts! Also big thxs to the other commenters--keep it going--TOD at its best!
I don't have the expertise to get widely involved in this discussion, but like Luis--I would like to throw some fuel on the fire too. =)
Would it be safe to assume that Simmons and his research staff, and T. Boone Pickens and his staff have earlier looked at this same OPEC and KSA data, carefully analyzed it, then both separately concluded the unlikely chance of any future large KSA production flows? In my mind's eye: these two heavy-hitters have joined the growing Deffeyes Group [WT,Darwinian,SS,Ace,Memmel,et al].
These two gents have billion$$$ in play, yet both are calling Peak Now--how much should we junior TODers value or discount their research conclusions as compared to ASPO's Colin Campbell, Ken Skrebowski, Jean Laherre, who, like you and R-squared, are calling for Peak Later?
I greatly respect and appreciate the diligent efforts of all the aforementioned gentlemen, but do we have any methods to qualify, quantify who is doing the best research?
Bob Shaw in Phx,Az Are Humans Smarter than Yeast?
Hello Bob, one of the extraordinary things for me is that I don't believe I've seen this OPEC data set referenced or analysed on TOD before. I've heard Simmons talk a couple of times - but never any mention of this. I'd have to read Twilight from cover to cover again to see if he mentions it.
With the data up to 2005 I'd find it very difficult to cut a doom picture from these data - but I imagine that someone will post a chart showing alternative interpretations before the day is out.
Yes, but if you only used US data up to 1969 you wouldn't be able to "cut a doom picture" for the US either.
As they said back then, "How could we be approaching peak, we've never produced so much oil."
Exactly. As Hirsch pointed out, you don't see the peak coming. Things always look great the year before the decline starts.
They also look great right before you have another great year...
The trick is telling the difference ;-)
If we have 10 years of 'great' production, and have to choose between assuming that next year will be great, or that next year will decline, Occam would suggest that we should put our money on "great", all things being equal... Especially if the owner of the oil company confidently predicts another 40 years of steady production...
CW
Global peak: 2007 - 2010
Global decline rate, Post peak: 2%
Economic response: Severe global recession, ~5 years, then slow recovery
But he's responding to Stuart's article, which gave a specific time for the peak. That being the case, the data should include that year, or it's kinda pointless.
(a) Not if he's talking about long-standing trends.
(b) Not if that data is not available yet, as he already pointed out.
If the data is not available yet, then there's no point to it.
It's the equivalent of me trying to support the "controlled demolition" theory of the WTC collapse by saying, "I was there in 1989, and I didn't see any planes."
Nice work, Euan, but I am still puzzled.
In 2005, EIA was forecasting a demand growth of 2% in 2006 and 2007. Oil production was planned to reach 86.8 Mbd in 2006. In fact, it has been 84.7
Where did the deficit come from? comparing 2005 predictions to actual figures for each country or group of country reported in EIA's Short Term Outlook, I found the following repartition of "good" and "bad" guys :

(sorry for the French , OPEP means OPEC of course ;). It does not include Angola).
Interestingly, most of the missing production came from OPEP and... USA. I do not know exactly why EIA's predictions for USA were wrong, but just have look on detailed forecasting for US production :
in 2005 :

and in 2007

Obviously, for some reason, USA did not succeed in increasing their production by +0.3 Mbd as expected. Rather it dwindled by -0.3 Mbd. Hurricanes cannot be the sole explanation since the production did not recover in 2006. Whether the US production will be able to grow again in the next two years is another, although interesting, question.
But the point is not there. The point is : if Saudi Arabia was able to act as a swing producer in 2006, why did it not compensate for the loss of US production, and why was the market regulated only by demand destruction?
Gilles - my suggestion is that it was demand that came up short of expectations and this grates upon one fundamental difference between Stuart's position and mine.
Had the Saudis produced more - where would the oil have gone? It would have dumped the price - and I don't think that serves the Saudis' or OPEC's best interests.
With futures markets in contango why produce and sell cheap today when you can sit on your oil and sell for more in the future?
THis is a position that can always be used to justify less production. Markets have been in contango since around end 04. Perhaps they should not produce any at all...
Presumably, there is a price that they think is 'high enough'. For several years it was 22-28/b. So, the argument is that now their idea is this is too low; well, what is high enough can of course change with time. However, one year ago they bitterly complained that 60 was far too high, and that opec should produce all out! Was this statement a true or false version of their view at that time? Because at this point they began curtailing output, either deliberately or not, and continued as price went from record to record.
Well, perhaps by end 07 we will have more to speculate with.
Euan, I think you will agree that demand destruction occured because of the 70-80 $ spikes of the barrel price. Theses peaks occured exactly when the production started being stalled, rather than increasing as in EIA's forecasting. Furthermore, during the whole period 2005-2007, EIA continuously predicted that production would grow again next quarter, and it never happened. I posted the following graph in a guest post some monthes ago, and it is still relevant : that's a comparison of all EIA's STO forecasting since 2 years.
I am very uncomfortable with the argument "Oh, naturally, oil producers have interest to get the highest price, so naturally they reduce their production". If it were so "natural", why does it happen just now? why hasn't the barrel price been 60 $ for 150 years? why does it happen just when doubts arise on their production capacities? why just for some producers - would you also argue that North Sea, Mexico, Kuwait, have also voluntarily cut their production to maintain high prices? why has EIA missed this simple phenomenon for 2 years, continuously predicting (and still again for the end of 2007) a future growth of a production, that never happened?
In other words, what has changed fundamentally in the world of Big Oil since the summer 2005 ?
Gilles :
The sceptic's answer is that since the summer of 2005, supply has been tight enough to maintain a high price by reducing production slightly. In the past, any attempt by OPEC, or unilaterally by SA, to obtain $60 oil by cutting back production, would have been undermined by increased production elsewhere. Now, nobody can take up the slack.
This, in itself, tells us nothing about whether the Saudi reduction since then is voluntary or not. We need to wait another 6 months to find out...
I would be very surprised if production passed 86Mb/day in 2007. And if it doesn't, my intuition says it never will.
Thanks Alistair
One could answer that it's immaterial to know whether oil production peaks because ALL oil producers try to extract as much oil as they can, but can't draw more, or just because every oil producer but ONE (who curtails its production to let prices skyrocket) does.
If nobody in the world is able to counter Saudi Arabia, which is it self very probably at least half-depleted, we are pretty close to the global PO anyway...
BTW, I wonder why KSA put Harad III on production and did not let barrel price skyrocket to 90 $ . Any idea, anyone?
Euan, your posts are just getting better and better!
I need some time to digest all this info.
A quick question: you used IEA (C+C) and then you multiplied by 1.2 in order to get C+NGL. Why didn't you use the EIA data instead? they have production numbers for NGPL and C+C for Saudi Arabia (1973-2006):
http://www.eia.doe.gov/emeu/international/oilproduction.html
Thanks Khebab - you and others have set a pretty high standard to follow.
WRT to EIA data - quite simply I don't know my way around all the data sets like you. I'm trying to follow IEA for monthly updates. Hopefully my adjustment for NGL is accurate?
Euan, Stuart, Robert and everyone else who has contributed to this page over the past year or two:
I just can't believe you all are volunteers. This stuff is over my head a bit, but not so far that I can't appreciate the rigor that shines in your research posts and the logic & accuracy of your methods. What a contrast to the vast sea of social leeches we all hear about, puffed-up CEOs pullung down millions for doing little more than trading away pieces of their companies and cheating everywhere they can.
Big Fat KUDOS to you all.
"Big Fat KUDOS to you all."
Standing, Clapping.
Ditto That for me too JeffreyET.
John
Euan, very intersting analysis.
this is "bottom up" while Stuarts was "top down"
The key differnce between you seems to be you say (in a message reply to Davidyson) the 2005/2006 decline was 1.1% and stuart says (I think) 8%
there seems to be a discrepancy in the numbers of reported production
the bottom up and top down should reconcile at some point, or it just becomes a question of different data sets
Polytopos:
IEA Jan 06 = 9.2 million bpd
IEA Dec 06 = 8.42 million bpd
So what Stuart has observed is that monthly Saudi production fell by 8% from the start to the end of 2006.
IEA 2005 C+C = 9.06 million bpd
IEA 2006 C+C = 8.96 million bpd
So what I'm saying is that Saudi production fell 1.1% year on year (YOY) from 05 to 06.
Stuart went on to extrapolate the monthly trend established during 2006 into 2007 and came up with an avaerge for 2007 of around 8 million bpd, representing a more than 10% drop YOY. Given the YOY drop from 05 to 06 was 1% I feel this extrapolation is unjustified and herein lies the root cause of the differing views between myself and Stuart. Its all explained by this chart:
OK thanks very much
I guess all we have to do is "stick around and we'll find out"
It seems to come down to one's view of Saudi Aramco.
Does Saudi Aramaco have a well thought out master plan for long term, stable, prudent development, or are they flying by the seat of their pants, like so many other (both private and public) oil companies.
Most oil companies tend to be in react mode - scrambling to keep up.
EM
So you say "production went up 2005, down 2006, average is within 1%".
But why is the drop of 8% coming 2006, thats the interesting question? That is more telling to me, than to mention the 1%.
Price is increasing, so SA should keep increasing right? But they dont (cant, want, whatever...).
I see spot prices down around 25% since last summer.
And you and others were at great pains last summer to point out that there was a huge fear premium in the price of oil, between the Israeli-Hezbollah confrontation and the ongoing rumors of US-Iran confrontation. Those rumors have trended downward to where we are now seeing the US approaching Iran and the Israeli-Hezbollah war is over. If you fail to even concern yourself with those factors in the particulars of the price spike last summer, then you have no business trying to tell anyone anything about price.
In short, the price spike of last summer is completely explainable by events outside geology, something that you tend to argue for yourself. I find it disingenuous of you to suggest otherwise (by silent omission thereof) when it suits your purposes but to then invoke market factors when it does suit your purposes. I am going to let that slide... this time. I do hope that this was an inadvertent omission and not something done deliberately as that would smack of intellectual dishonesty, and I don't think that is the goal here, is it, Euan?
Ghawar Is Dying
The greatest shortcoming of the human race is our inability to understand the exponential function. - Dr. Albert Bartlett
Well I certainly don't ever remember arguing about the fear premium and normally when I comment on oil price it is asking for advice about which direction may be next.
Anyway, I'm happy to accommodate you:
This just doesn't ring true?
I did NOT say that the rampant bull market had continued. But what I did suggest was that you cannot take the $78 price spike by itself and then point to it as some sort of bellwether when that event was caused by non-geologic factors. Are you really this dense?
Do you really argue that last summer's price spike is due to anything other than political factors? And when you REMOVE that spike from the pattern, then you can no longer claim prices are down by 25% can you? Suddenly prices are right in the peak range. It's like the Rita/Katrina price spike - you have to remove that from the system to see the real trend and if you do not, then your results will be distorted.
However, given the deliberate omissions and errors of this entire article, I now conclude that distortion appears to have been your goal all along.
Ghawar Is Dying
The greatest shortcoming of the human race is our inability to understand the exponential function. - Dr. Albert Bartlett
Brent spot prices are just slightly below the monthly average ($62) for the period after 5/05, versus $38 for the 20 months prior to 5/05. Monthly prices fluctuated within a range of $54 to $74 after 5/05.
In any case, a lot of questions will be answered soon:
http://news.yahoo.com/s/afp/20070319/bs_afp/commoditiesenergyoilprice;_y...
Oil prices close in on 61 dollars in London
Folks, we're on the first page of upcoming stories on digg, that means about 25 more diggs at a good rate and it "pops."
Whether you agree with Euan or not, the point is that the conversation is being had. So, digg it if you are so inclined.
Normally, I would be so inclined, as I believe that all points of this debate should be widely read, but I'm waiting for Euan or others to respond to the point made by ACE, followed by NC, Crude Commentator and Getting There, regarding horizontal wells. Following Ace's point, I'm left wondering what is the value of Euan's post.
IMO, it shows how weak the anti-near term Peak Oil argument is becoming.
As I noted up the thread, Euan only recently argued that the Saudi decline was too steep, on a month to month basis, to be voluntary.
As I have asked a thousand times, why the continued--and escalating--attacks on the near term Peak Oil view and on quantitative modeling, even as the data suggest that we are past the crude oil peak, and that we are probably facing a severe oil export problem?
Ego.
Replace "attacks on near term Peak Oil view" with "challenges to the near term Peak Oil view"...
Data that "suggest" near term peak are not sufficient. For many of us, the data are still quite ambiguous, especially for the crucial question of "Has Saudi peaked" ? As you correctly point out regularly with the Titanic metaphor, this only matters if you care about _when_ peak oil will happen (or more correctly, _when_ oil becomes "scarce" ala the Export Land model), and also if you care about "How quickly will oil become scarcer" ?
But these are _critically_ important questions: if peak oil happened in 2005, then TSWHTF almost immediately. If the Saudi's are correct, they could be able to single-handedly move peak out by 20 - 30 years. And if their planned (and observed) decline rates hold up, the global decline could be gradual, perhaps even within the tolerance of the global economy to adapt.
Continuing to analyze new information, and cross-check our previous conclusions is the _only_ way to get a reliable estimate of the Truth...
Many, many thanks to Euan, WT, RR, Ace, Fractional, and everyone else on the TOD community for the fantastic information!!
CW
Data that confirm your suspicions should be viewed with the _most_ skepticism...
Westexas wrote:
'As I have asked a thousand times, why the continued--and escalating--attacks on the near term Peak Oil view and on quantitative modeling, even as the data suggest that we are past the crude oil peak, and that we are probably facing a severe oil export problem?'
I have to say I don't see the counter views posted in the past weeks as anything like 'attacks'. They have read like well thought out intensively researched pieces - 'attacks' suggests a personalisation of the debate which I certainly do not pick up. 'Attacks' are what comes from CERA and their ilk, I have no doubt that all of the principle players in the on going debates of the past weeks are on the side of the angels.
This should read "too steep to be involuntary"
You got this completely wrong Jeffrey, I said they were too steep to be natural. Voluntary cuts can be as steep as you want them to be.
Euan,
You will note that I corrected the typo on March 19th.
In any case, a lot of questions are going to be answered pretty soon:
http://news.yahoo.com/s/afp/20070319/bs_afp/commoditiesenergyoilprice;_y...
Oil prices close in on 61 dollars in London
It continues to interest that the rest of the world thinks the sharp drop in inventories is of concern and that oil has become scarce while the us continues to happily drain its stocks as nymex falls...
US stock draws are usefully making up for falling exports...
I support Euan's efforts to provide another side to the debate about where Saudi Arabia's oil production is. I'm "off-line" but I will occasionally make an exception to make a comment, this is one of those times.
Speculation about what kind of wells (vertical, horizontal, multilateral) Saudi Arabia is using is just as bad as speculation about presumed decline rates based on the last few years of data.
Nobody knows what they're doing — shutting in ("retiring") some, choking off others, who the hell knows?
I think the sweet spot (Northern Ghawar) is definitely declining and that Saudi Arabia is struggling there to keep production levels up. In the higher part of the reservoir, south at Haradh and elsewhere, they are looking for replacement barrels. OK. But, falling off a cliff? Give me a break.
And, I brought up the "assay" crude mix (Arab Light, etc) in a comment one time and everyone ignored it. Why do you think they are investing heavily in the downstream refining business? But, if you have faith in the End of the World, you would not want to be bothered about the details.
People around here wonder why the "peak oil movement" lacks credibility and yet at the same time they take speculation as fact and predict the worst. Paranoia is not a good strategy for success. They're not out to "get you", although I wonder about that sometimes. They're just pushing their own agendas.
You know, the "peak oil" situation is bad enough, whether KSA is in the condition Stuart believes they are, or not. I guess none of this will be on CNN or NPR. Color me surprised!
Jesus wept.
Why do you think they are investing heavily in the downstream refining business?
Perhaps because their sweet stuff from the sweet spot is running out, and they feel that they can make more money from the remaining stuff (high in sulfur, vanadium, etc) if they refine it before trying to sell it?
Of all the components of the peak oil discussion, I have the lowest confidence in the “near-term Saudi peak” plank. Most of the other peak oil issues are well supported by the available evidence:
the Hubbert peak itself;
the peaks in US, NA, UK, North Sea etc;
escalating production costs,
declining EROEI, etc
But the near-term Saudi peak is contradicted by much of the evidence – particularly the most reliable evidence:
1) the historical record: the Saudis have an unequalled record of producing exactly what they said they would produce, over the past 20 years (or more). The Gulf War 1 spike in production was an unparalleled production feat in the history of oil production; their ability to deliver complex, maximum reservoir contact fields like Harwah III on schedule is a more recent example of their capabilities. This is a non-trivial piece of data. Any arguments for near-term Saudi decline, particularly based on Saudi incompetence, need to provide pretty conclusive evidence that is no longer true, or that their enviable production regime somehow results from incompetence.
2) First hand accounts. The most reliable sources of information are from the people closest to the event – in this case, Saudi Aramco. The presentations I have read about the status of their fields are detailed and comprehensive, and leave little room for argument. They know their fields, they manage them carefully, and they are very confident that they can continue producing at up to 15 mbd for as long as 40 years – if the presentations accurately represent reality. Since the presentations tie to the historical record, they have to be considered credible. However, we do need to assume that the presentations omit or minimize some risks, without actually lying, given the nature of corporate presentations.
Against these detailed and credible sources of information, we really only have :
fragmentary data about the quality of the Gahwar resevoirs (which is very vulnerable to skew or misinterpretation), or generic concerns about waterflood decline risks (which are strongly rebutted by the Saudi presentation).
outsider opinion (e.g. Simmons),
a number of extrapolations from the historical trends (e.g. loglets, HL, etc)
a few engineers with concerns based on limited technical data
none of which are testable. There is nothing that can prove that an imminent decline in SA productive capacity (though I am awaiting additional postings by fractional_flow with great interest…)
In this light, the recent Saudi decline trend provides a very exciting chance to test the near-term Saudi decline hypothesis. If the Saudi’s continue their production declines over the next few months, it will be the first solid evidence that supports the near-term peak.
If their production stabilizes, or increased back above >9mbd, the near-term peak theory will be significantly weakened, IMHO...
CW
Global peak: 2007 - 2010
Global decline rate, Post peak: 2%
Economic response: Severe global recession, ~5 years, then slow recovery
It's obvious Iraqi production is enormously limited by political and technological deficiencies.
I think a reasonable argument is that if Saudi production does decline, despite ample and demonstrated technical and economic prowess, (like Texas,US-48 and North Sea) then we are running into fundamental geological limitations which will be very difficult to reverse, versus ameliorate.
Note, however, that the bulk of the successful US oil establishment (Texas) and European oil establishment (North Sea) had been similarly accurate and delivered what they promised---until their fields declined down from their peaks!
Before peak, establishments were right, at peak and after, they were wrong until they belatedly got back on track with reality.
So does the expertise and reliability of Saudi Aramco mean that they are similarly right now in what may (or may not) be a similar circumstance? Why do they argue they will deliver a "flat plateau" of production for decades when other major regions didn't see that, they usually saw a rise and fall.
The advantage we have now is that perhaps with those two experiences we may be able to honestly identify, with reasonable confidence, the actual global peak somewhat earlier.
The purpose is to change expectations about the future and policy decisions based on them.
Again I expect them to be able to mount a short term unsustainable surge this summer. Even if it only came from tank storage they have at least 33 million barrels of storage so that a 1mpd increase in production. Next I agree that some wells are taken out of production but still capable of producing and they can always overproduce for a short period of time.
So in no way is a short surge lasting less than 3 months we expect this summer a sign that short term peak is not here.
If they sustain production at greater than 9mbpd for six months then you have a case. More important will be if a new peak price season starts this fall and they don't respond.
So I don't agree this summer will be definitive.
That's certainly a possible explanation for rising production for SA, but it is less likely than simply assuming that SA can produce what they claim.
I agree that the longer and more consistently SA produces at higher levels, the harder it will be to make a case for near-term peak, and vice versa.
It will be more interesting to see how this evolves!
CW
Global peak: 2007 - 2010
Global decline rate, Post peak: 2%
Economic response: Severe global recession, ~5 years, then slow recovery
The problem is sustainable production. I can see a lot of tricks that could be used to surge prodction for a short period of time 30-60 days and on the outer edge 90 days.
If it surges for that say less then 60 days then drops and prices remain higher than 60 then we know what happened.
A lot of people are gong to see this uptick in KSA production as a example that they are not at peak but its pretty easy to see a way to do it once when your just past peak. Note they could easily do some damage to the fields attempting this.
Hopefully if I repeat this enough when we see this brief surge probably to say 1.5 mbpd for 60 days we won't discont peak. The real test will be later in the year if we have a new fall peak and of course winter of 2008.
Think of it as KSA indian summer this summer. I acutally tend to think some of this decline is wells being rested and some production throttled back. I't would be a wild guess but I'd say it probably somehwhere between 200-300 kbpd taken offline that can still be produced plus another 200kbpd or so that can come from overproduction and then the tank storage. So its something like 1mbpd for 60 days or 1.5 for thirty days. After that as I said earlier their is a good chance that they would have damaged some fields if they really push it.
I think what will actually happen is the US will open up the SPR this summer to calm oil prices and help KSA avoid a damaging surge. I'm more intrested in this since if the US opens the SPR it means we know our at least our leader know peak oil is now. That has some pretty intresting political implications.
..they have at least 33 million barrels of storage..
Hmmmmmm That's a lot of storage.
Here's a question that has been in the back of my head, maybe it should have stayed there, but
How hard would it be for someone to buy a few million barrels on the spot market, and have them pumped/tankered to a storage site, then later moved to a "33 million barrel storage site", and then in some later month, PRODUCED and SOLD out of that 33 million barrel storage site?
How hard would it be to have some oil go into that 33 million barrel storage site that actually came off the spot market, and then at a later date sold as "NEW" production?
How do we really know that SA didn't peak a year ago and we have seen the greatest 3 card monti "Wheres' the Queen" shuffle of barrels of crude in the world?
And how long has there really been a usable pipeline from Iraq to SA?
Late Night what if's
Peace
John
It is logical to do what you say you will do, constantly building cred; and even more logical to say that you are far from peaking, regardless of whether this is true or not.
Saying they are past peak is unacceptable, might be the broom that sweeps the princes out to join their swiss accounts, and some might not be nimble enough.
Ofcourse none are testable. 100% confidence you are never gonna get. So what do you need? oil crisis? recession? What is your call?
I like that you say "if the cuts continues a next few months, it will be evidence". So now we are down to knowing in 4 months. If it is peak then we are 19 years and 8 months too late, according to the Hirsch report...
Thats a perfect planning of a civilisation - great.
But some people got rich - some will stay poor (if peak).
Cheers
There are 6 billion REAL people out there.
Judging from what I see on CNN BBC and CBC those are 6 billion entertainment units, and as long as they are not shown too bloody and broken, very profitable units indeed. Sorry CBC, loved you once.
so we should believe bush and cheney because they are the ones "closest to the events" ?
at the start of the iraq war a corporate wannabe in the company i work for stated in the newsletter :"we should not question the wisdom of (the administration) because they know a lot more than we do about the situation" owtte
this person was later assigned to the strategic planning committee. that is when i decided to end my career with that company, i plan to retire at the end of this yr.
CW - thanks for your thoughtful input to this thread. I tend to agree with much of what you have said but feel this quote is stretching things a bit far - it equates to 219 billion barrels which is substantially more than I believe they have left to produce.
But the important points - the Saudis have tried to manage their fields carefully (compared with the likes of US flush production that went on for 50 years), and they are the ones who have the data and knowledge. Their view is so different to the peak in 2005 theory that I instinctivly feel that reality will lie somewhere between these two exterme views.
What percentage of oil imported to the USA is from KSA? Where does the USA receive most of its imported oil? And, are those countries importing oil to the USA at peak or beyond?
I believe that our four top sources of imported oil are Canada; Mexico; Saudi Arabia and Venezuela.
Three of these four regions--all but Canada--show declining production.
Mexico's exports, from 1/06 to 1/07 were down 23%, and Pemex has been curtailing and/or eliminating altogether crude oil deliveries to Gulf Coast refineries.
Worldwide, based on some assumptions, I estimate that net oil exports by the top 10 net oil exporters fell by about 8% from 12/05 to 12/06--because of a combination of declining production and/or exploding domestic consumption (e.g., one year increase in car sales of 50% in Venzuela).
In 2005, the top three net oil exporters were Saudi Arabia, Russan and Norway. Based on the HL method, Saudi Arabia is about 60% depleted (perhaps 70%), Russia, about 90% depleted (at least mature basins) and Norway, about 70% depleted.
As noted up the thread, demand for crude oil and petroleum products is currently being met by drawing down inventories in OECD countries.
Other than that, everything is fine.
Westexas,
Are you including the tar sands produced oil in that..'not declining in Canada'? Would you mind speaking on that sometime. I have opinions about what sort of ecological constraints (particularly water) as well limits on natural gas input are, but that's as far as that goes, a guess at best.
Apart from the tar sands how is the rest of the works up here doing?
I started to qualify the Canadian situation with some net energy comments, but I decided not to. On a net BTU basis, net oil and gas exports from Canada may be flat to declining.
Westexas,
That is interesting 'exports from Canada being flat to declining', I would expect from NAFTA:
http://www-tech.mit.edu/Bulletins/Nafta/06.energy
that unless Canada's production including tar sands were flat, US imports would be increasing?
Incidently don't read NAFTA for more than 10 minutes at a time I understand that besides causing rickets it has one speaking in tongues with an Albertan drawl.
And the situation with US imports from Canada is less rosy than it appears since Canada itself imports more than 1 million barrels per day from foreign sources, Middle East and North Sea being two. Venezuela is in there, too, I believe.
http://www.statcan.ca/Daily/English/060911/d060911b.htm
Asebius'
This seems to mean that we (Canada) are acting essentially as a conduit for North Sea countries, the Middle East as well as Venezuela for oil on its way to the U.S.? Does the total of the 55% from these countries go to the U.S., I don't imagine it could go any place else could it. So therefore there seems to be some discrepancy between what your link has to say and that 55% if I am making any sense...am under call to dinner restraints here, so thanks for the Link and info.
Black B. Gorilla,
We don't act as a conduit, as I understand it. Of the oil we produce in the west, a substantial portion is exported south to the US and the rest is consumed domestically.
Eastern and central Canada, on the other hand, are heavily dependent on foreign oil.
Asebius,
How I am thinking is, that if there were no foreign supplies for Eastern Canada then Western Canada would need to supply them (unless like Alberta said at one time "Let those Eastern Bastards freeze in the dark". A sentiment, I think, unworthy of most Albertans, having spent several years of my boyhood in Calgary and Penhold) If we supply the East then we wouldn't be able to equally supply U.S. needs? That is what I meant by conduit.
BBG,
Agreed. As foreign supplies go dry, that oil will tend to flow more to the east and less to the south.
(Although I believe NAFTA figures into this somehow)
Canada is rather unique in that its exports are much larger than its net exports.
Asebius,
Hope you are still about, had to do a search for this:
http://www-tech.mit.edu/Bulletins/Nafta/06.energy
Look at 605 - B, it seems to imply that the oil will flow to the highest bidder.
Brrr..., seems colder in the this northern house today, I wonder if I paid my heating bill in full?
How does Hubbert Linearization distinguish between "mature basins" and whatever other oil reserves are in a country?
Why did you start adding that caveat after I showed that Russia could not be 90% depleted and still show the production they are showing? Why not just admit that HL doesn't work for Russia, due to its political history, and move on?
It's a tool, nothing more. There's no reason to believe it works for every country.
http://www.eia.doe.gov/pub/oil_gas/petroleum/data_publications/company_l...
thanks for the link!
It appears that we might be in a bit of a fix with our second largest importer ( mexico ) curtailing its imports to the USA.
First, the IES and BP most likely rely on the Saudi Aramco numbers for average well production and number of producing wells, as I doubt that KSA allows independent oil experts from BP or others to do field surveys. Therefore, the correlation between the two numbers means nothing.
Second the Saudi numbers just don't add up. Multiply 1923 producing wells by 5740 barrels per day (your figures) and you get more than 11,000,000 barrels per day. KSA has never produced this much total oil, condensate and NGL.
BP says 11035kbpd for 2005 (including NGLs).
mbnewtrain says,
"First, the IES and BP most likely rely on the Saudi Aramco numbers for average well production and number of producing wells, as I doubt that KSA allows independent oil experts from BP or others to do field surveys. Therefore, the correlation between the two numbers means nothing."
I agree with you. The numbers are at best rough, very rough guesses.
But now read your own second sentence:
"Second the Saudi numbers just don't add up. Multiply 1923 producing wells by 5740 barrels per day (your figures) and you get more than 11,000,000 barrels per day. KSA has never produced this much total oil, condensate and NGL."
Given what you yourself said in your first sentence, how could you possibly know that? :-)
RC
Remember, we are only one cubic mile from freedom
THE SICKLY AUNT SAUDI? WHY WE CARE, AND THE CATASTROPHE OF THE FALSE ALARM-SELLING THE CAUSE
As I write this, the string under “Saudi production laid bare” by Euan Mearns, dateline March 19, 2007 will be at or just past 200 replies. A nice little exchange it has been too, with various factions coming out of the woodwork, and great technical and chart work being done by many! A good string, well debated, this is what makes TOD fun! :-)
But some have argued, “What’s the point?” In the great scheme of things, what if Saudi isn’t at or near peak? We know they will....and we know as percentage of the Saudi “oil” age, counting from it’s birth, that Saudi production has to be getting long in the tooth....maybe well into old age....what’s it matter, in the grand scheme of things?
But most of us don’t really live in the “grand scheme of things” do we? We are having to plan for now, for the coming decade or two. Let’s use the “old age” analogy I just used above: Suppose you have an 80 year old aunt...and she has to be cared for. Now it’s obvious she is old, that she is in the latter years of her life. She has shown signs of health problems. In the grand scheme, we know that of course she will die. We know that we care for her to the best of our abilities. But we must be realistic:
How long will she live, and in what condition. It could be a matter of days, we all know life is unpredictable, but what if it is 5 more years? Our care will have to planned, finances allotted, perhaps schedules at work changed to plan for her care....what if it is ten more years? That changes things....she will be 90 then. And you yourself will be closer to retirement....your children will be of a different age, or children you had planned to have will be here....what if she lives to be 100? That’s 20 more years....will you be as healthy, and what about budget issues, you will be near retirement...and possibly have grandchildren by then....or a child divorced young moving back in....
As we said, the outcome is known. The aunt will, sadly, someday die, as we all will. But what about the timing and planning in the meantime? What all options will be opened by a different timing scenario, and what will be closed?
This is exactly the situation we face regarding Saudi, and by extension, world peaking of oil. We know the risks of both planning for a crash/catastrophic scenario NOW as well as saying, “oh well, it will take care of itself” and planning and changing too late. And as the string above shows, if you had to make a “Peak Now” case to a jury, it would be tough sell. On the other hand, if you had to make an “all’s well until 2030 or 2040” case, that too would be tough sell...and same for any scenario in between.
What we do know is this: We simply cannot, environmentally or from the perspective of sustained change, afford another 1980’s scenario, in which the catastrophe is seen NOW, planning began, money spent, careers, investment and saving laid on the line, and then,
the issue essentially disappears as oil prices crash back to historical norms, supply resumes as wanted unabated, and all goes on as before for another....what....10 years, 20 years....25?
If that were to happen, we would then face a catastrophic cliff, occurring so late in the game and so without warning that any type of mitigation plan would be dismissed as “just like 1982”, followed by, “yeah, or just like 2007”, and ignored. America would by then be facing an energy catastrophe with a nation of old folks, and outdated and abandoned alternative energy technologies, dusty on the shelves of U.S. firms and universities (just like we came into this current situation, trying to dig out and dust off all the technology we were moving fast on in the late 1970’s, early 1980’s)
We will never be able to have perfect information. We must still act. I have decried, as has many others here the “analysis paralysis” we seem to be suffering from.
So, what to do?
I have made the case that we must push for and sell the ideas of reduced fossil fuel consumption, conservation of all energy, alternative energy technology, extremely “elegant” design technology on issues other than impending peak. Sell it on the basis of national security. Sell it on the basis of national prosperity and balance of trade. Sell as an environmental and “green” choice. Sell in on an aesthetic basis, that it can be cleaner, more convenient, more modern, more “it”, more stylish..., until the public, the customer sees fossil fuel as nothing but outdated and primitive, yesterdays boring way to get around, to heat and to have fun...and then, of course we can mention the very real concern about the possibility of impending peak, but...sell it again....”but even if peak doesn’t happen for 10 or 20 years, you will still want to make these changes, for all these other great reasons.....
I am not concerned about who exactly wins the timing argument. Peak may have occurred yesterday. It may occur this summer. Or it may occur in 2030. We must win the endgame of selling the “end of the fossil fuel era”, the “end of the carbon era” as a good thing, no matter which of the above is true. We have to have people wanting reduction of fossil fuel consumption even if the stuff gets cheaper, even if peak does not show up for awhile, or it is somehow masked. I am more and more convinced each day that “peak oil” alone simply cannot cause the nightmare scenarios that some love to sell. But I also believe that another major false alarm could leave us so undefended and unprepared when the real thing comes, so lacking consensus and so skeptical that change is needed, that the nightmare scenarios will be much, much closer to reality.
We simply cannot afford anymore false alarms.
Roger Conner Jr.
Remember, we are only one cubic mile from freedom
Roger, with all due respect, we can all agree that there will be a liquids fuel supply problem within 10 - 20 years. Given the lifetimes of energy production and usage infrastructure, we already need to be making decisions that will determine which path we follow. Hence, your aunt example is less relevant for some decisions that we need to be making now. We know for example that land usage needs to shift away from sprawling land consuming patterns; we know that emphasisizing air travel over rail, auto over transit etc. etc. is not wise policy because the implementation timeframe is well within the time resources we have available and we may already be behind schedule. I don't see that kind of policy in existence today meaning we are going to get further in the hole, making the required change harder.
we know that emphasisizing air travel over rail, auto over transit etc. etc. is not wise policy because the implementation timeframe is well within the time resources we have available and we may already be behind schedule.
With all this talk of Graphs, Methodologies, and tech analysis and stuff.
Let's plot the rate of system change by measuring the rate of change since Two years ago when Bush declared we're "Addicted to Oil" for example. How much has changed?
How much has visibly changed in respect to Laws, Projects underway, number of components that have shifted over...
Generally the getting away from the Quantum side(individual people, instead of grains of sand) and look at geographic regions that have changed or whole countries for the system level view.
What that graph is telling me is that Sheldon H is right.
System conversions like Airlines to rail?
Radical Decline of Consumption of energy?
The rate of premeditated change I have seen since I heard about Peak Oil in 2001 has been a very very low.
We would almost have to go vertical in the rate of change and I do not think that is possible.
So, knowing at the rate of change we have seen since (say) 2000 till now, It seems to me the discussions of did we peak 18 months ago, or in two years is fly stuff on a cannonball.
It's like horseshoes and hand grenades, Close enough.
Isn't your analysis based on data up to 2005, whilst Stuart's is based on data through to the end of 2006? In particular, it is the mathematical signature of the 2006 decline (compared with what we've seen before) that is convincing Stuart that the Saudis are now supply constrained.
Sofistek - I'm unfortunately constrained by the data I have available - though I did mention that the 2006 year on year decline is nothing like as large as 8%.
You're right Stuart sees a signature of mega-projects overlaid on natural, uncommonly steep decline. I just plain disagree that that signature is there - may discuss this in my next post.
8% is the slope of the monthly data within 2006. I agree that the year-on-year decline is significantly less (since the post Qatif decline in overall production only began in the middle of 2005 and has accelerated since).
I will post more in response to this discussion on Thursday.
Meanwhile, over at Cantarell, production is down by 18% (345,000 bpd) from 2/06 to 2/07.
Two largest producing fields in the world:
(1) Carbonate Reservoirs:
(2) Strong Water Drives;
(3) Rapidly Thinning Oil Columns, between expanding gas caps and rising water legs (especially North Ghawar);
IMO, the only real difference is that Pemex has admitted to the decline/crash of its largest producing field, while Saudi Aramco has not.
They're very different. About the only thing they have in common geologically is that they are carbonates, and very different carbonates at that.
Cantarell: offshore, buried coral reef, high relief, highly fractured/vuggy, heavy viscous oil, injection gas (nitrogen) drive, early basal aquifer drive "turned off" years ago by gas injection, secondary gascap occupies most of connected pore volume, wells are gassing out.
Ghawar: onshore, platform carbonate facies (packstone/grainstone - like sandstone but with carbonate grains), moderate structural relief, probably no fractures, light to medium oil, aquifer drive inhibited by tarmat (heavy oil zone) at oil/water contact, NO free gas in reservoir, drive mechanism is water injection at high wellhead pressure (>3000 psi IIRC), wells are watering out.
That would be good. Obviously, if peak was in 2005, for SA, you wouldn't see any decline signature in the data you presented. So it doesn't really add to the discussion about what is happening now. Stuart's still looks like the best analysis, though I hope not.
Thank you to one and all for contributing to this thread. I just want to tie things up with some blood pressure raising comments and charts:
Horizontal wells
I'd thought about including this in my post but didn't have the data to hand and was striving to keep below 3000 words (which is 10* my own attention span). So thanks to Ace for posting information on maximum contact wells and also to Heading Out for adding information. So without going into details and trawling up the dirt, here's a revised chart:
In the period 1991 to 2004 the cumulative number of horizontal wells rose dramatically whilst the average well productivity drifted lower. The dog-leg hinged on 1991 is caused mainly by the ending of the well retirement – reinstatement cycle. It is plain to see that the number of horizontal wells has little impact on productivity between 1991 and 2004. Now I know that many feel that it should have, because verticals are expected to have lower productivity than horizontals – but there again the Saudis used to have verticals that did 50,000 + bpd. What I see in these data is some form of management strategy.
I think the debate about equating 1 horizontal with 3, 3.9 or 30 verticals is quite sterile because the fact is that the Saudis elected to use a much lower number of more highly productive wells. The relevance lies in what can be done next. If the Saudis are wanting to drill 250+ horizontal producers per year that for me is the challenge – finding these drillable production prospects – and as I said in my post I think the cupboard is beginning to look rather bare in that respect.
Thanks. This chart does not need any words. It would make a fine post just sitting there by its lonesome.
Hi Euan,
I may or may not understand anything. Just some qs, for clarification, if you have time (please)(thank you!):)
re: "... the fact is that the Saudis elected to use a much lower number of more highly productive wells."
Do you mean to say they "elected to use" in the sense that they had a choice?
If a choice, between what and what?
And the "more highly productive wells" are which ones, exactly?
"...much lower number..." than what?
And over what time period are you referring to? i.e., you say "elected" (past tense)...meaning...?
Demand and price
Thanks to Gilles posting all his charts on OECD expectations. I want to avoid getting into an argument over inventories, price, consumption and demand because I think there are different ways of looking at the data depending upon your start position. Some of my perspectives.
I see an increasingly bearish looking oil price chart that I just cannot reconcile with Saudi and OPEC production “crashing”.
I think the shift in the futures market from backwardation to contango is important in determining how both consumers and producers behave.
I see falling OECD production, greater dependence on imported oil from less reliable foreign sources leading to falling energy security as a primary reason for the rise in the oil price and shift in sentiment in the futures market. And sure – producers are struggling to meet demand and there is shrinkage of reserved capacity.
In 2004 and 2005, global oil consumption surged ahead and got above its 25 year trend line - so I also see weakening demand as supply / production returning to the long term trend. And yes of course higher prices are leading to demand destruction.
Grabbed from Drumbeat a few days ago.
This is form the Norwegian Energy Man NGM2
http://energikrise.blogspot.com/2007/03/peak-oil-og-offisielle-oljeprogn...
EM, I just dont understand WHAT you are arguing, HOW you do it, nor WHY you do this? You write
"I see an increasingly bearish looking oil price chart that I just cannot reconcile with Saudi and OPEC production “crashing”.
I think the shift in the futures market from backwardation to contango is important in determining how both consumers and producers behave."
I interpret this as you state that oil price might come down (bearish looking)? Then you say that the price is in contango, so obviuously the market now, for the first time, believe the opposite? I simply dont understand how you think out your arguments...
I said in a comment above, prices have gone up, where you responded no, they are down 25%. I meant up, like in up from 10$/barrel, what, 1998. I wasnt clear, sorry. But your answer was also completely uninteresting, yes we all know that we are down from the 78$ peak a year ago, down to ohoh 60-65$. To me this is the way you debate, and it doesnt bring you nor me anywhere.
I did wonder about Euan's tactics of pointing out a decline in oil price, by comparing a single peak with today's price, whilst also pointing out that year on year declines are nowehere near as bad as the 2006 monthly figures indicate. He seems to cherry pick the data that suits his beliefs (I recall a comment of his on a previous Stuart post, that also did this with "matching" curves). This is in sharp contrast to how Stuart approaches his analyses, where he doesn't let his personal beliefs interfere and so can easily end up with something that changes his beliefs.
Good on you, Stuart! But now you need to rethink your "mankind will adapt" belief :-)
Reservoir engineering, reserves and production
Thanks to Fractional Flow for turning up and bamboozling everyone with his reservoir engineering and modelling input. This has brought a lot of information to everyone’s attention. So Ghawar is in decline – it has been declining for years. What I believe Fractional Flow was saying is that the volume of unswept reservoir in Ain Dar/ Shedgum is shrinking fast and the water saturation is rising in the swept portion of the reservoir. So the water cut will continue to rise and the oil cut will continue to fall in this part of Ghawar that represents 20 to 25% of Saudi production / capacity. This is a part of the natural decline they are fighting and the outcome of the battle will be determined by their ability to replace lost production in Ain Dar / Shedgum with production from else where.
One reason I'm defending my corner is the yawning gap between what Stuart is proposing and what the Saudis themselves are saying. This chart from Michael Smith at Energy Files is based on Saudi prognosis of their own capacity (not a production forecast). Personally, I think this is far too optimistic - and by the same token I think Stuart's prognosis is unduly pessimistic.
A big thank you to Michael Smith for sending me this annotated version of this chart. Note that this shows Ain Dar / Shedgum in decine – but an orderly decline.
http://www.energyfiles.com/index.html
Be sure and let us know when he takes Stuart up on his bet.
So you keep saying "my article is correct", now by showing an impossible graph, that you yourself also dont consider probable ("too optimistic")?
That way of debating just doesnt convince me.
In the graph above SA will increase production, what, 5.5 mbpd by 2012? Why plot it if you dont believe it? and how does it really justify your original article at the top?
Hmm....
Okay - now that graph is actually pretty scary (and I am one of the Saudi decline skeptics)... This goes beyond an "optimistic" graph, into the realm of a "liars graph"...
First, this is a classic "hockey stick" style graph, that shows a radical shift in production "tomorrow" that fixes everything. This should always arouse suspicion, since real-world processes usually follow more ballistic trajectories - it is just plain hard to take a sharp left turn on something like total oil production.
Second, the bulk of the increased production (excluding NGL's) comes from (in descending order):
Other Offshore Saudi
Other Onshore Saudi
Khurais
Shaybah
YTF Onshore (!!!)
They are forecasting ~3 mbd from "other" by ~2012 - that is a _huge_ increase, from very vague sources. I would discount these increases (and spread them over a longer time period), unless there was very good documentation of the specific sources for the "other" production...
Finally, this graph actually shows that there HAS BEEN A NEAR-TERM PEAK in production(!!!), and that the decline is only just starting. This is a huge risk, since oil companies have always underestimated decline rates in their fields when they are at peak. Again, I would assume that the decline rates will be higher than shown for the mature Saudi fields.
This graph has come closer than any other data I have seen to convinving me that Saudi is at, or very near, their peak production.
CW
Global peak: 2007 - 2010
Global decline rate, Post peak: 2%
Economic response: Severe global recession, ~5 years, then slow recovery
I was thinking the same thing. This graph suggests Stuart is right.
I wonder what the date on it is? 2005, maybe? You can sort of see where it departs the shore of facts and heads off into the open sea of fantasy.
Leanan - I'm not even going to try and understand what process led you to this conclusion.
What Hindmost said.
Hmm - I'm trying to clarify my comments, because I don't agree that the chart proves that Stuart is correct. Firstly, my interpretation of the chart doesn't _prove_ anything - it is entirely subjective :-)
For me, this chart casts significant doubt on the claims by the Saudi's that they can reach 15mbd. It also casts some doubt on the claim that they can reach 11mbd by 2011.
It isn't really helpful in determining if they can produce above 9.5 mbd in the new future - it is still quite possible...
CW
Global peak: 2007 - 2010
Global decline rate, Post peak: 2%
Economic response: Severe global recession, ~5 years, then slow recovery
I didn't say it proved anything. The word I used was suggest.
What jumps out at me from that chart is that things don't look so good for Ghawar, even in the Saudis' likely rosy estimations. And their projections for how (and how much) they will increase production do not seem remotely realistic. Not necessarily lying, but overly optimistic, a la Thunder Horse.
Hindmost, first I got to stress that Michael Smith constructed this based on Saudi information and this does not necessarily represent his views.
The main reason for posting this is to show that the Saudis reckon they have capacity for around 14 million bpd in 2010 whilst Stuart's optimistic scenario is for 8.2 million bpd. That's one Hell of a gap. So I think that folks need reminding that there are alternative scenarios and points of view.
I agree with a lot of what you say here:
For the same reason I dislike models proposing a production "crash".
I'm agreeing that this is wildly optimistic but would fall short of calling them liars.
WRT near term peak I see that as withheld production and you should not draw consclusions about decline from it. But what you say about underestimating decline rates is also quite true. Abqaik is probably the best analog for Ghawar and it seems to have declined quite slowly for the last 10 years - presumably once it got through the initial slide associated with water break through.
I also agree that bringing on new projects will be spun out over a much longer time frame.
I think we've all reached a point where we need to wait for 6 months and see.
"I think we've all reached a point where we need to wait for 6 months and see."
What he said!-)
My grandfather pumped oil with an engine-house,
my father pumped oil with a 20 lb. electric motor,
can't I just pump it online?
(I'm sure this thread is dead, but I'm going to post one more anyway...:-)
The part of this graph that surprised me the most (especially if it is produced from Saudi info) was to see that Ghawar really _has_ peaked. Graphs are notoriously difficult to read (it's too bad no-one can publish the base data they use for the charts, for us wonks to gnaw on...), so I am not focusing on the specific shape of the chart for 2006. I agree that the Saudi's probably shut in some capacity last year to reduce inventories. However, the projection into the future for the "Other Ghawar" shows decline starting now, and continuing into the future. This is unequivocal, at least to the degree of resolution of that chart.
This is the first chart I have seen that breaks Saudi production by region/field, and forecasts production (in fact, I had taken it as a fact that no such graphs existed, based on the repeated complaints here on TOD).
So, I think this chart convinced me that one of Stuart's claims is likely to be true: I think this shows that Saudi really has been supply constrained for the past 2 years (or so). and their decline rates will start showing through their production data as we move forward (at least until they bring the Shaybah and Kurais production online, possibly restoring some of their buffer capacity).
However, I don't think their decline rates should start at 8%, so I do believe they can get their production back over 9, and possibly over 9.5 mbld.
CW
Global peak: 2007 - 2010
Global decline rate, Post peak: 2%
Economic response: Severe global recession, ~5 years, then slow recovery
It's nice to see that I'm not the only one who prefers reading old posts where the dust has settled a bit. (especially cause of working on Europ. time)
Yes, a very good point.
Gawar has officially peaked and with it the world.
!
!
!
!
Now, the chart above assumes "no output restrictions and full investment" meaning offshore, for instance, will be developed full force.
This is a LUDICROUS assumption, simply because Saudi Arabia is state run and not free market.
I further agree that it does not necessarily mean a sudden collapse in production, at least not yet. Only, that an increase (past 10mbd, for instance) is IMPOSSIBLE. Which means, for Saudi Arabia we can say, WITH 100% SURETY !! that it is on the plateau, if not past peak.
----------
My grandfather pumped oil with an engine-house,
my father pumped oil with a 20 lb. electric motor,
can't I just pump it online?
Arguing over peak now versus peak later
Why is this important – Roger Connor summed this up pretty well. If the peak oil lobby / The Oil Drum comes firmly down on peak in 2005 and we see 86.5 million bpd late this year (which I think we will see) then the whole movement loses credibility.
Stuart might be right – but from my perspective the distribution of probabilities points to him being wrong. If he is right, then we are in for one holy disaster this year and next – I trust everyone has bought the mandatory ton of tuna.
I just plain disagree with Stuart on the wisdom of extrapolating the 2006 monthly decline rate into the future (albeit moderated) – especially when the YOY decline from 2005 to 2006 was 1.1% according to the IEA and somewhat higher according to the EIA as pointed out by Ron Patterson.
I also disagree that mega projects can be identified in the Saudi production profiles and may tackle some of these issues in another post. But next week I’m off to Norway X-country skiing ☺
1) Noone cares about us peakoilers (until we have 5 million members or so). So whether we are right or wrong doesnt matter too much, deffeys and campbell are still going strong (although missed a few peak oil dates).
2) After peak, when traders consider oil as each year more valuable, and technical committees in cities plan with oil scarcity in mind, then again, the world will have a rough time (recession, or worse), and whether we were right within +/- 5 years nobody cares. People will suffer, for real, and thats the sad part.
3) you could instead use all your energy and willpower to try to change society, (instead of worrying about your reputation, winning an academic question).
4) the movement. we have no credibility, that is an illusion. there is nothing to protect. we are a bunch of free individuals, and dont need any "common statement". our strength lies in what we influence in our daily life, and that we think freely and a-X the sciences, so to speak (this leads me to, ofcourse:
I wish you a splendid X-country ski experience!! That is a great thing to do, nature, open space, huts, activity...
Credibility is a big issue and the peak oilers do have some.
You don't get interviewed on CNBC and Bloomberg without some credibility.
The latter is often part of the former.
How many people do you know who've changed society while having a well-deserved lack of credibility?
Hello Selgel,
Thanks for your comment.
re: 1) "Noone cares about us peakoilers (until we have 5 million members or so). So whether we are right or wrong doesnt matter too much, deffeys and campbell are still going strong (although missed a few peak oil dates).
1) Actually, I think people do care. I also think that if it was possible to have the people with best grasp of the situation (geology, oil industry experience, or whatever else it takes) come up with a reasonable and well-crafted statement or set of statements, this makes a huge difference. There are a lot of people who can follow an argument. They need to see the argument, as they, even if highly educated, do not have time nor inclination to do the amount of work required to come up with their own analysis and conclusions.
2) And...I also think it matters. It matters to be "right or wrong" about something that has implications of this magnitude.
re: "the movement. we have no credibility, that is an illusion. there is nothing to protect. we are a bunch of free individuals, and dont need any "common statement". our strength lies in what we influence in our daily life."
You may be right that our strength lies in what we influence in our daily life.
However, to say we cannot have credibility ...that we cannot, if we choose, make a "common statement" - or that those of us who wish to do so, may do so...and that this would not have any effect, is very misguided.
In effect, it says that nothing matters beyond individual action (in isolation) - does it not?
I was trying to say something about preventing nuclear war, the other day in response to Chimp and Cid, who basically guessed at or told me what I thought (without asking for my views).
There are a lot of people working very hard to prevent nuclear war, accidental and deliberate. www.fas.org, www.psr.org, www.idds.org, to just pick a random few.
We can, together, have some effects that individually we may or may not be able to have.
I'm not saying anything is sure. I'm saying it's been done and is being done, today, by others, in relation to other serious issues.
This is a serious issue.
People who know are (perhaps) the only ones who can act.
People who do not know have no basis for action.
Hello Euan,
Thanks.
re: "I also disagree that mega projects can be identified in the Saudi production profiles and may tackle some of these issues in another post."
Well, as far as I can understand it, Robert Rapier has said his estimate of (hope I've remembered it correctly) peak in 2012 +/= 3 or 4 years, was based on something similar to (or even exactly the same as) mega projects/bottom up...yes?
And, we have Skrebowski w. mega projects...yes?
And, now you are saying...?...that the data upon which mega projects is based is...problematic?
And...by mega projects, do you include the items listed in the above graph?
Or, if I have it all wrong, could you please explain what you say here further or in different words?
Please stay safe and I hope to hear from you upon your return.