Energy Transitions Past and Future
Posted by Prof. Goose on July 1, 2008 - 10:40am
| This is a guest post from Cutler Cleveland. It provides an excellent big picture overview of what variables we need to consider as we transition away from fossil fuels. Professor Cleveland previously wrote "Energy From Wind - A Discussion of the EROI Research", and "Ten Fundamental Principles of Net Energy" posted on theoildrum.com. Cutler Cleveland is a Professor at Boston University and has been researching and writing on energy issues for over 20 years. He is Editor-in-Chief of the Encyclopedia of Earth, Editor-in-Chief of the Encyclopedia of Energy, the Dictionary of Energy and the Journal of Ecological Economics. |

Prometheus chained to Mount Caucasus. Source: Pieter Paul Rubens: ''Prometheus Bound,'' 1611-1612, Oil on canvas, 95 7/8" x 82 1/2". (Philadelphia Museum of Art: The W.P. Wilstach Collection) Click to Enlarge
INTRODUCTION
In Greek mythology, Prometheus defied the will of Zeus by stealing fire and giving it to the mortal race of men in their dark caves. Zeus was enraged by Prometheus' deceit, so he had Prometheus carried to Mount Caucasus, where an eagle would pick at his liver; it would grow back each day and the eagle would eat it again. Fire transformed mortal life by providing light, warmth, cooking, healing and ultimately the ability to smelt and forge metals, and to bake bricks, ceramics, and lime. Fire became the basis for the Greek culture and ultimately all Western culture. It is no wonder, therefore, that the Greeks attributed fire not to a mortal origin, but to a Titan, one of the godlike giants who were considered to be the personifications of the forces of nature.If fire was the first Promethean energy technology, then Promethean II was the heat engine, powered first by wood and coal, and then by oil and natural gas. Like fire, heat engines achieve a qualitative conversion of energy (heat into mechanical work), and they sustain a chain reaction process by supplying surplus energy. Surplus energy or (net energy) is the gross energy extracted less the energy used in the extraction process itself. The Promethean nature of fossil fuels is due to the much larger surplus they deliver compared to animate energy converters such as draft animals and human labor.
The changes wrought by fossil fuels exceeded even those produced by the introduction of fire. The rapid expansion of the human population and its material living standard over the past 200 years could not have been produced by direct solar energy and wood being converted by plants, humans and draft animals. Advances in every human sphere — commerce, agriculture, transportation, the military, science and technology, household life, health care, public utilities—were driven directly or indirectly by the changes in society's underlying energy systems.
In the coming decades, world oil production will peak and then begin to decline, followed by natural gas and eventually coal production. There is considerable debate about when these peaks will occur because such information would greatly aid energy companies, policy makers, and the general public. But at another level, the timing of peak fossil fuel production doesn't really matter. A more fundamental issue is the magnitude and nature of the energy transition that will eventually occur. The next energy transition undoubtedly will have far reaching impacts just as fire and fossil fuels did. However, the next energy transition will occur under a very different set of conditions, which are the subject of the rest of this discussion.
The Magnitude of the Shift
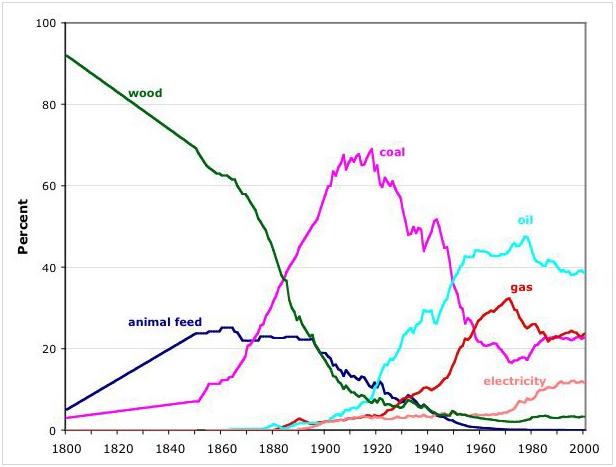
Figure 2. Composition of U.S. energy use. (Source: Cutler Cleveland) Click to Enlarge
The last major transition occurred in the late 19th century when coal replaced wood as the dominant fuel. Figure 2 illustrates this transition for the United States, a period often referred to as the second Industrial Revolution (the first being the widespread replacement of manual labor by machines that began in Britain in the 18th century, and the resultant shift from a largely rural and agrarian population to a town-centered society engaged increasingly in factory manufacture). Wood and animal feed suppled more than 95% of the energy used in the United States in 1800. The population of the nation stood at just 5.3 million people, per capita GDP was about $1,200 (in real US$2000), dominant energy converters were human labor and draft animals (horses), and the population was overwhelmingly rural and concentrated near the eastern seaboard.

Figure 3. The global flux of fossil and renewable fuels. (Source: Smil, V. 2006. "21st century energy: Some sobering thoughts.'' OECD Observer 258/59: 22-23.) Click to Enlarge
The nation was completely transformed by World War I. Coal had replaced wood as the dominant fuel, meeting 70% of the nation's energy needs, with hydropower and newcomers oil and natural gas combining for an additional 15%. Steam engines and turbines had replaced people and draft animals as the dominant energy converters. The population had soared to more than 100 million, per capita GDP had increased by a factor of five to $6,000, more than half of the nation's population lived in cities, and manufacturing and services accounted for most of the nation's economic output. Thus, the transition from wood to fossil fuels, and its associated shift in the energy-using capital stock, produced as fundamental a transition in human existence as did the transition from hunting and gathering to agriculture.
How much renewable energy is needed if it were to replace fossil fuels in the same pattern as coal replaced wood? The United States first consumed as much coal as wood in about 1885. Total energy use then was about 5.6 quadrillion BTU (1 quadrillion = 1015), equal to about 0.19 TW (Terawatts or 10
Is renewable energy up to this challenge? There are physical, economic, technical, environmental, and social components to this question. Figure 3 depicts one slice of the picture: pure physical availability as measured by the global annual flow of various energies. The only renewable energy that exceeds annual global fossil fuel use is direct solar radiation, which is several orders of magnitudes larger than fossil fuel use. To date however, the delivery of electricity (photovoltaics) or heat (solar thermal) directly from solar energy represents a tiny fraction of our energy portfolio due to economic and technical constraints. Most other renewable energy flows could not meet current energy needs even if they were fully utilized. More importantly, there are important qualitative aspects to solar, wind, and biomass energy that pose unique challenges to their widespread utilization.
ENERGY QUALITY
Most discussions of energy require the aggregation of different forms and types of energy. The notion of "total energy use" in Figures 2 and 3 indicates that various physical amounts of energy—coal, oil, gas, uranium, kilowatt-hours (kWh), radiation—are added together. The simplest and most common form form of aggregation is to add up the individual variables according to their thermal equivalents (BTUs, joules, etc.). For example, 1 kWh is equal to 3.6x10⁶ joules, 1 barrel of oil is equal to 6.1x10⁹ joules, and so on.Despite its widespread use, aggregation by heat content ignores the fact that not all joules are equal. For example, a joule of electricity can perform tasks such as illumination and spinning a CD-ROM that other forms of energy cannot do, or could do in a much more cumbersome and expensive fashion (Imagine trying to power your laptop directly with coal).
These differences among types of energy are described by the concept of energy quality, which is the difference in the ability of a unit of energy to produce goods and services for people. Energy quality is determined by a complex combination of physical, chemical, technical, economic, environmental and social attributes that are unique to each form of energy. These attributes include gravimetric and volumetric energy density, power density, emissions, cost and efficiency of conversion, financial risk, amenability to storage, risk to human health, spatial distribution, intermittency, and ease of transport.
Energy Density

Figure 4. Energy densities for various fuels and forms of energy. (Source: Cutler Cleveland) Click to Enlarge
Energy density refers to the quantity of energy contained in a form of energy per unit mass or volume. The units of energy density are megajoules per kilogram (MJ/kg) or megajoules per liter (MJ/l). Figure 4 illustrates a fundamental driver behind earlier energy transitions: the substitution of coal for biomass and then petroleum for coal were shifts to more concentrated forms of energy. Solid and liquid fossil fuels have much larger mass densities than biomass fuels, and and an even greater advantage in terms of volumetric densities. The preeminent position of liquid fuels derived from crude oil in terms of its combined densities is one reason why it transformed the availability, nature and impact of personal and commercial transport in society. The lower energy density of biomass (12-15 MJ/kg) compared to crude oil (42 MJ/kg) means that replacing the latter with the former will require a significantly larger infrastructure (labor, capital, materials, energy) to produce an equivalent quantity of energy.
The concept of energy density underlies many of the challenges facing the large scale utilization of hydrogen as a fuel. Hydrogen has the highest energy to weight ratio of all fuels. One kg of hydrogen contains the same amount of energy as 2.1 kg of natural gas or 2.8 kg of gasoline. The high gravimetric density of hydrogen is one reason why it is used for a fuel in the space program to power the engines that lift objects against gravity. However, hydrogen has an extremely low amount of energy per unit volume (methane has nearly 4 times more energy per liter than hydrogen). Hydrogen's low volumetric energy density poses significant technical and economic challenges to the large-scale production, transport and storage for commercial amounts of the fuel.
Power Density
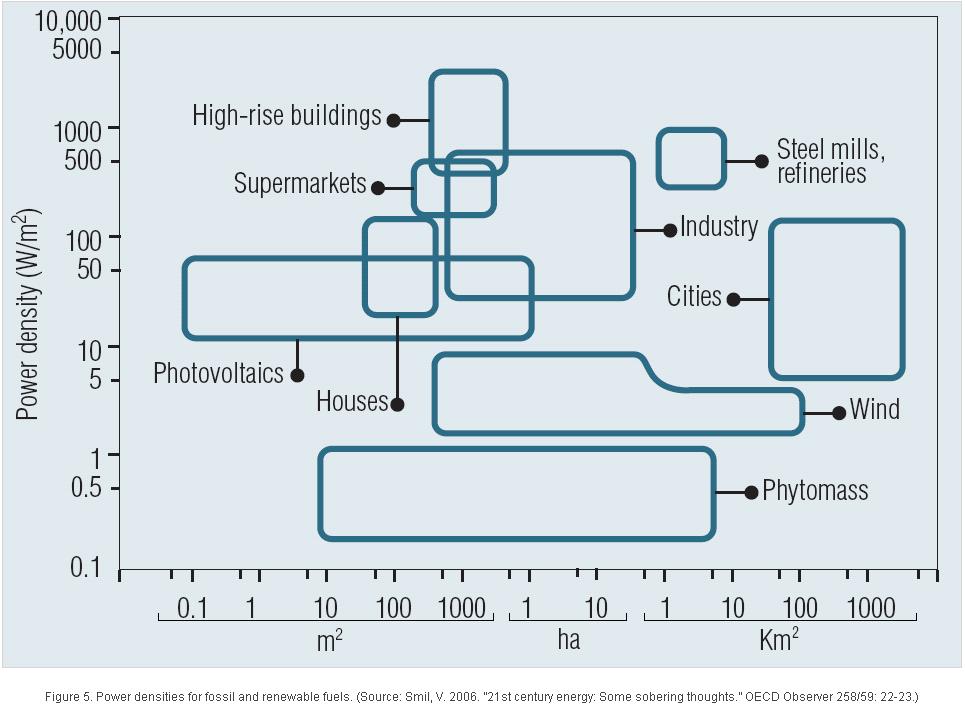
Figure 5. Power densities for fossil and renewable fuels. (Source: Smil, V. 2006. ''21st century energy: Some sobering thoughts.'' OECD Observer 258/59: 22-23.) Click to Enlarge
Power density is the rate of energy production per unit of the earth’s area, and is usually expressed in watts per square meter (W/m2). The environmental scientist Vaclav Smil has documented the important differences between fossil and renewable energies, and their implications for the next energy transition. Due to the enormous amount of geologic energy invested in their formation, fossil fuel deposits are an extraordinarily concentrated source of high-quality energy, commonly extracted with power densities of 10
The high power densities of energy systems has enabled the increasing concentration of human activity. About 50% of the world's population occupies less than 3% of the inhabited land area; economic activity is similarly concentrated. Buildings, factories and cities currently use energy at power densities of one to three orders of magnitude lower than the power densities of the fuels and thermal electricity that support them. Smil observes that in order to energize the existing residential, industrial and transportation infrastructures inherited from the fossil-fueled era, a solar-based society would have to concentrate diffuse flows to bridge these large power density gaps. Mismatch between the inherently low power densities of renewable energy flows and relatively high power densities of modern final energy uses means that a solar-based system will require a profound spatial restructuring with major environmental and socioeconomic consequences. Most notably according to Smil, there would be vastly increased fixed land requirements for primary conversions, especially with all conversions relying on inherently inefficient photosynthesis whose power densities of are minuscule: the mean is about 450 mW/m2 of ice-free land, and even the most productive fuel crops or tree plantations have gross yields of less than 1 W/m2 and subsequent conversions to electricity and liquid fuels prorate to less than 0.5 W/m2.
Energy Surplus

Figure 6. The energy return on investment (EROI) for various fuel sources in the U.S. (Source: Cutler Cleveland) Click to Enlarge
Most alternatives to conventional liquid fuels have very low or unknown EROIs (Figure 6). The EROI for ethanol derived from corn grown in the U.S. is about 1.5:1, well below that for conventional motor gasoline. Ethanol from sugarcane grown in Brazil apparently has a higher EROI, perhaps as high as 8:1, due to higher yields of sugarcane compared to corn, the use of bagasse as an energy input, and significant cost reductions in ethanol production technology. Shale oil and coal liquefaction have low EROIs and high carbon intensities, although little work has been done in this area in more than 20 years. The Alberta oil sands remain an enigma from a net energy perspective. Anecdotal evidence suggests an EROI of 3:1, but these reports lack veracity. Certainly oil sands will have a lower EROI than conventional crude oil due to the more diffuse nature of the resource base and associated increase in direct and indirect processing energy costs.
Intermittency
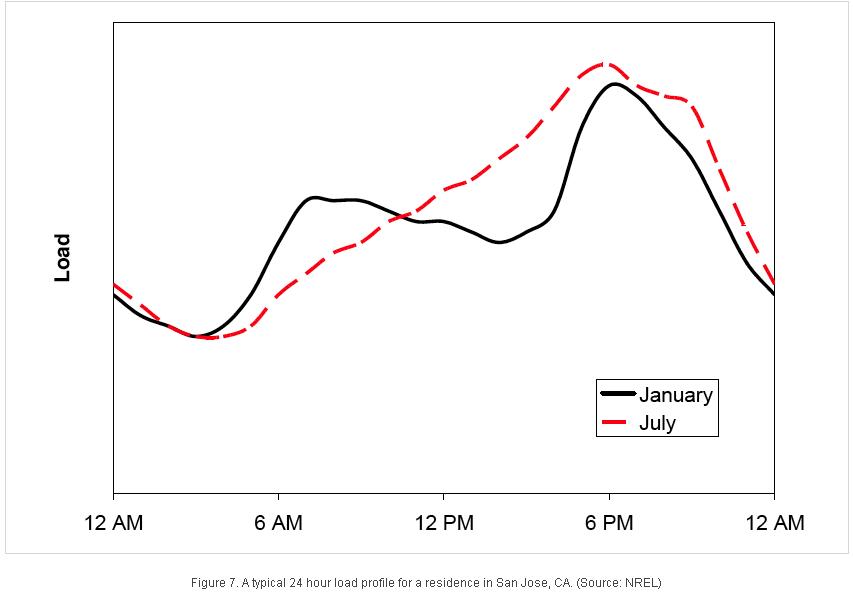
Figure 7. A typical 24 hour load profile for a residence in San Jose, CA. (Source: NREL) Click to Enlarge
Intermittency refers to the fraction of time that an energy source is available to society. It is an essential feature of electricity generation systems that must combine power generated from multiple sources and locations to supply electricity "24/7." The wind does not blow all the time and the sun does not shine all the time, so a wind turbine and PV array sometimes stand idle. One aspect of intermittency is the load factor or capacity factor, which is the ratio of the output of a power plant compared to the maximum output it could produce. Due to the more or less continuous nature of fossil fuel extraction, thermal power plants have capacity factors of 75 to 90 percent. Typical annual average load factors for wind power are in the range of 20 to 35 percent, depending primarily on wind climate, but also wind turbine design.
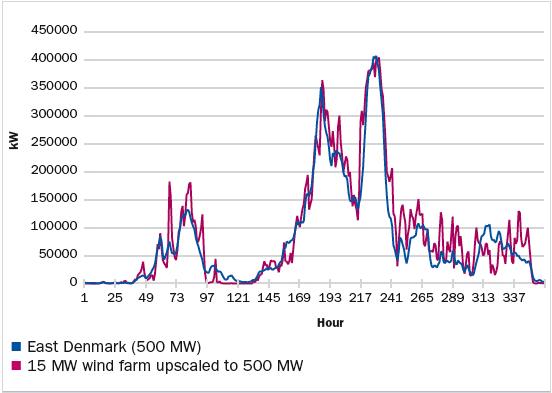
Figure 8. The variability of wind energy over a 1y day period. The figure compares the hourly output of 500 MW wind power capacity in two situations, calculated from observed data in Denmark. The red line shows the output of a single site; the blue line shows the multiple site output. Source: European Wind Energy Association, ''Large scale integration of wind energy in the European power supply: analysis, issues and recommendations'' (December 2005) Click to enlarge
Load profiles show characteristic daily and seasonal patterns (Figure 7). For example, most hourly profiles for commercial and institutional facilities rise in the middle of the day and then taper off during early morning and late evening hours. Wind and solar energy availability frequently do not match typical load profiles (Figure 8).
Such intermittency means that wind and solar power are really not “dispatchable”—you can’t necessarily start them up when you most need them. Thus, when wind or solar power is first added to a region’s grid, they do not replace an equivalent amount of existing generating capacity—i.e. the thermal generators that already existed will not immediately be shut down. This is measured by capacity credit, which is the reduction of installed power capacity at thermal power stations enabled by the addition of wind or solar power in such a way that the probability of loss of load a peak times is not increased. So, for example, 1000 MW of installed wind power with a capacity credit of 30% can avoid a 300 MW investment in conventional dispatchable power. A recent survey of U.S. utilities reveals capacity credits given to wind power in the range of 3 to 40 percent of rated wind capacity, with many falling in the 20 to 30 percent range. A large geographical spread of wind or solar power is needed to reduce variability, increase predictability and decrease the occurrences of near zero or peak output.
These and other "ancillary costs" associated with wind and solar power are small at low levels of utilization, but rise as those sources further penetrate the market. In the longer run, the impacts of these additional costs on the the deployment of wind and solar power must be compared with the effective costs of other low-carbon power sources such as nuclear power, or the costs of fossil thermal generation under strong carbon constraints (i.e., carbon capture and storage).
Spatial distribution
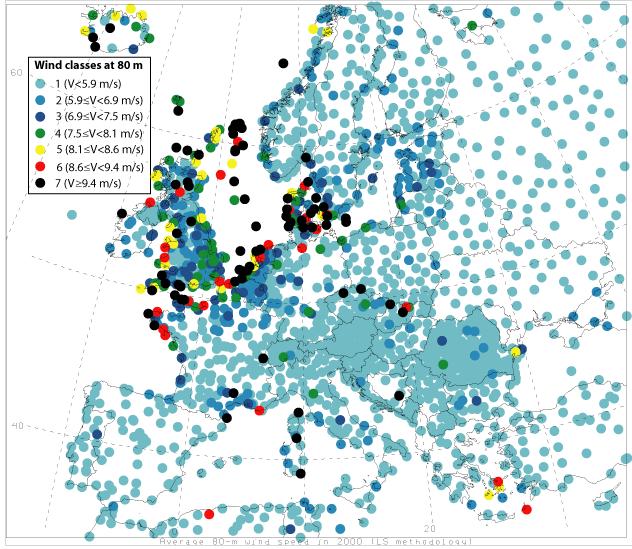
Figure 9. The distribution of wind speeds at 80 meters, the hub height of a modern turbine. (Source: Cristina L. Archer and Mark Z. Jacobson, Evaluation of global wind power) Click to Enlarge
All natural resources show distinct geographical gradients. In the case of oil and natural gas for example, the ten largest geologic provinces contain more than 60 percent of known volumes, and half of those are in the Persian Gulf. Coal and uranium deposits also are distributed in distinct, concentrated distributions. The pattern of occurrence imposes transportation and transaction costs, and in the case of oil and strategic minerals, also imposes risk associated with economic and national security.
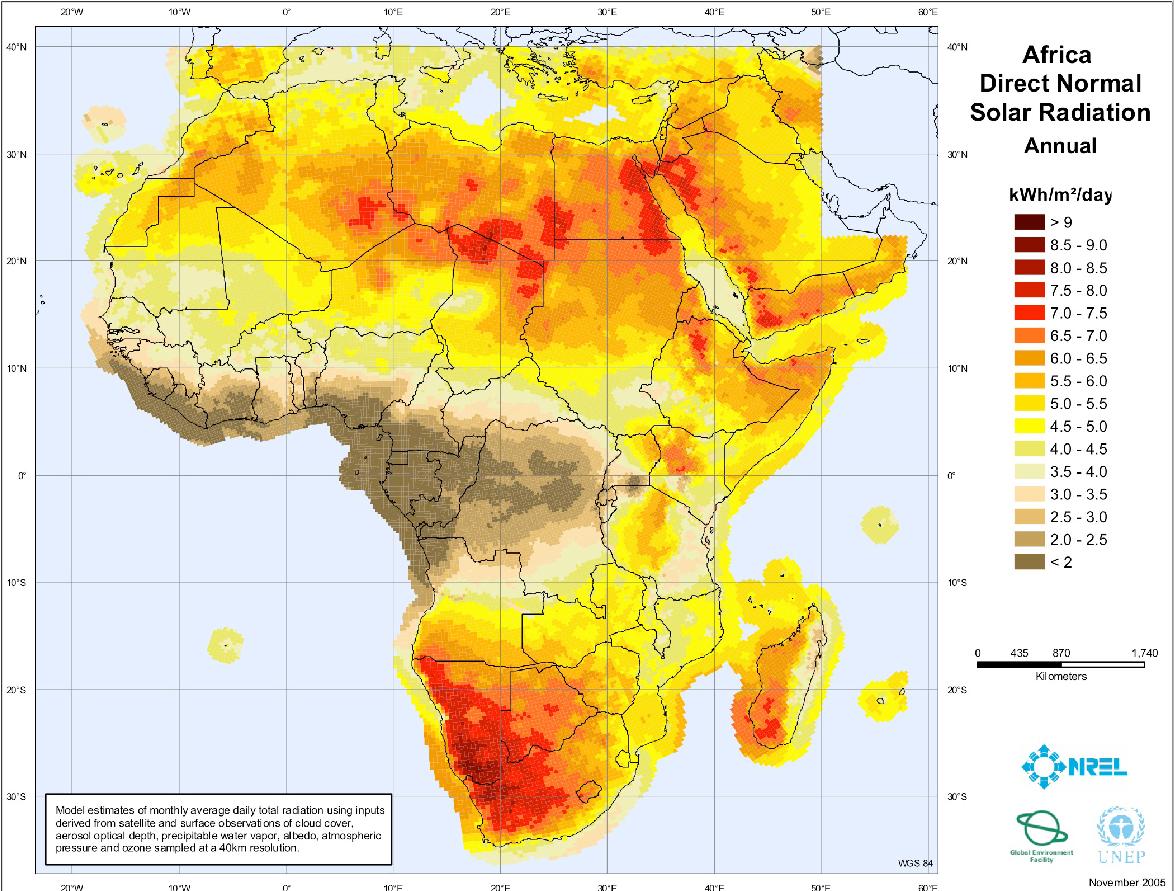
Figure 10. The distribution of solar energy exhibits a strong geographical gradient. (Source: NREL) Click to Enlarge
Of course, renewable energy flows exhibit their own characteristic distributions (Figures 9 and 10), producing mismatches between areas of high-quality supply and demand centers. Many large urban areas are far from a high-quality source of geothermal energy, do not have high wind power potential, or have low annual rates of solar insolation. Indeed, many of the windiest and sunny regions in the world are virtually uninhabited. The spatial distribution of renewable energy flows means that significant new infrastructures will be needed to collect, concentrate and deliver useful amounts of power and energy to demand centers.
THE ENVIRONMENTAL FRONTIER IS CLOSED
The transition from wood to coal occurred when the human population was small, its affluence was modest, and its technologies were much less powerful than today. As a result, environmental impacts associated with energy had negligible global impact, although local impacts were at times quite significant. Any future energy transition will operate under a new set of environmental constraints. Environmental change has significantly impaired the health of people, economics and ecosystems at local, regional and global scales. Future energy systems must be designed and deployed with environmental constraints that were absent from the minds of the inventors of the steam engine and internal combustion engines.
Air Pollution and Climate Change

Figure 11. The Mauna Loa curve showing the rise in atmospheric carbon dioxide concentrations (Source: Keeling, C.D. and T.P. Whorf. 2005. Atmospheric CO2 records from sites in the SIO air sampling network. In Trends: A Compendium of Data on Global Change. Carbon Dioxide Information Analysis Center, Oak Ridge National Laboratory, U.S. Department of Energy, Oak Ridge, Tenn., U.S.A.)Click to Enlarge
These emissions drive a range of global and regional environmental changes, including global climate change, acid deposition, and urban smog, and they pose a major health risk. According to the Health Effects Institute, the global annual burden of outdoor air pollution amounts to about 0.8 million premature deaths and 6.4 million years of life lost. This burden occurs predominantly in developing countries; 65% in Asia alone. According to the World Health Organization, in the year 2000, indoor air pollution from solid fuel use was responsible for more than 1.6 million annual deaths and 2.7% of the global burden of disease. This makes this risk factor the second biggest environmental contributor to ill health, behind unsafe water and sanitation.
Climate change may be the most far-reaching impact associated with fossil fuel use. According to the Intergovernmental Panel on Climate Change (IPCC), the global atmospheric concentration of carbon dioxide has increased from a pre-industrial value of about 280 parts per million (ppm) to 379 ppm in 2005 (Figure 6). The atmospheric concentration of carbon dioxide in 2005 exceeds by far the natural range over the last 650,000 years (180 to 300 ppm) as determined from ice cores. The primary source of the increased atmospheric concentration of carbon dioxide since the pre-industrial period results from fossil fuel use, with land use change providing another significant but smaller contribution. The increase in carbon dioxide concentrations are a principal driving force behind the observed increase in globally averaged temperatures since the mid-20th century.
Carbon intensity is an increasingly important attribute of fuel and power systems. Social and political forces to address climate change may produce another distinguishing feature of the next energy transition: environmental considerations may be a key important driver, rather then the inherent advantages of energy systems as measured by energy density, power density, net energy, and so on.
Appropriation of the products of the biosphere
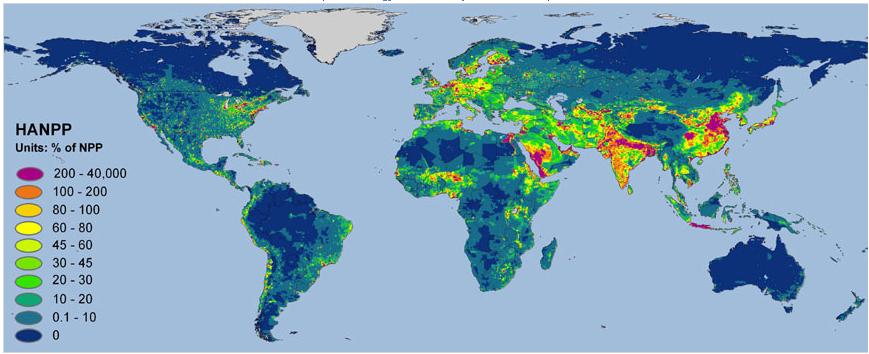
Human appropriation of NPP, apart from leaving less for other species to use, alters the composition of the atmosphere, levels of biodiversity, energy flows within food webs, and the provision of important ecosystem services. There is strong evidence from the Millennium Ecosystem Assessment and other research that our use of NPP has seriously compromised many of the planet's basic ecosystem services. Replacing energy-dense liquid fuels from crude oil with less energy dense biomass fuels will require 1,000- to 10,000-fold increase in land area relative to the existing energy infrastructure, and thus place additional significant pressure on the planet's life support systems.
The rise of energy markets
When coal replaced wood, most energy markets were local or regional in scale, and many were informal. Energy prices were based on local economic and political forces. Most energy today is traded in formal markets, and prices often are influenced by global events. Crude oil prices drive the trends in price for most other forms of energy, and they are formed by a complex, dynamic, and often unpredictable array of economic, geologic, technological, weather, political, and strategic forces. The rise of commodity and futures markets for energy not only added volatility to energy markets, and hence energy prices, but also helped elevate energy as to a key strategic financial commodity. The sheer volume of energy bought and sold today combined with high energy prices has transformed energy corporations into powerful multinational forces. In 2006, five of the world's largest corporations were energy suppliers (Exxon Mobil, Royal Dutch Shell, BP, Chevron, and ConocoPhillips). The privatization of state-owned energy industries is also a development of historic dimensions that is transforming the global markets for oil, gas, coal and electric power.
Global market forces will thus be an important driving force behind the next energy transition. There is considerable debate about the extent to which markets can and should be relied upon to guide the choice of our future energy mix. Externalities and subsidies are pervasive across all energy systems in every nation. The external cost of greenhouse gas emissions from energy use looms as a critical aspect of energy markets and environmental policy. The distortion of market signals by subsidies and externalities suggests that government policy intervention is needed to produce the socially desirable mix of energy. The effort to regulate greenhouse gas emissions at the international level is the penultimate example of government intervention in energy markets. The political and social debate about the nature and degree of government energy policy will intensify when global crude oil supply visibly declines and as pressure mounts to act on climate change.
Energy and poverty
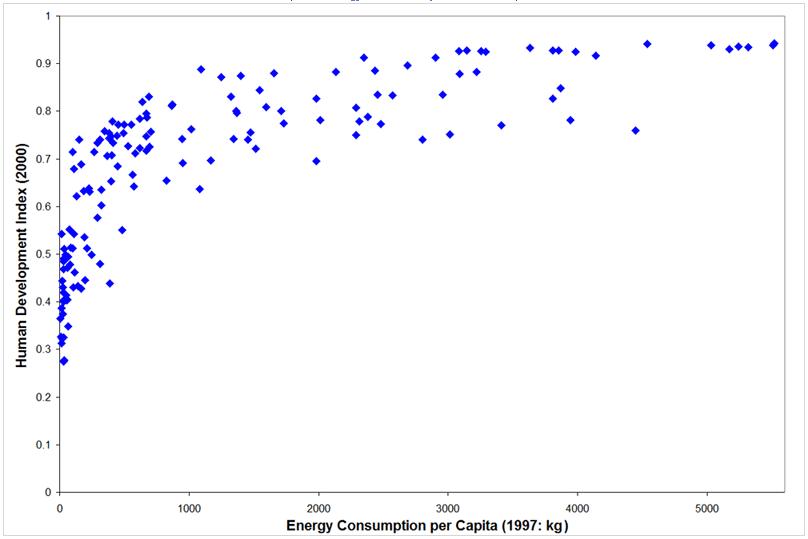
Figure 14. Energy and basic human needs. The international relationship between energy use (kilograms of oil equivalent per capita) and the Human Development Index (2000). (Source: UNDP, 2002, WRI, 2002) Click to Enlarge
The energy transition that powered the Industrial Revolution helped create a new economic and social class by raising the incomes and changing the occupations of a large fraction of society who were then employed in rural, agrarian economies. The next energy transition will occur under fundamentally different socioeconomic conditions. Future energy systems must supply adequate energy to support the high and still growing living standards in wealthy nations, and they must supply energy sufficient to relieve the abject poverty of the world's poorest. The scale of the world's underclass is unprecedented in human history. According to the World Bank, about 1.2 billion people still live on less than $1 per day, and almost 3 billion on less than $2 per day. Nearly 110 million primary school age children are out of school, 60 percent of them girls. 31 million people are infected with HIV/AIDS. And many more live without adequate food, shelter, safe water, and sanitation.
Energy use and economic development go hand-in-hand (Figure 14), so poverty has an important energy dimension: the lack of access to high quality forms of energy. Energy poverty has been defined as the absence of sufficient choice in accessing adequate, affordable, reliable, high quality, safe and environmentally benign energy services to support economic and human development. Nearly 1.6 billion people have no access to electricity and some 2.4 billion people rely on traditional biomass—wood, agricultural residues and dung—for cooking and heating. The combustion of those traditional fuels has profound human health impacts, especially for woman and children. Access to liquid and gaseous fuels and electricity is a necessary condition for poverty reduction and improvements in human health.
CONCLUSIONS
The debate about "peak oil" aside, there are relatively abundant remaining supplies of fossil fuels. Their quality is declining, but not yet to the extent that increasing scarcity will help trigger a major energy transition like wood scarcity did in the 19th century. The costs of wind, solar and biomass have declined due to steady technical advances, but in key areas of energy quality—density, net energy, intermittancy, flexibility, and so on—they remain inferior to conventional fuels. Thus, alternative energy sources are not likely to supplant fossil fuels in the short term without substantial and concerted policy intervention. The need to restrain carbon emissions may provide the political and social pressure to accelerate the transition to wind, biomass and solar, as this is one area where they clearly trump fossil fuels. Electricity from wind and solar sources may face competition from nuclear power, the sole established low-carbon power source with significant potential for expansion. If concerns about climate change drive a transition to renewable sources, it will be the first time in human history that energetic imperatives, especially the the economic advantages of higher-quality fuels, were not the principal impetus.
FURTHER READING
* Dimitri, Carolyn, Anne Effland, and Neilson Conklin, The 20th Century Transformation of U.S. Agriculture and Farm Policy. Electronic Information Bulletin Number 3, June 2005, Economic Research Service, U.S. Department of Agriculture.
* European Wind Energy Association, Large scale integration of wind energy in the European power supply: analysis, issues and recommendations (December 2005).
* Intergovernmental Panel on Climate Change, Climate Change 2007: The Physical Science Basis. Summary for Policymakers, February 2007.
* Johnston, Louis D. and Samuel H. Williamson, The Annual Real and Nominal GDP for the United States, 1790 - Present. Economic History Services, retrieved April 1, 2006.
* Milligan, M. and K. Porter, Determining the Capacity Value of Wind: A Survey of Methods and Implementation, Conference Paper NREL/CP-500-38062 May 2005.
* Reddy, A.K.N., Energy and social issues, in World Energy Assessment: the challenge of sustainability, UNDP/UNDESA/WEC, New York, 2000.
* Smil, V. 2006. "21st century energy: Some sobering thoughts". OECD Observer 258/59: 22-23.
* World Bank PovertyNet.
Citation
Cleveland, Cutler (Lead Author); Peter Saundry (Topic Editor). 2007. "Energy transitions past and future." In: Encyclopedia of Earth. Eds. Cutler J. Cleveland (Washington, D.C.: Environmental Information Coalition, National Council for Science and the Environment). [First published April 11, 2007; Last revised May 3, 2007; Retrieved August 7, 2007]. Source here.
Contact
- Content: editors at theoildrum dot com
- Tech support: support at theoildrum dot com
License

This work is licensed under a Creative Commons Attribution-Share Alike 3.0 United States License.
I think that this
should be "...commonly extracted with power densities of 102 or 103 W/m2 of coal or hydrocarbon fields...."
Is that correct?
Chris
Yes, thanks.
I didn't know the html tag for that when this was first posted.
It is worth noting that you get that power density for a one time use of say 20 years but then you have to move on and tear up some other portion of the Earth. With solar power operatiing at say 90 W/m^2 average power density, you get continual use and one only need wait 25 to 250 years before you've our performed fossil fuels by this measure.
Another place where one might make a comparison is in fig. 4 where the energy produced per kg of silicon used in solar power is about 200 times greater than for coal if we stop to refurbish the silicon after 25 years or so. In fact, owing to the smaller distances traveled for silicon compared to uranium, silicon beats uranium in terms of ton miles of transportation for a given amount of energy delivered. One would need to expand the plot boundries to include this though.
Chris
Not sure I agree on the solar numbers. but I agree that the area of land needed to provide a watt of power is a meaningless measure when that power comes from depletion of a nonrenewable fossil fuel. If you were to compute the area of, say, shallow tropical seas needed to create the fossil fuels, and the time that takes, you'll end up with far lower areal power densities than the 1W/m^2 of current photosynthesis.
The calculation is pretty easy. A 200 Watt panel weighs about 42 pounds. With 5 hours a day peak equivilent illumination you get about 9 MWh over 25 years, or about 200 kWh per pound. Coal gives about 1 kwh per pound. So, silicon requires much less hauling than coal for the same amount of energy.
If you want to compare to uranium, just figure the distance between you and a panel factory. For me it is about 70 miles. Then consider uranium mined in Australia, enriched in France and used in Maryland together with the shielding needed to transport it and you'll see that silicon also gives more energy than uranium in terms of how much lugging is involved.
I see that the anonymous cowards who have been rating my comment down don't like physics much, but that is really all that is going on here.
CHris
In 2007, the 439 operating nuclear reactors produced 2608 billion kWh requiring 76,200 tonnes of U3O8.
76,200 tonnes = 167,640,000 lbs
Therefore Energy/mass = 2608e9/1.68e8 = 15,557 kWh/lb
What shielding would that be, Chris? Uranium is a low activity alpha emitter. A sheet of paper would suffice. As for the distances you mention, it is worth again considering how small 76,200 tonnes is. You could easily transport it all with a small fleet of clipper ships!
So, if you carry out the math, you'll see that silicon wins. It is not all that important. It just puts the geewizz aspects of fission power into perspective. It ain't that cool. Fusion from a safe distance is much better.
A container for shipping 45 kg plutonium in a MOX assembly weighs 3.9 tonne. http://www.ccnr.org/lyman_casks.html#typ
So, you can call it packaging or shielding but it is a little more extra mass than solar panels ship with.
Chris
Could you be any more dishonest? Really, think about your argument here.
1. MOX isn't used for a majority of power plants.
2. Plutonium in mox is about 1% of the fuel load.
Worse and worse. I thought the plan was to put reactors down all over the world and reprocess the fuel in nuclear weapons states. You're just walking right into it.
Look, this really isn't important. Getting coal from the mine to the power plant probably reduces its EROEI by a good bit (in fig. 6 the value for coal is mouth-of-the-mine while that for oil is likely delivered), but that is not the case for moving solar panels around or nuclear fuel unless there is an accident. Silicon is superior to uranium by a bit but neither have the problems carbon for combustion has. I have heard of plans to ship uranium ore. That could be stupid I guess.
Chris
I know thats what a lot of people want to do, but I think its just a good way to waste money. Spent fuel doesn't hurt anyone while sitting in dry storage casks in a cordoned off parking lot of the power plant, and should stay there for the next several hundred years. You don't save money by reprocessing and you complicate the fuel cycle. As far as I can tell it has some potential for being a money saver in some fluid fuel reactor regimes, but with operating reactors today theres just no reason to do it except politics.
Not anymore stupid than shipping coal. All uranium mines today have ores that have higher energy density than coal when burned in LWRs.
It is worth noting that we've been over some other ground in response to this same article about a year ago: http://www.theoildrum.com/node/2856#comment-224123
The reason for controling spent fuel in non-nuclear weapons states is to avoid proliferation problems. So, on-site storage is not what people have in mind.
Chris
Right. Unenriched uranium yields 54 electrical MWh per kilogram in the plant near me, 24.5 electrical MWh per pound, more than 100 times the supposed 25-year yield of a solar panel, and requires no shielding.
--- G.R.L. Cowan, H2 energy fan 'til ~1996
http://www.eagle.ca/~gcowan/Paper_for_11th_CHC.html
I presume you are using a CANDU reactor, and very likely your uranium came from Canada. So, the transportation involved is likely less than typical. What I'm using now was likely mined in the Soviet Union, enriched and down blened there and then transported to the East Coast of the US. That would make lbs miles per kwh about the same as solar not counting packaging. I was thinking more of what to expect in 2013 or so.
Nukulur kooks tend to get all excited about E=mc2 and drool all over fission. This just points out that silicon does E=mc2 with much greater elegance than uranium.
Chris
Chris, I know you derive particular enjoyment from these mathematical drivebys you like to do against nuclear power, but can't we agree - for the sake of truth and fluffy bunny rabbits - that lbs miles per kWh is a piss poor metric to judge either nuclear or solar. Transport costs are a minor fraction of the EI in their EROEIs. Essentially the whole argument in this thread is a proxy for EROEI and not a very good one at that. Kinda like two men arguing over which is tallest based on who's wearing the thickest socks.
I think I've said as much in the thread. It is just fun really. For coal, it does make a difference. Gas also loses something in translation. Oil begins to see some important cost over long distances too.
Chris
...Only photovoltaic generation, a technique not yet ready for mass utilization, can deliver more than 20 W/m2 of peak power...
assuming a peak insolation of 1kW/m2 the indicated photovoltaic peak power of 20W/m2 would need a meager 2% conversion efficiency. Currently even low cost PV modules (CdTe) reach 10% at a cost of less than 2$/Wp.
In less insolated places on earth such as Switzerland the average annual production of 1Wp installed capacity is 1kWh. Thus the annual average power is around 10W/m2 - in the Sahara 20W/m2 are reached.
Currently the best PV cells are 4 times better, which rises the power flux to 80W/m2 well within reach of the 100W/m2 indicated for an oilfield. rw
Solar thermal systems, specificly dish stirling can reach 312 W/m^2
85.7 m^2 intercept area
26.75 kW net output
31.25% conversion effeciency
Yes!
(poly)crystalline silicon PV cells are, uh, sub-optimal technology. If you insist on something that produces electricity in one step, the new thin-film techniques are much better.
But PV's problem has always been storage. Solar thermal systems (driving good old steam turbines) beat any PV-and-battery system hands down.
Solar thermal is much quicker to deploy and much more (down-)scalable than nuclear, too. This is important in small and less-developed countries.
Said by Cutler Cleveland:
Said by rolf_w:
I think Mr. Cleveland's figure of 20 W/m2 is the daily average. For example:
efficiency of monocrystalline PV: 15%
efficiency of thin film PV: 5%
average efficency: 10%
percentage of clear days (assume no power output on cloudy days): 75%
integration factor for PV pointing in fixed direction: 6 hours
insolation: 1000 W/m2
power produced during one day: 10% * 1000 W/m2 * .75 * 6 hr/day = 450 (W/m2)*hr/day
Convert the units by dividing by 24 hours / day to get: 18.75 W/m2
which is close to his 20 W/m2.
I swear, people keep comparing apples to oranges. Solar power is ten times as valuable as nuclear power on a KWHr basis. Noon power is far more valuable than midnight power.
Midnight power in the winter in the north is substitutable by insulation. Try doing that with noon air conditioning power sometime.
Though technically you could use a zeolite air conditioner working off a thermal mass from night time electric power.
Item: The only reason current nuclear power generation is not a peaking resource today is because no-one asked it to be. The engineering is quite straight-forward, witness many aircraft carriers and submarines commonly operating at less than full power reliably, safely and often in the harbours in front of you.
If you think insulation can substitute for fuel in heavy heating zones, then you've clearly never lived through a winter in Canada. Stupidity. Lack of power/ fuel / energy in a subtropical zone makes you uncomfortable. Lack of same in Edmonton in winter WILL kill you.
Well, I like fission, but no one should expect fission to be a peaking power supply unless somehow it becomes cheaper than every competitor. I suppose it allready is for solar, but...
The real problem with using fission as a peaking power supply is it makes no sense. Nuclear fuel is so cheap and the risk of playing around with the reactor power based on demand is nonzero. Its far better to just run them at full power the entire time and dump the excess into resistors.
I know some reactors do play with load following, but its an awful big waste of time.
These two statements are somewhat contradictory, since nuclear gives both noon and midnight power.
Now if the capital cost of solar was 1/10th that of nuclear they would be complimentary. Perhaps it will be someday.
If I had to guess, I'd say you are right about this. Fig. 5 certainly looks like average power density and it neglects better solar thermal efficiencies. In the end, the measure is not all that important. Wind does not interfere much with farming on the same land while strip mining does. You can get all the energy you need putting solar panels on your roof without interfering with any other land use but you can't usually drill for oil in your basement with success.
The nuclear power industry likes this measure because they can bad mouth hydro which is cheaper and produces less carbon emissions. But uranium mines leave toxic tailings while reseviors have other uses than just generating electricity.
Once we realize the basic conceptual error that depletable resources don't have a high average power density measured on renewble energy timescales, then the usefulness of the measure pretty much evaporates.
Chris
You can refer to the Web Design Group page for a handy list of these little gems, where you'll find shortcuts like °, ±, ² or µ — or you can just enclose the superscript in <sup> tags.
I live next to the Leeds - Liverpool canal in the UK. A fabulous engineering achievement built by hand in the 1780's, over 100 miles long with many locks, bridges and a few tunnels.
UK goods transportation
The Canal age 1760 - 1840
The Coal age 1840 - 1920
The Oil age 1920 - 20??
The canal has been restored for leisure traffic, maybe it will revert back to carrying freight also with horse drawn barges, if you don't need next day delivery !
In the old days as much as 750 acres of a 1,000 acre farm might be devoted to "pasture," hay, corn, and oats for the livestock.
Today, 20 acres would provide enough ethanol to farm said 1,000 acres, and, yield, in addition 54,000 lbs. of high-protein distillers grains for livestock feed.
I don't know Much about the future; but, I do know that we will never go back to using draft animals.
Today, 20 acres would provide enough ethanol to farm said 1,000 acres, and, yield, in addition 54,000 lbs. of high-protein distillers grains for livestock feed.
Yes, provided you keep the fossil fuel inputs flowing into the process. Take away the fossil fuel inputs, and you would quickly find that you don't have nearly the net that you thought you did.
And don't forget the input of machinery, not just to process the crops into biofuels but also to make use of the resulting fuels to farm the rest of the acres. The energy embedded in the manufacturing and servicing of these limited-life implements is huge.
A tractor, in it's lifetime might plant, and cultivate enough corn to produce 10 Million gallons of ethanol. Compared to that the energy inputs into the tractor would be miniscule. same for the Harvester.
Except what about the mining & smelting for the metal on the tractor ? And the transportation of the raw material to make the tractor ? And the input needed to get the manpower to build the tractor (each worker has to get to work, eat, etc). The Energy Return on Energy Invested in ethanol is nearly 1 to 1, making it a pointless venture. When I refer to ethanol, I mean corn based ethanol. Lifes different with sugar cane or algae.
Let me explain it this way. I own a very small car. It's assumed that construction of this vehicle (total energy used) amounts to about 60 barrels of oil. Assuming we draw 20 gallons of gas per light sweet barrel of crude based on 60 barrels of crude, that's 1800 gallons of fuel x 50 mpg is 90,000 KMS. Construction of my car to get it to the lot used the equivalent amount of energy of driving it 90K. Farming is much the same, but fertilizer is also energy intensive.
You're making some stuff up which has no bearing in fact. 1 tonne of steel uses a comparable amount of coal in the manufacture, not thousands of tonnes. The transportation of the raw material uses an inconsequential amount of energy. And when you start using iterations on the labor support infrastructure for the tractor (the workers, and their bakers, and their bakers' hairdressers), soon you encompass all of society and you're by definition using exactly as much energy as you produce.
You don't need to make up nonexistant numbers to say ethanol is a bad idea. It only needs to be worse than its competition, which it plainly is.
That's true he does need a source, but I actually from experience think his numbers are about right. It requires exponentially more energy to produce a machine as complex as a car than something much simpler. You forget each piece of metal has to be mined and driven through many many process then forged, shaped ect ect along with all of the millions of other parts.
Let's see; We manufacture 15 Million Cars/Yr. 15,000,000 X 60 Barrels = 900,000,000 Barrels. What do we use as a country? 7 Billion Barrels?
Better try again.
umm... yes. 7.3 billion barrels actually. 60 barrels per car is probably high for total oil consumed, but is most likely correct for total energy when the entire supply chain is considered.
Corn Plus is eliminating 51% of their nat gas by gassifying their thin stillage (about 20% of the DDGS, IIRC.) I guess you could take another 20% of DDGS and pretty much eliminate that part of it. Another way is to dry your ddgs by "Microwave" thus further cutting your energy bill. Of course, Poet will burn the corn cobs.
Then, you could always gassify more biomass than you need for the process, and use the excess methane to make fertilizer. I think that'd work.
Anyhoo, we ain't going back to horses. My daddy used to farm with horses; and, that was a hard way to make a buck.
kdolliso,
I'm surprised you haven't been rated out of existence by your many pals here.
;)
Don't forget that we don't need ANY natural gas to make ammonia fertilizer. It can be produced directly from wind electricity which the US Great Plains has in great abundance. This would elimate the problem of ammonia fertilizer completely.
http://futurewindtech.com/
Actually, the government should be pushing wind to ammonia like crazy, thus conserving natural gas and
promoting the development of 1 TW of stranded wind on the Great Plains.
I think we are being a little unfair to kdolliso here (and I'm bigtime anti-ethanol). His point about not going back to draft animals I think is a valid one. We of course could power the farm machinery with electricity, made from either PV, wind, or biomass. We would probably go to no-till or low-till, and use organic fertilizer as much as possible. I wouldn't be surprised if the farm exported, electricity and biomethane as well as food & feedstock for bioplastics. It is not impossible to do this stuff without oil. It may be more expensive than what we may grown used to.
Had we had a more fortunate geologic endowment (no oil or coal), we would have developed this way (it probably would have taken longer), and never would have become addicted to cheap fuel.
I don't think you'll ever have industrial production of ammonia from wind. To make ammonia, you need hydrogen, and electrolysis is the most expensive way to make hydrogen. In order of expense:
1. Natural gas reformation
2. Coal reformation
3. Nuclear (and possibly solar) thermochemical methods
4. High temperature steam electrolysis (requiring nuclear/solar input heat)
5. Water Electrolysis
Wind could provide excess electricity during surplus hours to allow reactors to divert most of their (largely thermal) energy to either high temperature electrolysis or thermochemical hydrogen generation as a form of demand management, but I think it would be a stretch to call it wind to ammonia.
And really in the medium term, we're getting it from natural gas coal.
you can just electrify agricultural machinery.
ummm, the whole thrust of this article (in case you didn't read it) is to point out the difficulties inherit in the "you can just _____" fixes.
I agree that electrifying agricultural machinery would be great (I was quite fond of Jason Bradford's "Case for the Electric Tractor" article), but it shan't happen overnight, or without considerable, perhaps insurmountable, difficulty. Also, I think Americans regularly forget that the whole world is not the United States --- today is Canada Day after all :) --- and that fixes vaguely feasible there, are not so feasible elsewhere. We're all in this together.
I don't necessarily ascribe to the 'our standard of living will be worse' camp, but I am a firm believer that it will be different. Recall the Einstein quote: "The thinking it took to get us into this mess is not the same thinking that is going to get us out of it." Let us think outside the box a little and not rely on the "you can just substitute x for y" game. After all, that's why I love the oil drum and it's merry peak oil pranksters.
what considerable difficulty? I don't see any.
of course it won't happen overnight and it doesn't have to.
that IS thinking outside the box.
It’s obvious John you haven’t been around modern farm equipment. I was clearing large saplings on the outside of my fencerow today to make it easier for my neighbor to get his new harvester through for the winter wheat harvest. He almost need all of the mandated 40ft. road easement. These are big powerful machines that can make short work of a hundred acres. Running big diesels at full power all the time. The size and power is very necessary in modern large acreage farms to get the harvest done quickly, efficiently, and before the weather changes - and with a minimum of labor. If electrical power was a viable option it would be offered, especially in a state like Illinois that has a surplus of nuclear power. Now I know your going to pull that WWI German story out of your ass again, but doesn’t it raise the question that if electrical tractors were so great, why didn’t it catch on? Because they could not scale up.
Bruce, I take your point about present machinery - see my post upthread about possibly using biogas for the really big stuff - but the point I would like you to clarify is that the size of farms, and machinery, and the alternative use of more labour, is the way it is in a world of cheap diesel.
With liquid fuel likely a lot more expensive, even for biogas, and labour perhaps not so valuable, how do you see that impacting the size of farms and machinery?
Fertiliser is also likely to be a lot dearer, at least for other than ammonia, which can be made from electric.
ccpo was talking about permaculture, which sounds great, but since I have trouble with the plants dying in my window box perhaps I can't claim too great an authority!
Thoughts, perspectives?
I’m just a small organic horticulturalist(what the big guys around me call play farming, I call them limo farmers because they never get out of their fancy machines and feel the dirt) so my perspective is not one of farming large acreage. But I do observe what is going on around me and keep my ears open. I just don’t see the farms getting any smaller for grain farming, especially with the costs of land and machinery for a newcomer to start one up. I can think of better investments even with high commodity prices If anything I see more and more land being owned by fewer people. This has been the trend in the US for some time, causing some states to pass anti-corporate ownership laws for farms (I studied this in law school in an ag law course). Like sticking a finger in the dike these laws were. I’m guessing things are going to continue that way especially as costs rise.
As to myself, I can barely afford a used tractor, let alone a brand spanking new one, and I‘m sure most in my situation are in the same boat. I’ll probably get a mule in the future. I have a nice pasture. My area also has the largest Amish community in Illinois so getting that kind of equipment should be no problem.
As I said personally I have to have my carrots labelled 'top' and 'bottom', but when folk here were discussing the effects of peak oil the consensus seemed to be that the grain farms would stay big or get bigger, but localisation and higher labour input might occur in market vegetables and so on, which ties in with what you are saying.
I believe a lot of electric tractors are being jerry-rigged rather than bought spanking new, so the costs might not be excessive.
Perhaps you might have a browse around on the net and see what you think of the various models on offer - they featured one, home built, on discovery channel recently.
I seem to remember it got a lot of its power from a solar panel, or maybe it was a wind turbine.
Have Any of you people ever BEEN ON a farm? Sometimes these large tractors run 24 hrs. straight. Pulling 16 row equipment.
Concentrate chilluns; Why would you ever consider such nonsense when all you have to do is convert 20 acres of your 700 acre farm into ethanol (or biogas, or biodiesel?) Probably, we'll end up going "Hydrous" ethanol. Farmers in the U.S. have been doing that for about 300 years.
Yeah, I can hear the combines going right now in the next field taken in the wheat. Noise kept me up which is why I'm posting late. Suppossed to rain tommorrow and the next couple of days.
that ratio is bs, 20 out of 700. but your using bs numbers for crop yields...
Actually, bs would be pretty good for improving crop yields.
We've pretty much established in prior threads that yield is at least 2.8 gal/bu, and that we produced 151 bushels/acre of corn last year.
Did you read what I actually wrote?
I specifically distinguished between some light equipment, where there are indeed electrical tractors and other gear available, and the heavier equipment.
That is why I said biogas might be the way to go for the heavy stuff.
Dave, I hit the wrong button; I didn't mean to single you out for that comment. Having said that, though, there is probably zero chance that farm equipment, of any size, will ever be run off of electricity. Farming is just too "time-critical" when jobs need to be done.
Bruce from Chicago's comment last night about the Farmers harvesting wheat all night racing against a coming rain was very instructive. When you have millions of dollars worth of grain that you have to get out "right now" you can't take a chance on the batteries running low.
Anyway, sorry if it seemed I was singling you out. cheers.
kdolliso is right on. A lot of people here are babbling on about farming issues they know nothing about. I lived through the transition from horse-powered farming to modern high-intensity. I've seen the changes from my father's farm where he and three sons and four Percherons worked constantly to produce 60 fed steers/heifers for market per year. (Note: we had no grid electricity, used a wind generator, batteries and a standby gasoline unit which burned down the henhouse it was installed in. House was wired for 32VDC power, mom had a vacume cleaner, electric water pump. All heating and cooking wood.) My brother moved to owning a feedlot in Alberta which produces 27,000 head of feeders at a time, with 8 employee machine operators. That's a shift from 30,000 lb beef / 4 worker yrs, or 7,500 lb / work yr to 27,000,000 lb gross (14,500,000 actually grown at the feedlot) beef / 10 worker yrs or 1,450,000 lb beef / work yr. It's all due to scale of machines (which are huge and fast) and scientific crop techniques. If you want to discuss going back to horse-powered organic farming, be prepared to also recommend increasing the agricultural workforce by some factor well above 1000:1 above present, and a relative income level well below present poverty. And I am aware of the issues of beef as a viable food base for current society, but consider the fact that the first 600 lb on a 1,200 lb fed steer happens in mountain or woodland pastures which can't produce any other crop at all, and most of the feedlot feed is whole plant silage made from substandard grain fields and even leavings from a mint extract harvesting plant, not dry grains.
what if the farmer had batteries in reserve specifically just in case? what if ultra capacitors are used mainly instead of batteries? what if the tractor has huge solar panels on top?
I think if farmers can figure out how to not run out of diesel they can do the same with batteries.
Although I'm a huge, huge fan of electric motive power, I don't think you understand the sheer scale of a 'solar roof' you'd need to fit to a tractor even to enable it to do 30kmh with no additional load.
Now, if you had a 'trolley' system where the tractor drew power from overhead lines strung out across a field or something (still have to be a small field), you might be onto something, but on-board SolarPV for a working tractor is for hobby farms, at best.
Couldn't biodiesel handle these large scale machines? I do think we may see a long term trend away from the Super-Sized farms, and back to what can reasonably be taken care of with one small tractor. (would that be 100-200 acres? I don't know much about farming.
Biodiesel will do just fine. The only problem is the best "Oil" plants grow in the Tropics. On the other hand, you would be able to use the existing tractors and harvestors (the largest of which are ALL Diesel.
The reason all of the farms and machinery is Large is that that is the most "efficient" way to farm. That won't change.
And, anyone, here, who thinks they can grow wheat in the front yard more efficiently than the Farmer in Kansas can ship it to them needs to give it a try some day.
Folks, I don't have the foggiest what will happen to the poor folks in Zimbabwe; but, I'll guarantee you that you won't "starve" in the United States.
we could also use the billions of gallons of waste vegetable oil that is produced each year.
what about switching to growing food that doesn't require large machines? why do we need so many illegals if farming is all about big tractors? tractors can just go hybrid and then eventually electric. don't believe me?
Case IH Shows Diesel Hybrid Tractor Prototype
http://www.greencarcongress.com/2005/11/case_ih_shows_d.html
Now I know you're saying it's just a prototype. big deal? if we don't have them now it's obvious we don't have a great need for them as of yet.
germany is an absurd example only in the doomer world how could germany have electrified ploughs during a war they lost and in what was most likely a "capital constrained" world? probably because they had to. why didn't electric tractors catch on? I don't know. maybe regular tractors were able to be mass produced better. maybe the electric plough existed only because there was no other option.
the point is it can be done. it was done almost 100 years ago.
John, do you eat anything that contains corn, wheat, oats, barley, or rice? You and the rest of the world’s population? Supplying enough agriculture for the world with those crops requires big efficient reliable machines. hybrids are not for machines that run constantly at FULL POWER!! I know it is not polite or in accordance with TOD policy, but you sir are a buffoon.
Like for example railroad engines? Which have now gone to serial hybrid designs? Thing is that the parallel hybrid like the prius would be stupid for a tractor, no braking energy to get back, etcetera, but a serial hybrid design could vastly simplify the drive train and improve efficiency as well as making the whole device lighter and more versatile.
A good point Fordprefect. I did some more searching and found that Deere is doing some research on the issue. http://farmindustrynews.com/mag/farming_electric_tractors_2/ But I really wonder how much efficiency could be bought in this instance. Locomotives are a perfect fit for the diesel hybrid system. Just imagine what kind of transmission would be needed to pull a very heavy load to speeds in excess of fifty miles and hour over all sorts of grades- a 100 speed transmission? I suspect a hybrid tractor is a solution looking for a problem. And worth the cost and added complexity?
The ONLY advantage of a hybrid drivetrain over a conventional is that it can recover energy from deceleration braking. How the heck is that supposed to apply to a farm tractor?
A lot of people here need to get a BIG dose of reality and some scientific education.
No, that is not correct. The *primary* advantage in automotive uses of a hybrid drive train is the regenerative braking, but there are other advantages. In the serial hybrid design like railroad locomotives, it allows the engine to run at optimum RPMs, it allows the removal of a lossy transmission, it allows far more structural flexibility in the design because there is no direct mechanical connection from engine to wheels, it reduces shocks to the engine.
I think I remember an analysis made a while ago that sort of shows the primary advantage of hybrid drivetrains are peak power engine optimisation. While regenerative braking is cool, it doesn't really seem to add up to much in practice because at high speeds you're losing more to air resistance and at low speeds you're losing more when you require friction brakes.
if oil gets expensive enough we'll have to switch our diet. forget just about big factory farms, there are millions of front lawns that haven't been planted. there is always hydroponics. big corn and wheat fields could always be converted in a crisis.
as far as hybrid tractors go, why would CASE build a prototype if it couldn't be used? also, why do we spend so much time on the large tractors? why is that all we think about when we think of farming?
NON-MECHANIZED AGRICULTURE
http://peakoildebunked.blogspot.com/2007/12/319-non-mechanized-agricultu...
http://peakoildebunked.blogspot.com/2007/12/317-electric-agricultural-ma...
And maybe the battery & electrical motor technology back then was just too primative, and diesel just too cheap.
whats the electricity run on....
then you were going to say something like wind power or solar right?
Whats the raw materials that make up the wind turbines produced by.....
Fossil fuels of course..
until you are completely produce renewable energy with renewable energy, which I'm not sure is possible, then you WILL HAVE FOSSIL FUEL INPUTS.
geez, stop being so naive, your sounding like me when I was in 8th grade.
big deal. it's a long time until we don't have FOSSIL FUEL INPUTS.
Wow, fibreglass, aluminium and silicon are made out of coal, oil and natural gas? I never knew. Amazing what you learn when you keep your ears open... wide enough to let the wind whistle through.
Yes, they're all made with fossil fuel INPUTS. They all need process heat for production, and aluminum is refined using large amounts of electricity. Fiberglass also needs epoxy resin, i.e. plastic. Sure, we could get heat and electricity from non-fossil fuels, but it'll be more expensive which is then passed in the cost of materials.
Of all those, only fibreglass requires fossil fuel inputs. And as we all know here on TOD, fossil fuels will never actually run out, they'll just become more scarce and expensive. Materials too expensive to burn can still be used for other things, think of something like ebony, rosewood or sandalwood timber.
In other words, we can do it without substantial fossil fuel inputs, it's just more expensive. But then, if we're at the stage where fossil fuels are too expensive to burn, then renewables won't be expensive compared to fossil fuels, both be expensive compared to today.
If coal is a thousand bucks a tonne, even solar photovoltaics start looking bloody cheap.
It's funny how many people can sit and calmly talk about peak fossil fuels and then say, "well, renewables will always be too expensive compared to fossil fuels." It's like you're acknowledging peak fossil fuels but don't really believe in it.
I didn't say they will always be too expensive, but it is not likely any time soon because renewables require huge amounts of fossil fuels as an input so it may be not be all that simple.
compared to the amount of oil we waste each day on our highways the oil needed for renewables is minuscule.
denmark gets about 20% of it's electricity from wind and it's oil consumption has dropped more than 30% over the years.
Anything you like, really.
If 'electric farmers' wanted power at night, they could use a hydroelectric dam, or stored heat from CSP, or they could use electricity generated during the day to produce Ammonia whioch they could burn in the modified ICEs of their tractors etc.
Has anyone seen/done a good analysis of a hypothetical mid-West farm *without* petroleum?
Clearly, farmers are going to have to:
- deal with more expensive fertilizer, especially with natural gas -> nitrogen fertilizers
- electrify what they can, as per electric tractors, i.e., small-medium-size. A good thing about much farm machinery is that it doesn't go far from home, but I'm not yet convinced that 300HP combines with 60-gallon fuel tanks are easy to electrify. Likewise, Class 8 grain trucks.
- grow some fuel for the non-electrifiable piece.
In Kansas, the mean farm size in 2002 was ~733 acres, with a right-skewed distribution [30%: 1-99 acres, 35%: 100-499 acres, 13% 500-999 acres, rest bigger].
The question is whether or not such farms work without petroleum, and if so, percentages of land needed for windmills/solar, (cellulosic, hopefully) ethanol sufficient for the non-electrifiable uses. We know that the windmill footprint is maybe 3-4% of land, i.e., windmills+crops are good combination, plus maybe one gets solar from roofs and eventually BIPV where that makes sense.
If such farms are *not* practical, many people will be moving back onto farms. We do have a well-established size-bound/existence proof towards the other extreme: Old Amish who use horses and mules, no tractors or electricity. They farm family-size farms about an order of magnitude smaller (say 40-120 acres), but also have ~6-8 children/family.
Anyway, has anyone seen a realistic analysis of North American farming after Peak Oil?
Why would you need to suppose no hydrocarbons just because you have no petroleum.
You can make nitrogen fertilizer from coal or nuclear power generated hydrogen.
You can make diesel fuel from coal or nuclear power generated hydrogen.
I didn't suppose no hydrocarbons. Why did you think that? All they have to do is get enough more expensive.
I said: nitrogen fertilizer gets more expensive than with natural gas.
Diesel from coal or from nuclear isn't cheap, even ignoring the AGW issues of the former, and it's not clear either is an energy pathway one wants to use for anything but dire necessity. I have hopes for algae biodiesel, but we'll see what happens. If it does, it's more likely to sunny deserts than in places with good soil.
I picked a specific state, Kansas, on purpose. Kansas has miniscule coal production. At some point, if fuel gets expensive enough, a state that can grow its own fuel, will. No farmer *likes* external costs over which they have no control - they already have enough other things (like weather) over which they have no control.
Perhaps (I don't know offhand) Kansas has a plan like that of Iowa, as seen in their energy plan, which among other things is not very keen on new coal plants, but is very keen on all aspects of efficiency and for renewables.
Note: this post is not an endorsement of the (broken) corn & ethanol subsidies, just an observation that a farm state that has an option to grow at least some of its own fuel will do that in preference to paying really high prices to somebody else. Likewise, people don't convert electricity into fuel except when they really need to, which is why I think that things that can get electrified, will, in some cases with easily-swappable batteries ... although I still worry about the big gear.
One area where biofuels, preferably biogas as it is much more efficient, may have a useful role is in farm equipment.
As you say some of it is tough to electrify, as they draw a lot of power.
Running some of the heavy machinery on biogas would be convenient as you are not transporting it anywhere.
Lighter machinery could quite easily be electric.
Diesels can run on natural gas or biogas, i.e. methane. It's cheaper to convert diesel equipment to CNG than make GTL fuel or buy brand new electric tractors (assuming they ever exist). CNG isn't popular on cars because of bulky tanks that take trunk space, short range and inconvenience of refueling. That shouldn't be a problem for farm equipment as long as you get a day's worth of work out of a tank.
I was wondering about the viability of converting diesel engines to biogas. It is true that you will get quite a bit more energy converting biomass to CBG than converting it to liquid.
You don't need to use fossil fuels to make ethanol. You can use nuclear, wind, or solar power for everything including the nonfertiliser chemicals like pesticides, herbicides, fungicides, and antibiotics that are now made from fossil fuels.
Fossils fuels are important because they are high return on investment, not because they are magic. All fossil fuels can be replaced by nuclear, wind, or solar.
Do you have a source for this? I'm genuinely curious because I'm working on some numbers right now to compare just this... but I haven't seen anything.
Fun you should walk about canels.
That was one of the first thought I had when I first read the story.
http://en.wikipedia.org/wiki/Erie_Canal
From the title, I thought this was going to be a discourse on collapse and energy transitions.
;)
Cheers
Brilliant stuff – should be read in conjunction with a visit to Professor David MacKay’s site ‘Sustainable Energy without the Hot Air’:
http://www.withouthotair.com/
Just one point on Cutler Cleveland’s conclusions:
[emphasis mine]
Superb. Yet I think that the final sentence of this excerpt is driven by wishful thinking rather than by reality. It is far more likely that oil depletion plus anti-nuclear hysteria plus anti-renewables NIMBYism will lead to a mad scramble for coal as the only politically acceptable alternative. The ‘tragedy of the climate commons’ will kick in with a vengeance. Reducing carbon emissions will be the last concern both of the new poor in developed countries and the new rich in developing ones. We are going to see an explosion of carbon emissions, not a reduction. The human race’s general indifference to externalities suggests that we will only stop putting carbon back into the atmosphere when there’s none left to put back there.
I agree that will happen, but not due to "anti-nuclear hysteria plus anti-renewables NIMBYism". Rather, due to the capitalist model, where nothing is done other than for private profit, thus making the rich richer by dumping the externalities on the poor. As long as the rich believe that they can garner bigger profits from BAU, and that they can use their riches to isolate themselves from the consequences of climate change, why would they do anything else? The article assumes that government will intervene, but there is not much real-world evidence that governments are working for anybody but those who profit from BAU. That's true even in "democracies" - watch for example the UK participating in the war in Iraq despite clear public choice against that. Many governments are talking about "doing something" about the climate, but emissions keep rising.
I would replace 'the rich' by 'investors' or 'savers'. It is not only the rich who want 'private profit' -- it is more or less everybody, barring a few saints and hermits. The rich are just better at it, that's all.
You may be right. However, I don't think such pessimism is a foregone conclusion. There have been times when the nation has pulled together (and other nations as well). Roosevelt did a lot to employ people to get them working in the era of the depression. During WWII people accepted rationing of all sorts of goods (including fuel) to help win the war. It is possible that a president could find a way to identify shared goals in such a way that most people would accept their share of the burden required to reach the goals. Panic and chaos can be avoided.
If there is a bright spot in all this it is Figure 14. A rough reading says that it takes relatively little energy to have a large impact on quality of life. One way or another we all will be living with less energy in the not too distant future.
I fail to see why NIMBYism will stop wind and solar farms but would allow coal stations. It's not like burning coal smells like roses, you know.
Well, first, the US isn't building much in the way of new coal plants.
Second, a typical windfarm installation is perhaps 10, 4 mw turbines, or 40 mw of 25% capacity factor power so it provides a total continuous equivalent output of 10 MW. Good wind locations are all sited high up where the turbines are very visible. To replace a 250mw coal station at 90% capacity, you need 23 such sites. That's 23 majestic mountaintop views that get "ruined" by windmills. A coal plant OTOH gets crammed down in the industrial park, screened from view, and only built once. No one much needs to look at it, so it really isn't so much in anyone's back yard.
Third, people are assholes.
If you can tear down mountains to get the coal in them, I fail to see why you can't put wind turbines on them instead.
Well, that's a different one than siting the plant itself.
The first answer is that coal mining is a *major* employer. Providing large numbers of skilled workforce jobs is always far more popular than simply providing energy. second it is once again true that the numbers are vastly lower, an open pit coal mine may yield 1 million tons per year of coal for decades, coal contains 6150 kwh/ton depending on grade, so yields 3 mwh/ton roughly. That means that that coal mine yields 3 million mwh/year. A 4 mwh wind turbine yields 8760 mwh/year, so to replace the typical coal mine you'd need to site 340 4 mw wind turbines. That's 34, 10 turbine windfarms. That's 34 permanent installations that "destroy" the mountaintop, to avoid 1 coal mine that will "clean up and remediate" when it is done and in the meantime employ thousands of local citizens and provide a vast amount of money for the local economy.
That's reason 1. Reason 2 is, that you can't do that either. we are not opening new coal mines, only mining old ones. That means we will be running out of coal here in a few years. So we won't have electricity to power the nice shiny new PHEVs when they get here.
Again, it's unclear why building, maintaining and fuelling coal-fired plants is supposed to create jobs, but building and maintaining renewables is not supposed to create jobs.
Yes, coal mining jobs will disappear. But other jobs will appear. That's what happens in a free market with changing technology.
Oh, and you can't clean up very well after mountaintop removal. The mountain is gone.
PHEV? You mean plug-in electric hybrid vehicle? Well, I'm not interested in those. In the end, using 1,000kg of vehicle to move 1 person will never be as efficient as using 7,000kg of vehicle to move 15 people, or 20,000kg of vehicle to move 60 people. Cars are extraordinarily inefficient, and thus in a resource and energy-constrained future will be restricted to the rich.
because building wind turbines on one mountain requires you to tear down another mountain for fossil fuels to build the turbines. We don't currently posses technology that will make it possible for renewables to be built with renewables.
We don't?
Oh, I guess then the renewables they're building with mostly renewable power in NZ and Portugal don't exist. Pity, that.
Doom, doom, Mad Max, assault rifles and spam, we're all doomed, die off. Yeah, whatever.
Don't put words in my mouth, show me a link about this, I highly doubt copper mining trucks run on renewable energy.
Now I wouldn't want to have to bet our survival on renewables because we haven't seen them scale as much as nuclear power has, but I think this statement is premature.
Most heavy mining equipment can be run on electric power if it isn't allready, and that which cant can be run on fuels generated from renewable/nuclear sources.
Caterpillar to offer electric mining truck in '08
http://www.reuters.com/article/tnBasicIndustries-SP/idUSN2836581020070329
if you run this truck in say norway, which has 100% hydropower, you have what you want. there is no reason a mine can't instal solar panels or wind power.
At least with wind you have mountain tops unlike West Virginia where they are removing most of them and filling up the rivers and the valleys with the burden.
I didn't say it was logical, I said that's why. You are also neglecting the fact that west virginia coal powers 20% of the US grid.
http://www.reddit.com/info/6ps4u/comments/
I think this link
* Smil, V. 2006. "21st century energy: Some sobering thoughts". OECD Observer 258/59: 22-23.
is busted.
I keep reading 20 lbs of solid waste to produce a gallon of ethanol. (Note: I'm Not saying that this is the "Optimal" use for solid waste, however . . . .) As in this project in which the University of Californa is involved:
http://www.dtnprogressivefarmer.com/dtnag/common/link.do?symbolicName=/a...
In 1995 the U.S. generated 200 Million Tons of solid waste. That would produce, maybe, 20 Billion Gallons of ethanol.
That waste surely isn't taken to the dump is it, if you take something away from the plant you deplete the soil, which means you need fertilizers, which are dependent upon fossil fuel inputs..
How is the EROI of wind vs oil calculated?
Is the EROI for wind something like, take the amount of energy gathered over its entire life over the amount of energy used in construction?
Is the EROI for oil something like, take the amount of energy an amount of oil provides over the amount of energy used in its extraction?
If so, oil would have a much quicker lifetime for a barrel of oil than the entire life of a wind turbine, would EROI / time be an issue?
The timescales are similar since wind turbines need to be refurbished after 20 years or so and oil field run out in about the same amount of time. One recalculates the EROEI of the wind farm post refurbishment. It tends to increase with time.
Chris
Today we are consuming energy equivalent to 15 trillion watts or 475 million trillion joules per year.
Before green revolution wheat output was 400 kg/acre/year and with wheat we also get equal amount of straw. Wheat is 3400 calories/kg and straw is 2000 calories/kg. From each acre of wheat we can get 10,752 million joules equal to 256 liters oil or 1.6 barrels. If we have canals we can have two crops each year doubling the output. This is agriculture that is sustainable and practised for thousands of years in asia and africa so we can rely on it without worrying about environment.
If we grow rice we can have three times as much output in kg as wheat though it requires 8 times more water. It is because to grow one kg wheat we need 1.3 cubic meter water but to grow one kg rice we need 3.4 cubic meter water. Rice is 3600 calories/kg and straw is 2000 calories/kg. We get as much straw as rice. We get 28,224 million joules if have one crop each year. That is equal to 4.2 barrels of oil.
Grass is just 15% dry matter when grown but 85% dry matter when it become hay. We can sustainably get 1600 kg hay/acre in one crop. Hay is 2000 calories per kg. Therefore we get 13,440 million joules per acre per year, equal to 2 barrels of oil.
About sugar cane the best figure I found is that before green revolution it was 400 kg sugar which contains 4000 calories/kg. I assume an equal amount of calories from else where (bagass etc). The figure I get is 13,440 million joules as much as we get from an acre of pasture growing grass.
From an orchard of apple we can get 1600 kg fruits per acre along with 400 kg dried leaves (80% dry matter) and 400 kg hay (80% dry matter) growing between trees. Apple is 500 calories/kg, dried leaves and hay is 2000 calories/kg. We get 10,080 million joules/acre/year equal to 1.5 barrels.
At 2 barrels/acre/year we need over 15 billion acres just to replace oil and 37.5 billion acres to replace all human energy use other than food. World area is 37.5 B acres out of which 15 B acres is arable out of which 6 B acres is being used to grow food for humans UNDER GREEN REVOLUTION and rest 9 B acres grow food for wild life.
To people who are wondering why not we grow more rice, rice with yield of 1200 kg/acre/crop we need 4080 cubic meter water per acre/year. At 10" rainfall we get 1000 cubic meters water/acre/year but only 800 cubic meter is used by crops, rest fall in off-season, sucked by ground or get evaporated. Therefore we have to have 50" rainfall to grow that much rice. Infact in india there is a place which get heaviest rain fall in world, 500"/year, the only thing that region can grow is rice. Average rainfall of world is 20" but that include snowfall so most place have to settle down between 10" and 20" rainfall. Below 5" rainfall we get a desert. The average should be taken as 10", low as 5" and high as 20".
Water from canals brought by rivers can also be used. It is typically measured in acre-ft which means one ft water height standing at one acre or 1200 cubic meters/acre. Since water has to be brought from far a part of it get evaporated in the journey so the effective water is 800 cubic meter/acre-ft. Typically rivers in world provide 2 acre-ft water per acre of the plain it is irrigating, some rivers bring as much as 4, some as low as 1.
On average a good land gets 10" of rainfall and 1 acre-ft water per acre meaning 1600 cubic meter water per acre per year. Remember its wise to let half of the river water flow in sea or we get serious environmental issues.
To grow food for one person we need atleast 800 cubic meters water, that is the amount of water brought by average rain fall over planet earth on one acre. If we do get canal water to have an additional crop in winter we get another acre-ft water or 800 cubic meter effective water. So need half acre arable land per person in latter case.
Wind and solar each need $3/watt installed capacity and has capacity factor of 20% therefore to have one watt constant power we need $15 investment in plant installation. world is running at 15 trillion watts so that means $225 trillion. That is 5 times world's annual gdp and 12.5 times world's industrial production. Then there are issues about loss of energy in storage because wind and solar are not necessarily available when we want them.
At 2 barrels/acre/year we need over 15 billion acres just to replace oil
Palm, Jatropha, sugar cane, sweet sorghum will all give 15 barrels/acre. Now what are we down to? 2 Billion Acres?
yeah I'm sure all 15 billion those can grow sugar cane. I've never heard of Jatropha being used for biofuels on a commercial scale, the plants take 3 years to mature I'm pretty sure. Robert Rapier recently went on a trip to India and searched everywhere for jatropha and no one seemed to have heard of it being utilized anywhere. Also, I don't think your number is legitimate anyway. Besides this is just replacing CURRENT CONSUMPTION our society is highly dependent upon increasing prosperity and growth so this is still completely impractical for the long term.
How long does it take to build a refinery? Oh, yeah, it doesn't matter, since we're running out of oil.
Oh, and staring at dormant, unused land is "practical?"
What I found out in India is that "dormant, unused" land was usually that way for a reason. For instance, it was in remote locations with no infrastructure and no access.
who cares? the economy will adjust just like it does every single second of the day. you can grow and reduce your oil consumption.
Oil is not so easily replaceable as you might believe, also techno fixes will not do for this kind of problem as it rely on increasing complexity and diminishing marginal returns. You hit a dead end eventually... To think the economy can adapt indefinitely using the technological solution you advocate and still maintain respect for human life and well being is absurd. Demand destruction isn't a fix, that means hundreds of thousands of people losing jobs and people in the third world starving to death, I would hardly call that doing something about anything...
sure it is. it's as easy as not driving . walking. riding a bike. buying a scooter. buying a higher MPG car. you must have missed the Denmark example yesterday.
yes it is. it's called using less and it works.
and people in the third world starving to death
there is no reason for people to starve to death. anyways you're wrong. it's poor people raising their standards of living that are causing rising prices. most of the starving areas of the world is because of violent governments or irresponsible economic policies. it's the 1st world that needs to adapt. we can get aid to people in need most of the time.
Your completely pulling conjecture out of your arse, yes im sure every starving person in the world brought it all upon themselves. Your completely ignorant of everything outside your techno fantasy land. Demand will become steadily more inelastic to oil prices because people will go for that low hanging fruit until there is none left. We could possibly reach a point where people are massively unemployed and people are riding bikes everywhere, whats the easy fix then. Try buying a more fuel efficient car when you cant find a job...
by blaming governments I'm blaming the people? ok.
why would be buying a car when I didn't have a job? oil is the last thing I'd be worrying about. I'd be worrying how far the bus line will go.
by the way, when people are unemployed they won't need as much oil, problem solved.
Sometimes you actually makes sense, but then sometimes you sound like something out of Garkov.
-----
Demand destruction is not the same thing as replacing something. If you usually eat a hamburger in the afternoon and one day you can't afford it, you don't replace it by not eating anything. Well, of course you can, but you are more likely to eat something cheaper. Problem now is they are running out of hamburgers and the only alternative is Chateaubriand. Now you are hungry.
Cutler, I think in general the leaders of the OECD don't really give a toss about climate change. This is a charade and a sop to the electorate who are by in large incapable of weighing the arguments on climate and energy - as are virtually all politicians. The mixing of a Green climate agenda with energy security is leading to all sorts of confusion and contradiction since I believe most Greens are fairly anti-nuclear - which is our best hope of base load power generation.
I beg to disagree with your comment about the abundance of FF. OECD leaders do pay attention to price, and some even pay attention to trade balance (the Germans and the japanese) whilst other governments have managed to delude themselves into thinking it is possible to run an economy for ever in deficit. Maybe there is a crude awakening for the USA in the pipeline?
France has the largest nuclear fleet in the world - and has virtually no indigenous FF - coincidence? The UK has just announced a massive expansion of wind which has rightly been linked directly to our declining supplies of N Sea oil and gas. Europe as whole is expanding renewable energy, I believe more in response to energy import / security issues than for climate reasons - though the latter has in the past been given as the motive.
Some countries like Denmark have expanded renewables out of a genuine sense of concern for the environment - kudos to them.
The USA with vast coal reserves no doubt will react differently during the current transition - being forced by price which is a symptom of scarcity, albeit consumption rates exceeding extraction rates for FF. So what I'm saying is that you need to look beyond the shores of the USA to get a global picture.
Gordon Brown, the most confused man in the world? On his way to Saudi Arabia to beg for more oil to combat global warming whilst promising a green energy revolution at home founded on nuclear power.
Population data from The United Nations.
>>> Cutler, I think in general the leaders of the OECD don't really give a toss about climate change
Why would they ?
Using standard executive logic so prevalent in board meetings, global warming for OECD will mean
- warmer winters, -> less fuel for heating
- warmer drier summers -> less mass north-south travel during sumer vacation in europe
so it's good, so l et's not worry about CO2 at all, and suddenly coal looks very promising.
And doesn't warmer climate extend the growing season, reaping better results in agriculture ?
What's not to like, never mind polar bears or flooded tropical islands, most of us haven't seen one in out entire life, so we won't miss them when they're gone.
Now if we just could get that message over to the public after all the PR noise we made ...
Ok, I admit, one of my friends is in politcs :-)
Its more than that:
1. You have the prisoners dillema of cutting CO2 emissions. You have to get the entire world to join a cartel who limits CO2 production. Whoever cheats or just doesnt join saves money.
2. Effects of limiting CO2 emissions on climate change mitigation are completely unknown, so getting any kind of cost/benifit analysis is just another branch of fortune telling today. Couple that with wildly unknown discount rates and its impossible to tell if investing in mitigation or reduced emissions strategy makes more sense than dealing with completely unpredictable effects of climate change.
3. Emissions reductions that are affordable are somewhat small, and likely would have an unmeasurable effect on climate change mitigation except on the pocketbook. In order to do anything that we might guess would have a slowing process on climate change we would have to replace all of the worlds coal plants with nuclear just to hold emissions flat, and even that's not going to happen.
We're just going to have to accept that CO2 is going into the air and hope for the best. At least plants like it. Too bad about the carbonic acid levels in the ocean going up though. But some areas will get more rainfall. Of course many glaciers will just dry up. It'll be interesting times.
>> Couple that with wildly unknown discount rates and its impossible to tell if investing in mitigation or reduced >> emissions strategy makes more sense than dealing with completely unpredictable effects of climate change.
Absolutely right.
From the pol's point of view however, CO2 limitation costs are immediate and definitive, whereas costs limiting climate effects (like dam building) are in the future and only probable (but not 100%).
And the pol believes the voter will accept only the most straightforward cause and effect and have no memory/foresight exceeding a few weeks or months at most (he knows broken election promises have no detrimental effect after some time)
I find it hard to blame politicians' logic, given the psychological environment these people live in ...
"never mind polar bears or flooded tropical islands".When the sea begins to invade Wall St or the City of London then maybe the penny will drop.Bit late,though.Take a look at the height above MSL of most of the world's cities.
Of course, but look at the timescales involved.
There will always be somebody (actually the will be many, and they are all experts) who will advise the pol that
- this cost is far in the future, and should be dealt with then
- some future tech (that some acquaintance of aforementioned expert happens to have a company specializing in said tech) will make it far easier to handle than now
- everybody else will have the same problem then, so its no political problem to not have done anything as long as nobody else has.
I guess this is as strange application of the tragedy of the commons principle
This isn't tragedy of the commons, this is standard discounting. If you can quantify your cost and your discount rate, then you can accurately measure how much work you should invest today.
Pity we havent the slightest idea about the costs involved.
I don't think it is such a bad thing that the human race needs to change its focus to live more simply overall. To quote the late great Douglas Adams:
"On the planet Earth, man had always assumed that he was more intelligent than dolphins because he had achieved so much -- the wheel, New York, wars and so on -- whilst all the dolphins had ever done was muck about in the water having a good time. But conversely, the dolphins had always believed that they were far more intelligent than man -- for precisely the same reasons."
Yeah, not having any food is pretty simple.
If we want to survive and not give up and die we need dense energy sources as well as diffuse - ie nuclear as well as solar.
it seems distinctly odd that those ostensibly most concerned about the alleged dangers of nuclear energy seem pretty resigned to mass die-offs due to energy shortage on the grounds that they assume the present population is unsustainable anyway.
I'm not sure who you mean by 'we'. If you mean 'we' as a species, then I think 'we' will certainly survive, albeit with a much smaller population, in the geographies most suitable for post-fossil-fuel sustainable living. Giving up and dying is something an individual does (inevitably), not an entire species.
(Apologies if my posts are somewhat fatalistic - I'm a middle-aged bloke who lives well and has no children, so I take a philosophical view of the situation)
It's the death wish that gets me, and the dichotomy between how dangerous nuclear power is supposed to be, when some of it's sharpest critics say most of us will die of energy shortage anyway.
I am currently less than gruntled that opposition to nuclear power together with gross incompetence in reducing energy use means that in the UK we are likely to have massive power cuts and go without heat.
I'd happily stick my share of the nuclear waste in my back garden, so long as I could stay warm.
In the UK, I think food shortages may be a bigger issue. We import 40% of our food here, and what we grow is very dependent on gas and oil-based fertilizers and pesticides. I also thought that more nuclear power stations had been approved recently.
In any case, look on the bright side - We're a first world nation with well-developed infrastructure, a decent military, good public transport, a long pre-oil/pre-coal history and are an island nation also, so immigration (more likely expulsion) should (in theory) be controllable when TSHTF. Could be worse. Insulate your home and buy some more warm clothing, we're not Canada. :)
Edit - and I'd recommend getting a vasectomy if you haven't already, it makes things much, much easier.
After ten years or so of saying that no nuclear was needed, they have changed their minds and are graciously allowing companies to bid - they turned down an offer from EDF who could actually do the job, as they have delusions about what the sites are worth, and are going to do it on a case by case basis so no economies of scale are possible,
They are also assuming that the present waiting list to order parts is going to disappear, and that the companies won't simply go where terms are more favourable to build plant.
Meanwhile at a cost of around £100bn, may times the cost of a nuclear equivalent, they are pressing on to build 33GW nameplate of off-shore wind, which will actually produce an average of around 10GW per hour - not that most of it will get built, as that cost is quite unaffordable in the straights the UK will be in shortly.
Meanwhile our military instead of doing something like defending our borders so that the people resident are those who are supposed to be here, are that the disposal of America, to lend a thin veneer of international approval to whatever invasion they have in mind - if it is Thursday, it must be Iran.
"giving up and dying is something an individual does(inevitably),not an entire species.
That is semantic splitting of hairs.If enough of a species perish whether bacause of a morale deficiency or sheer stress then a point is reached when there are not sufficient numbers to maintain the viability of the species.There are plenty of examples in the natural world.Many of them courtesy of human activity.
Finally,from your last sentence I think you have a way to go in developing a philosophy to cover what is happening and about to happen in the global situation.It sounds like you have given up.
I disagree - a lower/falling population puts less of a stress on the environment the species exists in. It means more land, water, forest, fish, wildlife and remaining oil-age resources for everyone, as well as less destruction of the existing environment. The global population was relatively static for thousands of years before fossil fuel use, and I can see a return to that sustainable level in the future, assuming the overshoot factor (environmental destruction) is recoverable over time (which I still do).
As for 'given up' - I'm having a great time personally (it would be hard not to). We're still at the peak, and I think knowing it wont last forever makes this time more enjoyable.
Actually, the population peaked and crashed many times in history.
In pre-history we know rather less, and so it may appear more stable if you don't look too close.
In fact though, due to climate change, warfare, new technology etc the population has always swung quite a lot, which is not surprising as animal populations do the same thing.
The garden of Eden was pretty far back!
Dave, you could still argue that there has never been as much potential as there is now, for such a large amount of people to involved in overshoot/die off cycle.
If you are talking about absolute numbers, sure.
However, from what we know of tribes their members did not regard themselves as part of something warm and fuzzy like humanity, but as part of a specific cultural grouping, and countless of those have been utterly wiped out.
The history of animal populations also gives us little confidence that in a 'natural' state longevity of the race as a whole is assured.
In any case, the way the term is used by those advocating 'stability' is to give an entirely false impression of statis, a benign environment where everyone goes from eco-garden to eco-house, age out of mind.
Whilst this is an attractive picture, it in no way corresponds to any actual population dynamics of which we are aware, and is in fact totally misleading, and a gross misrepresentation of reality for a political purpose.
Populations are dynamic and fluctuating, and always will be.
I agree, however I think we could set up communities and societies that are wiser in the way they plan and have children, we will always have ups and downs, we don't have to let them be so dramatic. Look at nature, in a very diverse healthy biosphere there are not dramatic die-offs, these only happen when things get out of balance and that turbulence in the system has to eventually be worked out as the system naturally gravitates towards a state of equilibrium, this is true of nature, basic physics and even gases, Humans don't have to cause such turbidity if they can understand the reasons for it. I am not an ecotechnophile or some reversalist green-thumb idealist hippy, I simply want to survive and make my part of the world a relatively peaceful and happy place.
- "must" and "must"? I think rather "cannot" and "won't".
Interesting graph, figure 14, in that the optimum energy use for the greatest amount of human development seems to be about 500 on that horizontal scale.
I have said, on other occasions, that alternate energy will just be added, where practical, to our overuse of energy. A non-solution which will only make matters worse. (No rebuttal so far.)
Sorry to be picky, there seems to be no clear definition of just what the term 'human development' means. Most of the terms mentioned like adequate food, shelter, safe water, and sanitation as well as disease prevention, to me, imply survival rather than development.
An interesting hypothesis that dovetails neatly with Jevons’s paradox. It certainly applies in my own neck of the woods, where photovoltaics are chiefly used for … garden lamps and walkway lighting.
Now that I have such lamps I don’t know how I managed to live without them all these years ….
I'm just doing my little bit for a greener world.
Thanks, Carolus, hope you are still about . You gave me food for thought there but, now in another area, how are you on demand and desire?
Demand as, I understand it, depends on the ability to pay, on the other hand, when the money runs out for gas for our car, we get to ride on the street car called Desire. (Sorry but I had to do that, though you may think, not.) Anyway both these things have an effect but with desire other than in the context maybe of bloody revolution I do not think much has been said . Do you have thoughts there? Maybe something possibly Buddha-like about ending it:).
BTW I would keep those faery lights I think they would look so nice shinning through the long grass that thanks to 'going green' it is at last socially correct not to bother mowing.
Hi CrystalRadio,
I'm back:
Not in Luxembourg it isn't -- leave your lawn unattended and you are likely to be sued by your neighbours for anti-social behaviour.
Demand:
I think you mean 'effective demand'.
Desire:
ineffective demand.
I blame it all on advertising if I hadn't seen those brochures with the photovoltaic garden lights I wuddent have bought them honest it's not my fault I'm just a victim of my hunter-gatherer genes I guess those lights are a signal to chicks that I can afford to wine them and dine them and am a wannabe alpha male .....
Carolus,
Ineffective demand, I like that, I think that will go mainstream in a big way, very soon!
... well you should see the stuff in my basement, but the only females it attracts are from the order rodentia.
This is from a NY Times article today:
"A variety of new technologies, including multiple lateral wells and microscopic robots swimming through rock pores deep underground, will allow the company to start recovering much more of the oil in its fields, said Mohammed Saggaf, who runs Aramco’s advanced exploration research wing. The company expects to increase the amount of oil it can recover from its fields to 70 percent from 50 percent over the next 20 years, Mr. Saggaf said, adding another 80 billion barrels to reserves."
Is this kind of tech improvement in anyones calculations?
I think the word is "technocopian". They could use the ballpen method of reserve augmentation instead - it worked very well in the 1980s.
To answer your question seriously, I think that few people will want to factor putative improvements such as nanobots into calculations until they have been tried and proven in the field.
david,
I have no idea about the "tiny robots" (been a petroleum geologist for over 30 years) but I'll make a wild guess and say it's a chemical injection used in other fields which can alter the flow characteristics of oil.
Multiple lateral horizontal holes is nothing new. It's generally believed that a major effort ($10 billion)in the late 90's in Gahwar Field used such a technique to reduce water production and stablize oil flow...for a while.
Again, you have to be careful reading too much into recovery figures. I have no doubt of the potential to increase recovery that extra 20%. I've seen similar results in the US. But that last 20% recovery can take 5 times as long to produce as the first 20% and may cost 10X as much to lift that portion. Ultimate recovery has as much to do with how slowly the oil is produced and how long it can be produced at a profit. There is a field in Texas that has produced over 300 million bo (50% to 60% recovery and is still producing after 60 years. Granted it's only doing about 200 bopd now but it could keep producing another 30 years and push the ultimate recovery above 70%. The increased recovery from the Saudi wells wouldn't take that long but you get the idea.
A point that is of course overlooked both by the cornucopians who fall back on the ‘reserves to production ratio’ when the going gets rough and by Hubbertian purists who repeatedly underestimate URR because it either spoils their bell curves or pushes their peaking year too far forward.
BTW, has anybody ever tried to disaggregate oil extraction statistics by price per barrel extracted?
E.G.:
URRs for oil at production price of under $10 per barrel
URRs for oil at production price of under $50 per barrel
URRs for oil at production price of under $100 per barrel
Etc.
hahahahha
now if these are chemical robots more commonly called surfactants - maybe, but if this is the sort of BS the NY Times is spewing you should head out and buy a gun (or more guns as the case might be) and a case of beans today.
As Rockman points out, increasing recovery by way of a great long extended tail does little to solve the immediate production problem.
Had Aramco said "we are now away to develop son of Ghawar" and increase production by 10 mmbpd by 2010 at virtually no cost - then we would not be in trouble. But pipe dreaming about 70% recovery in all but the best parts of Abqaiq and Ghawar and talking about robots swimming through pores is the stuff of utter desperation.
The mad rush into coal, and in poorer, coal-starved countries wood, has a chance of triggering a global warming induced positive feedback loop that favors coal.
Let's assume that there is at least a casual connection between global warming and hurricanes. We get warm enough and there will be a lot less offshore oil production due to hurricanes. If this happens, and leads to even greater reliance on coal, the loop is complete.
An interesting article. Some things I felt were glossed over,
Electricity vs other energy
The transition from wood to coal, oil etc can also be presented as a transition from wood to electricity. The importance of this is that if you say, "we changed to fossil fuels" then running short of them seems disastrous, whereas if you say, "we changed to electricity", then fossil fuels don't seem as important.
Nonetheless, electricity makes up just about 2,000GW of our total 15,500GW of energy use. But I think that 2,000GW is more important than the other 13,500GW for quality of life. As the authour notes, electricity is more versatile than other forms of energy.
How much electricity do we need?
Rather than looking at how much energy we use and then trying to replace a lot of that with electricity, it might have been better to consider how much electricity we need for a decent quality of life. Here's where the electricity/fossil fuels distinction turns out to be important.
I think it's fair to take the HDI as a measure of "quality of life". HDI is the Human Development Index, made up of equal parts:- longevity, as measured by life expectancy at birth; educational attainment, as measured by a combination of adult literacy (two-thirds weight) and the combined gross primary, secondary and tertiary enrolment ratio (one-third weight); and standard of living, as measured by real GDP per capita.
The authour actually presented us with a chart of HDI vs energy use, but titled it "poverty"; it's possible to have an overall HDI at least medium (0.4 to 0.6) and have a lot of poverty - India's a good example. So we have to remember what HDI is, as defined above.
Anyway, when looking at the HDI and seeing how it matches overall energy and electricity consumption, it was found that HDI correlates well with electricity use, but not as well with overall energy use, and reaches 0.8+ at 2,000kWh, and a maximum of 0.9+ at 4,000kWh per capita (Alan D. Pasternak, Global Energy Futures and Human Development: A Framework for Analysis), and a real per capita GDP of $15-20,000. Pasternak found that there was a good correlation between HDI and electricity use up to HDI0.9, but not a good correlation between HDI and all energy use.
That is, having electricity improves your life substantially, but having lots of oil and coal and natural gas doesn't necessarily. Pasternak cautioned that general energy figures were less certain than electricity use figures, which could affect attempts at correlating them, but also noted that, as I said, electricity is quite versatile.
So, HDI reaches "highly developed" at 2,000kWh, and maxes out at 4,000kWh per capita annually. Total energy use is generally constant in developed economies at about 7 times this again.
Would we need to replace fossil fuels with electricity one-for-one?
However, it seems fair to think that in a more purely electrical society, we'd have economies of scale. A train taking hundreds of passengers uses less energy to transport them than all those people in personal vehicles, and trains already exist in large numbers electrified.
It's worth mentioning that already a lot of renewable energy use happening isn't counted. If I put my clothes in an electric drier, I may use 3 or 4kWhr of electricity, and this is counted in energy statistics. If I hang my clothes out to dry, I'm using solar and wind energy to dry them, but it's not counted towards energy statistics. If I turn on the lamp it's counted, if I open the blinds to let the sun in it's not. If I drive to the shops it's counted, if I walk it's not. If I grow tomatoes in a hydroponic setup with fluro lamps the UV energy for photosynthesis is counted, if I put them in a sunny spot in the yard it's not.
So in fact total human energy use is actually much more than 15,500GW. Bearing this in mind helps explain a lot of the reasoning about efficiencies we could manage, since in a society with less or no fossil fuels we'd use more of this energy that never gets counted, and less of the stuff that does get counted.
Then there is simple waste, which according to the US DoE is about 27% of all energy. It's worth noting that any renewable system of solar and wind would be a distributed energy system, with smallish plants scattered everywhere, instead of the One Big Facility both capitalists and communists are so fond of. This will lessen waste in electricity at least, with less transmission losses. And of course electric engines are less wasteful than internal combustion ones, and so on.
All in all, an excellent article, but one which misses a few significant things.
A skeptic might re-write that as follows:
I'm not saying the skeptic is right -- just that distributed energy systems have many downsides. They look better in theory than in practice. There is a kind of 'second-guessing' element about proposals of this kind which sets many people's bullshit detectors ringing. :-)
P.S. Kiashu, the must-read on this topic is:
Sustainable Energy - Without the Hot Air
http://www.withouthotair.com/
If you don't think the sceptic is right, then don't speak for him, let him speak for himself.
I'm interested in responding to what people think, not what people think other people think. Groundless speculation I can manage all by myself, thanks very much!
How much power per capita is sustainable and fair. the Vision in Switzerland (http://www.novatlantis.ch/index.php?id=5&L=1) is the '2000Watt Society' (and less than 1t/a GHG (CO2, CH4, ...)), rw
Electricity is not just more useful but is much much more efficient.
Consider the Gm volt due out in 18 months. It going to get 40 miles of driving on a charge of 8kw hours which is about 8kwh x 3.4mj/kwh = 27.2 MegaJoules.
If you compare this to a car that gets 20MPG and assume that you get ballpark 40 gallons of gas from a barrel of oil. Then you need 2/40 = .025 * 6120 MegaJoules (the amount of energy in a barrel of oil) = 153 MegaJoules of energy to go the same 40 miles. This is a better than 5x improvement. Which means that converting transportation energy source from fossil in the form of ICE to electric motors plus battery yield about a 5x improvement. Which brings the total amount of electric to be produced way way down and to a very manageable number. I did the calcs on another thread, which show that replacing the entire US car fleet with electric vehicles along the lines of a GM Volt will require about 100 GW of new power plants at a cost of under $200 billion (current nuke price quotes) Plant Operating cost are around 2 cents per KWH of which about 1/2 cent per KWH is fuel.
umm... you're neglecting the other products in the oil, why wouldn't you just use the energy in the gasoline? 121 MJ/US gallon
So you're actually at 242 MJ for the trip. You HAVE however, failed to include the original source of the electricity. Which in the case of coal power plants is roughly 33%, so the energy input to the volt trip is really more like 80 mj if you're getting your electricity from coal. it's closer to 55 if you're getting your energy from natural gas, and it's irrelevant if it's wind nuclear or hydro.
That of course is neglecting transmission losses which can be as much as 50% in some cases for rural locations far from power stations.
Beware of simple analysis :)
Fordprefect,
Your inclusion of the losses used to generate electricity are not relevant, what is being said is that a Kwh of electricity is a lot more useful than the energy equivalent of oil or coal or gasoline.
What is relevant is the question:if many economies can have a high living standard using 4,000 kwh/year/capita, how much more electricity would be needed to replace the x7 additional energy of fossil fuels?. Clearly could use a lot less than 4,000x7 kwh, for PHEV would need 1000kwh/year/driver so perhaps 700 kwh/person. Likewise for replacing NG used for hot water and space heating, electric heat pumps can generate X3-4 as many Kj's as burning NG.
Since the US uses about 11,000 kwh/person/year, with better conservation this would could probably be enough to replace most oil and NG used directly. The problem then is how will the present electricity production be maintained in the future without large amounts of coal and NG. As neither of these are running out in the immediate future, there is time to transition to using wind, solar, tidal and nuclear to replace what electricity is presently generated by coal and NG. Only air travel doesn't seem possible to use electricity.
People may be reluctant to replace NG and oil with electric solutions, but realistically what choice are we going to have? If the US is unable to generate more electricity by solar, wind or nuclear, then its citizens will have to accept the inconveniences of rationing, black-out etc.
Neil,
Why do you believe that people will be reluctant to replace fossil with electric solutions? I would think it would be the other way in the US as people are given a chance to remove the dependence on foreign oil.
Thanks for your analysis.
Hi david_in_ct,
I think you made an excellent point about what it would take to replace FF with electricity. The reason I think that people will be reluctant to for instance replace gas heat with electric heat pumps is that this involves additional capital outlay. Electricity distributors or governments could help with loans and incentives to add extra insulation so that costs of using electricity would actually be lower. Similarly for replacing gasoline powered cars with BEV or PHEV's( when available), although if gasoline prices double a few more times the problem will be availability and car manufacturing capacity to meet demand.
Hi Neil,
I don't really think you need gas prices to increase at all from here to have a stampede in electric vehicles as they become available. The economics alone would be enough to put people into. Throw in the huge emotional plus of being able to wave goodbye to OPEC et al, and you are correct in assume the problem will be manufacturing capability. Toyota can not make Prius fast enough. Even with deep recession levels of car sales in the US there is at least a one month delay if you walk into a Toyota dealer and want to buy a Prius. The next gen of serial hybrids is going to be way better as for many folk they will never have to go to a gas station. McCain has already on record for a $5000 tax credit to buyers of EVs. I think the biggest surprise is going to be the speed which with this unfolds. There are tens of billions of profit dollars on the table for the car companies in this race and they are on a wartime R&D/production footing to get this done. If you are the CEO of a car company and can't see this coming you are going out of business.
If you are an oil kingdom wondering how to expand your indoor ski slope, you are going to wake up one day and wonder just how the hell you went from top of the world to irrelevant in such short order.
The point of the original post was to show how enormous was the problem of replacing fossil fuels with renewables because of the vast amount of energy currently derived from fossil fuels. The point of my post was to show that in moving away from fossil fuels and working with electric then actual amount of energy needed to perform the same task would diminish greatly. Sorry this wasn't clear to you, though from the tone of your writing it would appear that you are someone who feels that they know just about everything that there is to be known so I am surprised you missed it.
Touchy aren' cha'? I was just pointing out that in some cases, the savings in the conversion are not as big as your analysis would indicate. When you state that "electricity is more efficient" and then fail to account for the efficiency of electrical generation, I am sorry, but I have trouble not pointing out the error, because it is large. It is also a point that if you're discussing "how enormous was the problem of replacing fossil fuels with renewables" suggesting a switch to electricals is rather pointless if the electricity is coal generated, this point is in fact quite critical to any renewables analysis. Now, you may take a correction of the math as an expression of omniscience if you like, but it wasn't intended to be.
"switch to electricals is rather pointless if the electricity is coal generated, this point is in fact quite critical to any renewables analysis."
If you switch to renewables (or nuclear which is certainly preferred because of the price and relative ease of engineering) then calculating the efficiency of electricity production from coal, or oil, or natgas is about as relevant as calculating it from draft animals. The idea is not to use them so who cares whether they are efficient or not. What is critical is to figure out how much electrical energy is necessary to perform a similar task as is currently performed with fossil fuels, then figure out how much generating capacity you will need to produce this. The way not to do this is to assume that the task has an inherent energy requirement as measured by its current fossil fuel consumption and then to convert this energy number into an electrical equivalent.
Since EV's use around 250-300watts/mile, there is every point in switching to EV's even if all the electricity were generated by coal - they are much more efficient than ICE cars.
Conspicuous in it's absense is wave power, which has much higher energy flux than wind or solar. Near shore flux is around 50kW per metre of wave front, and much much larger in deeper water, from the atlantic swell for instance, the main problem here is practicality and survivability. The range of energies wave devices must survive is large.
Interesting. I don't know much about wave power. Obviously it is scalable - how quickly can it be undertaken? And wouldn't transmission lines be the limiting variable to other than coastal cities?
The thing about renewables is that they are very location-specific.
There are plenty of wind-turbines built where it is not windy enough, due to subsidies.
You can get some power from waves, and is the costs are right then it could be very handy, but even leaving aside transmission lines you can't provide all the power you need for an industrial society with it.
For base load at a really substantial scale low-fossil fuel energy sources are spelt nuclear.
Anyway, here is a British wave power experiment - several different generating devices are going to provide power to a central hub, so a lot should be known about their potentials in a couple of years:
http://media.cleantech.com/1800/uk-plugs-into-wave-hub
UK plugs into Wave Hub | Cleantech.com
I see what you mean but I can't help to say it: Are non-renewables less location-specific? Tell me please how to drill a hole in my backyard so I can get rich fast.
Nuclear power is far less location specific.
The plant will work much the same whether it is built somewhere hot or cold, and the output will be similar although not identical.
This in turn means that research is universally applicable, so that progress is absolute.
Don't be fooled by the alleged figures for nuclear research - the vast majority of that is weapons research disguised, and the fusion research which eats the lions share of the remaining is a work-program for physicists, which major interests like the coal industry are quite happy about because it will never produce power.
Civil research in nuclear power has been minimal, with most of the best ideas killed.
None of this means that great things are not to be expected of some renewables, solar in hot areas where that constitutes most of the power demand, and so on.
However care must be taken, as many just ignore the regional and local characteristics of renewables, and likely cost profiles, in an ideological drive to avoid the use of nuclear power.
This leads to the most absurd schemes, and siting power sources at vast cost where they are totally inappropriate.
You don't hear much about it because no-one has yet made it work commercially. There's a project off Portugal that looks promising but is running behind.
There are quite a few technical obstacles. Salt water's very corrosive, tends to gum up joints and so on.
I mean, in principle it's great, but in practice it's technically difficult, quite an engineering problem.
Transmission losses aren't a huge issue - a significant portion of the world's population lives on the coastline anyway. Even if we could make it work perfectly it wouldn't provide 100% of our energy needs, let alone our energy demands, but of course nothing can alone.
There are a few semi-serious few MW demo plants being developed. If these demonstrate economic feasibility then scaleup can begin. I suspect it will take several years of successful operation to convincing demonstrate it (assuming at least one of the current techs does work out).
I just could not resist putting this up. I have to admit I chuckled when I read it. take that doomers!
http://news.yahoo.com/s/nm/20080701/us_nm/walmart_produce_dc_1
lol
yeah. The thing that many doomsters anti-big-corporation-activists forget is that these monsters are way more adaptive than the little guys down there. Not the perfect world I'd rather live, but failing to realize this is ridiculous.
Okay so when do they start their home delivery service ... I wonder if we will be able to get all the way back to mail order department stores before the wheels wholly come off the wagon and the Goths Vandals and Visigoths arrive to make things another kind of 'really perfect'?
So? I have no problem selling them asparagus, garlic, or specialty fruits I produce for a FAIR PRICE. So when is Wal-Mart going to buy electronics, clothes, shoes, and appliances produced locally?
"So when is Wal-Mart going to buy electronics, clothes, shoes, and appliances produced locally?"
when they have to and when the costs are in line.
The ongoing fall of the dollar will bring back Wal-Marts 'buy American' policy. If you look at how fast the dollar is falling against the Renminbi, that's not going to happen for years. If you look at how fast the dollar is falling against the Euro, that's not going to happen for months.
Hmm, are web designers and service industry professionals going to be that useful? Won't they take up a lot of aisle space?
I thought the point I was trying to make in the above post that America has lost it’s manufacturing capability was so obvious that I did not have to state it outright. Once gone these industries are very difficult to get back especially since the people operating these industries are long gone. Moving back factories is costly., as is retraining, especially when institutional memory from such industries is lost. Could take twenty years at least in the best of circumstances, if it could be done at all.
how do we have record exports then?
Yep, till then the aisles may suffer. What else we got to sell that's local? (I wasn't disagreeing, in other words, just expanding upon a local Wal*Mart fantasy.)
You may be shocked at the outcome of a WalMart purchasing negotiation. I understand they expect their suppliers to be fairly "competitive" in price.
Yay! were saved, problem solved!!!
I would love to see the EROEI chart extended to cover: sugar cane ethanol, sorghum ethanol, jatrpha biodiesel, palm kernel biodiesel, switchgrass ethanol, grass and horses, and soy biodiesel.
To learn more about solar power and the future of renewable energy in america go to www.globalsolarcenter.com