World Oil Production Peaked in 2008
Posted by ace on March 17, 2009 - 9:15am
As everyone knows, there is never a post on The Oil Drum that the entire staff agrees on. Nonetheless, Tony bases his findings on solid research, and a staff survey shows that most agree with a 2008 peak. A post discussing whether an alternate scenario with a second later peak might be feasible is planned for later.
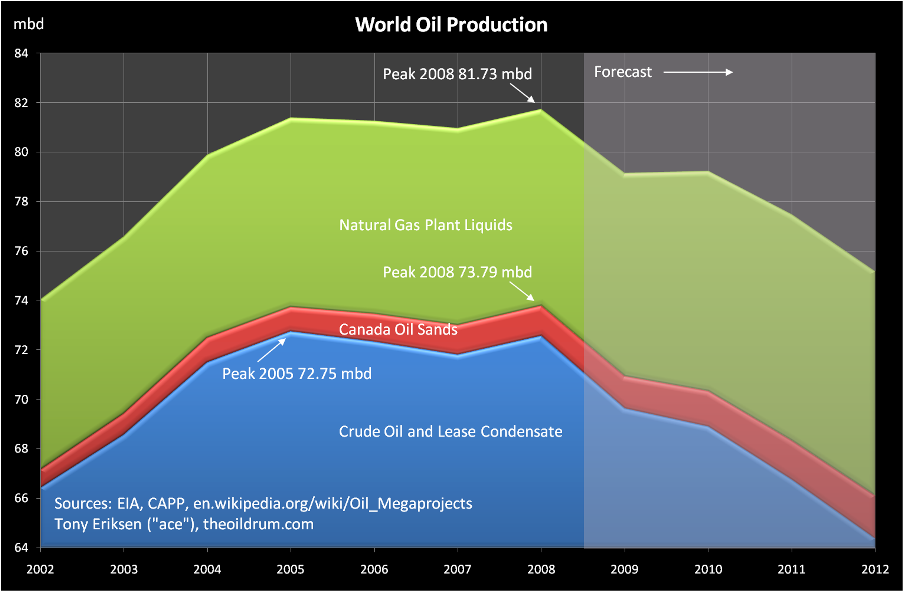
World oil production peaked in 2008 at 81.73 million barrels/day (mbd) shown in the chart below. This oil definition includes crude oil, lease condensate, oil sands and natural gas plant liquids. If natural gas plant liquids are excluded, then the production peak remains in 2008 but at 73.79 mbd. However, if oil sands are also excluded then crude oil and lease condensate production peaked in 2005 at 72.75 mbd.
The US Energy Information Administration (EIA) and the International Energy Agency (IEA) should make official statements about declining world oil production to renew the focus on oil conservation and alternative energy sources.
![]()
World Oil Production
Both natural gas plant liquids and Canada oil sands production are expected to grow over the near term. Much of the growth of natural gas plant liquids comes from OPEC. Non OPEC oil production peaked in 2004 and is forecast to decline at a faster rate in 2009 and beyond due mainly to big declines from Russia, Norway, the UK and Mexico. OPEC has the ability to increase production later this year and in early 2010. Although key OPEC producer Saudi Arabia peaked in 2005, it probably has sustainable annual surplus capacity of 1 mbd. Iraq and possibly Nigeria also have potential to increase production but these countries continue to have serious internal conflicts. By the time 2011 arrives, OPEC will not have the ability to offset cumulative non OPEC declines and world oil production is forecast to stay below its 2008 peak.
The forecast assumes that prices will rise, causing OPEC to produce more oil which explains why the 2010 forecast is slightly greater than that in 2009. If world oil demand drops further, OPEC might not increase production causing 2010 production to be lower than 2009. It is also assumed that OPEC complies with 85% of cumulative announced cuts of 4.2 mbd. This compliance is assumed from March to June of 2009. At the March 15 OPEC meeting, no additional cuts were announced, there was 80% compliance to cumulative cuts in February and full compliance remains the target by May which would reduce OPEC-11 production by another 0.8 mbd.
My forecasting method aggregates forecasts from all oil producing countries, taking into account forecast field production profiles from existing and new oil projects. Colin Campbell uses a similar forecasting method but does not directly take into account the timing of new oil projects. Nevertheless, as peak oil has passed, new oil projects can only serve to slow the production decline rate. Consequently, Campbell has also stated that peak oil was in 2008, excluding bio-fuels. Another method used to estimate the peak production year is to use this oil project database to derive totals of future annual supply additions. As these additions are insufficient to offset future existing field decline, this indicates that oil production peaked in 2008, excluding bio-fuels.
Another similar forecast which incorporates forecast production profiles from giant oil fields is Fredrik Robelius' worst case scenario from his 2007 thesis. He used actual production data to 2005 and said that "the worst case scenario peaks at just above 83 mbd in 2008", excluding bio-fuels. This scenario has closely tracked actual data since 2005 and assumes a 7% annual decline rate for production from existing non giant oil fields as at the end of 2005, delays of many large projects and low recoverable oil reserves for some giant oil fields. There are just over 500 giant oil fields in the world, each with at least 500 million barrels recoverable oil. More support is provided for his worst case scenario as Robelius' original forecast for deepwater production was for a peak of almost 9 mbd in 2012. Now it appears that deepwater production entered a 7 mbd peak plateau in 2008 due partly to decline rates as high as 20% per year from mature deepwater oil fields.
Peak oil production often occurs when about half of the initial recoverable oil reserves are produced. In the US, production from the lower 48 states peaked in 1970 when 52% of the oil reserves were produced. In this forecast of crude and condensate, the peak production occurred in 2005 which coincidentally happened when 52% of world crude and condensate reserves were produced. If Campbell's world reserves estimates are used then 49% of world oil reserves would have been produced in 2005. The discovery of future oil reserves will decrease these percentages and will also help to slow the production decline rate.
![]()
World Liquids Production
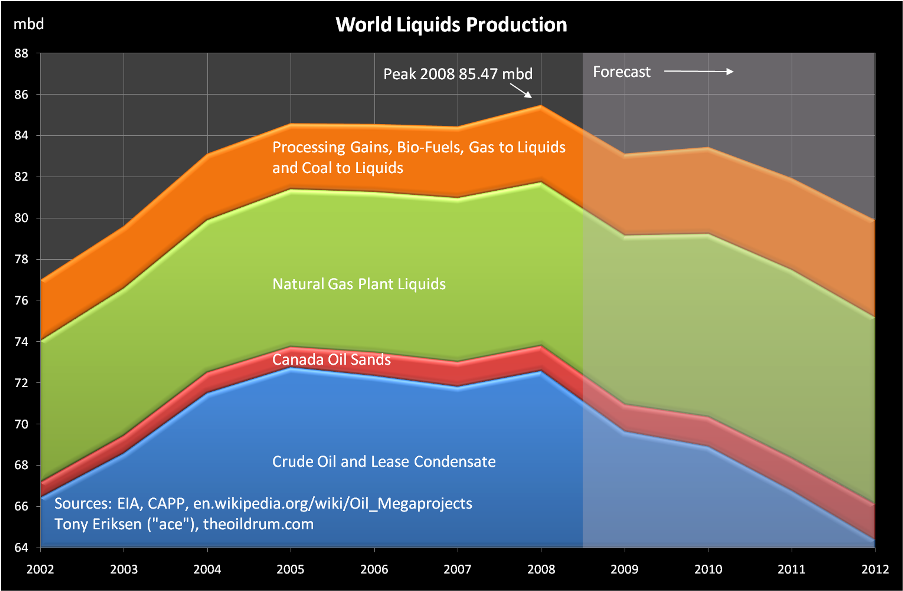
The definition of oil used by the International Energy Agency (IEA) also includes bio-fuels, processing gains and other liquids derived from natural gas and coal. Although bio-fuels production has been growing exponentially, world liquids production has probably passed peak in 2008 at 85.47 mbd as shown below. In 2008, US ethanol production was 0.6 mbd, Brazilian ethanol production was 0.4 mbd, and bio-fuels production outside the US and Brazil was 0.5 mbd.
Processing gains arise at refineries when crude oil is processed into products which have a lower density causing an increase in volume when measured in barrels. Processing gains are proportional to the volume of the crude oil inputs. In 2008, the IEA estimated that processing gains were 2.2 mbd, excluding gains from China and non-OECD Europe. As crude oil and condensate peaked in 2005, it is expected that future contributions from processing gains will decrease.
Production from gas to liquids (GTL) and coal to liquids (CTL) has been increasing but from a very small base and remains negligible. GTL is about 0.10 mbd in 2009 and is expected to increase to 0.27 mbd by the end of 2012. CTL is about 0.20 mbd in 2009 and should increase only marginally by the end of 2012. Liquids production from GTL and CTL has significant energy losses and high carbon dioxide emissions implying that it is probably preferable to directly burn the gas and coal to produce electricity.
As production from bio-fuels, oil sands and natural gas plant liquids increase there is a slight chance that world liquids production in 2010 might be close to its 2008 peak. However, given the suspension of many crude oil and oil sands projects, it is likely that future world liquids production will stay below its 2008 peak and that the world urgently needs to adopt policies to reduce consumption and focus on alternative energy sources.
In contrast, the IEA WEO 2008 forecasts that total liquids production will increase steadily to 106.4 mbd in 2030, excluding bio-fuels. Similarly, the ExxonMobil Energy Outlook 2008 forecasts total liquids to be 108 mbd by 2030, including bio-fuels. Even these two forecasts have now been cast in doubt as Cambridge Energy Research Associates (CERA) have stated this month that, due mainly to the credit crisis and low oil prices causing significant oil project delays, world liquids production could be reduced by almost 8 mbd in five years. In five years, the production forecasts of both IEA and ExxonMobil indicate 93 mbd, including bio-fuels. Consequently, both of these forecasts are now revised down to 85 mbd in five years, adjusted for CERA's supply reduction, which is less than the 2008 peak.
As the production forecasts by the IEA and ExxonMobil are primarily demand derived forecasts, rather than supply based, it is only a matter of time until the IEA and ExxonMobil, as well as CERA, admit that world liquids production peaked in 2008. OPEC also uses a demand derived forecast which predicted total liquids production of 117.6 mbd in 2030 in their World Oil Outlook 2007 which stated the underlying logic on page 24:
A central tenet of the OPEC long-term supply perspective assessment is that resources are sufficient to meet future demand. The resource base, as defined by estimates from the US Geological Survey (USGS) of ultimately recoverable reserves (URR), does not constitute a constraint to supplying the rising levels of oil demanded in the reference case...so supply projections are, by definition, plausible from the resource perspective.
In other words, first, OPEC forecasts the future oil demand to 2030 based on a 3.5% annual economic growth rate and second, assumes that future oil production will be equal to the demand because of the huge increase in the world reserve base suggested by this USGS World Petroleum Assessment 2000 report. In Jean Laherrere's analysis, he said that this USGS report was misleading and that the USGS claimed reserves growth was excessive. Similarly, Colin Campbell stated in his response that it "is ironic that OPEC puts out excessive numbers to discourage western investments in renewables, energy saving etc, and the US does the same thing to try to undermine OPEC's confidence."
![]()
![]()
Life after Peak Oil
As oil production declines, consumption must also decline. Consequently, action must be taken to reduce oil consumption and switch to alternative energy sources such as electricity from the wind and the sun. This recent Oil Drum story proposes many oil conservation ideas for individuals such as moving to a walkable neighbourhood and trading in your car for one with better mileage.
The IEA has recently published some recommendations to improve energy efficiency which apply not just to individuals but also to industry. For example, in the transport sector, the IEA is encouraging the use of fuel efficient tires and introducing mandatory fuel efficiency standards for light duty vehicles. In addition, this IEA document, called Energy Efficiency Policy, also encourages energy efficiency by providing links to almost 30 documents containing energy efficiency policies. One of these documents called Saving Oil in a Hurry suggests many conservation actions including increased use of public transit, car-pooling, telecommuting and speed limit restrictions. For further information, the IEA has its own energy efficiency web page.
If there are sudden future oil supply shortages due to events such as natural disasters or acts of terrorism, the IEA has a rationing agreement which applies only to IEA OECD member countries. As there is no global energy agency, non OECD countries such as China and India do not have to comply with the IEA rationing method. The IEA has been encouraging China and India to become members but this is highly unlikely until the IEA's rationing method is based upon oil consumption by person rather than by country.
The map below shows oil consumption per person in 2007 and also indicates the high consumption per person of the oil importing country USA. In 2007, the USA consumed twelve times more oil per person than China and in 2008, using recent data, this ratio was just under eleven. In 2009, USA consumption is forecast to fall further while China's consumption is forecast to increase, according to EIA forecasts. This implies that the USA will consume just over ten times more oil per person than China in 2009.
![]()
As oil production declines, countries such as India and China will probably increase focus on ensuring their own future oil supplies. India now has the world's largest refinery complex, ahead of Venezuela, which can process heavy sour crude oil. China has been taking advantage of low oil prices and credit constraints to secure future oil supplies from Russia, Venezuela and Iran. Once global economic growth returns causing increased oil demand, there is a risk that oil importing countries could act aggressively for their own self interests rather than cooperating to manage oil consumption in the context of declining world oil production.
Contact
- Content: editors at theoildrum dot com
- Tech support: support at theoildrum dot com
License

This work is licensed under a Creative Commons Attribution-Share Alike 3.0 United States License.
Am I correct in understanding that NGPL mostly goes for Propane (LPG), along with the top fraction from crude oil refining? If this is so, then am I also correct in concluding that it appears that the supply outlook for Propane, at least in the short term, is actually improving?
Another question: If my above assumption is correct that NGPL mostly goes for Propane, then given that Propane mostly functions as a substitute for NG, is it really meaningful to include it in with the other liquids discussed above? Is this not, perhaps, a case of apples and oranges?
I'm not sure about the relative fraction of butane vs. propane, but butane is slightly heavier, and it can be blended into winter gasoline. It can be counted towards liquid fuel supplies.
No real argument from me, although I think that the key point is that crude production basically stopped growing in 2005, with a cumulative shortfall between what we would have produced at either the 5/05 rate or the 2005 average annual rate, relative to what we actually produced (EIA, C+C).
And as I have pointed out, IMO, Deffeyes basically nailed it. Despite an erroneous observation regarding 2000, he never backed away from what his model showed, a world crude peak from 2004 to 2008, most likely in 2005. And note that Deffeyes was modeling conventional production. His point was the unconventional production would just slow the rate of decline in total production.
As I have also noted, based on the logistic (HL) models, the world was to 2005, as the North Sea was to 1999 as the Lower 48 was to 1970 (conventional reserves approximately 50% depleted in all three cases). It's interesting to look at the initial three year decline rates in all three cases:
Lower US 48 (EIA, C+C):
1970 to 1973 Decline Rate: -1.4%/year
(It would take 51 years to fall by 50%)
1973 to 1979 Decline Rate: -3.9%/year
(It would take less than 19 years to fall by 50%)
Average annual US crude oil prices increased at about +15%/year from 1970 to 1979 (and at about +21%/year from 1970 to 1981, going up ten-fold in 11 years), i.e., higher crude prices, less crude production.
North Sea (EIA, C+C):
1999 to 2002 Decline Rate: -0.9%/year
(It would take 80 years to fall by 50%)
2002 to 2008 Decline Rate: -6.7%/year
(It would take less than 11 years to fall by 50%)
Average annual Brent crude prices increased at about +19%/year from 1999 to 2008, i.e., higher crude prices, less crude production.
World (EIA, C+C)
The 2008 average annual crude rate--subject to revision, generally downward--is basically flat with the 2005 rate, well within any reasonable margin or error, with 2006 and 2007 being below the 2005 rate.
If the world had maintained the 2005 rate of 73.7 mpbd, we would have produced 80.7 Gb from 2006 to 2008, inclusive. The EIA shows cumulative production over this time period of 80.3 Gb.
Average annual oil prices almost doubled from 2005 to 2008, i.e., higher crude prices, less crude production.
I suspect that the key difference between the post-2005 world data and the post-1970 Lower 48 and post-1999 North Sea data is that the world is getting some contribution from unconventional production.
Mathematically, world conventional production is to 2009 as the North Sea was to 2003 and as the Lower 48 was to 1974. 2003 was the beginning of the more rapid North Sea decline, as was 1974 for the Lower 48. It's possible that the decline in demand may be masking a more rapid decline in world crude production.
In any case, IMO the "When did we peak?" argument is increasingly irrelevant. With a collection of very old giant oil fields heading to where the East Texas Field is now (99% water cut), and with high underlying decline rates from existing wells, combined with declining investments in oil production, I think that it is unlikely that the world will ever produce 74 mbpd or more of crude oil on an annual average basis in future years.
Another chance for me to rail against comparing, adding and etc. things that are different. Why do analysts insist on putting oil sands and such output in the Peak Oil argument? Can't do that.
Peak Oil was and still is about conventional oil production. It is the decline and eventual end of oil that Hubbert and the rest like Deffeyes were worried about. It is conventional oil that has had the high return for decades. While other output may be similar, the yield and method of extraction is different enough to be excluded.
No insight is gained by mixing these oil resources. All it does is obfuscate and confuse. Could that be the reason it is done?
Let each form of liquid fuel, or any other fuel for that matter, stand on its merits or demerits. Logic requires it. Befuddled thinkers who compare, add, subtract and etc. things that are different add nothing to understanding. They do not understand basic principles of logic.
There are some things in mathematics one can not do like divide by zero. Logic has rules too and one of them is that things that are different can not be added etc.. If they are anyway the result is silly nonsense.
Like everything in life, I don't think there is one correct way to look at this situation. You keep trying to assert that your way is the "best" way and other peoples' way is the "wrong" way.
Points of view are like tools in a toolbox. Use the one best for the job.
Point of View 1
Group all liquids because ultimately it's the aggregate that's important to our end uses. This works because the liquids, with some time and effort, are often interchangeable to the machines that run them (or you can change the machine). This is a more strategic view.
Point of View 2
Distinguish the liquids to gain a better understanding of the immediate situation so that short-term decisions can be made, like "will we have a shortage of home heating oil this winter?' etc. This can often benefit tactical choices.
If you have a different way to look at things, I request that you simply say something like, "The benefit of the author's point of view is x but if you look at it from a different point of view, which I'll describe in a moment, the benefit is y."
The benefit of approaching discussions this way is that, If everyone were to do this, we wouldn't keep getting into these endless "he's wrong and I'm right!" battles here.
i don't think x is trying to start an argument.
it is not wrong to project "peak liquids". In fact, it is vitally important.
however, the article purports to be on peak oil, which it is not, in fact.
"liquids" is frustrating because it is obfuscating. those who have studied enough know the vast difference between "liquids which possess potential chemical energy" and "crude oil" understand that to oh ummm probably 99.2ish percent of the population its all the same. (But the shape of the graphs the two terms produce are not).
yeah, x. i'm with ya.
The problem with x is that he/she says you can't compare apples and oranges (different liquids), but that you also can't count fruit (EROEI).
Can't have it both ways.
Cheers
Leaving aside x's intent (I have no idea what it is) my point is that "there is no one and true and correct point of view usable in all situations" and x keeps asserting that the way people are using liquids can't be done and that his/her way is the "correct way."
There is no "correct" way to view the topic -- there are just ways that give different results depending on what the goal is.
Each point of view has value because it is able to show something that is hidden when using a different point of view.
In the diagram a. below, can you see the orange dot? Of course not, but change the background (the point of view, or filter, if you wish) and the dot becomes visible as in b.
The point of view x is advocating has perfectly good uses but is not as effective when using a different filter of goals and understanding. Same with the point of view he is asserting is "illogical" or "silly nonsense."
If you want a well-rounded understanding of a topic, gather as many points of view as you can. Each one will expand your understanding because each one reveals something unable to be seen by the others.
In this particular case, it is pretty clear to me that x is unable to see what other people are seeing. Does that make him/her a bad person or stupid? Not at all. But if he/she keeps insisting that his/her view is the only one worth examining, it does make him/her in the very least dogmatic and positional. It also turns the conversation from an exploration into a battle in which there must be a winner and a loser.
To be fair to x, your position stated above is just as dogmatic and positional. What is it they say, not making a choice is a choice? I often enjoy your posts, but sometimes I scroll right through them because they are filled with New Agey, nobody's wrong, everybody's right stuff like the above. (And I was very much of that sort of mind in the past, and it still informs my thinking.)
The obvious problem is that sometimes there is *one* best answer, and to say that isn't true is simply false so we need to be just as aware of the possibility there is only one answer as we are that it is *usually* best to take all views into account.
That said, I don't think EROEI is one of those cases where x is right.
Cheers
I assert that "right" and "wrong" exist only in language and are convenient labels. What you call "right" someone else calls "wrong" so clearly their usage depends on the context in which they are used. If it were not so, there would be no disagreements about what is "right" and what is "wrong."
Call it New Agey if you if you'd like, but it's actually epistemology, or at least that's my point of view.
;-)
It's claptrap when you take it that far, Aangel.
Murder is bad. Very few disagree, and those few are murderers.
C'mon... If you can't accept the shortcomings of your stance, you are being nothing more than dogmatic.
You keep referring back to what language is and isn't. I think you sometimes forget that the medium isn't the message, but that the medium we have is the way the message gets transmitted, which means the medium actually is a large portion of the message.
There's not much value in getting too "cute" with this stuff as you lose the real medium: the audience.
Just an observation from someone who makes their living working in the language.
Cheers
But even 'conventional oil' can be broken down into categories like onshore, offshore/deep sea/polar with different cost structures/margins/etc.
All these different sources of energy have different EROI, what's clear is that we are transitioning to an era where the cheapest most easily available energy has gone and as a consequence an increasingly greater chunk of civilisations resources will have to go to maintain base supply -let alone grow it.
And since the renewables/alternatives are 'priced' in energy units (steel, copper, silicon, etc.) as this base price creeps up so will the price of these alternatives resulting in the conclusion that they will never be a cheaper substitute when viewed on a short term basis. The main difference however is that the ongoing source of energy supplied by the renewable group once created is of course effectively limitless within the confines of our needs.
Nick.
"The main difference however is that the ongoing source of energy supplied by the renewable group once created is of course effectively limitless within the confines of our needs."
Assuming our needs are modest, that may be true. However, one should not assume that renewable resources are unlimited. Even renewable resources will be unsustainable if they are consumed above their renewal rate, above the rate that doesn't adversely impact the biosphere, or in a way that damages our environment.
Even renewables have a significant non renewable aspect. The resources required to build and service the renewables' physical plants, storage facilities and shipping/transmission facilities are not renenwable and are not equally abundant or accessible. Energy availability is only part of the equation as we start to hook up the rest of humanity.
Those are usually renewable as well. Some hydroelectricity, some aluminum source (recycled or not) = Transmission wires and more.
Steel is very recyclable, and several energy sources can be used.
Concrete is less recyclable.
Alan
"There are some things in mathematics one can not do like divide by zero. Logic has rules too and one of them is that things that are different can not be added etc.. If they are anyway the result is silly nonsense."
EROEI- If it costs a barrel to pull a barrel why pull the
barrel?
You could convert wind to oil and carry on using ICE vehicles without needing batteries to use wind for transport?
Agreed. Nevertheless, it can be argued that without hurricane Katrina in 2005 and without the olympic games in China in 2008, the monthly peak could have well been in December 2005.
Unfortunatley, our politicians still cling to the wording of the IEA WEO 2008 which says that oil production will not peak before 2030. The international energy agencies and many government departments around the world will have to take a great part of the blame for the financial crisis and the global recession. Had Colin Campbell's warnings
The World's Endowment of Conventional Oil and its Depletion
by C.J.Campbell
© January, 1996
http://www.hubbertpeak.com/Campbell/cen21.htm
been heeded and had governments officially forwarded these warnings to banks, they would have been more prudent in their investments like airport expansions, toll-roads, car-dependent subdivisions etc.
As the peak becomes more visible in the next years, the public will ask questions about OPEC's oil reserves and when the confidence in these and all other reserves will vanish, oil hoarding will start and international oil markets are likley to freeze up like credit markets now. This may happen in the timeframe of 2013-2015.
Those who in the past tried to deny peak oil in an attempt to avoid panic on their watch will bitterly regret it because if we had had an earlier confidence crisis on oil reserves, more of the oil thoughtlessly consumed since then could have been used more wisely, e.g to build up electric rail to replace oil based transport. These projects may get stuck in diesel shortages later.
It is easy to calculate that for every month the world is saving, say, 3 mb/d crunch time is delayed by 1 day.
Look peak oil itself is not important. The pricing around the peak will depend on supply and demand for several years before and after the peak the difference between peak and the current production levels will be less than 2mbd or well within the error margins and also well within what we could easily reduce consumption with a small amount of belt tightening if needed.
So peak does not matte much and even the two years before and after peak don't matter all that much.
What matters is given our ability to add production and the decline rates and decent estimate of the rate of demand change when we are down 4mbd vs demand. Once this happens we are probably permanently in and era of expensive oil. Further declines in oil output may make a bad situation worse but they don't change the intrinsic game we will never see cheap oil with a fully functioning economy again.
Now only with that argument thus this supposed peak in 2008 matter. If the real peak was in 2005 and 2008 was a result of some shifty accounting practices then we are not in the second year just past peak we are further out in year 4.
Now this is important and I suggest you can readily remove the so called peak in 2008 and justify everything that happened including all of 2008. The only small requirement is a short term surge from KSA from unsustainable sources of about 50 million barrels of oil up to at most 80 million barrels. Barely a days supply of excess oil added as the economy was crashing and the ability of the US to import oil was crippled by hurricanes. There certainly was and unmistakable and real short term surge in exports from KSA.
With that one single exception you can go back and look at the real situation assuming a peak in 2005. If the true sustainable and reasonably accurate peak was back in 2005 and if declining producers padded their numbers into 2008 then we probably did do what one would have expected and seen continued steady overall declines from peak since 2005.
Further more there is good reason to expect the base decline rate to accelerate probably in 2008 we where down 2-3mbd 2009 will probably see overall production fall further by 4mbd thus if we really peaked in 2005 by the end of 2009 production will have declined to the point that peak is unmistakable and even if OPEC is holding back some supply bringing it online on 2010 will only serve to slow the decline rate not cause a secondary plateau. Further out the current pullback in drilling becomes a real issue as supply still cant be brought online fast enough to avert steady decline.
But you can see that in a sense a peak in 2005 is important because it puts us over the edge so to speak for oil supplies. We have used up the few years of fairly slow declines surrounding the peak.
Bottom line is for 2008 all I see is that the Saudi's where able to enact a short term surge that overwhelmed the supply channel as all hell was breaking loose on the financial front. I leave it up to you to decide if the decision of the Saudi to surge as the US pulled the rug out from under Lehman and tried to safely prick the bubble where coordinated or not.
But regardless of the large number of short term events during the second half of 2008 if we peaked in 2005 then pretty much no matter what was done then we will know soon what the real situation is. Any spare capacity generated by cutbacks by OPEC will be gone in a year or less if we are 4 years post peak.
Look at the Saudi decline from 2005 to 2007. There was no workover coming on-stream 2007-2008 to explain the 2nd Saudi peak sitting on top of the rest. Local demand was surging at least by 500 kb/d so there was internal pressure to produce more. Some of that 2008 peak must have come from storage. Maybe the temptation of high oil prices during the olympic boom in China. Have Saudis damaged their oil fields in this episode? Their interest now is to "rest" their fields. We can be sure they will do everything possible to confuse us to the last minute.
I've posted numerous times and repeatedly that Saudi Arabia has short term surge capacity my lowest estimate is 0.5 mbd
it could be this.
1.) 0.5-1 mbd or real long term capacity
2.) 0.5-1mbd of surge capacity (over production)
3.) 40-100 million barrels of oil in storage.
4.) 40-100 million barrels of stored finished product ( redirect internal oil outward replace with stored product)
5.) 100 million barres to ? Storage outside Saudi Arabia in Rotterdam, Caribbean, Other leased storage
http://www.menafn.com/qn_news_story_s.asp?storyid=1093236252
http://www.midrocpm.se/Global/Midroc_Project_Management/PDF/Saudi_refere...
http://www.highbeam.com/doc/1G1-44095054.html
We have and estimated 80 million extra barrels of oil in storage right now. Saudi Arabia could readily have caused this without pumping a single extra drop of oil if its storage facilities where full.
I've never questioned the ability of the Saudi's to flood the market with up to 2mbd for 30-90 days.
I would argue I doubt they could do it for longer and I seriously doubt they can perform this flood any sooner than may once a year if not once every 18 months. To be crude they simply can't keep it up.
Next ignoring the supposed total amount of oil supply in 2008 we certainly saw a differential increase in supply consistent with a flood of oil from Saudi Arabia well within their storage capacity much less withing any spare capacity or over production capacity they may have. Set this against a rapid economic meltdown leading to a sharp drop in demand on the order of 1mbd and viola we have 50-80 million extra barrels of oil laying around putting the kebash on oil prices. And last but not least you have to assume that this was Arab light and Arab ultra light no reason to play games with the heavy stuff.
Its easy enough to do hell at any point over the last several years the US could if it wanted have unloaded the SPR and achieved a similar temporary drop in oil prices. God knows what prices would go to if the US unload 400 million barrels of light sweet onto the market.
Think about it to get the events that happen using occams razor only requires the Saudi's to flood the market from known storage capacity much less using my estimates.
One last thing looking back on the past leading up to the Election the US was extremely aggressive with Iran to the point that I and other were concerned about a war. This could have been for a double purpose bait Iran to attack as the Saudi's emptied storage and also ensure a military presence was in place to prevent and attack on KSA while they had drained down their storage and where vulnerable.
The protective bully angle is interesting and in a sense covers KSA both ways if a war started then their problems are history and the bully role offered short term cover. One has to wonder what the outcome would have been if oil prices had not collapsed. The collapsing of oil prices has been itself a powerful weapon against Iran. Makes one wonder what will happen with Iran when prices rebound.
I must agree with memmel that 2005 versus 2008 does indeed matter for the very reasons he has stated, but when considering the reasons for the tempoary production boost in 2008 there is of course the possibility that the production figures are a deliberate misappropriation of the truth in the grand tradition of the “Gulf of Tonkin Incident” “Sadam’s weapons of mass destruction” etc. The motive by the powers that be is certainly there.
Indeed. Note that if you lop off the "peek" in mid-'08 and turn it over to fill in the immediately following deep trough, you end up with a steady line around 74, pretty much where we had been since 2005.
I don't see why anyone should be thrown of by a one-month anomaly. It is just that--anomalous. Averaged over any slightly larger time frame and it disappears completely, swallowed by the trough that follows.
It is as insignificant as the fact that is can still get cold in Tibet or Minnesota even as global temperatures are increasing on average. Both kinds of data are essentially insignificant to the larger, more important pattern.
My goodness, if we can get thrown of by such an obviously anomalous blip, it does not bode well for our abilities to interpret complex charts and systems.
By the way, eyeballing the multi-color chart, it does seem as though most of the blip is attributable to Azerbaijan, Canada, Brazil and KSA. It that born out by the numbers. Are there factors in those countries that allow for sudden increases in production under the right economic conditions (like $147/bbl oil prices)? Could they have drawn down reserves during the price spike that they then filled in the following months (but reported otherwise)?
Generally I believe Canada and Brazil's numbers. Azerbaijan is actually a bit iffy to me. Not that I question their production capacity all that much but its not clear how much actually makes it out in any given month and if they are able to reliably produce at capacity. I've got no idea if its significant or not but generally I treat their number as a capacity number with real production potentially as low as 80% of capacity. Overall in and of itself its not enough to make a huge change but its once one of the anomalies that when added with other iffy production numbers works toward the overall imbalance. Assuming they continue to get reliable pipelines built then this will change for them with production approaching capacity routinely. Given the nature of the country once the distribution network is reliable one can expect that the official production number may even be slightly low vs real production and more oil is sold under the table.
I posted in this thread about stolen oil or hot oil I don't think the overall amount in any given year is enough to make a huge change in the numbers its probably less than 0.5mbd globally in illicit oil. By illict I simply mean oil not recorded as being produced generally its governments hiding redirection of profits. However this does add up over 70 years of the oil trade. We could easily have produced and additional 100GB of oil over the last 70 years thats never made it into the official production figures. My opinion is that inflation of production numbers only becomes and issue as a politcal region declines in production before this the numbers are often understated.
A lot of the sharp increase in production as prices rose in 200 might have been that with the new cash flow illicit oil was simply brought on the books instead of being sold off the books. On the same token maybe we did not decline as much as is officially stated as prices fell more oil was sold without being recorded. Again I don't think in any given year its actually that much oil its only its cumulative effect thats important but variance in the black market for oil is certainly a factor. We have to assume that it increases as prices fall and that this oil is sold at a discount acting to keep prices slightly lower then otherwise.
Anyway this is the type of stuff you need to think about when you talk about marginal changes in the oil supply less than 2mbd plenty of potential factors exist to make the absolute value of production difficult to determine with any accuracy.
Seasonal variation alone is problematic at our current levels. Production capacity is a constant and seasonal demand is variable and oil storage facilities are actually fairly large with about 20 days worth of oil in storage at any point in time and at least that much in transit on the ocean. In absolute terms plenty of factors can result in a change of about 25-50 million barrels in total amount of oil moving around in any given month if not more. That sounds like a lot but a lot of its in pipelines not just on super tankers so it a matter of pipeline loading and maybe about 10 supertankers moving differently in a given month storage level etc etc.
And yes KSA can readily flood this system with and additional 50-100 million barrels. The variance is 25-50 but and obvious addition of 50-100 makes a difference. 200 million extra barrels no doubt about it slams the system thats a flood.
That of course leaves KSA.
Agreed. The data isn't good enough to fix a precise month and anyway it doesn't matter. Oil peaked in the period 2004 to 2008.
westexas,
Very nice summary. Thank you. The central point is we are really well past peak. While the intervening production plateau did not meet true demand, thus driving the price of oil nearly to $150/barrel, it was a largely manageable period economically and socially. The downside will not be so manageable, so it is incumbent on everyone to be even more reasonable in the face of coming adversity. Public intolerance for obvious government mismanagement of the current financial debacles provides us an idea of what is to come as we enter the Post-Peak period.
RE: Life after peak oil
Unfortunately, an ongoing challenge is going to be economic. As depletion bites harder and harder, there will undoubtedly be a push to add more capacity. As we all know, the cheap and easy low-hanging fruit has long since been picked, all that is left is increasingly expensive and difficult. Replacing depleted capacity is therefore going to require ever-greater allocations of US and global GDP. At the same time, we really need to be increasing our investments in renewable energy, because any investment in new oil production capacity is only a short-term fix at best. That's another increasing demand on US and global GDP. We also need to use energy more efficiently, and that will require some major investments as well, especially for intra-urban and inter-urban electrified passenger rail; yet another increasing demand on GDP.
Thus, we have three slices of the GDP pie that all need to expand substantially. Now, consider that the GDP pie might continue shrinking rather than growing. How are we going to do that?
The unfortunate reality, I'm afraid, is that for the most part we are simply not going to be able to do what we need to do. Instead, I suspect that what will actually happen is:
1) Consumers (households and businesses and institutions) will have to economize in their use of energy to whatever extent they can. For example, if good passenger rail is unavailable, they will simply have to car pool, or make other arrangements.
2) In spite of their best efforts to economize, the portion of their budgets allocated to energy will still be increasing.
3) This means that households and entities will have to cut back on all other budget categories.
4) This will tend to cause further downward pressure on all sectors of the economy except energy.
For most of us, Life after peak oil means a poorer life. Get used to it, and plan accordingly.
(There's a similar end-thoughts theme in Matts Post above but I will post here)
Another great post -thanks Tony/ace.
It looks increasingly clear to me that we are -at best- going to experiance maybe 2-3 more years of 'shoddy normality' / confusion while PO denial can be applied based on 'weak demand' coupled with some OPEC Tap lightening.
Beyond this point the real depletions occuring are going to be increasingly hard to mask with any statistical fudgery and very shortly afterwards we are going to witness a 'fright period' as the impacts of expensive energy sink in to the masses and no amount of money thrown at the problem makes a jot of difference.
Most people I talk to about such things are blissfuly unaware of the amount of energy in a barrel and what a squandered gift it has been. Personally I blame it on Michael J Fox -if he had been given an electric Prius in "Back To The Future" instead of that monster SUV/Truck the world would be a different place. Where is Mr. Fusion when you need it?
Nick.
Didn't Fox drive a DeLorean? How are you going to fit 1.21 jigawatts of plutonium in a prius?
He did, but his alter to Reagan in his TV show, 'Family Ties' is what really sent a whole generation over the edge and maxed the conspicuous consumption/greed paradigm. But the bust those Ayn Rand/Reagan worshipping kids have brought us might acutually buy some time now when we need it most, we will see. Who knew Michael J. was that powerful ;-)
Hi Noutram
I've not yet graduated to "energy content of a barrel" when I ask people what they think about future oil supply - but it is a really good question. Anyway, I like to ask people (random encounters) what they think about the price of gas in a year or two - and, I do this frequently. I've not yet gotten any kind of sensible answer. Lots of conspiracy theories, lots of speculation about how politicians will manipulate the supply (they won't let the price go over $4 because nobody will vote for them), dumb talk about carburators that can get 200 mph in a Hummer. One person explained to me how the government has "anti-gravity" technology in a closet and will bring it out under some bizzare scenario. Most people think it's all just a "big oil" and Wall Street's way to rob them - or the tree-huggers are preventing us from drilling up all the oil under some owl's nest. It is really amazing how most people live with their delusions.
I don't know if #1 will be all that hard of a bite, when it comes right down to it. We waste so dang much energy in the US that we'd probably *enjoy* life more if we cut 20% out of our fuel consumption. That's the equivalent of (for example) working at home one day a week. Basically, if everyone else did many of the things that most peak-aware folk do already, we could get there without too much trouble.
We had a rehearsal last summer, which pretty much followed steps 1-4, and people cut consumption. But given what we waste, less energy doesn't necessarily mean a poorer life, at least not at first.
My serial peak oil novel, FAR Future
Nice essay Ace! Thanks.
I liked the green Annual World Oil Consumption per Capita in 2007, (for St. Paddy's day?), but I have a very hard time differentiating the middle three greens unless they are side-by-side.
Two things stand out to me.
One, how is it that OPEC can have 3-4 mbd shut in, but yet not contribute more than, what looks like, a one mbd up tick to the depletion side of the graph in 2010?
Two, it would be nice to see a graph which overlaps the latest data on consumption. I mean, isn't our whole future centered around the delta between this production curve and consumption (A.K.A. the glut)?
I think its assumed that non-OPEC depletion (Russia, North Sea, Mexico) will eat up most of the OPEC shut-in once its brought back online.
Terminology (see most comments) is always a problem. There is a difference between production and productive capability and I suggest that analysts always make this distinction in postings here.
Production can be above or below consumption which answers inventory questions. Productive capacity is always equal to or higher than production and the difference may be the result of many factors: military conflicts (Middle East), weather conditions (hurricanes), transportation disruptions (burst pipeline), artificial production controls (OPEC quotas), economic conditions (shut-in production due to low prices) etc.
Hi Ace
Looking at your curve for CO+LC I notice you see no recovery in 2010/11. But the bulk of the recent drop has been voluntary by OPEC and could, at least in the short-term, surely be reversed if economies recover? It's by no means clear where OPEC are on the Hubbert curve or whether they have yet peaked but it seems reasonable to assume they could ramp production back up to where it was last summer, even if only for a short while. So a return to 2008 peak levels within the next couple of years seems possible.
Further out I agree that it will get harder to stay on the plateau as non-OPEC depletion accelerates (Russian decline will dominate this more and more going forward) and OPEC capacity limits are once more tested.
TW
A valid point watcher but also consider that as these fields produce at even a lower rate they are still moving down their individual decline curves. A current lower voluntary rate will eventually become its max rate. OTOH, I wouldn't expect to see such an overall convergence in just a couple of years. But if I had made that same bet regarding Mexico's Cantarell Fld in 2007 I would have lost that bet.
Hi RM
Well I've just polled myself and I'm unanimous in sticking with 2005. I'm going with Simmons and his deep throat source on this one.
http://www.eia.doe.gov/iea/preface.html
Is this a clue?
(BTW, as most of us know, Ace is probably sound asleep right now, down under.)
The Russian production stagnation/decline is consistent with what our logistic modeling suggested in January, 2006, and our (Khebab/Brown) logistic (HL) based model for the top five net oil exporters is that they will have shipped about half of their post-2005 cumulative net oil exports by the end of 2012, with the other half being shipped from 2013 to 2031 (middle case scenario, from mature basins).
The other issue is that the current recession is caused by the credit unwind that results when economies can no longer grow fast enough to support the debt they have taken on. The lack of growth is a function of peak oil and a lot of other resource limitations.
Because of this, it is hard to see very much of a recovery. The lever that keeps oil production low may therefore be economics, rather than geology directly. This same lever may result in actual production even lower than what Tony is forecasting.
IMO net exports of C+C have peaked and that is what is most important for me because I live in a nation that will soon need to import all its energy.
IMO any peak flow rate (of any commodity) is definitely caused by economics - the flow rate from an individual well is partly determined by geology and may well be approximately bell shaped ... but the flow for the world is dependent on the number of producing oil wells and their flows are dependent on the need to make a profit from production that consumers can afford, and is most definitely NOT bell shaped nor predictable.
The peaking is caused by the cheapest 'low hanging fruit' being produced first.
The ability of the consumer to be able to afford the price of oil is just like all the other commodities in the world whose production peaks e.g. whales, cod, firewood etc (these are not caused by geology either).
If the price of the commodity rises faster than wages then it becomes less affordable, demand will slow, and there will be a peak. IMO most peoples wage rises (and hence affordability) have little to do with the geology of oil wells.
Oil production/consumption, along with other resources, at least above some level required for basic services, doesn't drive the economy. It's the economy that drives the consumption of oil and other resources. Obviously they both influence each other, but the economy drives oil consumption far more than oil consumption drives the economy. There are only so many hours in the day and so many people in the country. With employment at 90+%, we could've increased oil production in line with the credit bubble (~70% IIRC) and we still couldn't have increased GDP proportionally, because people just weren't able to increase their output proportionally by working more, not unless everyone decided to forgo sleep for a decade or so in order to pay of their debts.
rofl- this question of causality can be usefully addressed by charting oil data price alongside economy, as someone did a while back here. As I recall it, recessions were preceded by oil price rises, as in the most recent case of 2008 from which we are still reeling. Meanwhile the level of production that is possible is not so much affectable by the economy, due to inflexibility of supply as also documented in graphs here previously. Even if we became a huge lot richer in 2010 we could make only limited impact on the geological constraints of production capability.
For these reasons I would say that energy supply drives economy much more than vice-versa (and I guess most others here would agree).
The economic cycle's boom in growth leads to both (a) quick increases in oil consumption, and (b) a bubble that leads to a recession when it bursts.
The evidence for a causal relationship is not as strong as you think.
Even if this is generally the case, it should be remembered that it cannot be assumed that growth can occur without an increase in energy (including oil) consumption, nor that a reduction in the availabilty of energy will not cause a decline in economic activity.
It's not just oil data along with economic data, but the change in economic activity (GDP) compared to consumption, which is linked (graph) in my last post. As you may see from the graph, a change in GDP tends to result in a much larger change in oil consumption, which implies that for the most part it's GDP that drives oil consumption, not oil consumption that drives GDP.
While this last recession instance was preceded with a large increase in oil prices, other commodities also saw a price increase as well, probably due to the ~50-70% increase in available credit bubbling through to other portions of the economy. Since there was no corresponding increase in economic activity to pay for this credit, the bubble eventually popped and commodities as a whole deflated. Given the behavior of the economy as a whole, oil price inflation was caused by the huge increase in credit like the other bubbles, although this was probably exacerbated by being near peak/plateau.
Going back, the early 2000s and 1990s recessions were not preceded by significant changes in the price of oil, the two in the 1970s and 1980s were preceded by price spikes due to the OPEC embargo and Iran/Iraq war, although initially the price spike was caused by the collapse of the Bretton Woods system and subsequent U.S. dollar devaluation. All the recessions before that up to the Great Depression do not appear to be preceded by oil price spikes, and before that the same all around inflation in commodities we have just experienced was seen as well.
I'm not sure trying to determine 'causality' like this is all that helpful. As I see it energy (especially oil) and other resources are prerequisites for the functioning and growth of the economy. They are required in the same way that green plants require energy (sunlight) and other nutrients in order to grow. Resources do not cause growth, but growth cannot happen without them. Resource consumption does not drive the economy (or vice versa), rather resource consumption, in a sense, is the economy.
Hi TW,
There is no audited information available on OPEC surplus capacity. Kingdom of Saudi Arabia (KSA) is supposed to have the biggest surplus capacity.
The EIA makes its own surplus capacity estimate for KSA which was 1.65 mbd in 2008Q4. It's also worth noting that the IEA thought that KSA had 1.28 mbd surplus capacity in 2008Q2 but didn't use it.
http://www.eia.doe.gov/emeu/steo/pub/3ctab.pdf
The IEA Feb OMR stated that KSA had 2.75 mbd spare capacity in Jan 2009.
http://omrpublic.iea.org/omrarchive/11feb09sup.pdf
My own view is that KSA today has only 1 mbd surplus capacity which could be sustained for the next year based on the logic in my recent story
Saudi Arabia's Crude Oil Production Peaked in 2005
http://www.theoildrum.com/node/5154
The other issue with the EIA and IEA estimate is that they are based only on statements made by Saudi Aramco about future capacity additions. For example, Saudi Aramco says that Khurais will add 1.2 mbd capacity. Will it really? Maybe it will only add 0.8 mbd capacity since we don't know how much oil reserves are in Khurais and we also don't have the field development plans.
Tony, well written and well researched giving a range of views from people who agree with you.
The decline in your forecast is controlled by crude + condensate. What underlying decline rate has been applied?
I gotta go walk my dogs - the Sun is out and spring has arrived here in Aberdeen. But I'll be back with a somewhat different perspective later on.
Cry Wolf
Tony - I guess you're asleep. Since I will likely be tasked with writing the alternative post I'll try to be brief here.
First up I also voted for 2008 peak in TOD survey, but see things as follows:
Financial crisis sinks global economy, then 2008 will most certainly be peak - 30% chance (but receding?)
I then see an undulating plateau, with production range bound 82-86 mmbpd, and a 50% chance of exceeding 2008 by 2015.
My long standing view has been 2012±3 years - and so I guess I see a 35% chance now of peak falling in that period.
So I think it is premature to make a definitive call on peak oil - those who work on this subject have been dogged by crying wolf and being wrong for decades - I would have hoped that lessons may have been learned.
I've done a back of the envelope calculation and estimate your underlying decline to be 7%. Which seems high to me. True, we may see an acceleration of decline this year and next as the industry cuts back on drilling. But assuming the economy turns around, that can be reversed to historic 4 to 5% level.
We are currently in a world awash in oil - not really what I would have expected in a post-peak scenario. Some numbers:
2008 year end production ~ 84 mmbpd
2009 decline @ 5% = 4.2 mmbpd*
2009 new capacity from megaprojects = 4.3 mmbpd
OPEC spare capacity ~ 4 mmbpd
Production capacity at end 2009 ~ 88.1 mmbpd
* applied to whole stack - some parts of stack will not be declining at all, leaving scope for higher decline in the C+C part.
This capacity will unlikely be utilised with world in recession - but the capacity and potential is there.
A summary from megaprojects:
2005 3.8 mmbpd
2006 3.8 mmbpd
2007 3.1 mmbpd
2008 5.1 mmbpd
2009 4.3 mmbpd
2010 3.7 mmbpd
2011 3.7 mmbpd
2012 3.3 mmbpd
The thing that jumps out at me is the 5.1 mmbpd new capacity in 2008. High price eventually worked its magic and I think this is a major reason why the oil price is at $40 and OPEC spare capacity has jumped.
A key passage in your essay is this:
I checked out your chart labeled "insufficient" - to see that there is in fact ample new capacity coming on to hold steady for a number of years - with the 5% decline rate used in that "insufficient" chart.
So I'm confused.
Cry Wolf
Euan,
I'm somewhat stupified here.
But receding? I can't wait to see your full post on that! I can only hope to god you aren't basing it on that statement that the recession will be over in 2010.
* Credit cards going ka-blooey
* ommercial RE going ka-blooey
* Big rise in mortgage resets in '10 - '11 period
* To get back to long term trend, which is what bubbles do, you need DOW 2-4000 and S&P 400.
Irrelevent. There was a recent string of comments on this involving RR, if you want to see some of the arguments.
With decline pre-econ crisis near that, 7 seems conservative. Apparently you are expecting an economic rebound. Based on what? I can't think of a single thing that suggests that.
OPEC doesn't have 4m spare capacity. They might within 1 or 2 years, but not now.
Cheers
Since you don't seem to understand very much about anything, I'm not at all surprised.
Evidence please rather than unsupported blow hard opinion.
Evidence please, I am using a conservative figure from Rembrandt's Oil Watch Monthly - from yesterday.
Your response was completely uncalled for, and highly inaccurate.
The numbers I refer to come from the IEA last November, as you well know.
I'm sure Rembrandt has his views. I have mine. In fact, I remember being surprised at that in his report. Mine is based on SA saying they *will* have 12.5 capacity. They have not yet said they *do.* That is also informed by al Husseini's comments of 10/'07.
When I have questioned your judgment, it has been with reason and extensively supported. I do hope you have paid attention to what went on in Copenhagen this last week.
Cheers
On OPEC spare capacity
I can look at Chart 14 in OWM and observe that OPEC crude oil production has declined 4 mmbpd 2nd half of 2008. That is voluntary restraint, characteristic of swing production.
Or I can look at Chart 52 which shows OPEC spare capacity estimate of 4 mmbpd from the EIA.
Or I can look at Chart 53 which shows OPEC spare capacity of 6 mmbpd from the IEA.
You made a definitive statement on OPEC spare capacity:
So where is the evidence to back this up?
On underlying decline rates
In the normal run of events, oil companies are fighting decline on a daily basis. Drilling in-fill wells, doing well work overs. Drilling water injectors etc. This mitigates the actual decline to the underlying decline that we can watch via production statistics. The underlying decline is then further mitigated by new field developments to give us the actual or observed decline.
So its possible to construct a scenario that decline may have accelerated in the past couple of years owing to a shortage of men and machines to conduct the various interventions detailed above - not to mention the cost of doing so. That shortage is now over for the time being. I'd imagine we'll see much well maintenance work going on - if for no other reason than to keep the service industry gainfully employed - because the operating companies need them to survive.
On fate of capitalism
What is your guestimate for the world economy tanking right now? I guessed 30%.
Actually, I made a mistake. You wrote OPEC, but I was thinking SA, and that's what I wrote. That's my error.
Decline rates: I don't think your point is a large part of the issue. Manpower was tight before. If demand were to surge, it would still be tight. Plus time to ramp back up, etc. I'll leave whether well maintenance can make a significant difference to others who would know better. Perhaps Rockman or someone like that would care to comment.
Decline is accelerating because that is what oil fields do, particularly when pushed to their limits, no? Here the above-ground issues tell us as much, if not more, than the below-ground, imo. When you watch what nations have done/are doing to secure oil supplies, there really is no doubt as to why.
Economy: Your question is ambiguous. Do you mean begin to tank? Will have reached it's bottom, i.e., have tanked, etc.?
* The world economy starting to tank? 100%. Pretty clear, I think.
* Complete collapse? Heck, I don't even know if that will happen. And if so, to what extent? And how? Beats me.
WRT oil production, it's not the question to ask. As the economy shrinks, demand drops. As decline imposes limits, consumption drops.
Chicken/egg.
BTW, Capitalism as we have been told it exists, doesn't.
Cheers
no - is correct. Decline in any given field accelerates off plateau, but then decelerates entering phase III. World production is now dominated by 1000s and 1000s of fields stacked upon the other with low decline rates - but there is likely a significant effort required to maintain this.
At the end of the day this discussion leads back to Ghawar, and the time that N Ghawar enters a phase of accelerated decline (coming off plateau) that may remove a couple mmbpd capacity from KSA in the space of a few years.
agreed.
Not accelerating? Let's see:
1999 @ 3%/yr
2005 @ 4.5%/yr
2008 @ 5.7%/yr (I may be misremembering the IEA number, but I believe it was 5.7 or 6.2...)
Looks like acceleration to me.
Phase III? By the time the world gets to where the curve is flattening out, this conversation will be moot, so the point is. Up till now, decline has been accelerating. If demand backs down enough, I could see a scenario where fields get "rested" (for lack of a better term) which should reduce the rate of decline, I'd think.
Cheers
A couple of years ago it was reported that 59% of global production was coming from fields that were either on extended plateau or were in build up phase. If there has been a shift in that structure then it would be interesting to know - Ghawar coming of plateau could achieve this alone.
Now its a hell of a lot of work to compile statistics on this kind of topic. Why don't you go and do it? Spend several weeks doing a really thorough job and report the results back to us. That would be a useful contribution.
That was a non-response. Are you saying the reported decline rates were not what I stated? I dunno... I don't recall a lot of argumentation on the issue...
And, pray tell, how am I supposed to do the numbers on decline rates? *You* can't, either.
As I said, non-response.
Euan - and for that matter everyone else.
Comments like "Since you don't seem to understand very much about anything, I'm not at all surprised."
This is not the way grown adults talk to each other.
If you a problem with a particular point, please state it. This comes very close to name calling.
I think we're all a bit more on edge than normal. Only to be expected - I recommend black humour, sarcasm and lots of alcohol. Each to themselves though.
I might sound like a doomer but I'm an ultimate optimist. Me and Zadok have agreed to meet up as very old men on a beach in northern Scotland circa 2050. Global warming will do wonders for Aberdeen ;-) Euan's putting us up even if he doesn't know it yet. It's even possible one of us will still remember our name :-)
Hi Gail,
I'm not sure you have actually read any of ccpo's prior posts but Euan most certainly has, still he shows immense restraint IMVHO.
ccpo is one of the very reasons many "are on edge".
The recent flaming in the 'Fire and Ice' thread might have added a little edge to Euan's reply here. But thanks for the reminder Gail, once posted it is out for all to see.
Strange. I've always thought of flaming as baiting and personal attacks for no reason other than to do it. Given I have praised Euan's work in the past, and have, in fact, only criticized his one post related to climate, my comments can hardly be called flaming.
FYI.
ExxonMobil put the decline from existing wells in the 4% to 6%/year range, and the CEO at Schlumberger reportedly put it at 8%/year. In any case, at the 6%/year rate, the world loses about 5 mbpd per year, from a 85 mbpd total liquids base. At 8%, we lose 6.5 mbpd.
And its blindingly obvious that that has not been happening, given supply additions in recent years.
Perhaps I am blind, or perhaps you are seeing something that I don't see. I thought the following pattern was interesting, against a long term backdrop of rising oil prices, up at about +20%/year from 1998 to 2008 (annual average).
Cumulative Increase in Crude Production (between what the world would have produced at the 10/01 rate and what we actually produced, EIA C+C):
From 10/01 to 5/05: approx. 3.5 Gb
Cumulative Shortfall in Crude Production (between what the world would have produced at the 5/05 rate and what we actually produced, EIA C+C):
From 5/05 to 12/08: approx. 1.0 Gb
As noted elsewhere, this pattern of declining crude production in response to higher oil prices was what we also saw in the North Sea and Lower 48, at a similar stage of conventional depletion.
Of course, we are seeing a boost in NGL's, and Simmons attributes a good deal of the increase in NGL's to (gas cap) oil fields in their death throes, as their gas caps are blown down.
Perhaps; EIA oil supply data:
IEA oil supply data:
Oil supply has increased by somewhere around 3Mb/d in the last 4 years. That's certainly slower than what we saw in the 90s (0.9% vs. 1.6%), but it's still a significant increase. Given the nominal capacity additions that have come online in that time, it's not plausible that 8% decline was occurring.
Euan:
I suspect that the really huge area of uncertainty from here on out is not going to be geological, but rather financial. It doesn't really matter how much is still in the ground if we can't afford to finance the megaprojects to replace depleted capacity. We truly have NO IDEA how much financing we are actually going to be able to come up with for new megaprojects in the future. I think it is a safe bet that there will be SOME new investment, but I also think that it is a pretty safe bet that the financing that is available will be perpetually less than what might be both geologically possible and what demand (and thus price levels) could theoretically support. That leaves a wide range of uncertainty, unfortunately, and there is simply no relevant precedent to provide us with any helpful guidance in knowing what to reasonably expect.
I would not be surprised if there were wild swings between massive investments in crash programs some years, and a complete cessation of investments in other years. This instability and unpredictability will only hurt matters even more.
WNC - I agree entirely that finance will play a crucial role. I'm guessing on the megaprojects list that steel has been cut for projects 2009, 10 and 11 - and they are now unstoppable. So if the oil price does not rise, some companies involved here will go to the wall - we may see a new round of mega mergers. If oil price does rise (to what?) then the supply will materialise and oil cos will be OK.
Cost of new supply is hard to estimate since service sector costs are now on the way down - the $80 cost of marginal supply can quickly become $60.
Looking forward, one of the most important questions is share of GDP spent on energy. And share of energy spent on energy. On the former, if we spend a greater % on energy then we must spend less on other things and on current trends, energy intensive industries are being selected for extinction - flying, driving etc - and that complicates matters since this will lower demand and oil price feeding back into energy investment needs for the future. This is offset by unshakable commitment of our leaders to growth and of Man to greed and a desire to travel.
At the end of the day we are discussing details of timing.
I do not agree that just because "steel has been cut" a project is unstoppable. If oil prices remain low and corporate forcasts for prices are revised downward Big Oil Companies are quite capable of mothballing a project. Look at the history of oil shale or tar sands during the 1980.
I believe that timely production from projects two or three years out is in question.
I think MEGA projects for 2009 must surely be unstoppable - barring force majeure. Anything involving a FPSO, platform, pipeline will take years to construct and the write off to abandon it now will be quite large. Usually companies want to get new projects on as fast as possible and pumping as fast as possible to recoup investment as fast as possible - and in the perverse world of capitalism, if oil prices are falling, then the faster all this needs to happen.
Where projects have been sanctioned but not begun then we may see a dash to put these back on the shelf - plenty evidence of that happening. But when (if) things begin to pick up, all the reservoir and engineering design work is done - so they can be re-instated more quickly - and probably at much lower cost.
Ok its 2009 show me the real production rates of the new project brought online in 2008 if we have the data.
Obviously we had some data to put it in the megaprojects list.
Given 2008 is now in the past lets find out how much of a real increment was actually brought online in 2008.
I have no idea but I suspect that it will be between 3-4mbd just like every single year I've seen numbers for.
For the oil industry to bring on and extra 2mbd is a 40% jump its hard to see this is credible.
Show me.
Don't shoot me, I'm the messenger of data that Tony and Sam have lovingly compiled. But I got quite a surprise looking at it. I wish they'd been jumping up and down warning of a temporary glut coming (maybe they were?)
Of course there may have been more project slippage, with some of 2008 falling into 2009. And the tallies are for project peaks that won't fall in 2008 - some of the 2006/7 peaks will have fallen in 2008 - and 2008 peaks may fall in 2009 and so on.
$147 a barrel I imagine provided a fare incentive and now the industry is a victim of its success - once again.
Don't get me wrong, credit crunch and recession is part of the oil price story. But I think this bulge in new capacity is also implicated in the $40 scenario. Our best models forecast peak around 2012, and I don't think we should abandon these models prematurely.
Euan I took it on myself to look at one field.
Agbami Field
http://www.chevron.com/News/Press/release/?id=2008-07-31
http://en.wikipedia.org/wiki/Oil_megaprojects_(2008)
Its at first oil this year and probably will flow 100kbd within the next serveral months peak production estimated in 2010.
Its totaled in the Megaprojects at 200kbd.
Also it looks like Megaprojects is more of a all liquids type list with several NGL projects.
And as far as when peak production just for this field its not 2008 not 2009 but 2010 probably likely 2011.
There is no glut I think your misunderstanding the megaprojects list and how what it lists works out to real oil production.
Real world tends to be 2-3mbd or I'll even give 2-4mbd year in and year out.
Not that megaprojects is not a fantastic project and great addition to our knowledge base but ever since it started the numbers it uses have been abused and misused.
http://canada.theoildrum.com/node/3958#comment-373370
I found my own response but your free to look back to the original comments we repeatedly have predicting a flood of oil any day now from the data thats in the megaprojects.
If your serious about using the data for real oil production then you need to find the actual flows out of these fields in 2008-2009-2010.
I suggest you will find in general that from the date of first oil flow to full production is over a period of 2-5 years depending on the field and often on pipeline support and other secondary issues. In the case of this particular field I suspect full production is waiting on a pipeline although I can't prove that.
http://www.intecengineering.com/expertise/flow/resumes/resume.asp?r_id=42
Not sure whats in place its some sort of floating storage setup but they don't explain how its transferred from the storage unit.
Maybe it is then offloaded directly to a tanker ?
In any case the point is that you must understand what the numbers are in the Megaprojects list if you wish to use it in production estimates in any given year.
I thought my comment captured what you are saying here quite well.
2010 is not 2009.
I suggest that you consider projects that come on stream in 2008 will reach peak flows 2-3 years later sometimes even longer.
So a project that had first flow in 2008 would see peak production in 2010-2011 at the earliest. You by no means captured what I was trying to say. To put it bluntly you don't understand the megaprojects list.
However it does highlight how people like CERA badly overestimate production they do effectively what you have done.
If you seriously want to use projects as the basis for predicting oil supply then you need to go back in time say to 1990 and take all the projects that have come online from that time forward track the production flows for each project from the time of first oil to say peak production at least and carry this forward. Eventually you will develop a robust empirical model for the rate of new oil production in any given year. Next of course you need to develop a good model for decline to gauge the overall production.
Now I'd suggest that the Shock Model is exactly this sort of model however it also has some obvious flaws if you look at real data i.e the megaprojects list.
http://en.wikipedia.org/wiki/Oil_megaprojects_(2008)
Look at the discovery dates of the fields one of the key elements of the shock model is that you can reliably time shift discovery forward by a certain amount to predict future oil flows. Well the discovery dates for projects being brought online in 2008 are all over the map. The assumed correlation of discovery date to production date is not present in real data. The shock models underlying assumptions are suspect and in fact all models based on shifted discovery curves make and unproved assumption.
The next assumption is that because discovery is effectively random no cherry picking has taken place i.e we did not produced the best oil first while in fact the real scatter in the lag between discovery and when a field is put into production indicates that cherry picking is certainly taking place and the best fields are produced ahead of harder to develop fields.
I could go on and on and on but suffice it to say ohh the mejaprojects predicts a wall of oil we are saved is simply the same mistake that CERA makes.
Now going local i.e to the recent price crash first and foremost my opinion is oil production has steadily declined from its peak in 2005
we have ample reason to suspect post peak production data from a number of countries. My best guess at current world production is 70-72mbd It really depends a lot on the OPEC cuts how much is real how much is just changes in reporting etc.
Next the fall in prices second half of 2008 was driven by three large but short term factors a epic crash of the economy similar to what happened at the start of the great depression a short term surge by KSA and damage to the US main import region by hurricanes. Three major events worked to create a short term surplus of oil and extreme downward pressure on prices as assets where sold.
All of these are effectively one shot deal with the exception that KSA can probably repeat a surge sufficient to cause a short term oversupply at least once a year if they wish. Sufficient storage and spare capacity of 500kbd-1mbd is all thats needed to develop surge capability. And I define a surge is 30-90 days of unsustainable exports.
Now what happens next I'd say a steady decline of at least 1mbd maybe as high as 4mbd annually depending on which model is correct that open.
And time will tell again who is right.
If the oil market stays flooded with oil through 2009 then we can say your right if prices go up then what ?
I can make a fairly accurate prediction that over the coming months the current supply surplus will be drawn down and high prices will return. Figuring out exactly when is tough my original estimate assumed we would not exceed the 5 year maximum storage before we started drawing down well we blew way through that and storage levels have remained high week after week god knows how much is setting in floating storage with no room to come onshore.
In any case once storage is obviously being drained the next question is how fast once it starts heading down then the best you can do is assume a steady linear decline that will give you the number of months before we are back in a strained oil supply level.
So whenever that is thats when we return to the high price regime. Given some estimates of a 0.5mbd shortfall and 80 million barrels of excess oil this implies 160 days to drain it down or about five months. In 2-3 months the decline in storage should thus be obvious.
So I can say that my assumptions can readily be proven wrong three months after storage declines. Now when does that start ?
Well given the above numbers I'd say storage levels would have to start declining within 2 months at most and it could start any week.
So lets revisit the situation in 2-3 months and see what happens. Given what I believe I know I can make a reasonable guess. I did get burned when storage went way over the five year average but not much I can do to explain that the top of the five year storage level was the best number I had for how much oil could be stored. I know we used to store a lot more oil but its been long enough that storage levels have not been as high as today that the storage tanks might not exist or be serviceable. We literally filled storage that not been filled in ten years. The fact that we seemed willing to fill literally every storage tank in America with oil seems to indicate that a good bit of the oil industry does not feel the current surplus is a long term event.
Anyway your a smart guy I hope if you want to go down this route of trying to figure out the future from "production capacity" that you build a good model everyone else that has used this route has failed miserably.
Take it to them, Memmel! This discussion is good no matter which way it tilts.
The oil shock model isn't quite a straight shift in the discovery curve. It is actually a sequence of convolutions (or low-pass filtering stages) that has the appearance of shifting the curve. What the convolutions also do is smooth out the discovery fluctuations, leaving only economic shocks t0 generate the fine detail.
What the filtering also accomplishes is to enable one to use a stochastic discovery model, dispersive discovery, as a replacement for actual data. You don't see any noise on this curve because it is pure probability, and it can extrapolate to out-years as it incorporates reserve growth as part of its derivation. The last chance I had to generate an oil shock model, I used the DD model assuming crude (no NGL) as a fit and came up with 2008.
When I was first working the model out, I was very sloppy in not separating the types of oil. The discovery curves were basically estimating crude, but as non-crude became more important, the published production curves started including the other stuff. Unfortunately, applying crude-discoveries to all oil production curves made the projections fall short by a few years. Now, using crude discoveries and applying it to estimate basic crude production, the number comes out to 2008.
Yet looking at more optimistic discovery data from Shell Oil, which basically labels the discoveries as "Barrels of Oil Equivalent" and doing an extrapolated DD fit, the peak only marginally shifts to 2010. This is against an all oil production profile, which essentially echoes the sentiment that I thought Matt Simmons had stated: essentially the peak of crude coincides roughly with the peak of all oil. I think this happens because good oil is likely found at the same time intervals as poor oil, and it is just a matter of saving up the poorer quality of oil a couple of years before that also starts depleting. In reality, if high quality crude is like gold, the poorer stuff is near-gold, and nothing rules out that it will not get developed nearly as fast, especially with poor and/or greedy nations involved. In other words, the shades of "Eureka!" may not be as great as people think.
Search "Application of the Dispersive Discovery Model" on TOD from 2007 to see some of the curves.
Okay so the scatter in dispersive discovery tends to work as a correction for time shifting discovery neat.
( I'd protest not obvious ) Fiendishly neat :)
I'd attest however its underestimating the amount of real cherry picking thats actually occurred that my biggest beef with the shock model.
At the end of the day cherry picking i.e producing the best fields first and technology advancments etc etc result in a declining EROEI as we approach and pass peak. I'd argue that as EROEI declines the production rate also declines as maintaining extraction rates becomes more difficult. Regardless of how much oil is left our ability to extract it at a certain rate declines with time as extraction itself becomes harder to accomplish.
I would say my argument agianst the shock model is for me at least it seems to imply a constant EROEI across the production curve.
I'd argue that declining EROEI is real and that this implies that the curve absolute peak is lower its shifted left in time to a sooner level and that the post peak decline rate accelerates making the production profile asymmetric.
The fact that your having a problem finding honest barrels of oil instead of boe's should at least hint that EROEI is not constant. And of course unconventional vs conventional is another hint. And last but not least peak light sweet may be real which is just another variant that included a bit of a quality measure.
The only factor that really shifts the curve for plain conventional oil forward in time is additional extraction from EOR methods since these regardless of net EROEI actually extract more oil than we would have vs pulling it out much later in the tail but these repeatedly seem to give only a few precentage increase in some cases.
So a 2005 conventional peak is very reasonable if you correct simpler methods which have peak dates in the 2010-2012 range and more telling is that the actual value of peak is sensibly lower than the other models by several million barrels. If I'm right then we expect the value at peak to be 5-10mbd lower than the estimates that don't correct for EROEI. Its a 5-10% correction in time and in peak value and in decline rate. All three worsen by about 5-10%.
On the other hand this approach also implies that 5-10% more oil was extracted as these factors became important thus the production history from say 1970 to the present includes 5-10% more oil than we should have extracted to date since overall its just moving production from the backside of the curve to the front side.
Here the fact that outside of above ground events we where able to keep ample spare capacity and low oil prices for decades along with a steady increase in production rate offers a compelling argument that we where probably over extracting at a steady rate during that time period. I'd argue that symmetric peak models would not generate the historic price profile we have seen. Control of the economic growth rate via Central Banks also plays a large role in prices but they are intertwined phenomena. Until recently technical advances basically overcame the ever lower EROEI problem leading to a effectively decades long platuae in potential production capacity slowly eroded by expansion. A simplistic symmetric fit using production up to 1980 points to a symmetric peak around 1995 at 100mbd. This is what I would call the natural peak or better perfect world peak.
http://en.wikipedia.org/wiki/Peak_oil
Certainly increased conservation and a switch to NG play a postive role in shifting the peak date forward and I've to some extent dismissed them they need to be corrected for overall population growth which I've also neglected. The rate of increase in efficiency is generally on the same order as population growth. Without pricing pressure or better with only periodic pricing pressure from obvious above ground sources overall early efficiency gains in the use of a cheap resource are probably low. Generally since per capita energy usage seems to be declining without equivalent obvious efficiency gains and of course in general VMT has been increasing then one can argue the net is negative with demand from population growth exceeding efficiency gains in usage. This is yet another probably large negative. Note however a lot of the population growth was in marginal users that did not own their own cars. So its not as big of a negative as one would expect.
The overall result is we have been on a fairly broad long capacity plateau if demand had actually risen fast enough then we would
have and could have produced to meet demand first potentially reaching 100mbd if not slightly higher with the potential in peak production steadily declining until indeed in about 2000 globalization resulted in demand beginning to exceed capacity.
Think about look at the discovery data and the production data if the demand existed in 1995 we could have easily pumped 100mbd.
Every year afterwards this possibility faded even as real production continued to increase. The maximum of EROEI and Production capacity is almost certainly in the past and thus the symmetric models are probably not correct. This detail is of course of extreme interest as more and more models begin to point towards peak now.
And last but not least for the late peak cases 40 dollars a barrel is a good price for oil well over the minimum price projects for most of the worlds oil production not all but most say at least 80% of the worlds oil production is profitable at 40 a barrel. Of this 80% about 50% is controlled by non-OPEC producers. Assuming 72mbd this gives 28.5 mbd of oil thats produced without political quotas and profitable. People are claiming that we cannot squeeze a 0.5mbd or 1mbd or 1.5-3% increase in production out of all of these fields to counteract the OPEC production slowdown ?
Your own model does not have us at peak or barely past it. Megaproject points to a large number of projects supposedly 5mbd comming online in 2008 even 4mbd is more then we ever achieved in the past. Yet we can't even get 0.5mbd more production out of non OPEC production. I just don't buy it. Non OPEC is certainly in decline and a number of OPEC producers are certainly in decline.
Otherwise I'd argue there is simply no way for OPEC to actually force oil prices higher without a significant cut 4mbd or higher.
Thus I'd argue the only models that can result in rising oil prices right now are either we are past peak and in significant decline or OPEC has really cut closer to 4mbd if they did then we would see it in the difference in oil supplied regardless of what the absolute total is. Its just impossible thus if we continue to see rising oil prices without dramatic cuts from OPEC and continued weak demand then we are probably past peak. Given the anemic demand and relatively mild cuts from OPEC and historically good price for oil right now oil prices should fall or at least flatten.
Maybe they will time will tell so far any mistakes I've made are in my opinion small and related to problems with the timing and delivery of about 30-50 million barrels or oil. Thus so far I would argue I'm only off by half a days supply. Enough to destroy my short term price predictions by hey they blew through our 5 year storage average so give me a break :)
I would certainly say that not allowing cherry-picking has some issues. I agree that it generates a more optimistic projection. But then it gets balanced by the fact that dispersive discovery does not allow "big fields first", which makes the projection a bit more pessimistic. So in general, we are shooting for minimizing the bias by not making any unwarranted assumptions. In other words, if we don't know, we leave the model alone.
By the same token, using discovery of "BOE" numbers helps create an error margin for other kinds of oil. What exactly is the sensitivity to the effects of EROEI reduction? We know it is in one direction, but will it change things by a few years or how much faster exactly is the depletion rate then? Could the increase in BOE exactly offset the decrease in EROEI? Not likely, but it might turn it into a second order effect.
Good observations.
Web I honestly don't know as you get into a lot of the stuff I'm talking about your talking about inspirational guessing which is slightly above a common WAG.
However you can make certain predictions esp including the small field higher extraction rates.
1.) The rate of production decline will increase.
2.) Peak is absolute once decline sets in the party is over ( 2008 numbers are bogus see 1)
3.) The price of oil will rebound fast if I'm correct about underlying demand ( jello model )
4.) The EROEI cliff will make mitigation difficult if we try to maintain our lifestyle.
Thus some short term events can be interpreted using these concepts. The decision to implode the economy by pulling the rug out from under investment banks and crashing the shadow banking system was deliberate and simply got out of control. The Saudi's played a role via surging oil supplies in and attempt to stabilize the economy at the highest level. They finally acted as best the could as a swing producer.
Oil prices also fell out of control and beyond what the Saudi's expected.
But these where short term events caused by people attempting to manage the global economy and failing. The relentless underlying depletion problem cannot be hidden for long thus if we continue to see a steady increase in prices its very telling for me at least.
Certain events this indicate or signal this initial steep decline scenario.
Looking back into the past.
1.) The rapid rise in prices was not fake it was real we did not have enough oil to run our economy at its current level. Note we have had significant economic decline yet real oil usage has not dropped all that much price has but the volume of oil being used has not declined very much despite the economic downturn. This is a relative decline and does not depend on the absolute value.
2.) The interaction with Natural Gas esp in north America is alarming. The additional btu's needed to upgrade the lower quality oils are significant for tar from what I can tell about 50% of the energy content of the oil is required to refine it. Generally for the lower quality oils a lot of this comes from additional NG usage during the upgrading process. Thus the lower quality oils can almost be considered one of the inputs to a hybrid GTL process vs conventional refining. This is complex refining. If I'm right about this and depending on how things turn out with NG we could be setting ourselves up for a super spike in oil prices and it becomes almost senseless to spend expensive NG to upgrade poor oils. My opinion is this is probably the biggest problems we face. Europe may turn out to be in as bad a shape as we are. Japan and Korea that depend on LNG may also get hit. Basically if North America is forced to abandon complex refining because of high NG prices all hell breaks loose. Also I might add that the spike in NG prices played a intrinsic role in rising oil prices well beyond what was expected based on oil production alone. Furthermore this allows us to predict that the oil market will effectively split into two light sweet vs heavy sour with steep discounts eventually being forced on the heavy oil producers. Its akin to dying of thirst in and ocean. Cherry picking of the lighter sweet crude plays a large role in this.
So lets see how things evolve and watch both oil prices and NG prices closely over the year. Over the next few years I expect that the NG effect will actually dominate pricing if we do have a steep decline in underlying production.
"and so on" means 2010, 2011 etc.
You know its wholly impractical for us to track individual field histories, for 2 reasons, a) we don't have the data and b) we don't have the time - so why suggest it?
My back of the envelope calculation states that we have 35% chance of a future peak - but these are numbers pulled out of thin air since none of us understand the whole system in sufficient detail. I'd point to one project - Thunderhorse - delayed from 2005 (?) that came on in 2008 - at near capacity from about 5 wells, so I heard. We have had rolling delays for a number of years, and so maybe 2008 was the year that these unrolled? No doubt the mega-projects list for 2008 will get revised, most likely downwards.
The real issue here is that global production capacity has been constrained by the capacity of the engineering sector to build projects. And with declining ERoEI, more effort has been required to install less capacity. I gather there has been a major construction effort, building new rigs, drill ships etc, in an effort to de-bottleneck the system.
And for a long time one could argue that the low price of oil resulted in a financial bottle neck. I'd argue this is now back in force.
And yes its difficult to track a single field and yes on purpose I did not use Thunderhorse the poster child for delayed projects.
The point is if the start date for oil projects is your underlying data point then your model will be very poor and inaccurate.
Just like CERA's is.
It has its uses for sure the biggest use case is when at some point we no longer are able to bring online 2-3 mbd ?
Although the megaprojects list suffers from the horizon effect I think that it will eventually prove to be a fantastic
indicator of when we finally reach the point that we cannot maintain our current rate of new oil additions. If the projects
are not started then the scatter in when they go to full production is mute.
And last but not least a lot of our current productive capacity is from workovers in existing fields given the current decline
rates esp unmitigated of 6-10% its seems about 50% of additional production brought online is from existing fields.
Changes in this value which is even harder to find can readily have a big effect on overall oil supply.
A obvious one is the decline of Cantarell but all across our planet more and more fields are reaching the point that
infield drilling is no longer possible.
Bottom line trying to figure out future oil supply from new project start dates is a fools game to many other factors
are at work. I'm a bit surprised your "converted" since the projections that place emphasis on new projects have repeatedly
been burned and burned badly. They correctly are the worst models available. This is not surprising since your talking about
a factor that effects about 5% of the worlds oil production and not even that its the precentage change in that factor or lets
say 30% of 5% of the worlds oil supply or basically your trying to predict future production from a 1.4% change in the overall
measure.
Good luck. However I'd suggest coin flips or tea leaves or better ask a economist.
Nobody knows the future in detail.
Oil production will peak at some stage, maybe for political reasons because of climate change concerns.
I think Shell's idea of using scenarios rather than models is best since nobody knows what the future price of oil will be and whether we can afford that price.
If we have a scenario assuming ongoing <$50 oil then we may well have passed the final 'net exports' peak - this scenario has some very bad implications for all us importing nations.
Since I'm arguing with everyone tonight....:-)
Surely <$50 / bbl would be great for Britain? Import all we want.
I don't think that will happen.
NO <50$ oil is below the profitable new well price so won't be produced enough to export to the UK.
Think 'net exports' when considering the UK ... I suspect we will have a difficult time no matter which scenario unfolds.
Since supply=demand the peaking can be viewed from either point of view ... TOD mostly considers the supply point of view ... but the demand point of view does not consider geology, just affordability, so IMO geology has nothing to do with peaking.
Geology just tells you when crude oil supplies will go to zero, and that as time goes on oil must become more costly to consume in order for the oilcos to make a profit.
Best hopes for wages to rise faster than the price of oil so it continues to become more affordable ... mathematically impossible I suspect!
If I am not mistaken $147 oil had nothing to do with 2008 capacity additions, since oil projects require long lead times, and those projects where probably planned when oil was at much lower prices $40s/$50s…which at their time felt like a lot!.
To gauge the real effect of $100+ oil, you need to look at capacity additions 2010 and beyond, and from what I see, there is nothing major in the horizon after 2010, and most of the unconventional oil sands projects that were planned beyond this period are now shelved.
Regards,
Nawar
Hi Euan,
I don't apply an underlying decline rate to crude and condensate production (C&C).
The world C&C forecast is based upon aggregating country forecasts from 56 major oil producing countries and 45 minor oil producing countries. Each country forecast has its own future production profile. This profile can vary greatly. For example, Kazakhstan's C&C production is increasing while Norway's is decreasing.
When all these country forecasts are aggregated then a world forecast is the result. Consequently, the world decline rate is an output of my forecasting model.
From Figure 1 above, world C&C, excluding oil sands, is 72.6 mbd in 2008. In 2012, world C&C is forecast to be 64.4 mbd. An average annual decline rate can now be calculated to be 2.95%.
The chart below shows that the annual decline rate using Dec 2009 and Dec 2012 is 2.94%, including oil sands.
It is assumed that OPEC's compliance to cumulative 4.2 mbd cuts is about 85% until June. After June, it is further assumed that prices increase due to demand being greater than supply and that OPEC begins increasing production again until a secondary peak of 71.3 mbd is reached in about November this year.
click to enlarge
Here is the long term crude, condensate and oil sands forecast.
click to enlarge
Thanks Tony, I understand.
Future new capacity from mega projects is sufficient to offset 4 to 5% decline near term - your own chart shows that. So you have an effective underlying rate of decline of 7 to 8% which IMO is too high.
I'm guessing you get this through modeling major OPEC producers at peak (as your chart here shows) and applying a decline rate to them, and that would be my main point of disagreement. If OPEC extends that bumpy plateau, your model fails. One day you will be right - just not today - IMO. One point I'd agree on is that OPEC can unlikely raise their game from recent highs - unless of course Brazil joins.
€
Euan,
A key point about oil megaprojects database is that most of the capacity additions represent the capacity of the field production infrastructure and not the annual field production addition.
Brazil is a good example. In 4Q2007, Petrobras shows four megaprojects Piranema, Golfinho, Roncador P52 and Roncador P54 with gross capacity of a large 0.49 mbd starting up.
The EIA says Brazil's production (crude and condensate only) was 1.75 mbd in 3Q07, 1.74 mbd in 4Q07 and 1.75 mbd in March 2008.
http://www.eia.doe.gov/emeu/ipsr/t11a.xls
The EIA's March 2008 production of 1.75 mbd, after these four megaprojects started up with 0.49 mbd capacity, is exactly the same as the EIA's 3Q07 production. Why? Because the fields aren't producing at capacity and Brazil's decline rate of the existing base is probably 10%/year or about 0.18 mbd per year.
The chart below demonstrates further the problem with using capacity additions instead of production additions. In Jan 2006, Brazil's C&C production was 1.69 mbd and Dec 2008 it was 1.84 mbd an increase of 0.15 mbd. The gross capacity additions from 2006 to 2008 was 0.995 mbd, excluding Marlim Leste P53 as it started at the end of 2008. That implies annual decline rate for all of Brazil's production to be 15%.
A more realistic decline rate for Brazil is about 10% as Petrobras stated on slide 5 of its 3q 2007 presentation that annual decline was 0.17 mbd which was just under 10% of its average production of 1.763 mbd for Jan to Sep 2006. There is also reference to Albacore Leste P50 which started in April 2006. The slide says that P50 produced an average of 148 kbd in Jan to Sep 2007 which is equivalent to 80% of its capacity of 180 kbd.
http://www2.petrobras.com.br/ri/port/ApresentacoesEventos/ConfTelefonica...
Using a 10% annual decline rate for existing production implies that actual annual production additions would have been about an average of 70% of capacity additions. What does this mean for Brazil C&C production in 2009? I'm forecasting that 2009 average C&C production will be about 2.0 mbd up from 1.8 mbd in 2008. Based on Petrobras actual numbers for Jan and Feb 2009, C&C production for these two months will probably be about 1.9 mbd.
click to enlarge
The high deepwater decline rates of Brazil partly explain why Colin Campbell forecasts Brazil to be on a peak plateau soon.
http://www.aspo-ireland.org/contentFiles/newsletterPDFs/newsletter85_200...
click to enlarge
Saudi Arabia is another example. Just because Naimi says that Khurais will add 1.2 mbd capacity it might actually produce 0.8 mbd. Similarly, Khursaniyah is claimed to add 0.5 mbd capacity but might only add 0.3 mbd production.
Saudi Arabia also had two NGL projects Hawiyah and Khursaniyah expected to add about 0.6 mbd NGL in 2008 and 2009. From the EIA IPM Saudi Arabia's NGL production for 2007 was 1.44 mbd and for 2008, down slightly to 1.43 mbd. Guess what the IEA OMR Feb report said? Page 20 of http://omrpublic.iea.org/omrarchive/11feb09sup.pdf
Saudi Arabia's 0.6 mbd megaproject NGL 2008/09 additions result in 2009 production being equal to that of 2007, a zero production increase.
If you use megaprojects capacity additions, you should multiply the annual additions by about 0.85 to get a realistic estimate of future production additions.
Tony, points well made and I accept what you are saying here about capacity additions. But there is an element of contradiction in this debate. I fully understand and grasp the concept that new capacity addition does not appear in the date of inception of the project - I probably understand this much better than most. But now you are trying to make direct comparisons between new capacity additions and what happened in that year.
Notwithstanding that I'd have no problem accepting that quoted capacities are exaggerated and that a factor of 0.85 may be appropriate to scale these to reality.
On decline, the best report I've seen on this came out of Boston a couple of years ago. The most important point to grasp is that production can be broken up into different classes, each with its own decline characteristic. The average observed decline is the weighted aggregate of these classes. Then, only 41% of production came from fields that were actually declining. And of those, only a portion is from new deep water. Decline rates in deep water vary from 12 to 20% - no argument there. To what extent the make up of global production is changing needs to be quantified. Is deep water not balanced by new on shore developments in ME and India?
I'd return to the crux of your whole argument which is that ME OPEC production has peaked and is now in decline. Given that they have just cut 4 mmbpd from their production to prop up oil prices, I find this argument weak.
Although if you subscribe to the "musical chairs" theory of current oil production (and I know you're sceptical), the real OPEC production cutback from sustainable production (as opposed to surged storage or refinery games) was perhaps 2mb/day or less. Perhaps a lot less.
At the end of the day none of us have enough "hard" data to be anything like sure of what's really going on but I've read virtually every single post by memmel on the subject and I know tanker tracking reports are included in his analysis, and I find his arguments credible. I also don't think the numbers produced by Matt Simmons should be just dismissed out of hand. That seems to come very close to directly calling Matt a liar at worst or lied to at best as he clearly believes his confidential figures to be "best in class". For clarification I'm not suggesting you or anyone else here is consciously calling Matt a liar but I'm curious how people who believe the official figures reconcile this with Simmons recent claims.
Memmel, how about writing a post summing up your current work in one post we could use as a reference?
Btw, WTI just risen above $51
I could certainly right a post but I think my approach uses the concept of and educated guess to the extreme.
For example on small part is that given the current total production figures and the historical rate new oil was brought online
the chances of a large surge leading to a new peak are vanishingly small. Especially given evidence of and accelerating decline rate.
Thus my opinion is that the global peak is absolute even a few years after the peak date. Next is the data quality issue one would expect that as long as production was relatively flat to growing that politically the desire to fudge the numbers is low indeed in general one would expect a bit extra to be pumped and skimmed off the top.
I bring up the bit extra because its important in the sense that officials probably cook the books a bit in exchange for various kickbacks
and other favors. Given the nature of most oil production one has to figure that a bit of theft occurs at multiple levels in these countries. Its probably semi-official. Indeed we know that in Nigeria and Iraq that oil is stolen by people and bandits these bandits would be selling whats called hot oil into and existing network capable buying and selling oil of dubious origin. In other words they would not steal oil unless there was and existing black market that could take delivery.
Now I don't believe the physical amounts of oil stolen in any given year are that large they do add up over 70 years of pumping but if I'm right about this then the reporting structure for oil is throughly corrupted. Thats the important point the figures have never generally been correct and a mechanism is in place to cook the book if needed. The two exception are Norway and the Soviet Union and for the Soviet Union the mechanism was blatant they had no reason to hide oil. Surprisingly both countries which have the minimum probability of cooking the books provide the best HL fit. You should note I left US and Britain of the list of countries which don't cook the books.
Given that its reasonable to assume that a historical mechanism thats semi-official exists to adjust the reported oil production to fit monetary goals historically to under report then one can assume that if it becomes necessary the same mechanism can be used to report first increasing credible production numbers then over report.
Now whats important using this train of thought is the big leap in production from 2000-2004 may have not really happened to the extent documented using my approach a lot of it was simply a matter of bringing off the book production on the books as political need outweighed personal gain. And of course additional mechanism to skim money even off on book flows exist so rising prices lowered the need to hide production.
No one really give a good reason for the existence of such massive over capacity for production so close to peak. Why on earth did we have almost 10mbpd of spare capacity in 2000 yet hit peak production a few years later ? I'd argue that this is probably not possible.
With my model the total spare capacity in 2000 is much lower 2-4mbd most probably in KSA some scattered around the world in mothballed projects. This is what I would consider a sensible amount. 10mbd is simply to much to be credible. Thus most of our original increase as prices rose was not a real production increase at all but simply and artifact of moving to more reliable book keeping globally as the need to cook the production books declined you get your flow of graft money off the rapidly rising revenue stream.
So my assumption that the books have always been cooked except in different directions fits well with the facts. I can not only explain the recent increase but also the last surge both where changes in book keeping. From 2000 it was backed by real oil and the latest one was pure imagination.
Now going further we obviously have and alternative explanation for the famous doglegs we see in HL plots they are for the most part a result of a change in book keeping procedure not a change in real oil flows but a decline in under reporting :)
This implies of course that the decades preceding the doglegs the numbers where systematically under reported. This further implies that over the last 70 years we have actually produced a lot more oil than the official records indicate. How much is unknown my best guess is at least 100GB it could well be higher. You could for example now look back at when the Saudi's cut their official shipment numbers to 3mbd in the 80's and yet the price of oil continued to drop. One wonders now how much of even that cut was real and how much accounting ?
I'd suggest that most of the cut at the time was a work of fiction and it was primarily a official coverup of massive diversion of the sharply lower oil revenue to the royal coffers.
So overall my assumption that oil production figures have always been fudged historically to the low side and just recently first to probably correct values as prices increased dramatically then eventually to pure paper barrels gives sufficient padding in the global oil supply to explain the relationship between prices and oil production since the start of the oil industry.
Or of course given the current news on financial matter one can assumer our world leaders are saints and are not going to lie one bit about and industry that generates billions of dollars of revenue anually with less oversight than the illict drug industry.
Take your pick.
Just to add I googled around for a historical record of tanker shipments which I don't have and hit on this excellent paper.
http://www.systemdynamics.org/conferences/1981/proceed/rande092.pdf
On page 20 you see a graph thats fits fairly well with my assumptions of systematic under reporting followed by over reporting of the
worlds oil supply.
And also you find a very good reason for the oil tanker fleet quite willing to look the other way when shipping cargo in the volatile
tanker market. The tanker market is in general desperate for cash.
Euan,
ME OPEC production has cut close to 4 mbd but a large amount of this cut would have been made anyway because irreversible damage may have occurred to their reservoirs by producing at overly high extraction rates. (extraction rate = annual production/remaining URR)
The chart below aggregates production from Saudi Arabia, Kuwait and the UAE. HL indicated 250 Gb or 290 Gb. The extraction rates for 250 Gb are too high so I'm assuming that 290 Gb is closer to the true figure, split as follows: Saudi Arabia, 185 Gb; Kuwait 60 Gb; and UAE 45 Gb. These three countries are called "OPEC core".
The extraction rates for 290 Gb are plotted for the years 2004 to 2009. It also appears that a trend extraction rate of 4.5 % is emerging and according to Tariq Shafiq, a petroleum engineer who was Vice President and Executive Director of the Iraq National Oil Company (INOC), an extraction rate of "4 to 5 % is well within good reservoir management practice for large fields."
http://www.mees.com/postedarticles/oped/a46n50d02.htm
OPEC core production in 2007 was 13.8 mbd and in 2008 it was higher at 14.6 mbd (EIA). This was probably achieved by OPEC core increasing its annual extraction rate from 4.5 % in 2007 to 5.0 % in 2008. My 2009 forecast for OPEC core is 12.9 mbd representing an extraction rate of 4.6 %. If OPEC core were to produce at an extraction rate of 5 % for 2009 then production would have been 14.0 mbd, representing a surplus capacity for OPEC core of 1.1 mbd.
If a 4.5 % extraction rate is appropriate and continues in the future for OPEC core then the decline rate for OPEC core going forward will also be 4.5% per year. In my forecast the extraction rate increases back up to 5 % by 2011 and stays around that level afterwards. My OPEC core production forecast for 2010 is an increase to 13.2 mbd (extraction rate increases to 4.9 %); 2011, 12.7 mbd (5.0 %); and 2012, 12.1 mbd (5.0 %).
As OPEC core produces well over 4 Gb per year their remaining reserves decrease which implies that their production capacity decreases over time while holding the extraction rate at 5 % per year.
click to enlarge
Well this is a pretty good paper on large fields its been discusses before.
http://www.tsl.uu.se/uhdsg/Publications/GOF_decline_Article.pdf
I think the best way to look at large fields in particular fields with peripheral water injection is to consider a field that has both increasing depletion rates and a large variance in depletion rate across the field as it ages. Treating and older field that undergone decades of water injection as homogeneous is probably not correct. One would expect large variations in the depletion rate as movement of the water front across the fields and into regions of high permeability will result in large pools of bypassed oil. These pool act more as a number of small fields and no longer as one giant field. Sort of like ocean currents in a region with a large number of islands vs the open ocean you get both variability and overall stronger currents.
Given this you could model them as fields that start with a very low depletion rate say 1% as it simply takes decades to develop out the above ground infrastructure the field depletion rate is initially constrained by its development rate. Lets say over time say 2-3 decades infrastructure is developed out and the field in its long midlife is developed at say a 3-5% depletion rate. Then as the field ages the depletion rate both starts increasing and varying across the field given that the above ground capacity is fixed effort to sustain production rates increase and thus the depletion rate increases. Water problems now begin to crop up in the field and portions become problematic. With side water drive the center of the field in general continues to deplete the oil in the region at 4-5% but of course more oil is being swept in from the exterior leading to say a real 5-10% depletion rate it could well be higher. A simple measure of the oil levels in the central regions indicates a low depletion rate as the oil column remains robust but this excludes the fact that oil is effectively entering the system from the surrounding regions.
Now of course the bypassed oil and other parts of the field can have high depletion rates similar to small fields in the 10%-15% range.
Overall production remains fairly high since your concentrating oil in the central region the rate drops as the size of this region shrinks but extensive know recovery methods can be used in other parts of the field to lower the production decline rate.
I could well be wrong about the depletion rate at the center even including oil entering the system it could still be low say 5-8%
it all depends on the permeability of the rock the viscosity of the oil etc. You need to know how fast the water front is moving and how well it sweeps the oil. If its moving 40% of the oil towards the producers from the outside the your real depletion rate is probably about twice your effective measured depletion rate as the wells are effectively getting recharged.
Eventually of course the depletion rate sky rockets as the water front moves against a smaller volume and producers rapidly water out and the oil column begins to drop rapidly. Water starts hitting the center this can be offest for a few years with extensive use of horizontal drilling but the depletion rate at this point is probably approaching 25%. Then the production rate declines dramatically the field goes into high water cut and the depletion rate drops back to a very low level say 2-3% for the remainder of the fields life as it becomes constrained by water handling facilities. You enter the 90% water cut regime.
For the paper I referenced in my opinion the timing and type and rate of water drive to maintain pressure in the field has a lot more to do with its production profile over time. Early use of water drive gives a longer plateau period in exchange of a slew of problems in the last half of the fields life. US water drive methods and those of the ME differ significantly.
Most will notice that I'm primarily talking about Ghawar but we have a smaller field that has been documented to have almost exactly the behavior I've described.
http://www.spe.org/atce/2006/technical/documents/spe1024191.pdf
And here
http://www.kgu.or.kr/admin/data/P-000/7f7cef0342c9a02ef22bb44c8dc47f85.pdf
FractionalFlow could both blow this idea out of the water and if its valid figure out the real depletion rates.
Edwin Black has published a book called The Plan which is a detailed scheme for responding to an oil shock. The link is my review of it from last October.
I wonder what the peak net energy curve from these liquids would look like. Factoring in the effects of EROI, e.g. much lower values for non-conventional liquids and newer conventional liquids, wouldn't the peak of energy have occurred much before 2005 even? EROI Guy? Any work going on at SUNY-ESF on this???
Question Everything
George
Yes, please, this would be most interesting to see, even given all the approximation and guesstimates necessary.
I don't think this is particularly interesting. Oil demand and supply peaked as the recession kicked in. Why make something else out of it?
Actually, one key metric, the volume of (net) exported oil, probably peaked in 2005 (at least for the top five), although we don't have the 2008 data yet. This paper has a graph showing oil prices versus the volume of net oil exports from the top five net oil exporters (EIA, with an estimate for 2008):
http://www.energybulletin.net/node/47541
Although we will probably see a year over year increase in net exports in 2008, versus 2007, we have seen that before in areas in terminal decline, e.g., Indonesia, which had a final production peak in 1996. In just two years, by the end of 1998, they had shipped 44% of their post-1996 cumulative net oil exports--despite the fact that they showed a year over year increase in net oil exports in 1998.
Also, as noted up the thread, we have seen a cumulative shortfall in production, relative to 2005, versus what we actually produced, in response to higher prices.
But if you prefer to believe that we can have an infinite rate of increase in our consumption of a finite fossil fuel resource base, I hope you are right, but I suspect the odds are against you.
From Rembrandts post Oilwatch Monthly yesterday:
(Slight new all time high in net exports for both OPEC and overall. Subject to revision.)
In 2005 US exports of crude and refined product ran at about 1 million barrels/day (the historical average). In 2008 that had shot-up to about 2 million barrels/day playing havoc with the EIA's weekly estimates - "This Week In Petroleum" is garbage at the moment because of this (see Gail's recent post Can you believe EIA Weekly petroleum demand estimates - and that's just US data!)
One hypothetical scenario could have an oil exporting country or group increase their own crude exports (and apparent production) by 1mb/day but buy in an additional 1mb/day of refined product which they previously refined from their own crude now being exported. It would take some time to untangle all this especially with third parties in between the US and eventual destination and in fact the particular US exports wouldn't even have to go to the oil producing country as they could be buying anywhere.
I suspect that there's some compensating revisions to the rest of the world to come and they'll blow away that 2008 apparent peak without needing any help from Simmons.
As Mark Twain, et al noted, "Lies, Damn Lies and Statistics."
All of these numbers are to some degree estimates, but there are "estimates" and there are "estimates." I haven't double checked the math, especially since I am primarily focused on the top five, but the data table that Datamunger did (no particular fan of my work, I might add), based on EIA data, showed declines in total net oil exports in 2006 and 2007, relative to 2005.
In any case, as noted, my particular emphasis is on the top five (which account for about half of total world net oil exports), and I suspect that the EIA will show a top five increase in 2008, over their 2007 rate. But as discussed up the thread, an increase in production, and an increase in net oil exports, means that the top five exporters are accelerating the rate at which they deplete their post-2005 cumulative net oil exports.
From the oil price article, linked uptop:
When Indonesia showed a fairly substantial year over year increase in net oil exports in 1998 (+6.5%/year), the rate at which they depleted their remaining cumulative net oil exports went from 22% in 1997 to 28% in 1998. Not exactly a reason for celebration.
Edit: Datamunger summed the 2005, 2006 and 2007 net oil exports from all countries showing net oil exports (EIA). I went back and double checked the top 10 net oil exporters in 2005 (Saudi Arabia, Russia, Norway, Iran, UAE, Kuwait, Nigeria, Venezuela, Algeria and Mexico--collectively about three-fourths of total 2005 net oil exports) and this is what I came up with:
2005: 34.3 mbpd
2006: 33.3
2007: 31.9
http://tonto.eia.doe.gov/country/index.cfm
Here is Datamunger's table for total world net oil exports. Some of these numbers have changed slightly as the EIA revised their data tables, e.g., the EIA now shows 31.9 mbpd for the (2005) top 10 in 2007, versus 31.7 mbpd when Datamunger did the table.
http://farm4.static.flickr.com/3295/2539971459_7436b0d7d2_o.jpg
We shall have to see what the EIA comes up with for 2008. Like the top five, I expect to see an increase in total net oil exports over the 2007 rate, to a level below the 2005 rate, but we shall see.
The lights that shone the brightest may dim the fastest. Short term I'd guess we'll see a slowing in growth of exporting countries - hell they must be hurting right now. Hence a slowing if not a decline in their oil consumption, near term.
If oil price rises again, then of course this will reverse. Volatility and unpredictability will be the order of the future.
Easy answer mkkby: some of have no life outside of TOD. If it weren't for postualting the exact timing of PO there would be no reason for me to get out of bed every morning. Please understand that this thread is the sole reason for the existance of some of us.
Speak for yourself. I exist to debate Net Oil Exports.
Hey WT...my PO timing can beat up your NOE any day of the week. NAAAAA!
My early cup of coffee was interupted by a big black snake slithering across my kitchen floor. "That shouldn't be there", thaught I.
This is how I watch this site.
With wide eyed facination.
Don't you mean a big black SWAN? - the Gaussian is not ubiquitous in reality.
I know the Black Swan is a TOD in-joke, but I've been trying to think of a good pop culture reference for a "Hey, that never happened before" event. Aliens landing is too obvious.
It's a mathematical concept, related to statistics: http://en.wikipedia.org/wiki/Black_swan_theory
As for everyday examples... Perhaps a comet hitting the Earth. Yes, it's out there, but by definition a black swan event is not everyday, despite having a small chance of occurring.
Several pop culture analogies to The Black Swan come to mind:
1. The "unknown unknowns" popularized by Donald Rumsfeld.
2. "The first rule of Fight Club is: you do not talk about Fight Club" aka "Whocoodanode?"
3. "Wherever you go, there you are". (this one is very abstract)
4. "What were you expecting? The Spanish Inquisition?"
I have to apologize profusely for the last one, as it is usually followed by a link to a YouTube video, which I will refrain from posting.
I like that one the best, but maybe that's just because I'm a Python fan. :)
"No one espects the Spanish Inquisition!"
If in April 2008 some one had told that a year later I would be sitting in front of a computer screen slowly digesting every word of a debate about oil production figures… well I would done more than merely laugh at them I would have tried to have them committed.
I would have thought - well, its finally time I got off by butt and back to school.
Well, as "Matt" says above, reliance on the conventional wisdom that the peak is 20 years away can lead to bad consequences. I see this as a contribution to the body of evidence and argument that the peak is in the past - that the Earth is post peak. The conventional wisdom needs to shift to something like: "Next year's petroleum supplies will be less than this year's supply."
Actually, the conventional wisdom needs to shift to: "Next year, we are going to need to make even tougher choices. Do we spend the shrinking amount of GDP we have available on new oil production to offset depletion? Or do we spend it on more renewables? Or do we spend it on electrified rail transport? Or do we spend it on "everything else", like food, shelter, education, and medical care?"
Unfortunately, the US has proven itself to be spectacularly incapable of making thses kinds of choices.
You'd better hope this isn't the final oil production peak! Someday there will be (was?) a final peak and a new way of living will be required, at least in OECD countries!
Economic growth as we have known it requires growth in the use of affordable oil. Things like banking, pensions and party political democracy require economic growth.
Oil production peaking means recession ... recession means oil production peaking ... which is the cause and which is the effect? The answer is very important, bear in mind that denial of a new situation (such as yours and our leaders) is normal, but may be wrong.
The available statistics indicate this recession was caused by both limits in the supply of affordable crude oil (over a number of years) and an out of control banking system.
I think this is a valid question.
I expect that the answer to this lies in the answer to the question:
Q. Can we easily increase supply to meet the demand once economies start to recover as we have done in the past?
-If the answer to this question is "yes" then we will see a nice recovery going forward probably followed by X years of expansion/fun&games -i.e. BAU / past experiance of a recession.
-However, if the answer is "no", that we have reached/past 'easy_oil_peak' or are shortly to do so then the recovery will quickly hit a supply induced limit, we will see rapidly escalating prices, little, or falling supply and eventually another recession or worse Energy induced Depression.
So take your pick but personally I think its very interesting to speculate as the future is where I intend to spend most of my life...
Just look at oil prices go! Breach of $50 on the cards?? (18.39 GMT): Tony/ace: wot have you done!
Nick.
Unfortunately, that "recovery" that the BAU/CW people are expecting might never come. Without a full recovery, and thus resumption of the exponential growth trend, the economy cannot generate the investment capital needed to even replace what is lost by depletion, let alone nudge the total trend back upwards. It doesn't matter how much is still in the ground, if the economy isn't growing then what matters is how much money we can spend on megaprojects. That will determine how steep the decline rate becomes.
I don't expect the "recovery" to ever come, since the current recession is peak oil induced. The higher prices of oil started the credit unwind. There is no reason for the credit unwind to stop, unless growth somehow growth restarts. But the credit unwind removes a huge amount of demand. At most we will get a temporary economic uptick, prices will soar again, and the recovery will stall, and the unwind will continue.
I disagree on one that the credit unwind removes a huge amount of demand. I'm not about to replicate the entire argument about demand and the recession but my understanding is you generally agree. Decline in housing construction lead demand downward then the final hit second half of 2008. After this I argue demand tends to flat or slowly rising/slow decline.
The argument is simple it takes just as much gasoline to drive to McDonald's to flip buggers as it does to drive to work selling subprime loans for 200k a year. We can continue to see significant overall economic decline but once pleasure driving is eliminated further reductions in oil usage become increasingly difficult.
I'd suggest that the decline in demand is now in the past and I don't expect future demand to be much different from today until oil prices are substantially higher and by substantially well past 200 a barrel.
Its my plate of jello demand model :)
The top level demand is like jello and easily squished this is the initial rapid decline and represents generally causual use.
Under neath is the plate that will resist until it shatters. This is generally oil used in performing work to make money or looking
for work. It cannot be easily destructed.
I do not feel that we will get and economic uptick before we see high prices return. I think the economy will continue to decline but we will see the data continue to show demand is flat and this will continue as oil prices increase.
Eventually the oil prices will reach a high enough level that we enter a energy lead depression. So I expect a steep L shaped recession with no recovery followed by a energy price driven depression.
Hmmm....based on this line of reasoning (which I think is sound), I think I'm going to modify my Economic Staircase graph to have a larger second step:
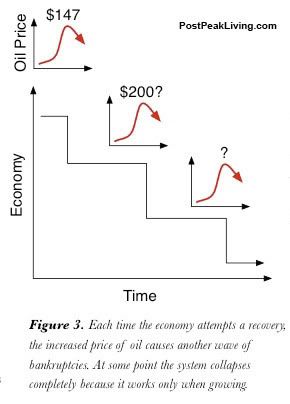
Right I think thats sound.
Its basically a three stage process.
1.) Inability to use debt to borrow from future earnings i.e end of growth with resources playing the role of capping the growth rate.
Various required resources peak or reach maximum production rate with oil obviously being a easy big one. Partial substitution via coal and Natural Gas can extend the time period over which this period is reached but as we have seen the growth in debt ensures that the growth economy peaks. If debt expansion peaks early then you have a recession followed by a resumption of growth. Thus the debt based growth economy repeatedly tests the bounds of resource allocation. This by no means requires oil to be a limiting factor other factors even available labor supply can cause growth to stall and retrench then renew. The key point is the growth economy is always seeking the limits of growth. Eventually it will hit a hard limit we argue that this is oil and we reached step one.
2.) The growth economy goes through a L shaped recession as debt is defaulted this is quite different from the original Depression where bank failure resulted in deposits or stored value being wiped out. The vast majority of the debt is in the form of real estate or building and liens on companies so its a decline in the future value of a lot of fixed assets as the ability of anyone able to pay for them declines. This is a massive contraction in long term debt and given the size of the debt bubble it will go on for decades.
At this point resource limits ensures that there is simply no way out of the recession and the "real" or daily economy becomes stagnant with ever rising resource prices esp of course oil. We continue BAU but daily living costs eat a larger and larger fraction of our total income i.e we spend a larger and larger precentage of our wages on food and energy. The ability to take on long term debt drops even faster than asset asking prices of assets that require long term debt. What this means is we should see a permanently high inventory of homes for sale for the next several decades well past when other forces come into play. Eventually the maintenance/taxes costs will override any price for the structures i.e even if they are free they are not worth having. You can be sure that the property taxes will soon be marked to model :) Now during phase II a critical part is the ability of people to live in denser living arrangements and of course this is easily possible so either housing costs fall dramatically or people will live in cheaper housing at denser levels or both.
You can see that the overbuilding we have had the last several decades makes it possible to adjust your shelter costs to offset higher food and energy costs. This is about the only gain in real wealth we got from the decades long global building boom. Its critical for phase two that lowering housing costs is possible and results in resiliency agianst rising food and energy prices. Given that the minimum base housing costs in most areas is 100-400 per working adult and we now often pay in the 500-2000 range per adult in the US you have plenty of room here to reduce housing expenses and absorb higher living costs. In fact its surprisingly high 200-400 a barrel is quite reasonable with the only real effect being that people with reasonable or no mortgages take on renters and people way underwater default.
Paradoxically I think a increasing number of homes for sale will be empty as they are not marked down fast enough to find a market. New rental inventory via people renting rooms and renters doubling up or moving back with their parents moves faster than the excess inventory can be repriced to be cleared. Falling rents as we get a flood of rooms for rent makes it impossible for landlords to cashflow for long. This is a Detroit level housing crash over most of the US with most cities having a number of decent homes offered for 4 dollars a sqft or basically the 5-10k clearing prices we see in Detroit. This will only work to smash rents down further.
Sorry to go on so long about housing but the next few years will be about basics food clothing shelter and energy. Clothing should remain cheap and second hand shops should flourish so I don't see clothing costs being a factor. This leaves shelter taking the brunt of the declines and we have plenty of buildings.
3.) Starts when further declines in shelter costs are no longer possible heating cooling and maintenance and marked to model taxes now take 50% or more of shelter costs for most people. Reducing the cost of the physical shelter no longer results in any significant gains.
I'd suggest we know this number fairly well and its the same 100-400 but shifted down slightly so once house payments reach say 200-300 a month on average further declines are not going to give a lot more cash flow. This implies that the median home price has fallen into the 50k range from its current 200k or a 75% drop. Btw this is a perfect match with the the average difference between Detroit asking prices and selling prices. Certainly housing prices can drop a bit more but your now talking about a change of say 20% on a payment of 400 dollars. Taking in a renter for 50 a month and part of the utilities offers similar cash flow. You simply cannot get a lot more out of reduced housing costs at this point.
Now finally and in my opinion only at this point does the final step start taking place and we are unable to mitigate high oil prices via reducing housing costs. Only at this point will we see suburbia abandoned. Notice its value is now effectively zero and only by moving back toward the town centers can we reduce expenses in energy. The population has already adopted denser living conditions and a 1 bdrm apt without renters looks great compared to a SFH with renters needed to cover utilities. I'm not saying that this migration won't start sooner but the outright abandonment of suburbia for the town centers only happens once we have fully devalued the structures. Early migration will be part of the devaluation process but only part. As far as inner city prices for housing they are constrained by the value they add over energy costs in suburbia. There is enough of a differential and demand at this point that building high rise apts are profitable. Labor costs are low raw material costs should be low with recycled suburban housing and cars potentially providing a lot of the raw materials. Plenty of cheap labor to recycle. Not quite as clean as the ancients stealing building stone from older buildings but effectively the same.
And also now only at this point in my opinion will local agriculture begin to become prominent. I think industrial agriculture will hold out much longer then most people will expect since they can pass on costs. Also I expect land prices to be sticky for a while making creating a small farm that cash flows prohibitive along with labor costs. The mega farms can compete with cheap labor also.
We can get into this in detail but I don't expect food costs to moderate over most of this time period. Only once subsistence farming is reasonably possible will we see food prices start to moderate I believe that we will have to abandon suburbia first thus freeing up land that can be reclaimed before local farming can compete with our current agricultural system. Not to mention we need to recreate the infrastructure for local farming. Needless to say buying any farm with a mortgage is dubious.
Anyway thats enough :)
Here is a chart below updated for the recent IEA OMR March report.
http://omrpublic.iea.org/
click to enlarge
It appears that OPEC cuts seem to be working as oil supply in February was 83.9 mbd which was slightly less than 2009Q1 demand of 84.5 mbd. If demand remains as forecast by the IEA below and OPEC cuts all of the 4.2 mbd then prices should continue increasing.
Thanks for (ignorantly unintentional) supporting the oil shock model. Dips due to effects like demand destruction do provide suppression of the peak, but the production flow is still great enough that a long-enough interval of this behavior will prevent the production from bouncing back up -- unless extraction rates are increased way up to make up for the lost time. And that is clearly not sustainable. So the recession is more of a short-term modulator than a permanent kick-in-the-pants. Only during the 70's and 80's did we recover from a suppresive shock, and that had to do with a large reserve base.
I find this very interesting, as it comes out in the math. If you can intuit this, well, more power to you. But we do like to perform a rigorous analysis here, as no one else seems to do that.
"I don't think the details of credit default swaps are particularly interesting, the damage is done, move on" (excuse me for the sarcasm)
Nice post.
We had developed a similar point of view a few months ago : When We Are At The Peak (in French), with links to what's for us THE reference document: Forecasts of liquids production assuming strong economics constraints (Laherrère, Wingert, 2008) issued by ASPO-France last fall.
Nice sinusoidal curves, Aerobar.
(Dare I say it?) Very French.
I envisage chaos theory where we have self similar shapes,in a range of scale, that eventualy settle into a different steady state.
Here's the BabelFish translation of When We Are At The Peak in English
I tried.
It lost something in the translation.
Personally, no offense to ROCKMAN or WestTexas, but I'm far more interested in Peak Exports than Peak Production. Increasing production is of little use (to me or the economy I live in) if its consumed internally in the producing nations. 2005's my bet on that.
And I'm more interested in rig count. If this trend continues, I will have even more time to read TOD. I can't take it!
yeah, and I'm more interested in what on earth will substitute "the one time pick - readymade to use and energydense substances" also called fossil-fuels ...
...... when it dwindles or is thinned out enough !
cornflakes, heaploads of Kellog's maybe ?
Isn't this just showing limits in the demand side due to the recent global economic problems? Based on this logic, if there was a mass extinction of humans in 1950, peak oil would have occurred in 1950 because that is the year of peak production. That wouldnt really tell us much about supply capacity. I have a feeling that if you put this graph next to world GDP growth there would be many similarities.
Arent we all more interested in peak supply capacity? I know this is virtually impossible due to the lies from the Fremen in the middle east.
Something like this, when oil supply stopped responding to oil prices?
I guess you are new to peak oil sites. Welcome, I hope you like graphs.
Does that graph include all types of liquids? It could be the case that oil production is simply replaced with other sources of energy such as bio fuel and tar sands.
I agree with what you say here. Rune posted this chart yesterday:
I'm guessing recession started in the OECD around 2005. Looking forward, with static supply, the OECD can look forward to accessing an ever lower share of global oil supplies. Efficiency measures can help a lot near term. When supply eventually starts to fall - after the real peak (which may not coincide with maximum production), then I still fully expect all hell to break lose. I don't think we are there yet - if the financial system survives.
This is a very interesting chart, it looks like demand started to drop when oil hit about 65$ per barrel. Were almost back up to $50 now.
Its a great chart. You should read what Rune wrote:
http://europe.theoildrum.com/node/5202#comment-482926
Its a bit more complex, since it was 2005 that production stopped growing, and since non-OECD consumption continued to rise, the OECD consumption had to fall - and the bidding war began.
I'm more interested in when we might have to start worrying about this final sentence:
I feel more like calling my kids than going back to my desk.
From what I have read of the 1930s the real reason for ongoing hardship was not the financial stuff that took place but the imposition of restrictions on trade due to the 'Smoot Hawley Tariffs Act': http://en.wikipedia.org/wiki/Smoot-Hawley_Tariff_Act
1028 Economists said it was a bad idea, signed a petition against it, but did they listen?? Today we have a far more interconnected world than back then that is very very dependant on globalisation and those countries 'at the top of the food chain' would do well to remember this.
The price mechanism is going to see rich counties bidding up the oil price in a depleting supply scenario but IMO because their consumption is also great there will be a limit to the extent they can do this without running enormous deficits. In the 'early years' post-PO (2005?-2015?) these deficits may mushroom to extrordinary proportions as countries simply believe that they will be able to pay them off from future revenues but when it becomes more clear that they will struggle to pay back debt its likely that lenders will become more reluctant to lend and thus Gilt Yields will have to soar to attract money to pay for energy imports. I'm not an economist but would like to hear from any that have an opinion on the likely scenarios so I'm with you on this: the debate of exactly when is less interesting to me than what to look out for and what to expect as a result.
Regards, Nick.
Thanks for the link. Lots of connections like GATT and Bretton Woods. I wonder what the next international trade agreement will look like.
Hello Sterling925,
Your Question: I wonder what the next international trade agreement will look like?
So far, it may be headed into rampant protectionism:
http://www.nytimes.com/2009/03/17/business/worldbusiness/17fobriefs-TARI...
------------------------------------
Mexico placed tariffs on about 90 American products after the United States restricted Mexican trucking, said the country’s economic minister, Gerardo Ruiz Mateos. The measure was taken “for the incompliance of the country in its agreements regarding transport under the North American Free Trade Agreement,” Mr. Ruiz, left, said. “That is what is commonly known as measures of retaliation.”
-----------------------------------
This is not a good economic sign if this starts spreading all over.
Hello TODers,
Quote from the very top: "As everyone knows, there is never a post on The Oil Drum that the entire staff agrees on. Nonetheless, Tony bases his findings on solid research, and a staff survey shows that most agree with a 2008 peak."
IF TOD staff has indeed reached a consensus:
I would hope that we now soon see Official Critiques of this keypost by the EIA, IEA, USGS/MMS, DOE, CERA/IHS, ARAMCO, OPEC, CIA/NSA, XOM, BP, GAZPROM, Russian Govt, Chinese Govt, IMF, World Bank, United Nations, et al.
Pro or Con, it would be informative. I just want to read what they think of this keypost; where we have common ground or divergence.
No pseudonyms, but SIGNED documents on Official Letterheads sent to TOD Headquarters in a format suitable for posting online for all to read.
It would also be interesting to see what institutions decide to ignore us, too. We could then start emailing them asking for an official reply.
We TODers have been analyzing this Peakoil situation for years [some members for decades]. I think we are ready to instructively debate/defend an opposing view from one of these organizations.
Totoneila,
I have just sent emails of my story link to key people from the EIA and IEA.
EIA email addresses:
john.staub@eia.doe.gov; lauren.mayne@eia.doe.gov; the.secretary@hq.doe.gov; john.conti@eia.doe.gov; howard.gruenspecht@eia.doe.gov
IEA email addresses:
david.fyfe@iea.org; eppd@iea.org; nobuo.tanaka@iea.org; anne.mayne@iea.org; richard.jones@iea.org; julius.walker@iea.org; fatih.birol@iea.org; ieapressoffice@iea.org; weo@iea.org; energypolicyinfo@iea.org; stats@iea.org
Hello Ace,
Thxs for the reply. Excellent, I will look forward to their response.
What I would really like to see is ARAMCO stating your analysis is wrong, then OPEC & KSA's topdogs inviting Simmons and notable others to do a full audit. IMO, the absence of an invite is telling.
Occasionally, I still google around trying to find an accidental release of ARAMCO's latest GIGAPOWERS oil-sat simulation-graphics done on their latest and greatest massively-parallel supercomputer...
We might get lucky one more time.
Was May 2005 the Peak Month for Conventional Oil ?
Excluding NGL & tar sands (but including condensate because that is often aggregated in statitics).
Or was it July 2008 ?
Thanks,
Alan
Nick,
I am with you on this one. When isn't nearly as important when the actual peak occurs but were in the process we are, what signposts to watch for, the outcome from them that they will generate and any decline cycles and cascading failures of systems that this will generate. Additionally, the amount of time that these process will take before it really hits the fan.
Basically, one has to take the stats and add the socio-political and socio-economic to them to come up with any reasonable answers as to what will happen. Personally, I find that TOD discussions get stuck in the technical and forget this very important side. Man and his behaviour is the real wild card in all of this and not what CAN BE accomplished before or during depletion.
The stats are interesting; however, they definitely aren't my area of expertise so I have to rely on those of you with these skills to add them to my perspective. I can’t argue them or add any thing relevant; however, I can remind and try to add this other side to the discussion. These stats are based on a very streamline approach without taking into socio considerations such as China's recent move to snap up resources. Wasn't that somewhere around $52 billion in fire sales to secure future resources?! This could definitely be one of the wildcard behaviours and have tremendous impact on what occurs in other countries. At the very least, it is an interesting move and should raises concerns about future access to product for any other importers. Just because the oil is still out there it doesn't mean that we will be able to access it whether through contracts or economics. This would much more rapidly move us into post peak declines and generate very different stats and charts for certain regions and countries. While it can currently be argued that this type of move is only a potential, given the strategic moves that have been made in the last year by various countries, it is only smart to count on this type of behaviour will occur and plan/theorize accordingly. Somehow this has to be added into the discussions and the charts.
The signs of "classical" geological peak oil are: high utilisation of drilling equipment and crew shortages, accelerating investment in new drilling equipment and supply backlogs, an increasing number of producing wells, and flat or declining total production.
Mostly the signs can only be seen in the rearview mirror, at a distance of several years. We need to wait till 2012 or so, before calling peak oil in 2005 (mutatis mutandis for other years). And of course the current episode of looting by the bankers blurs the view somewhat.
As the world economy switches a greater proportion of industrial output to obtaining fuels, a smaller proportion will be left for private consumption and services such as health care and education, and for maintenance of infrastructure. International competition for resources will intensify also. (Note: heavy use of euphemisms in this paragraph.)
It is interesting that we seem to be experiencing the effects without the signs being present. Perhaps this is "Keynesian" peak oil. ;-)
Greg
Yeast 1 Humans 0 (own goal)
As far as when its in rearview mirror. I'd suggest the earliest will be second half of 2009 latest 2011 I cant see a need to wait till 2012.
When we are down over 5mbd say 6mbd nothing on earth will ever result in us recovering. We simply cannot physically bring 6mbd of oil online in a single year. Thats it the party is over. I actually use the narrower and more realistic 4mbd of admitted decline since thats impossible. A tight measure is 3mbd at that point its a horse race if we could recover. If we peaked in 2005 all of these would become true before 2012.
I was merely allowing for the fact that figures have been revised up to three years later. True, generally downwards, but hey, the other way isn't impossible.
True, what can be accomplished in the time remaining is interesting but almost irrelevant, in my view. As we have been hashing out for days and days on the Drumbeat, none of the wonderful ideas that could be executed are even being considered. By the time there is the collective realization that electrified railroads, more public transportation, etc. are really good ideas, the game will be mostly lost (again, in my view).
And, if what Mike distinguishes is actually the case (that we are in year four past the peak), events are soon going to accelerate and run away from us. We might be toward the end of our buffer period.
As for your point about human behavior, I'll add another to the list: when will the willingness to commit to long term investments simply whither away to nothing? When will the stock market reflect the true value of companies whose future is simply to shrink until, as a friend puts it, once grand companies like Hewlett-Packard are reduced to a corner store?
The impact of reduced energy availability on the investment market will be profound. Hopefully we'll all be too busy weeding our gardens to notice, but somehow I don't think so.
Been a while since I told my "Julia Roberts" story.
In October, 2007, I debated Michael Economides regarding Peak Oil at Texas A&M. I asserted that we were probably past peak crude production; Economides asserted that it was a long way down the road.
I put up a slide showing Saudi production down in 2006 and the early part of 2007. He asserted that Saudi production was up in 2006, not down. Economides put up a slide showing production increasing. I replied that I didn't know where his data came from, but the EIA showed Saudi production to be down. He said his data came from the EIA. I offered to bet him $1,000 that I could produce an EIA data table showing that 2006 Saudi production was below their 2005 rate. He quietly replied that he was talking about "Productive Capacity," (we were sitting next to each other). I asked him to speak a little louder, so that the audience could hear, which he did.
I then told the audience that I was theoretically capable of dating Julia Roberts, but what is the probability that she would say yes if I dialed her up and asked for a date for Saturday night. Economides replied that he had actually dated Julia Roberts.
In any case, right up to the point that he was looking at having to write a $1,000 check, he insisted that productive capacity was equal to actual production.
BTW, as we all know, CERA is one of the leading proponents of "Productive Capacity." Someone wrote an article not long ago which noted that CERA had been unable to even accurately predict future North Sea production--one of the most open and transparent producing regions in the world.
Jeffery,
I'm a convert to the notion of an extended bumpy plateau, well illustrated by this chart, posted by Gail and attributed to William Tamblyn.
I'm also a convert to the notion of production capacity and spare capacity.
And I'm also a convert to the notion of above ground factors - especially since above ground factors by way of recession threatens future oil supplies.
So these are all concepts promoted by CERA. Where CERA erred, IMO was in:
1) not accounting for ERoEI
2) underestimating the price for oil that the world can afford to pay - but that has yet to be proven
3) being over-optimistic in their assessments of production capacity
Euan,
I think we've been lied to (and if Simmons figures are really the IEA politically unacceptable but real data then I understand his frustration). It sucks but that's what I fear.
Here's hoping you're right about 2012 potential peak and current spare capacity as it delays WWIII by seven years and we might even get to 2020! Can't even bring myself to add the smiley here even though I really hope I'm still being cynical...
Seems Russia intends to be ready long before that.
Russia Plans Nuclear-Weapon Improvements
On the bright side the world will solve all problems by building 3 major nuclear power stations a month for the next 40 years according to Gordon Brown today.
I first debated this topic (in a Q&A) with Scott Tinker, the Texas State Geologist, who gave a presentation in Dallas in 2005. He basically presented the CERA "Plateau" model. In the Q&A, I pointed out that we had seen sharp peaks in Texas and overall Lower 48 production, so why shouldn't we see the same with world production?
He said that Hubbert type mathematical modeling works well with geographically limited discrete regions, but not with the world (I didn't get a chance to ask a followup question as to why he considered the world not to be "geographically limited"). He also went on to add that while "We may not be able to match the Texas peak production rate, we can significantly increase production, with the use of improved technology." (So, we sprinkle magic Pixie Dust, and a miracle occurs?). The problem I have with this argument is that we haven't seen any sign of the Pixie Dust working in areas like Texas and the North Sea--two areas developed by private companies, using the best available technology, with virtually no restrictions on drilling. Of course, we don't stop finding new oil fields, but we can't--so far--offset the declines from the older, larger fields. This is the same problem I have with CERA's model.
I realize that you are talking about something different from CERA's hallucinations, but the problem that I have with projecting an extended bumpy plateau is that it is the sum of producing regions that generally look like Texas and the North Sea.
errr, Why do I find that hard to believe?
His wife is not bad looking
http://www.pe.tamu.edu/economides/index.html
(Pet E engineering professor at Texas a&m)
And Julia did marry Lyle Lovett at one time.
Best Hopes for women that look beyond looks,
Alan
LOL! Great find-->evidently he refused to listen to his wife talking to him about Peakoil with her PHD in "expertise in reservoir engineering, pressure transient analysis, integrated reservoir characterization, complex well design, and production enhancement". That's too funny!
maybe he "dated" julia roberts "in absentia"
That must be "dated" in the same sense as a work of art or an archaeological artifact would be "dated". IOW, he looked up her birth date.
Iraq alone can cover a 6-8 million bpd loss in the next 10 years. Also, Russia and Iran are only experiencing lower production because of unintelligent investment. It doesn't mean they don't have oil or can't produce it if they wanted to.
Anas,
Russia has already stated officially that its oil production is in decline. Even the optimistic EIA is forecasting declining Russian liquids production from 9.79 mbd in 2008 to 9.43 mbd in 2010.
http://www.eia.doe.gov/emeu/steo/pub/3btab.pdf
Iran does have some potential, maybe another 1.5 mbd, if it could get more investment but it seems more likely that Iran will probably produce around 4 mbd crude and condensate for the next several years.
Iraq has huge geological potential. In 2008, Iraq produced 2.36 mbd crude and condensate (EIA). In a non-constrained production ramp up, Iraq might be able to produce almost 6 mbd more to reach an 8 mbd peak plateau as shown below.
However, Iraq needs to resolve petroleum law issues with Kurdistan and also needs more infrastructure investment to reach even 4.5 mbd. Colin Campbell's recent forecast is a 2.65 mbd plateau. My forecast is that Iraq will reach 3.4 mbd by 2013.
click to enlarge
Iraq's oil production target in 2004 was to reach 3 mbd. In 2008, it fell short of this target by 0.6 mbd.
http://www.rebuild-iraq-expo.com/newsdetails05.asp?id=4220
Iraq's official oil target is now 4.5 mbd by 2012.
http://www.rebuild-iraq-expo.com/newsdetails05.asp?id=4220
Thank you for the useful information.
You seem pretty resourceful so I'm going to try and milk some info here. You wouldn't happen to have any information regarding potential arctic reserves? Any information would be very helpful.
Hi Anas,
This guest post by Jean Laherrere on the Oil Drum should be helpful.
Arctic Oil and Gas Ultimates
http://europe.theoildrum.com/node/3666
Iraq is a interesting case in many ways its a sort of Saudi Arabia in miniature with a lot of questionable information about its reserves.
A while back when Robert and WT where having there spat over Texas and HL I took a look at it and came to a surprising conclusion.
Everything seemed to point to about 10GB of oil being produced that was unaccounted for. A tremendous amount of illicit oil was produced in Texas and never entered into the official production numbers. I might add this is also a lot of cash thats never been properly accounted for.
Both Iraq and Iran also showed the same symptoms sings that real production had been much higher than the official numbers indicated.
I think the British also stole and enormous amount of oil on a similar scale but larger to the tune of 10GB in Iraq and 10GB in Iran.
It could well be more. Later on you get hits of similar oil theft under Saddam in Iraq and under the Religious government in Iran.
For Iraq as much as 20GB of oil may have been extracted undocumented.
A similar number is possible for Iran.
Even Saudi Arabia has hints of similar thefts.
Now whats really fascinating is if Britian and the US looted about 50GB or so of oil then both countries would have enormous hidden cash flows to use for any purpose they chose such looting could only happen with the government involved. These undocumented war chests could fund any number of covert operations bribes or other disruptive behavior anywhere in the world.
Think Iran-Contra on steroids.
Now whats really cool is that this covert war chest fits very well with what we read from history. This unfettered money uncontrolled by the voters and effectively untraceable can readily explain the power behind both Britain and the US since the 1930's.
Back on track of course this implies that Iraq is probably much closer to peak if you assume the real extraction is 33+(20-40??) GB of oil. I'd guess that a maximum production rate of 4mbd is probably all they will ever see. Iran would I believe be past peak production.
The way to see it is to look into early oil production and HL fit the various regions during the ramp up phase. You get indications that production was never really suppressed it was stolen.
Stealing oil from Iraq is much harder than it seems as Iraq's port infrastructure, and I know this for a fact, is only large enough to handle a little less than 3 million barrels a day. The southern region, where it would have been easier for the Brits to steal from, therefore is not a viable option and the theory seems a little far fetched.
That doesn't mean oil isn't being stolen. On average, Iraq loses a number, well into the hundreds of thousands, of barrels per day. This oil is however trucked to neighboring countries and is not exported in large volumes.
The only other way any one could steal oil from Iraq is through the northern part of the strategic pipeline that goes into Turkey. That option is also not viable as someone would have noticed the extra flow of oil into Turkey.
Iran on the other hand has an enormous exporting capacity, well beyond that of its production capacity and therefore, it would be very possible, that oil is still being secretly stolen or sold via Iran. (could serve to Iran's agenda by not publicizing how much money they actually make.)
Tom Whipple quotes Russia’s Deputy Prime Minster, who is also attending the OPEC meeting, told reporters that Russia will cut oil exports and increase domestic oil consumption in an effort to support world prices.
Is this a decision or an outcome? Westexas, what say ye?
Door #2 regarding Russia, and I think that a lot of involuntary production declines are going to be masked, at least for a while, by declining demand. Then the question is how long demand stays down.
Total new vehicle production worldwide was about 73 million in 2007. If sales drop to about 60 million this year and stay there, we would still be looking at a quarter billion new vehicles worldwide by the end of 2012, which would basically add a whole new US in terms of total vehicles (the net increase would be gross sales less vehicles that are scrapped).
"Once global economic growth returns causing increased oil demand, there is a risk that oil importing countries could act aggressively for their own self interests rather than cooperating to manage oil consumption in the context of declining world oil production."
This prediction may or may not come true. However, one thing is absolutely certain, if the Global Warming/Climate Change nonsense continues and draconian measures are taken to constrain the use of so called "dirty" fuel sources, such as coal, in the face of declining oil production, we'll all find the movie title "There Will Be Blood" remarkably predictive.
Thank you for the continued lack of scientific support for your pontifications.
I think that's against the rules.
It'd be interesting to some day see an article talking about how natural gas consumption ties in with oil production.
That is, since increases in oil production since 2005 have only come from increased consumption of natural gas, does this not bring natural gas peak closer?
Secondly, does it not reduce availability of natural gas for other purposes? For example, if NG production rises from 100 to 110 units, but 15 of those units are diverted to oil production, then the effective NG availability has dropped...