OPEC Meeting and a Few Related Thoughts and Graphs from Readers
Posted by Gail the Actuary on March 14, 2009 - 10:01am
OPEC will meet on Sunday to talk about possibly reducing oil production further. In this post, I have a few short news clips, and some reader supplied analyses and graphs. Some of the graphs relate more to world oil production in total rather than just OPEC.
This is a graph provided by OPEC in its March report showing its estimate of both OPEC and World oil production through February:
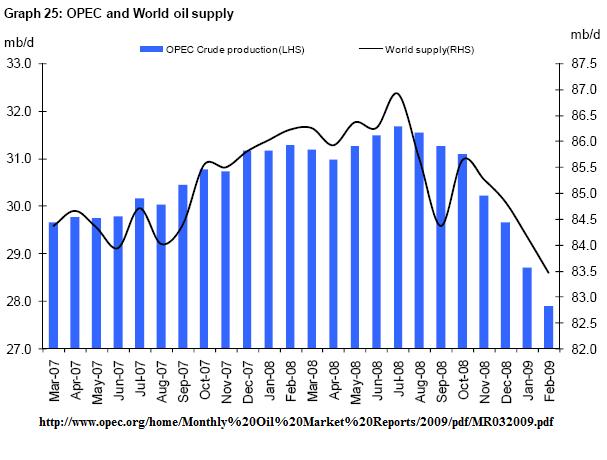
According to OPEC's view, both OPEC and world production continued to drop through February.
Clearly countries around the world are interested in the OPEC meeting. About Russia we read:
Russian news agencies said Thursday that Vice Premier Igor Sechin would attend the OPEC meeting in Vienna and that his country supports the idea of trimming production.
Regarding the US we read:
Energy Secretary Steven Chu warned Wednesday that if OPEC cuts production, it could severely hamper global economic recovery.
How to View Any OPEC Cuts: Don't Believe the Hype
Whether the Organization of Petroleum Exporting Countries will announce another round of oil output cuts is still a toss-up. But since the group hasn't pinched off all of the 4.2 million barrels a day it has agreed to curtail since last year, any pledge of new supply cuts may face a skeptical market.
"All told, the advice for OPECologists this weekend is watch the flows, not the rhetoric," J.P. Morgan commodity research head Lawrence Eagles said in a note to clients.
Cartel members have shown unusually high 80% compliance with recent new production caps, according to the International Energy Agency.
Oil Drum reader Morgan Downey (trader for Standard Chartered Plc) provides this chart of past attempts by OPEC to cut production, and their success or lack of success in influencing prices.
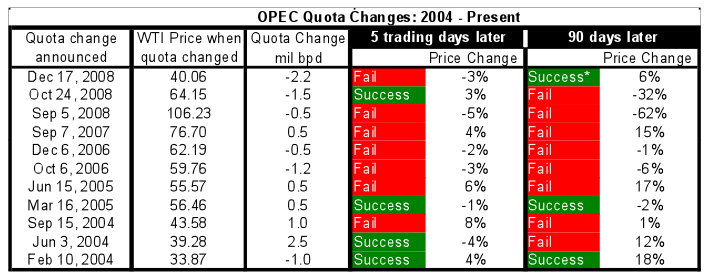
His analysis indicates that they have had some success with their December 2008 cuts. He writes:
Just before the collapse of global demand in July 2008, the OPEC quota system had been effectively dead.
As you know, OPEC quotas were designed to manage spare production capacity. From Sep 2005 until mid 2008, the OPEC quota system had been irrelevant as OPEC members had no spare capacity and were running at full tilt.
Here is a link to a story from Sep 2005, when OPEC members effectively admitted they had run out of spare capacity.
Ahead of OPEC’s meeting on Sunday next (March 15, 2009) it is worth considering how successful past changes in output by OPEC have been in changing the direction of oil price movements.
Over the past 4 years (see chart), OPEC’s cuts have succeeded in changing market direction in the short term (5 business days) only 36% of the time and medium term (90 calendar days) only 27% of the time.
OPEC members are hoping for a better result this time around by exhibiting unusually strong compliance with the series of cuts they announced in the fourth quarter of 2008.
I am not expecting any additional cuts to be announced on Sunday and instead a reaffirmation of the goal of full compliance with existing cuts. Full compliance with the cuts announced in Q408 will be more than sufficient to tighten oil inventories globally (we are already seeing evidence of this) and move prices higher.
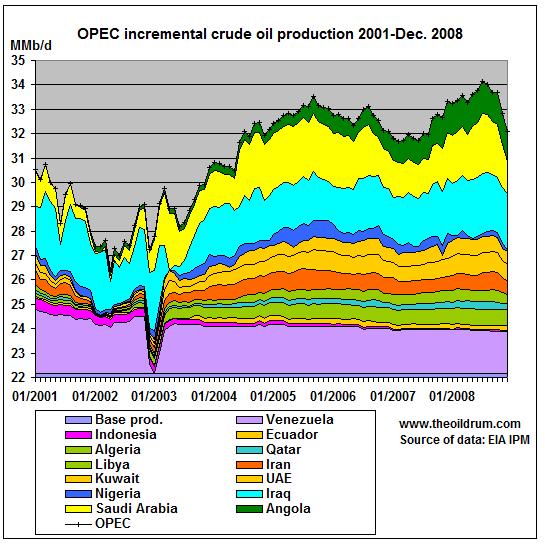
Reader Matt Mushalik from Australia sent a collection of graphs, including the OPEC graph (prepared by OPEC) at the top of this post. This is the table OPEC provided of who cut production how much:

The cuts are very widespread, with nearly all countries cutting at least a little.
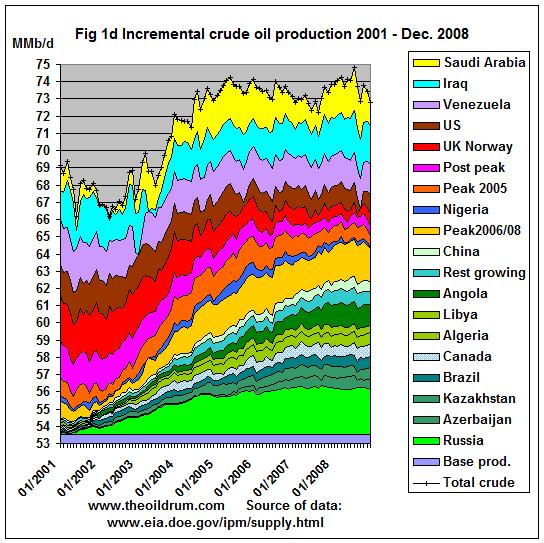
Matt provides these graphs of incremental production based on EIA data through December 31, 2008, for the world as a whole:
He also provides an updated graph for OPEC incremental production based on EIA data through December 31, 2008.
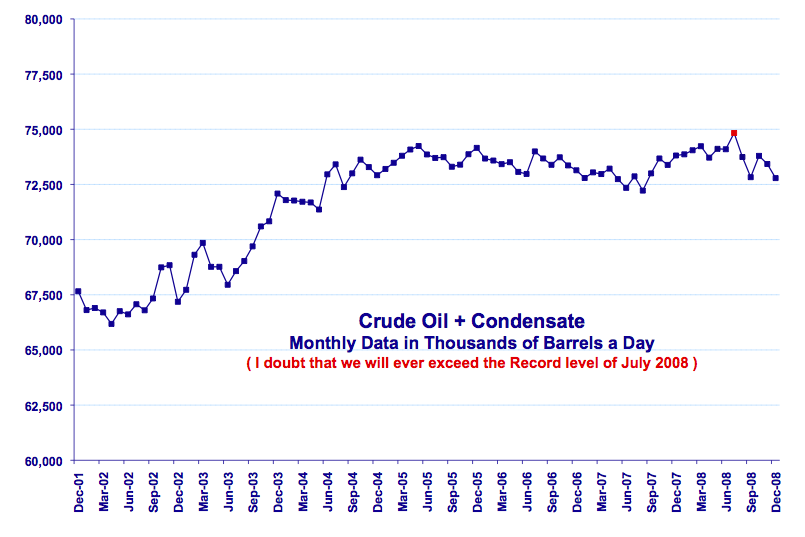
Reader William Tamblyn sends this graph of World Crude and Condensate production, based on EIA data.
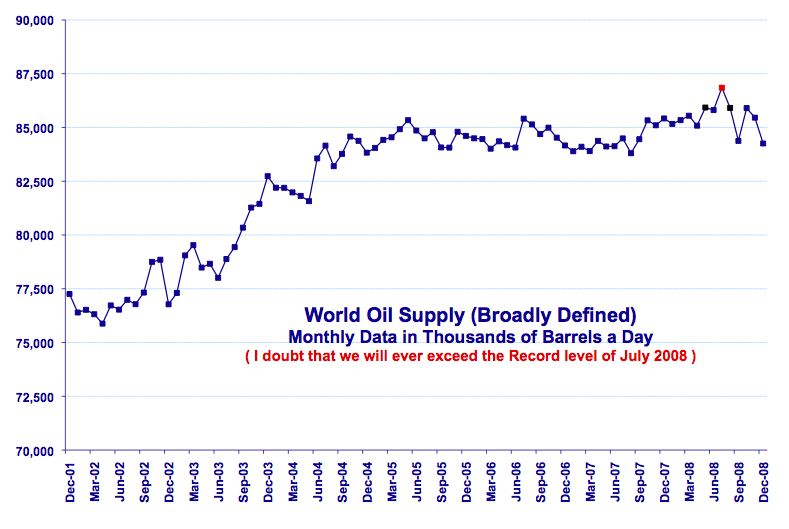
He also sends this graph of World Oil Production, Broadly Defined through December 31, 2008, (also known as "Total Liquids").
Many thanks to the readers for all of their fine contributions!
Contact
- Content: editors at theoildrum dot com
- Tech support: support at theoildrum dot com
License

This work is licensed under a Creative Commons Attribution-Share Alike 3.0 United States License.
And here are what Simmons claims are the true "Best In Class Confidential" figures
So is Simmons saying that he believes the EIA data is wrong-- that production of conventional is down more than the EIA says?
I haven't gone through the numbers to check where the differences are. What countries does he think have overstated production?
Yes, he says the EIA data is wrong - the percentage adjustments are no further out really than the EIA weekly figures have been from reality recently. I wonder if unusual recent changes in import/export of refined products also could account for some of the difference.
As to which countries, in other talks Simmons has said that Saudi Arabia recent production figures are fictitious and I believe he has suggested there are others hiding a decline. Unfortunately Simmons only provided these tantalising snapshots of what he called "A peek inside the peak". Would be interesting to see the complete dataset which presumably has figures for every individual producer (and maybe that's why we don't see it).
In summary Simmons claims the actual peak for both Crude and "All Liquids" was 2005. Crude was down 2mb/day from 2005 to 2008 and All Liquids was down about 1mb/d. Simmons also claims that the IEA internally believes the peak was in 2005 but can't politically shout fire in a crowded theatre even though it wants to.
In summary Simmons claims the actual peak for both Crude and "All Liquids" was 2005. Crude was down 2mb/day from 2005 to 2008 and All Liquids was down about 1mb/d. Simmons also claims that the IEA internally believes the peak was in 2005 but can't politically shout fire in a crowded theatre even though it wants to.
Sometimes Simmons says things that are demonstrably wrong. At ASPO last September, he made the argument that the entire country was about to run out of gas. I caught up with him after the presentation and told him that one key point in this argument - that we really don't have any idea of what our gasoline inventories are in the U.S. - was wrong, and I told him why.
I was asked on a panel session what I thought about these dire gasoline predictions: The Colonial Pipeline was about to run dry and wouldn't be able to be restarted, and the entire country was about to run out of gas. Note that a month prior, I had been warning about potential shortages because we didn't have much gasoline in inventory. And we did in fact get shortages throughout the country. But the situation was beginning to change in late September, so I said "We are seeing the worst right now, and inventories a month from today will be higher than they are now." They were, because some of the fantastic scenarios were built on a foundation of misunderstanding.
Key takeaway for me? Simmons is not an expert on all things in the industry, but that doesn't stop him from making predictions in areas that he isn't that familiar with. But since he is Matt Simmons, people assume that he always knows what he is talking about. While he has had a big influence on me, and I highly respect his body of work - I wish he would be more careful when stepping outside of the things he really knows. (His argument about the rusting infrastructure of the oil industry is another example that is fundamentally flawed and shows serious misunderstanding on several levels).
Well the problem of rationing the entire country was apparently solved by just leaving the states nearest the pipeline edges to just go almost totally without. The apparent justification of the national news networks for downplaying the story was that they were asked not to create a panic and cause exactly the situation Simmons feared. So it seems the US authorities shared Simmons fears (or claimed to) even if you didn't.
For reference here's the spike down. Note the lonely dot.
And here's the figures for product supplied July-to October
19,412 19,267 17,796 19,643
Now when it comes to claimed worldwide oil production figures, I'm sure Simmons isn't just making them up off the top of his head either - or do you think that's what he is doing? Perhaps he is but I would tend not to think so.
So it seems the US authorities shared Simmons fears (or claimed to) even if you didn't.
No, you misunderstand completely. After mentioning several times just what a dangerous game we were playing with inventories, when Hurricanes Ike and Gustav hit I sounded the warning:
Flirting with Disaster
I wrote "there is a significant probability of seeing gasoline shortages" before we started seeing gasoline shortages. So I did share the fears. The issue was that by the time ASPO came around, refineries were starting back up, and you could see that inventories would start to climb back. That was the basis of what I said at ASPO. We were already seeing the worst of the shortages, and it wasn't likely to get worse contrary to what Simmons and some others were suggesting. And it didn't.
I'm sure Simmons isn't just making them up off the top of his head either - or do you think that's what he is doing? Perhaps he is but I would tend not to think so.
He often shoots from the hip with incomplete information. That was the point I was making above. If the information gathering agencies say one thing, and he says another, I think they have more accurate information than he does. In the case of gasoline inventories, I know they do.
Whether it's the figures posted here or not, he has previously said he has seen what he says are the true IEA figures before they are politically massaged. Just suppose for a moment that Saudi production was really declining involuntarily pretty much as projected despite all their storage games and start-ups of new fields. Would it be politically acceptable to print this in official figures and call the Saudis (or whoever else) liars? Might it even de-stabilise Saudi Arabia or give them an excuse to cut exports to the US because of the "insult"? I don't know the answer to that.
But this is all speculation I agree. Does anyone on TOD have contact details for Simmons to just phone him and ask if he can give any more details?
Even the EIA numbers show a practically infinitesimal difference, well within any reasonable margin of error, between the 2005 and 2008 annual averages, 73.7 versus 73.8 mbpd, with the 2008 number more subject to revision, generally downward.
I am increasingly convinced that the July, 2008 monthly peak was an inventory drawdown fluke, in response to the highest oil prices in history. Look how sharp the August and September declines were (making up for the inventory drawdown?), followed by a rebound, before we got into what was clearly a voluntary reduction in late 2008.
The average monthly production rate over a five month period centered on July, 2008 (two months on either side of July, 2008) was 73.9 mbpd (subject to revision, generally downward). This was only very slightly above the annual average rate in 2005, and it is identical to the five month average centered on May, 2005, 73.9 mbpd.
from Robert Rapier:
Can you explain this? This is one of his major talking points. What is wrong with it?
I know it is, but it is fatally flawed. We are discussing this in the TOD Staff Yahoo group, and here is part of what I wrote:
50-year-old refineries aren't full of 50-year-old infrastructure. In fact, there is unlikely to be much, if any 50-year old equipment in any refinery. The same goes for pipelines; they are inspected and patched constantly. It's a big industry, and there will always be incidents because someone didn't do the preventative maintenance they should have. Infrastructure upgrades happen year after year in refinery after refinery and on platform after platform.
The bottom line is that the starting assumption is wrong. Every oil company has a budget for maintenance, and they maintain the things that need to be maintained. There are specialists dedicated to measuring equipment for wall-thinning and such, and items are fixed as they are found. But in every plant I have ever been in, all mechanical equipment gets inspected on some cyclical basis measured at most at a few years.
That doesn't mean that things aren't missed, but it certainly doesn't mean the whole thing is based on a rusting infrastructure that must be replaced in full. I understand that Simmons has suggested $100 trillion to do the work that needs to be done. No way, because the condition isn't as he has described.
How silly of Simmons not to have noticed that regular maintenance takes place. Lucky you noticed that.
Look you might be right but you really do come across, to me anyway, (out of all TOD staff) as arrogant. Maybe you don't realise that (or maybe it is just me!). Come down off your high horse and you might win a few more friends.
I note that all this "inspection" and "maintenance" didn't prevent the unplanned shutdown of the Alaska pipeline which BP described as caused by "unexpectedly severe corrosion".
How silly of Simmons not to have noticed that regular maintenance takes place. Lucky you noticed that.
I have worked in areas that Simmons has not, and as such there are things I know a lot more about than he does. That isn't arrogance, it is just a fact. That of course goes both ways. Furthermore, there are other TOD staff that agree with me that he is pretty far out there on this issue.
Look you might be right but you really do come across, to me anyway, (out of all TOD staff) as arrogant. Maybe you don't realise that (or maybe it is just me!). Come down off your high horse and you might win a few more friends.
So which TOD staff do you actually know? Anyway I am not here to win friends. If I was, I would go a different direction. That would certainly save me a lot of insults and threats from people hiding behind anonymous monikers.
I have worked in the oil industry, and as a result there are certain things I know about it. So I try to shed light on subjects when I can, and sometimes I am in a position to address misconceptions. I don't think it's arrogant to point out when someone makes what I know is an error, and I don't think I pointed it out in an arrogant way. I was just matter of fact. Sometimes that is annoying to fans of the person who is alleged to be in error. This seemed to be the case from yesterday when I first mentioned the problem with Simmons' gasoline argument. You took exception to it. I don't know what you do for a living, but I suspect if someone who wasn't really familiar with that area said something that you knew to be in error, you would say so (even if they had written a book).
I note that all this "inspection" and "maintenance" didn't prevent the unplanned shutdown of the Alaska pipeline which BP described as caused by "unexpectedly severe corrosion".
Did you miss my last paragraph? It is a big industry, and things do happen. Airplanes sometimes crash. That doesn't mean that there isn't a well-functioning program of "inspection" and "maintenance" in the airline industry, nor does it mean that all the planes are at risk of falling out of the sky.
If Simmons said that the entire US was going to run out of gasoline for certain in September last year then he was wrong and I've noted what you've said. I hadn't heard/seen him say that. Is there a link?
Any threats which you find alarming I suggest you report to the authorities.
By the way I did find the way some people attacked you over your recent carbon sequestration post to have been out of order and I personally look further to any future reports.
If Simmons said that the entire US was going to run out of gasoline for certain in September last year then he was wrong and I've noted what you've said. I hadn't heard/seen him say that. Is there a link?
His ASPO presentation is online, and I think even the video is available from the ASPO site. He made the argument that the entire gasoline system was on the precipice, and we were about to go over the cliff into a permanent emergency. Now while I agree with him on the big picture over peak oil, I disagreed sharply over the foundation he built that argument upon. I thought it was highly alarmist, and wrong. The problem is that he is Matt Simmons, so people believe it. Then, when it fails to materialize, he risks losing credibility. This was a case in which the foundations of the argument were wrong, so it wasn't a surprise to me that things didn't go down like he was suggesting.
Any threats which you find alarming I suggest you report to the authorities.
I have had to do that on two occasions. Once when someone felt like it was fair game to go after my family.
By the way I did find the way some people attacked you over your recent carbon sequestration post to have been out of order and I personally look further to any future reports.
Myself, I think unprovoked personal attacks are always out of order.
Well I'm certainly hoping that Simmons is wrong on his current claims that Russian gas is post-peak because, as a resident of Europe, I'd rather not be the "cold toast" he expects me to be next year.
See the thread at http://europe.theoildrum.com/node/5199
Here is your link:
http://www.aspo-usa.org/aspousa4/proceedings/Simmons_Matthew_ASPOUSA2008...
Pay close attention to slides 9-16.
Slide 10, especially bullet point 2, was just wrong. In fact, the opposite was the case, which is why I predicted inventories were headed higher.
Slide 11 starts the build up of the catastrophic scenario.
By Slides 12 and 13, I was observing a lot of mouths agape.
Slide 14: "Vehicles stop until system gets refilled." This was the same sort of reasoning that led some to believe the Colonial Pipeline was going to run out of gas, which would lead to a long-term shortage.
Slide 16 was almost completely inaccurate.
Slide 27 covers the rust argument, and the first bullet point points to the misunderstand I discussed on what I have observed to be very good PM programs. I have never walked through a refinery or oil platform and observed anything like this. Further, it certainly isn't a 'hidden crisis.'
I don't mean to be overly-critical of Matt, because he has done more than anyone in the world to bring attention to peak oil. But that is a big reason he needs to be careful with what he says. We can't afford for him to start losing credibility. Too many more of those presentations and people will start to wonder.
Thanks. Will have a look later.
Hello,
I can contribute with actual data for Norway from NPD (Norwegian Petroleum Directorate);
YEAR CRUDE OIL NGL AND CONDENSATE
2005 2,553 Mb/d 0,416 Mb/d
2008 2,108 Mb/d 0,347Mb/d
NPD has been operating with good quality data for years.
The NPD data should put a dent into Simmons socalled “Highly regarded supply model”.
It looks like the total liquids numbers for Norway are in pretty close agreement.
Yes, 2008 Total Liquids for Norway is 2.456 mb//day according to NPD and 2.471 mb/day according to Simmons. By the way in the latest public IEA figures Norwegian All Liquids production is 2.47 mb/day matching exactly the figure quoted by Simmons.
So other than a little oil moving from one category to another I don't think the figures quoted put any dent at all in Simmons claim.
I think the point was that if the NPD numbers are public knowledge, and the "highy regarded source" ("HRS") is different, it poses many questions around the "highly regarded" source.
To think otherwise, you'd need a good reason to assume that the NPD was lying and that somehow the HRS was better.
Alternatively, perhaps the HRS has a more empirical methodology, e.g. deriving it from financial transaction data and/or shipping cargo movements, and that though the numbers aren't accurate, the trend is reliable assuming the methodology was not affected by some change in purchase or shipping habits of the market.
The point is that the numbers aren't really different! Just some of the oil is categorised differently by differing agencies. The only difference between the official IEA Norway figures and the ones in Simmons table is that Simmons seems to have more decimal places.
Norway is a pretty open book about their oil supplies. Many countries he listed should be spot on. It's the ones that aren't an open book that I would question.
Here's a comparison of Simmons figures and the latest IEA and EIA public estimates
In 2005 Simmons is claiming worldwide production was over reported by only 1.2mb/day. By 2008 this had grown to about 3-4mb/day or approximately 5% of the total if you believe Matt. As memmel has said, these figures are in line with what his own modelling work suggests.
Now clearly if only a few countries account for 4mb/day then someone has had a massive production drop. Simmons presumably knows exactly which countries he claims are lying and by exactly how much but has chosen not to publish that information directly at this time.
I can't find any evidence that supports his claim that China has past peak production. According to Rembrants monthly oil report China even had their highest production in Jan 2009. Even the claim that Kuwait has past peak production is very hard to verify, especially because of the voluntary production cuts made by OPEC.
All of the production data are estimates to some degree, but the preliminary monthly IEA data are mostly just guesses IMO.
Regarding China, here is a post that notes that they were about 50% depleted in the early 2007 time frame, based on the logistic (HL) plot:
http://europe.theoildrum.com/node/2270#comment-161233
Recent EIA crude production numbers for China were as follows:
2006: 3.7 mbpd
2007: 3.7
2008: 3.8
However, the monthly 2008 data show a decline from 3.9 mbpd in mid-year to 3.7 at the end of the year, and their largest oil field reportedly has something like a 90% water cut.
Regarding Kuwait, Stuart did a HL plot a couple of years ago putting them right around the 50% depleted mark. I suspect that a lot of involuntary production declines are going to be portrayed as voluntary reductions in production.
In the latest public release of IEA data (PDF) it is notable that Chinese production figures for December were revised down a whopping 220k/day from 3.92m to 3.7m. There's a newer update out but it has only been released to subscribers so far - mere mortals have to wait another couple of weeks to see it. Any subscribers out there fancy posting any Chinese revisions, if any, from the latest release?
If we look the average production for four periods: The last seven months of 2005, all of 2006, all of 2007 and all of 2008, the average world crude production over these four time periods never exceeded the 5/05 rate (EIA, C+C). And the monthly rate only exceeded the 5/05 rate for one of the 43 months following 5/05 (July, 2008). I wonder how much of the July, 2008 peak (subject to revision, generally downward) was due to producers drawing down inventories, because the highest nominal oil prices in history?
In any case, the cumulative shortfall between what we would have produced at the 5/05 rate and what we actually produced (from 5/05 to 12/08) is close to a billion barrels of oil. In contrast to the 43 month period following 5/05, the 43 month period ending on 5/05 showed a large increase in production in response to higher oil prices.
Note that world crude production, 2006 to 2008, has been similar to the North Sea graph, 2000 to 2002, (shown in black, Texas shown in blue):
Based on the logistic (HL) models, the world, regarding conventional production, in 2005 was at about the same stage of depletion that the North Sea was at in 1999, i.e. both were about 50% depleted.
And then consider the sad state of most of the world's giant oil fields, in most cases producing what Simmons referred to as "Oil stained brine."
I wonder how much of the July, 2008 peak (subject to revision, generally downward) was due to producers drawing down inventories, because the highest nominal oil prices in history?
Did you wonder this about May 2005 as well? Oil prices were also setting new records during this period. You are again filtering data according to your notion of when peak occurred. And given that oil prices collapsed right after July - which you acknowledge resulted in producers dialing production back - 2008 now has a much stronger case for geological peak than does 2005. 2008 owns the highest month, but more importantly the highest year of production (despite voluntary reductions). Haven't you said before that you consider a year of production data a better gauge than a month?
I am kicking around the idea of doing an update on the Saudi HL. As I was saying in 2005, it isn't stable. Texas in 1960 was more stable. I updated the 2005 Saudi HL last night through 2008, and not surprising to me was that 2006, 2007. and 2008 were all higher than the line pointing to URR in 2005. What does that mean? If you let the computer draw the best fit line, URR continues to grow, and production isn't behaving as the Saudi HL predicted. %Qt has actually been moving backward. This was of course an important part of my argument - that the model had not been validated, nor had the important terms been defined (at what %Qt does a region peak? - a few percentage points can span years.)
As I have said before, I have no beef over ELM, net exports, Russia, or your other arguments. You have had a positive influence on a lot of people here. But I maintain that the HL for Saudi (but not exclusive to Saudi) is equivalent to astrology. You look at your astrological prediction for that day, and say "Yeah, that is sort of what happened to me today." That's because people are subject to confirmation bias. But then blind tests have shown that if the subject doesn't know which forecast was theirs, they have no better than a random chance of figuring out which one it was. I remain hopeful that I can get you to eventually see this.
I still consider it critically important to understand what's going on in Saudi, but you have to admit that the dire predictions of 2005 - made by many people - have failed to materialize. If we understand why that is and learn from it, maybe we can get a better view on where they are headed.
Strictly speaking, I am basing my arguments on Deffeyes' notion of when peak occurred. Despite an erroneous observation that the peak was in 2000, he never backed away from what his model showed, a peak in the 2004 to 2008 time frame, most likely in 2005. So, in the context of Deffeyes' prediction, especially combined with the information regarding the two largest producing fields in 2005--North Ghawar & Cantarell--the fact that the world oil industry has showed a cumulative shortfall, post-5/05, in response to generally rising oil prices, is significant, especially since the industry showed a cumulative increase for the same time period ending in 5/05, in response to generally rising oil prices.
Why was the industry able to generally increase production, in response to generally higher oil prices, in the 3.5 year period leading up to 5/05, but not after 5/05? BTW, the world, like the North Sea and the Lower 48, all showed flat to declining production in response to generally higher oil prices, in the vicinity of the 50% depleted mark on their respective HL plots--1972 for the Lower 48, 1999 for the North Sea and 2005 for the world.
Regarding the Saudi HL plot, Khebab is going to update the 5/06 plot, and he will tell us what the model (using production data through 2005) predicted for the cumulative production in the 2006 to 2008 time period, inclusive, versus actual EIA cumulative data. Since the HL method provides a plausible estimate for the area under a production rate versus time curve, estimating cumulative production is the real strength of the method. I addressed the subject in this article:
http://graphoilogy.blogspot.com/2007/06/in-defense-of-hubbert-linearizat...
In Defense of the Hubbert Linearization Method (June, 2007)
In any case, Saudi Arabia's annual crude production has fallen below their 2005 rate for three years, and we shall see what future years show.
I tend to agree that peak oil is important to people only with respect to price versus supply. In general, it does not matter the particular month within a 3 year range when production exceeded all other months by a marginal percentage of the total production. Similarly, I think you are going to see at least one more "peak" month when production 'attempts' to increase after "resting" the fields from this global recession. However, to me, the bottom line is that in 10 years, production will be X% lower than today, and consequently prices will be higher; monthly peaks here and there are static. In a past post, I mentioned it was interesting that a 300% increase in price couldn't even bring a 10% increase in production. That's peak oil...
Here is Rembrandt's 12 month running average of world crude production:
Mathematically, world conventional production, in 2005, was at about the same stage of depletion at which the Lower 48 and the North Sea were at in 1972 and 1999 respectively.
Looking at average annual oil prices, oil prices almost doubled from 2005 to 2008.
Regarding the Lower 48, oil prices went up almost ten-fold from 1970 to 1980.
And regarding the North Sea, oil prices went up about five-fold from 1999 to 2008.
At the risk of further muddying these waters, the date of Peak Oil is not the relevant question by a long shot. We need to know how much and at what decline rate the future resource will be affordable by reasonably functional social democracies, and how much needs to be allocated to energy/basic needs infrastructure. We are fiddling while Rome burns asking the question of which year is peak -the sole reason to do it is if it brings more understanding to decisionmakers about what our energy options are/aren't. Perhaps that is necessary but it is many years past evident that we are 'at or near peak', especially when net energy and non-energy inputs are considered.
This is a crucial point; "How do we restructure civilization" is orders of magnitude more important than "Is the peak in 1 year or 4?" Due to the good works of many in the petroleum geology and related fields, we are now aware of the impending nature of peak oil. Due to the understanding of the over-reliance of most modern economic systems on cheap oil, we also understand the risks peak oil imposes on "civilization", primarily nation states and democracies.
How we transition gracefully from a cheap oil, globalized economy is the challenge that unblinkingly stares us straight in the eyes. Massive changes need to take place in a proactive manner, or our descendants will suffer the consequences.
I'm interested in how many months/years past the peak until it is popularly understood that next year's petroleum supply will be less than the current year's supply.
How many years of decline will be needed to solidify the meme?
Has anyone made a very BIG, Jan 1900 to Jan. 2009, world crude production graph, with a Y axis which starts at 0? I mean a file people could zoom in on if desired for actual data, yet large enough to zoom out and get a perspective.
It seems that the average is from now and 12 months backward so the average is in sort off delayed 6 months.
I really like this graph. Is smooths out a lot of noise in the data and really demonstrates the undulating plateau.
As noted down the thread, regardless of whether it's a coincidence--or the result of the world hitting the 50% depleted point regarding conventional reserves--it's pretty clear that something changed in the 2004 to 2008 (most likely 2005) time frame in which Deffeyes predicted that world oil production would peak. The question then becomes if we will see an annual rate higher than 74 mbpd in future years.
WT,
What's your take on looking at R/P ratios for a clue on peaking production? Has any country gone into geologically driven decline with a R/P ratio as high as SA's? As far as I know, none have. Because of this high R/P, I'm sceptical that they are currently geologically limited.
Even using lower estimates for URR (rather than the 260 billion plus that they've been claiming for over 20 years), SA still is looking good. Consider the kind of production flows that Russia has managed with their much more modest R/P.
It seems to me that this might be an area for investigation by someone that has access to good data and higher brain hp than I possess.
While we have some degree in confidence in the "P" part of the ratio, the question is what is the "R" part of the ratio?
Based on the early 2006 HL plot that Khebab did, remaining Saudi recoverable crude oil reserves, at the end of 2005, were about 78 Gb, resulting in a 2005 R/P ratio of about 23, a 2005 depletion rate of about 4.3%.
Here is a later predicted total liquids (HL based) predicted production curve for Saudi Arabia:
http://www.energybulletin.net/image/uploads/38948/image011.png
Khebab's estimate is that there is a 95% probability that the Saudi total liquids production will fall between the dashed lines. The estimated 10 year rates of change in production & consumption are shown. The consumption curves are based on his Monte Carlo analysis. Basically, we have low, middle and high cases for Saudi production and consumption, resulting in a middle case scenario that Saudi Arabia will approach zero net oil exports in about 22 years.
I think that 78 Gb for their remaining reserves is overly pessimistic and that this could be a case where HL might not be at its most useful. Unlike the US, the Saudis clearly have throttled back production in the past (and appear to be now), which may result in an underestimation of URR.
This is why R/P ratios might be useful as another circumstantial tool for confirming peaks due to geologic causation.
But it all comes back to whether or not SA is being forthright about their reserves. And we're all on the wrong side of the looking glass. But thanks for your insight. I do appreciate your time & effort (and all those other) that make this site so informative.
Which is why we used Texas as a model for Saudi Arabia:
http://www.energybulletin.net/node/16459
I do think that Khebab's later work, with the 95% confidence intervals shown, is probably a better way to model future production.
I'm not exactly sure about the consumption figures on that graph.. I really can't see how the population of Saudi Arabia would manage those consumption levels unless that spent 24 hours a day driving SUVs..
Not that that really changes much, of course. Even the high case for production combined with flat consumption is bad enough.
Why was the industry able to generally increase production, in response to generally higher oil prices, in the 3.5 year period leading up to 5/05, but not after 5/05?
Are you asking me that for real? Because the industry was sitting on spare capacity leading up to 5/05. That spare capacity came about as a result of a price spice a few years earlier. In 2008, we were starting to see a response to the 5/05 price spike (as producers had largely tapped out spare capacity, new projects had to come online, and these take time).
BTW, the world, like the North Sea and the Lower 48, all showed flat to declining production in response to generally higher oil prices, in the vicinity of the 50% depleted mark on their respective HL plots...
As I have pointed out before, this presumes what you are trying to prove. If we knew just how depleted the world is, there wouldn't be much of a debate. You are using the HL to determine a URR, which then gives you a % depletion. My point is that the HL can't do that, because it hasn't been shown to be consistently reliable. Plus, "in the vicinity" can span 10 or more years. There is no objective test for pinning peak to any degree of accuracy.
In any case, Saudi Arabia's annual crude production has fallen below their 2005 rate for three years, and we shall see what future years show.
If I was going to make that argument - and the same goes for your slightly modified version looking at various 43 month periods - I would back up and test to see if this argument holds true for other periods of time. Do you know the answer to that? If you could make that argument in 1997 or 2001 (just as a for instance) then it really doesn't support the point. Besides that, we have a pretty good explanation for the shortfall, as explained in my first paragraph.
Caveat for those who need it: This isn't about Peak 2005 versus Peak 2008. It is about the methods we use to determine peak, making sure they are as rigorous as possible, and tweaking them to get a better understanding of what's taking place. My position all along has been to try to understand just how much time we have to man the lifeboats.
So, it's just a coincidence that the world's two largest producing countries are showing the kind of flat to lower crude oil production that I started warning about in January, 2006 (based on HL models), and it's just a coincidence that world crude oil production flatlined in the time frame when Deffeyes' predicted it would (based on HL)?
In any case, how many times are we going to go over the same ground? As I have suggested several times, we will just have to agree to disagree. I'm pretty sure that most of our victimized readers lost interest in this debate a long time ago. Why don't we just wait and see if Saudi Arabia ever again exceeds an annual crude production rate of 9.6 mbpd?
Possibly. The point is that the HL would have predicted this before in the case of Saudi. This is a serious problem that you fail to acknowledge. Had you done this analysis in 2000, you could have made a stronger case than today for a Saudi peak, because the HL was more stable.
We could break new ground, but I think you have a serious blind spot over this. I think the question is very important, and whether or not readers have lost interest is not relevant to me. I am not trying to win friends. I am arguing for rigorous, objective analysis of the data.
Do you recall an e-mail you sent to me in March of 2007? You were arguing for declines, and I was saying that I thought production was headed back up:
So what happened? Production did head back up as I predicted. As you say nobody here had any doubts as to what your position was. As you said, the implications of your graph was clear: We were about to see world oil production falling off a cliff. But it didn't happen. Instead we saw a new world record. I would think this would cause you to reflect a bit. I think we could cover some ground if you would back up, reconsider your position (consider your comment "I was right, you were wrong" and the fact that you seriously doubted that would change - in light of what happened), and then consider why the HL prediction continues to show the "dogleg up." As I have said, I haven't gone after ELM or anything else because I don't see any problems there. But in the case of HL, I think you are very wrong, and yet still pushing an idea with serious shortcomings.
But if your argument is correct, we don't have to wait for that. We should see production declining over time. If Saudi held production at 9 mbpd for the next 10 years, I think we can safely conclude that that HL was off the mark. Agreed? Doesn't the HL suggest that we should see declining production (with the obvious exception that there may be some bumps as new production comes online)?
You will also recall that in the March, 2007 time frame that I suggested that we would see a future rebound in Saudi production. This was in response to Stuart's comment that the observed Saudi decline was sharper than what the HL model predicted it would be. Therefore, if the observed decline was sharper than what the HL model predicted, it stands to reason that we would expect to see a future rebound. I did of course say that I expected the rebound to be to a level "well below" their (2005) peak rate.
So again, have we broken any new ground here? If we are going to continue to go around in circles debating precisely who had the best estimate of when the Titanic would sink (and whether their methodology was valid, even if they had the best estimate), why don't we just write up some canned responses and we could just then insert Response #1, #2, #3, etc. and save ourselves a lot of typing?
BTW, speaking of new ground, I've always thought that you were making a contradictory argument, to-wit that production peaks cannot be predicted, but that you were predicting, if memory serves, a production peak in the 2010 to 2015 time frame. Why don't you outline your reasoning for predicting a peak in the 2010 to 2015 time frame? (Again, if memory serves regarding your prediction, feel free to correct my numbers.)
This in interesting and relevant to a point. I think Robert has pointed out where some of your prior analyses have been wrong. If I am reading correctly, Robert's concern is that certain people (I would include Daniel Yergin in this group) make wrong predictions over and over and then make a new prediction with the same confidence as old ones. (Jon Stewart kind of ripped Jim Cramer on this topic Thurs night).
I think a large part of discussions are about reputation, and 'perceived fitness'. I wrote this in 2007 (and got lots of negative comments). Peak Oil And Belief Systems
We need to take a broader view on what is happening to the world. WT - I wish you would focus more on your ELP model than your others - that is where the leverage towards change is.
I have tried to make it clear that the prediction for a world peak, circa 2005, within a range from 2004 to 2008 was Deffeyes' (but I happen to agree with him).
I have focused my work on the top net oil exporters, especially Saudi Arabia and Russia, and "Net Export Math," primarily using Khebab's mathematical models. In my original January, 2006 missive, I suggested that Saudi Arabia was on the "Verge" of an irreversible decline; this was followed by the Texas/Lower 48 paper, in which we lined up the 1972 Texas peak with Saudi production through 2005. In the comments section to the original January article, I stated that, based on the HL analysis, Russia would probably resume its production decline within one to two years.
In March, 2007, when almost everyone else was mesmerized by the Saudi production decline, I suggested that we would see a future rebound, albeit to a level "well below" the 2005 rate. In any case, so far we have seen three years of Saudi production below their 2005 rate, at about the same stage of depletion at which the prior swing producer, Texas started declining. I suspect, but don't know, that the post-2005 cumulative Saudi production is pretty close to what the HL model predicted (using production through 2005 for the model).
So, could someone clarify where some of my "prior analyses" have been wrong?
Finally, how many times in the past few days, past few months and now the past few years have I suggested that this endless tedious argument between Robert and me over the specific timing of the various peaks--and whether even if my estimates (or more accurately Khebab's estimates) are right, whether my methodology is valid--is pretty much pointless?
Nate -
Quite frankly this perpetual pissing contest over 'was it peak, or wasn't it peak?' between Westexas and Robert Rapier is no less wearisome now than it was well over a year ago. It seems to follow a predictable pattern: Westexas makes some sort of new projection or observation, and then Mr. Rapier jumps all over him, in effect saying, 'Nynah, nynah .... you said something in 2005 that was wrong, so who's gonna believe ya now!' Enough already! No mas!
I actually agree with Mr. Rapier that one should exercise some forbearance and not make reckless predictions, in the obvious interest of maintaining credibility. But on the other hand, I hardly view what Westexas has been engaged in as being anything close to reckless predicting. When one makes a projection (the term 'prediction' having a more fortune-teller connotation) one always runs the risk of being wrong. So what. If one waits till all the data is in and all the evidence is irrefutable, then that is no longer making a projection, but rather an observation of what has already occurred.
Anyway, one thing about the analyses of oil production and oil consumption on TOD that still bothers me is the quality of the available "data" that we rely on. I put the word, data in quotes because that might be too generous of a term and one which implies a level of accuracy and reliability that might not really be there.
It appears to me that what passes for data is really a collection of estimates and official statements put forth by interested parties with an axe to grind, such as OPEC and various governmental and quasi-governmental energy entities. There is a tendency to take these numbers as gospel. However, if I understand correctly, most of this information is self-reported and unaudited. Hence, I think the temptation of putting one's finger on the scale just a little bit to make things look a little better may for some be too hard to resist. Would it be safe to say, that these 'data' probably represent something toward the upper bound of the error range, rather than toward the lower, as there is no benefit to the various parties for erroneously reporting declining production? Perhaps a built-in bias to make things look better than they really are?
Next we have the question: What is a reasonable margin of error? I have asked this question on several occasions on TOD and have never really gotten a straight answer. It is an important question, because I have observed all sorts of conclusions being drawn based on very small differences between very large numbers. If the margin of error in production, consumption, and inventory numbers is as low as 1 or 2 percent, then that would render many of these conclusions invalid or at least shaky. I fear we are generating all these beautiful graphs based on a level of accuracy that simply isn't there. (Notice how so many of these graphs have a greatly compressed Y-axis to make small differences not look so small.)
I think one cannot go too far wrong in assuming that any OPEC- or government-generated number probably represents a reasonable (giving them the benefit of the doubt) best case estimate. My experience in other fields is that things are seldom better than what the official number-generators say, but often worse.
Quite frankly this perpetual pissing contest over 'was it peak, or wasn't it peak?' between Westexas and Robert Rapier is no less wearisome now than it was well over a year ago.
Well, I am not doing this for your entertainment, nor as a pissing contest. Besides your opinion ceased to matter one iota to me after your bitter, drunken diatribe in which you attacked me, entirely unprovoked, and then crawled away from the board, vowing never to return:
http://www.theoildrum.com/node/2244/156033
Of course you did return after 6 months just like nothing ever happened, but to this day that was the most over-the-top attack I have ever received here (but not the first from you) - and that's saying a lot. People have been banned for much less. So before you begin lecturing others, consider your own behavior, which was worse than anything 99% of the people who post here have ever pulled. As much as WT and I have disagreed over this issue, we never stooped to the level you did in that thread. If you wouldn't hurl those insults to my face - and I know you wouldn't - as far as I am concerned you summon courage behind a veil of anonymity.
I told myself I should never respond to those who have demonstrated such classless behavior, but I will give you one clue: You have completely mischaracterized the nature of the disagreement. If I recall, you have some science training, so the issue at hand should be readily grasped by you.
Mr. Rapier -
My reply was directed at Mr. Nagens and not at you. Therefore, there is no need for you to respond to my reply to him, anymore than I feel a need to respond to your comments to someone else, which I have not done.
Sometimes "a drunken diatribe" can well tell the painful truth that would otherwise not be revealed. It can be healthy .... you should try it. And one of those truths is that there is something about you that irritates me. I don't know whether it is your smugness, your air of superiority, or your narrow-mindedness ... but clearly your represent a type of person that I find extremely tedious.
So, while I believe you to be a decent, sincere, and upstanding person, and while I truly wish you no ill, neither do I feel it productive to have any further dialogue with you.
Peace be with you, my brother.
And one of those truths is that there is something about you that irritates me. I don't know whether it is your smugness, your air of superiority, or your narrow-mindedness ... but clearly your represent a type of person that I find extremely tedious.
I think that was clear long ago from your constant, gratuitous insults. They stemmed from the fact that I worked for an oil company, which generally seemed to be the source of your irritation.
Sometimes "a drunken diatribe" can well tell the painful truth that would otherwise not be revealed.
That's pretty smug, don't you think? Textbook projection.
So, while I believe you to be a decent, sincere, and upstanding person,
I find that completely inconsistent with your first paragraph. You know what's funny? Nate vouched for you; said you were actually OK and that he had never seen you behave that way. I just think Nate may not know you as well as he thinks, because it wasn't a one-off. You behaved that way frequently with me.
But it is your narrow-mindedness that is the issue, not mine. You don't know me at all, and yet think you have me pegged. That's narrow-minded. Worse, you think that gives you the right to say things that you would certainly not say in person. What do you know about me? Nothing! What you read on the Internet? Give me a big freaking break.
Nate knows me quite well - in the real world. He can tell you whether I am narrow-minded, smug, or if I walk around with an air of superiority. You can of course e-mail him at any time and ask about me. But I don't suspect you will do that, because you might find that you had heaped a lot of insults where none were warranted. I would personally want to know more about the person at the other end of my insults, but then I am not so judgmental to have hurled that kind of venom in the first place (unless maybe they went well out of their way to piss me off). I think it actually takes a certain sense of superiority to treat someone to gratuitous insults because you think you have them pegged from limited interactions on the Internet. Look again at the response I linked to. It reeks of a sense of superiority. Again, this is a clear case of projection on your part.
In the end, those are your issues to work out. If you choose to never find out whether you were wrong, that says a lot more about you than it does me.
Mr. Rapier -
As I know it is extremely important for you to have the last word, you have my permission to have the last word.
Amen.
Priceless. OK, the last word - since I have your permission - is "smug."
Jesus christ guys, get a room
Data A into model B produces projection C.
D happens, A is suspect.
Film at 11.
BTW, speaking of new ground, I've always thought that you were making a contradictory argument, to-wit that production peaks cannot be predicted, but that you were predicting, if memory serves, a production peak in the 2010 to 2015 time frame.
Last post from me, but I think this warrants a response. What I have consistently said is that from my view - which includes looking at megaprojects, knowing a lot of smaller projects that don't show up on the megaprojects list, trying to read the tea leaves in Saudi - is that peak looks to me like it's 90% probable within 5 years. But I incorporate and respond to new data. That's the way science is; it is tentative. That's quite different from digging into a bunker over May 2005 and searching for data to support that view.
I am not playing a game where I am trying to be the one to correctly call the peak. I don't attempt to do that. You won't hear me say "I call Peak 2008." I think that's ludicrous given the variables that can influence that. But I am trying to build the most probable view of the future I can, so I can respond appropriately (and try to convince others to do so as well).
You never provided your estimate for a world peak?
Ummm. A)This isn't a competition. B)Robert uses a probabilistic view of future (as do I). We attempt to use facts to change our opinion not our opinion and then find facts. For my own part I think it is 99% likely that peak oil was 2008 - I didn't say that publicly until they started the rule changes in financial world in September. Without the credit crash we might have had a new high in 2009 but at risk of higher decline rate. Lets try and move beyond who is right and move to what can be done about it. But I don't think Robert has ever definitively said when a peak in oil would be (other than sooner rather than later)- that is his prerogative. Based on staff emails I know he thinks enough productive capacity exists that if economy turns around we will beat the 2008 high (but at a cost and that this case is unlikey).
Before you type your next comment, ask yourself why you are doing so... Cheers - its a beautiful day - I'm taking dogs for a hike.
82.3% certain it was 2005
Rubbish. I just stuck my head out the door and it's pitch dark and blowing a gale out there!
Damn, should've read that first :)
I suppose I could ask why--when I have been on record repeatedly suggesting that this endless debate on the logistic method is a tedious waste of time--that you keep directing your comments to me?
In any case, the question I asked was not answered.
In any case, the question I asked was not answered.
I'ved said you can tell exact oil discovery
by Panics, Manias, and War.
Chose any major date.
Like the Panic of 1907:
Nov. 22, 1905 - Oil discovered on Ida E. Glenn's farm, 10 miles south of Tulsa, ushering in the state's first major oil field and launching Oklahoma's petroleum industry.
Every time.
And I believe that May 2005 was the height of the Housing Bubble.
Hi Nate,
I’ve been reading all of this (yes, tedious) exchange between Mr. Rapier and Westexas pretty carefully. Why? Because, as I suppose like many other readers, we are trying to figure out the best estimate of when the general public will actually start to experience the negative consequences of PO. And, not just the occasional spike in prices that most folks contribute to “Big Oil” or speculator manipulation for greedy profit. Rather, the actual point in time when the price of gasoline reaches $4 a gallon and never looks back on its way to $10. The time when the media starts talking about rationing. The time when sporadic “No Gas” signs are a regular part of trying to fill ones tank – across the country.
Folks like Mr Rapier and Westexas seem to be pretty knowledgeable and have some legitimate differences. It’s a bit unfortunate that they drag out the discussion on a personal basis – but, hey – us beggars should not be choosy – small price to pay!
I’m not any kind of an energy expert. Just a retired guy who is willing to write to his government representatives and local newspapers to help raise awareness while there still might be some time available to mitigate the worst consequences. Another TOD reader and I are currently trying to craft a petition in this regard. However, quoting convincing statements from the most influential sources (like DOE) is not easy. In the most relevant DOE report they simply list the PO opinions that range from yesterday to 2030 and beyond. On one hand they talk about the need for a 20 year window to prepare for PO concerns and on the other hand they say it would be harmful to the economy to begin preparations prematurely. In the end, they make no prediction. And, unfortunately, using a source like ASPO is pretty useless – it has to be DOE, IEA, EIA, GAO or such.
So, I follow the TOD to try to make sure that I have the best understanding of the situation before I write to my congressman or local newspaper. As I’ve posted many times before – all the solutions enumerated here are of little value if the general public and our elected leadership do not believe there is a real problem.
Perhaps I can humbly offer a bit of advice to Mr Rapier, Westexas and all the other experts who so generously post their advice here (and that is a sincere statement): use many models and don’t spend too much time on any particular model – look for convergence.
In my working life, I was a developer of large, complex, business oriented, computer software systems. At various times I became enamored with one or another modeling technique. We had Data Flow Diagrams, Waterfall Model, Entity Relationship Diagrams & Data Normalization, Action Diagrams, Class Diagrams, Object Oriented Technology, Unified Modeling Language, Medical Model, Use Cases, Agile Development, Extreme Programming, etc. etc. At the end of my career, I came to believe that for any given project it was wise to use several of these tools and techniques to understand the problems and create an effective design – I found it was usually counter productive to get hung up on any particular approach for any large amount of time. After awhile, these different perspectives would usually converge on a workable approach.
So, I would urge our analysts here to put forth their best analysis using different models and look more for points of convergence rather than worrying about the correctness of any particular approach. I know it’s often hard for really bright people to get their personalities out of the mix. But, this is a very serious issue and we need to get it right. And, I am grateful that people like Mr Rapier and Westexas are so passionate about doing this anaysis.
This is really tragic, from the point of view of a lay observer such as myself.
Both Robert and Jeffrey have said brilliant and provocative things here. Jeffrey's persistence and tenacity in reminding us of the high probability that we have a dire problem have done a great service to TOD.
So have Robert's skeptical views, and his simple-yet-brilliant concept of "peak lite," which, in effect, makes the actual date of peak seem irrelevant: if supply isn't enough, it isn't enough.
I don't know who's right about the finer details here. It's clear Deffeyes' prediction is at least "off." If, in ten years, it's apparent that 2005, while not marking "peak," marked the moment of inflection toward plateau and decline, who is going to care?
I'm reminded of the disputes in English departments that caused me to forgo a PhD in that area: As the saying goes, the disputes were so bitter because there was so little at stake.
Robert's argument against this being a "tempest in a teapot" would probably mention wanting "credibility" for the peak oil view, because if forecasts are "wrong," then people won't "believe" the peak oil view.
Well, I have news for you: most people never did "believe" in peak oil, and most never will. DECLINE OR NOT. I've arrived at this tragic view over stages.
First, I thought we must get the word out because this was so important, and that once people "understood" peak oil, there would be an epiphany and a move toward "powerdown," "sustainability," whatever you want to call it. This view of mine lasted about 5 minutes.
Second, I thought that, once peak arrives and prices start skyrocketing, THEN people will get the message and jump onboard, even though it might be too late to avoid a lot of pain. Well, that didn't last more than a year or two.
Now, I think that peak oil is never going to be broadly recognized as either "the" cause or "one of" the causes for our current economic catastrophe, because it goes too much against the grain of accepted beliefs--i. e. that growth is good and can continue forever.
It's getting pretty clear that decline is coming. It's also abundantly clear that it will be blamed on something else.
It seems Professor Hatfield, one of the earliest voices in the peak oil movement, was right when he decided, a long time ago, that "the rest is silence."
It's pretty clear that something happened in the 2004 to 2008 time frame (most likely 2005) in which Deffeyes predicted that world oil production would peak, especially when we look at the 12 month running average (shown uptop). Like the Lower 48 in 1970 and the North Sea in 1999, world oil production stopped growing in 2005 in response to higher oil prices. And all three of these regions were about 50% depleted, based on HL, in 1970, 1999 and 2005 respectively.
Then the question becomes, when demand begins to exceed supply again, will we see enough supply coming on line to show a net increase in production beyond the 74 mbpd annual rate? Given the failure of the historical analogues, the Lower 48 and the North Sea, to increase production in response to higher prices and given the state of most of the world's giant oil fields today ("Oil stained brine" as Simmons puts it), and given the mathematical model, I think that the answer is no, but time will tell.
Going by HL, we should indeed be at or past peak, and even given known unknowns, i'd be quite surprised if flow rates meaningfully exceeded historic.
But since the price spike - when many, iirc, insisted that commodity speculators couldn't be influencing the price, and the price crash, whereafter many agreed that speculators were in fact the cause - we have to factor in some game theory into the above-ground aspects.
Not least of which is the seeming demise of the Bretton-Woods-II system, the beginning of the end of open oil auctions (cf russia and venezuela's oil deals with china outside the dollar-denominated market); also the threat to the role of the dollar as the principal medium of exchange for oil (being reinvested in US treasuries).
I would expect there to be a lot of geopolitical pressure on OPEC to maintain production, keeping prices down in order to maintain the value of thier existing investments.
At some point the arm-twisting would need to be more overt.
There also appears to be something of a power vacuum in the USA as the new administration (popularly elected) struggles to place officials in the face of hostility by the media (entirely unelected and totaly unaccountable).
A reading of history suggests that a crumbling empire fragments into it's component factions as the center fails to hold, as available cohesive compromises become less palatable.
In the financial world hedge funds are provoking instablities to sheperd pension funds into bull and bear traps to be fleeced, and private mercenary groups (sandline, aegis, blackwater) have thier own agenda.
All these above-ground factors make predictions very difficult, especially, as the man said, about the future..
FWIW, I get value out of watching Jeff and Robert debate. I don't read everything that gets said here. So what for some is repetition is for me (and I suspect quite a few others) is news.
My own take on HL for Saudi Arabia: Since the Saudi fields aren't getting developed by competing private companies the rate at which Saudi fields get developed is less tied to market forces. The history of Saudi production contains the effects of important political forces. So HL is less likely to accurately predict Saudi production than it was to predict Texas production.
I'd like to see a ranking of countries by likelihood that HL will work for predicting their future oil production. Which countries have the most uncertainty?
To be fair, you don't know that for a fact. The best you can say is that based on latest public estimates from official bodies we may have set a new world record.
You'll look silly if Simmons turns out to be right after all and EIA/IEA figures are continually revised down bit by bit over the next few years.
You'll look silly if Simmons turns out to be right after all and EIA/IEA figures are continually revised down bit by bit over the next few years.
I am not too worried about looking silly. That's for others to concern themselves with. Whether we set a new record or not isn't the issue. The issue (for me) is doing the best possible analysis of data to understand where we are going and how quickly. Would I have looked silly if the country ran out of gasoline as Simmons predicted? I don't think so, as I based my analysis on the best data available to me, which was better than the data Simmons had. Did Simmons look silly because the country didn't run out of gasoline?
No but we could have a bet on it. I believe there is TOD precedent ;-) ;-) ;-)
Honest just joking!
BTW, perhaps I made a mistake, but I thought that I enclosed the Texas/Saudi graph in this e-mail (not the world/Lower 48 graph which is shown). You stated, in a prior e-mail, that I had not "predicted" a near term Saudi peak, and I responded with "Perhaps the implications of the following graph were too subtle?" I would also note that the next paragraph addressed Saudi Arabia, not the world. The graph that I thought that I enclosed was the following one (published in May, 2006, using Saudi production data through 2005):
Note that the 2006 and 2007 data have been added. Khebab is going to add the 2008 data point, which of course shows a rebound, to a level below the 2005 rate.
Having said all of this, I have previously acknowledged that if 2005 does turn out to be the final Saudi peak there was an element of luck in posting this graph in early 2006.
In any case, regarding world production and Deffeyes' prediction, we have covered the numbers in endless detail.
The supply or demand for oil is based on it being profitable for the suppliers and affordable for the consumers - as we have seen in the past year if the price is high enough a large number of new wells will be drilled but the price required to make a profit for the marginal oil was not affordable.
How many gallons of petrol people buy is not related in any way to the size of the world's reserves (since nobody knows what they are!) they buy what they can afford.
So, I have a question - how can you possibly model future supply/demand in any meaningful way if you have absolutely no idea what the future price/affordability will be?
In my experience, typically each oil production model produces a different future scenario - no surprise IMO because the required data are not predictable even from day to day let alone over periods of years.
Hi WT, have you thought about adding Mexican and Russian production to that graph on the same axis as North Sea production?
The first graph (graph 25) OPEC compares OPEC crude supply to world All Liquids supply - essentially comparing 'oranges' to 'apples' - when I see data maniplulation like that I suspect somebody is trying to deceive me in some way ... why?
I recall you brought this up before. It's OPEC's own graph from their own report and they can display it any way they like as far as I'm concerned. It doesn't confuse me. I'd be more concerned with its accuracy than the way it's charted.
Crude is the vast majority of all liquids. OPEC crude is a subset of World All Liquids. Their comparison makes sense to me.
If they were showing US All Liquids, compared to world crude, I would have a problem. US All Liquids is not a subset of World Crude.
Hmmmm ...
... if people in general think that comparing things that are different makes sense (I presume that these charts are supposed to influence policy makers, I doubt my PM Gordon Brown would have realised that to use 'all liquids' data instead of 'crude' data would have meant that the data was potentially in error by ~13% or so)
... and if they think that the data of both of the two things being compared is accurate/timely enough to make any real policy decisions
... then IMO (having studied a lot of these data in great detail) I am afraid we are indeed doomed
... as evidence I would use our present economic situation
... we wouldn't be where we are if the experts and policy makers actually understood how things work and were given data to work with that actually reflected the world as it is, rather than some optimistic subset that is 'economical with the truth'.
The FT have a new energy blog here http://blogs.ft.com/energy-source/ They are covering this weekends meeting.
One item in the blog is a table analysing compliance through February with the previous cuts. The laggards are predictable, Iran 44%, Angola 46% and Libya 56% with Venezuela somewhat beter at 69%.
The Saudi's are at 108%.
There are a lot of politics in this weekends decision. If OPEC announce a further cut and all members know that Saudi and UAE will comply, and they know the market is close to being balanced, then the others could be very tempted to just not comply and gain from the Saudi/UAE cuts. I think that is why the emphasis this weekend will be on better compliance and seeing if Russia will play along. The market appears to be close to balanced right now, OPEC just needs for traders to believe prices are going higher. Russia is as big a supplier as Saudi these days so any cut by them would be valuable.
Let's say Russia is supplying 9 mb/d, and after consumption of 3m they export 6 mb/d. And let's also assume they cut that by 10% or 600,000 b/d. If prices rise by 10% they are no worse off from a cash perspective. In the past few months there was significant over-supply so there was no guarantee that if Russia did cut exports prices would rise, but now that OPEC has cut back the market is balanced. The Russian's are smart and will realize that a cut by them could be revenue neutral. So it wouldn't surprise me to see a Russian cut.
Our (Khebab/Brown) middle case is that the top five net oil exporters have shipped about 20% of their post-2005 cumulative net oil exports and that by the end of 2012 they will have shipped about 50%, with the remaining 50% being shipped from 2013 to 2031.
Regarding Russia specifically, here is our outlook for net oil exports from their mature basins (the range of the projected overall 10 year decline rate is shown):
WT
I am a firm believer in ELM - in theory.
However, we are now 9 months away from 2010 and world exports from ALL countries have not declined at all - much less the amount that you forcast even in your lower case for the top 5 only
so - back to the drawing board?
We shall have to see what the EIA data show for 2008, but the EIA disagrees with you regarding 2006 and 2007 (BP also showed annual declines in 2006 and 2007, at least for the top five). This article has a data table showing total net oil exports, based on EIA data:
http://www.theoildrum.com/node/4092
And the EIA shows that top five net oil exports in 2007 dropped to about 22 mbpd, from about 24 mbpd in 2005:
http://www.theoildrum.com/files/slide1.png
I do expect to at least see an increase in 2008 top five net oil exports, but Indonesia showed a year over year increase in their 1998 net oil exports following their final production peak in 1996. At the end of 1998, Indonesia had shipped 44% of their post-1996 cumulative net oil exports--in only two years.
Do you think OPEC (or perhaps some member nations) will ever announce they have peaked, and if so when?
Probably about the same time the US announces it has peaked in production.
I've always used +/- 2mbd as a error estimate for worlds oil supply. This works out to about a 2% error term which is quite reasonable if you think about the difficulty of gathering reliable information. On top of this we could easily have a increasing systematic error due to political pressure. Venezuela for example is known to publish dubious production numbers. So lets say there is at least a 1% error to the higher side because of politics. Few have reason to publish a number significantly less than real production on purpose.
The net is its quite possible for oil production to be as much as 3% lower than published esp if the political term is variable i.e as a region peaks its correct but as it declines production figures become more unreliable.
Simmons claims are still within what I'd argue are reasonable error terms. "Real" production could be at the levels he claims without it being outside of what one would have expected esp if certain producers had declined ( KSA).
Now given that one looks at the price signal what we have seen is that oil prices seem to have bottomed and are firming up and OPEC cuts so far have been nominal. Right now our economy is approaching the bottom of a traditional strong recession layoffs are abundant capacity has been cut housing construction is beyond dead. Commercial construction is falling. Imports and exports are approaching historic lows.
Next we are approaching a historic low season in demand during the spring. Storage is at all time highs etc.
And the price of oil is increasing ?
Memmel, wouldn't it behoove an OPEC member, cheating on it's quota, to publish lower production than is occurring?
Maybe but why ?
Lying about production being low won't have a long term effect on prices it could buy you a short term dip.
Depending on how big a lie they have told it could be difficult to suddenly tell the truth.
One would expect them to back down to real levels first before reporting numbers under the real value.
I'm not disagreeing with you but given my position and I think Simmons one would expect number if they have been inflated
to first pass through a period where they are truthful then perhaps if there is a longer term reason they might deflated them.
The reason to like about production on the high side is obvious its to mask decline. This lie if it exists could then be removed
over time approaching real production numbers. I'd suggest right now real OPEC cuts might not be about 1mbd a lot of the supposed
cut could be paper barrels being discounted. Now with that said we have seen real and obvious changes in sea born shipments and imports
so a real cut seems to be in process so then the question is whats the real value they are cutting from ?
There is no clarity here except that at some point we would expect the production numbers to approach the real value. This may actually be below long term capacity but I'd think that over time we may see a sort of real production number be reported for several months say six or more then if prices go up some of the increases will be real.
This suggest we should watch with interest at whatever level OPEC settles at after their cuts are done. What ever this value is its probably far more reliable then any we have gotten for some time.
My opinion is that whatever level OPEC finally reaches for production that they will maintain production close to this level until prices exceed 100 dollars a barrel at this point if they do have spare capacity then they will increase. If they can't get a price ceiling via production increases then we can assume that they have started reporting paper barrels again.
If they can really do what they claim then they should be able to easily maintain prices in a 70-120 or so window.
So there is a very good reason to believe real production number will become available for a time withing the next year or two.
In short if they have reported massive cuts then after this the production numbers are probably reliable.
Off topic
I was thinking about the decline in nat gas prices, and the surge of unconventional horizontal drilling etc.
this was completely unpredicted - especially here on TOD - where people were pointing to the red queen etc.
now compare this to oil, where the top 800 fields comprise 58% of global production, but 42% comes from fields with an average production of 440 barrels per day (as per Simmons presentation to the Australian texas CoC)
again: average 440 per day which makes up 42% of global production
how do we track these small fields, how do we map them? we dont.
so we have a huge blind spot in all this analysis
do we know if higher prices will bring more ultra small producers on line?
will $40 oil drive them away?
if i could produce 400 barrels a day in my back yard i'd be happy as a pig
what does geology say about the global dispersion of these small pockets?
i think we are missing an elephant in the room, because we don't have the info about it
or the math to model it
c'mon Khebab and WHT - get in there
"do we know if higher prices will bring more ultra small producers on line?"
It depends. Making money off a stripper well by drilling it today at $40 oil would be difficult unless you can pay cash for the drilling and were prepared to wait a long time for the pay-off. Most of the ultra-small producers are using old wells drilled decades ago and sold off by big companies that can't afford to run them. An experienced field service man could keep them running at a profit with just him, a toolbox in the back of a pickup, and his wife to do the book-keeping. A few weeks ago someone mentioned one such operation where a couple were earning $86,000 a year on stripper wells producing a half-barrel a day each. I have a nice little earner on a well drilled in 1953 and now down to 700 barrels per month (not per day). I've read about the original wells in Pennsylvania drilled by Col. Drake still being pumped at a few gallons per day.
We now know that Hubbert's Peak is not a smooth bell curve, but has a jagged plateau after the peak, followed by a fall off the cliff. However, many fields may never actually hit bottom, but instead level off to a long tail where stripper wells can keep going indefinitely. The catch, of course, is that the output will only be a barrel or less per day. A century from now, these wells will not be worth connecting to a refinery. It will be easier and cheaper just to use the output for heating locally, and burn it in a boiler or furnace.
Poly,
As Dale said - "it depends". Tiny independents are still drilling in the field I'm in, and you win on some and lose on others but ALL the wells must be registered with the Commission and the production from your lease is monitered to the 1/10 of a barrel at the loadline. Generally when the price is down you scavenge parts off your poorest wells to keep your best wells going and then as the price goes up, you fix them back up. You also can re-enter old wells you find in the woods when time/money permit, so well count will vary but production is still monitered at the loadline.
Dale - The discovery well drilled in 1923 is still producing across the river from me. Just for comparison - I drill my wells in about 2 days (done it in 1 with a good crew - not the norm!) with a 1500 series water well rig using air, and after flush I look for payout in 1 year to 18 months with a 1/2 BBL/day almost steady for years. It's really producing an oil seep, but the gravity is high, 38 with no sulpher or water and a spacing of 1 well/acre - It's a livin!
Poly -- We could probably come up with a stat for US stripper production decline. The data is reported in each state and plotting would be straight forward. Might have been done...I'll dig a little. It's easy to speculate that the decline is slow. Probably the biggest error in projecting forward would be the sudden abandonment of a significant number of wells. As someone has already pointed out the marginal operators will keep the better wells going but allow the poorer/damaged wells to sit idle until prices improve. A global estimate is unlikely. I doubt there is much useable data base out there.
As far as the unpredictability of the UNG drilling surge it became fairly predictable once enough wells had been drilled. The economics of short term investments are rather straight forward. And the collapse was just as predictable. The subsequent rapid rise in drilling costs had deeply cut into profitability. All the players knew it wouldn't take much of a NG price decline to kill the plays...at least for a while. This is one reason why we've seen such a rapid reduction in drill rigs: operators already had those models built and it was just a matter of pulling the trigger when the time came.
Production cut-back?
Good!
Leave the nasty, sulphorus black blood of Satan in the bowels of the earth.
It is dirty and we shouldn't be playing with it.
(definitely not injecting it into our veins)
It has all been a big mistake.
Just say No.
This does not bode well for importing nations -- or does it?
Is OPEC finally starting to act as a unified group again? Or is this a one-off event in which each member's self-interest happened to be the same as all the other members'?
Will the current upward drift in price reinforce this unification (if any)? What is OPEC likely to do if and when it realises the world is post peak? What does OPEC think the consequences of the peak are? (Till now, the Saudis seem to have had a policy of not milking the golden cow too hard, i.e. keeping prices 'reasonable'. That policy is, rationally, based on a belief about future ability to pay (as well as about future willingness to pay).)
On the other hand, will this show of unity by OPEC jolt IEA member countries into moving more urgently to reduce dependence on fossil fuels?
I wish these questions were hypothetical, and/or I had answers...
The level of cuts to date could easily be explained if they where overproducing their fields to the point of damage as oil hit 140 a barrel. I'd suggest a lot of producers are willing to pull back a bit OPEC and non-OPEC a like. Real cuts from sustainable production would probably then be in the next 1mbd cuts. Lets see how OPEC performs over the next several months.
If they do continue to cut then that should be even more worrisome since it suggests that they have very little future production profitable at 40 a barrel. If they need 60-70 a barrel to make a profit then thats effectively the same as admitting they peaked.
I'm a bit surprised that I'm the only one that seems to have found the Saudi announcement of a need for 60+ oil troublesome.
We will see but if OPEC does continue to follow its goals of cutting thats not a good thing.
Poll: Will EIA Report Inventories Increased or Decreased?
Vote here: http://energyfortunes.blogspot.com