Is a Net Oil Export Hurricane Hitting the US Gulf Coast?
Posted by Prof. Goose on June 2, 2008 - 10:15am
This is a guest post by Jeffrey J. Brown, known on TOD as westexas. Jeff is an independent petroleum geologist in the Dallas, Texas area. His e-mail address is westexas@aol.com.
Building on prior work by many people, including Matt Simmons and Kenneth Deffeyes, and largely based on great technical work by Khebab, I have been intensively studying the Net Oil Export issue for more than two years.
The simple mathematical model I have been using to talk about our export situation is called the Export Land Model (ELM). Recently, data and media reports have shown that the concerns I have expressed about our export situation are growing more valid each day.
Venezuela and Mexico are critically important to the US because of their proximity to the refineries on the Gulf Coast. From what I have been able to discern, it takes an average of about five days for a tanker to get to the US from Venezuela and Mexico versus about 30 days from the Persian Gulf. Based on recent news reports, it certainly appears that the overall net export decline from Venezuela and Mexico is continuing into 2008.
So, what has happened to net oil exports from Venezuela & Mexico to the US and what effect has had this had on Gulf Coast crude oil inventories, and why am I concerned?
First, let's talk a bit about the ELM model. As an aid to understanding how rate of production declines and rates of changes in consumption affect net oil exports I proposed a simple mathematical model, the Export Land Model (ELM), which assumes a country producing two mbpd at peak, with a subsequent production decline of 5%/year, and consuming one mbpd, with a consumption increase of +2.5%/year. This results in net oil exports going to zero in nine years, with only about 10% of post-peak production being exported. Here is a graphical image:
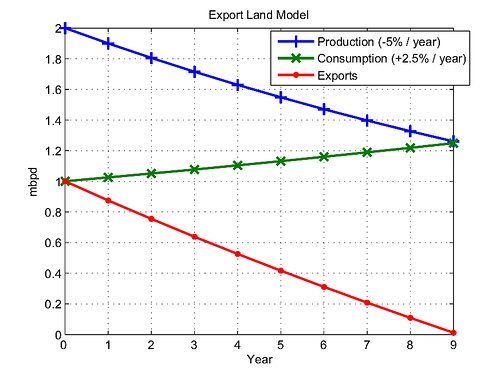
Once an exporting region hits peak production and starts declining, the net export decline rate is a function of consumption as a percentage of production at peak, the rate of change in production and the rate of change in consumption. However, net export declines tend to consistently show an accelerating decline rate with time. As Khebab and I warned in a recent paper on the top five net oil exporters, recent EIA data showed an accelerating top five net export decline rate in 2007, continuing a trend that began in 2006. Our middle case has the top five—Saudi Arabia, Russia, Norway, Iran and the UAE—collectively approaching zero net oil exports around 2031.
Recently, there has been increasing attention paid to the declining net oil exports worldwide, and last week the Wall Street Journal published a very important article, “Net Oil Exporters Unable to Keep Up With Demand.” Neil King, the lead writer for this article, recently obtained updated 2007 net oil export numbers from the EIA. I was particularly struck by the net oil export decline rates for Venezuela (-7.6%/year) and for Mexico (-16%/year).
This EIA website has net oil imports into the US by country of origin, through March, 2008.
http://tonto.eia.doe.gov/dnav/pet/pet_move_impcus_a2_nus_ep00_im0_mbblpd...
The data show that combined net oil exports from Venezuela & Mexico to the US have dropped by 414,000 bpd from 10/07 to 3/08, an astounding annual decline rate of -32%/year. This decline was at least partially offset by increases in imports from the Persian Gulf.
However, as the decline in net oil exports from Venezuela & Mexico (and elsewhere) has increased, it’s quite likely that the Persian Gulf has not been able to sufficiently offset the decline.
The EIA has recently reported a large drop in US oil imports and fairly large crude oil inventory declines, with almost all of the decline concentrated in the Gulf Coast area. Gulf Coast crude oil inventories have dropped by 15.6 million barrels (9%) in two weeks.
The last four weeks (ending May 23rd) of crude oil imports from all sources into the US Gulf Coast are as follows:
6.683 mbpd
6.130
5.173
4.996
So, in looking at those numbers it seems quite possible that we are seeing some real, tangible near term effects from the ongoing net export declines from Venezuela and Mexico, and it's possible that we could see some problems with refined product deliveries in the Gulf Coast area in the very near future, perhaps in a matter of weeks if the trend were to continue, and there seems no reason to expect it not to.
What would result from this? Well, first we would then almost certainly see calls to release oil from the SPR. The problem of course is using emergency reserves to offset a long term decline in oil exports from two key nearby oil exporters. Venezuela is showing a long term net export decline, and Mexico is on track to approach zero net oil exports by 2014. In October, 2007 these two countries accounted for more than 20% of total US petroleum (crude + product) imports.
At the very least, this situation may force an earlier recognition of our long term problem with net oil exports. One risk is that oil from the SPR will be used to perpetuate the myth, for a little while longer, that we can have an infinite rate of increase in our consumption of a finite energy supply.
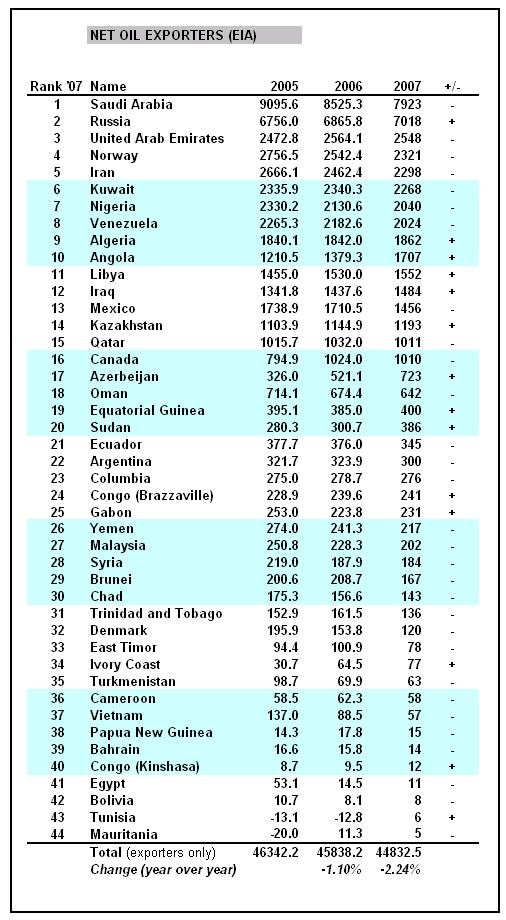
Datamunger, in a comment yesterday, has just compiled a data table showing the last three years of total world net oil exports, showing a slow, but accelerating net export decline rate:
original location: http://www.theoildrum.com/node/4082#comment-353705
This seems to further edify my reasoning above. All of these factors seem to provide evidence that we face a problem with our export situation.
Two recent Khebab and/or Brown net export articles:
Declining Net Oil Exports Versus “Near Record High” Crude Oil Inventories: What is going on? (September, 2007): http://www.theoildrum.com/node/2975
A quantitative assessment of future net oil exports by the top five net oil exporters (January, 2008): http://graphoilogy.blogspot.com/2008/01/quantitative-assessment-of-futur...
Contact
- Content: editors at theoildrum dot com
- Tech support: support at theoildrum dot com
License

This work is licensed under a Creative Commons Attribution-Share Alike 3.0 United States License.
And a big thank you to PG for some Sunday night editing work (this should really be listed as a joint article by Brown & PG). BTW, it's kind of tedious to keep typing Venezuela & Mexico. I suggest V&M.
Nice analysis as usual WT.
BTW - VenMex may be a bit more self descriptive than V&M...
Hmmm. V&M versus VenMex. I think we should let PG decide.
VenMex you immediately understand. V&M sounds like a medicated salve, or a low ranked technical college.
Just my two centavos.
Indeed, VenMex seems an intuitive shortening for a pair of LatAm countries..
VenMex gets my vote.
2008 looks quite different in Q2. Katrina in red.

Source: EIA.
Enjoy.
The table may be incomplete.
Both (AFAIK) Indonesia and the UK were oil exporters in 2006 or 2007. Both are now competing with the rest of us for oil imports (in small but rapidly growing volumes).
Alan
Indonesia stopped being a net exporter in 2004 and UK in 2006, which is probably why neither of them are on the list. IIRC, 2005 was the last year UK was a net exporter.
Interesting - who would have thought that transit times could also be such a major factor?
It seems like the oil fairy is not only limited by the fact that oil is finite, but that it actually takes time to transport.
And this just might explain the tanker rates - it isn't about increasing production, it is about increasing distance. After all, instead of one tanker making a round trip in a dozen days, it is now a tanker making a round trip in five dozen days. Which means that you now need 4 extra tankers to maintain the same flow of crude.
I think a lot of signals are starting to get crossed, meaning that a lot of people are taking comfort in the wrong things. Much like how a truly hot burn on the skin feels cool at first contact.
The reality of dissonance will not be easy to master - I still remain amazed at how the price of diesel has overtaken the price of gasoline, even in Germany, where it gets a 20 euro cent tax break compared to gasoline.
As usual, Matt Simmons pointed out the difference in transit time, long before I did.
When I read that part above, the thought that struck me was hurricanes and not just from the title. That is, if V&M are not exporting as much to the U.S. and more is coming from the Persian Gulf, does this mean the effects from some sorts of of unplanned refinery shut-downs are going to have a bigger lag time before things are running smoothly again? I live in Atlanta and can remember after hurricane Katrina that a few people didn't come into work for a day or two because of short-term shortages in gasoline.
As far as transit rates go slow steaming is becoming increasingly common where ships slow down to conserve bunker fuel. Its easier to find info for container shipping but we would assume that oil tankers are also using the practice. This would work to increase transit times.
Dated but its the problem we face.
http://links.jstor.org/sici?sici=0160-5682(198211)33%3A11%3C1035%3ATEOOPO%3E2.0.CO%3B2-Z
http://seekingalpha.com/article/77472-teekay-tankers-limited-q1-2008-ear...
http://www.istockanalyst.com/article/viewarticle+articleid_1980755~zonei...
In any case this would put some pressure on tanker rates and show a bit higher amount of oil in transit.
But the truth is less oil is actually moving since all voyages are probably taking longer.
Well, let's consider our happy friend the oil tanker.
If he can make 4 trips from Mexico or Venezuela in 20 days, he hauls 4x his holding capacity in those 20 days.
If he can only make 1 trip from the ME in thise 20 days, then he can only haul 1x his holding capacity.
Now... If the company that owns him wants to maintain the same rate (4x in 20 days) then the company needs to have 4x as many tankers. This drives up the overall cost of shipping by 4x as well.
I think that it would be an interesting article to post that asks 'What if we only got oil from one or two parts of the world that were far from us?' i.e. for the US, if we could only get oil from the ME and not Mexico or Venezuela; For Europe, if we could only get oil from the ME (again) and not the North Sea. What does the supply chain look like? How vulnerable is it to natural or man-made disruptions? How expensive is it?
Good stuff...
Diesel and kerosene are the "essential" fuels, providing third world cooking and military, truck, farming and aviation fuel. They are very close together in the distillate column and I guess interchangeable to some degree at a refining level; and a greater degree when used. Gasoline is rediscovering its status as a by-product, albeit one that doesn't suffer any lack of demand.
An interesting analysis could be made of the worlds diesel/kerosene capacity. I bet it would provide a fascinating twist to the ELM model and governments are likely to exert some form of control over these supplies before gasoline. For instance, the US military recently standardized all its equipment on JP8. Diesel can be used too in many/most road vehicles, but in theatre they only need JP8. Guess who will get the last drops of the stuff?
Who exactly is building ships these days. Korea, China, India?
The big three constructing countries are South Korea, Japan, China.
This post is a magnificent insight. Westexas has explained what the shipping people are calling, "The tanker spike that came out of the blue".
http://www.bimco.org/Members%20Area/News/General_News/2008/04/09_Feature...
So $140 oil is a result of a 2.5% lull in supply + 2 years growth of demand.
Next year we'll have 3 years growth of demand, and is decline is indeed percentual will be > 5% drop since 2005.
But how many next years do we have left before us?
Note that oil prices and the dollar are both going up this morning.
Actually that is incorrect:
http://finance.yahoo.com/currency/convert?from=EUR&to=USD&amt=1&t=1d
as you can see by today's chart, the dollar got stronger overnight (oil was steady and fell slightly) then in the past 4-6 hours the dollar has gotten weaker and the price of oil has risen.
So, oil was up this morning while the dollar was up against the Euro, but not as much as it was previously up? Well, that is certainly an important point.
Hes the AntiDoomer, he thinks plug in hybrids are going to save the world along with the tooth fairy and santa claus, just let him pretend it's all going to be ok so he can remain sane. No matter how much we dispel the myth of the falling dollar causing rising oil prices some people are going to keep refilling their kool-aid. On another note, I think theoildrum is starting to become over-run lobbyist types that are paid to put out disinformation. I mean Kdolliso was a perfect example of that, makes me wonder how many others there are.
The work has already been demonstrated in multiple previous TOD articles which you apparently either refuse to understand or are incapable of understanding. Oil price has been increased by some small percentage by the drop in the dollar but the change in the dollar does not explain the correspondingly far larger rise in oil price.
The supply-demand shortfall between actual production and growing developing nation consumption does explain the price rise, however. And no matter how much you refuse to accept that, it is still the truth.
Greyzone, I only pointed out that today the price of oil has followed the Dollar/Euro chart today:
http://finance.yahoo.com/currency/convert?from=EUR&to=USD&amt=1&t=1d
Hell, look at this link then look at the oil ticker on the right hand side of TOD, for the last 12 hours they are almost Exactly the same.
Any Statisticians in the house?
Do a regression!
Use the price of oil as the dependant variable, and the exchange rate of Euros to Dollars as an independant variable. Throw other things to boot (production rates, etc.) and find out if they're related.
Once you have these factors, and run the regression in a nice Stats package (Thinking Minitab) then you can truly see if the relationship is statistically significant and put the debate to rest...
Sheesh....
Somebody put together the data and I can do it in about ten seconds. Send it to me at the eds box.
Of course, it will be without the lags, etc., that are probably accepted in the literature, etc., etc. But I can crunch the hell out of it whatever it is.
Hey- throw in the speculator stuff too. See if someone can get the trading volume of short and long sales of Oil.
So-
Your Y is the price of Oil
X1 is the exchange rate of the dollar to Euros
X2 is the production rate (Mb/day)
X3 is the volume of short sales of Oil
X4 is the volume of long sales of Oil
And so forth... What other theories are there for the price of oil to go up?... Heck, throw 'em in as long as we can get data.
Think it would make a great article.
I think all one would have to do is just show the graphical results (Scatterplot of each X vs. Oil Price with a regression line) and statistical results from Minitab, and P-Values.
Like so for the graphical (one for each X of course):
and like so for the statistical:
And if there are other good packages than Minitab, fine, they'll do the job too..
I think one would just have to explain the concept to P-Values for the 80% of the population that hasn't had staticstics and just show which variables are significant and which aren't.
I think the data will speak volumes.... :)
I posted this below, but thought I would put it up here too. The correlation between the Exchange rate of US Dollar to Euro and the price of a barrell of oil is
.83 for 1/4/99 -- 5/28/08
.79 for 1/4/08 -- 5/28/08
Both are highly significant (p-values < .00001). It is important to remember that the maximum correlation is 1. This indicates that these two processes share somwhare between 63% and 69% of their variance. All in all that is pretty high as far as most social/behavioral data goes.
I expect you will find that on short term data (over a longish time period) you will find intervals of very high correlation and periods of nearly zero correlation which in the total sample will show a small positive correlation.
But in truth there are 2 different situations: 1)periods when oil moves with dollar due to commodity funds, etc. 2) periods when oil moves on its own underlying fundamentals.
If we knew 'when' these switches happened, we would all be millionaires (and then they would happen earlier and earlier or not at all)
I keep hearing this whole the value of oil hasn't changed at all if you look at it's value compared to gold..
http://www.thedailygreen.com/environmental-news/latest/oil-gold-commodit...
Why is this, or is this legit?
Oil is used for transportation fuel, pesticides, pharmaceuticals, cosmetics, lubricants, heating, and plastics.
Gold is used for a "store of value", jewelry, dental fillings, and electrical contacts.
In our current system, oil's value is exceedingly intrinsic, and gold's value is exceeding extrinsic. We may want gold, but we need petroleum.
I would also argue that gold is another kind of money, in that its only value is the value we assign to it; gold has almost no inherent value.
Why would you want to compare the value of oil to only gold and not also to wheat, uranium, the NASDAQ, copper, consumer goods, median wages?
This is less than legit because the comparison extends back only until 2001.
Thanks, that makes sense...
And according to this wikipedia graph, global gold production has been on a decline since 2000 as well.
Source: http://en.wikipedia.org/wiki/Gold
The graph in the article is misleading. By placing the oil Gold ratio on the same SCALE as the price it compresses the variation in the ratio. The price of oil has nearly doubled in Gold terms since 2007.
At the beginning of 2007 an ounce of gold would buy over 12 barrels of Oil on the NYMEX or a 0.08 ounces of Gold per barrel of oil. Now it's down to 7 barrels of oil per ounce or 0.142 ounces of gold to buy one barbell of oil.


If an export supply crunch is about to hit the US shortly then I would expect US $ to suffer a hyperinflationary collapse within 6-12 months. Possibly followed by every other currency. It follows that even before that point physical Gold will become unavailable as it always has during times of financial crisis.
So then you will quickly see Gold at $50,000 per an ounce in 2008 $ and maybe 50,000,000,000,000 $ in nominal fiat currency $. The Gold to oil ratio is any one's guess at that point :)
Just to note--the moves in the stock market have been having a bigger effect on the dollar lately (over the past couple of months) than moves in oil prices.
Not to say that oil prices don't affect the dollar, but the primary movers are constantly shifting.
Westexas,
The people with whom I am able to intelligently discuss PO with came to the same conclusion last week when they heard about the tanker "unloading" problem. However, there is a difference of opinion as to cause. While it seems clear that Mexico is facing geological realities, what is the story with Venezuela? Is it more of a petroleum industry infrastructure problem? I couldn't walk away from discussions with any clear opinion on the cause.
Has Venezuela peaked geologically?.. or is it more of an "investment" problem?.. or just mismanagement?
Probably all three (regarding at least conventional production), however, a key point (that Ron has pointed out before), oil production in Venezuela started declining prior to Chavez coming to power.
In any case, the EIA data show a 10 year net export decline that has been recently accelerating. Trying to model unconventional production is a problem, but the current trend suggests that Venezuela may be on track to approach zero net oil exports within 15 to 20 years.
Venezuela, like Canada, has massive unconventional oil resources. Orinoco bitumen is a better resource than Alberta tar sands.
China has signed a deal for 400,000 b.day in 2013 (China will build a special refinery to process this tar).
Galp Oil (of Portugal) has come in to replace COP and other US oil companies in one block of Orinoco oil.
I think conventional oil is in decline (like Canada) but they have a viable alternative (like Canada).
Best Hopes for Orinoco "oil",
Alan
Here are the 10 year EIA numbers for Venezuela (total liquids):
Production: -2.8%/year
Consumption: +3.5%/year
Net Oil Exports: -4.4%/year
And as we would expect, the net export decline rate is accelerating. It's going to take a pretty big effort to turn the net export trend around.
Looks like Indonesia might pull it off:
Indonesia\'s Oil Production Might Exceed One Mln Barrel a Day: 2010: VP
Mexico claimed it could maintain production of over 3mbpd for 2008. The UK government predicts rosy production prospects as output crashes before everyone's eyes. Russia claims declining output will reverse and exceed 10mbpd this year. And now Indonesia. Spot a trend? Anyway, if they were really on the way to becoming an exporter again, why would they have just pulled out of OPEC?
Here are the 10 year numbers for Indonesia, which has shown a 10 year total liquids production decline rate of -4.3%/year:
http://tonto.eia.doe.gov/country/country_time_series.cfm?fips=ID
And a chart:
http://www.indexmundi.com/energy.aspx?country=id&product=oil&graph=produ...
Don't see much hope of turning gap around, even if they can marginally increase production for a while.
Something I have observed in the Indonesian oil patch.
All nonprofesional oil patch employees need to be natives and that includes nearly all maintenance. They are a tropical nation and don't have the work ethic of non-tropical climates.
They seem to have the highest rate of red tag equipment in the world.
That'll be why Indonesia just left OPEC then.
So Indonesia hopes it might get to 1 million bpd when it was 1.5 million within the last decade. That's "pulling it off" is it? What's the betting internal demand will have eaten up that increase (if it happens) by then.
Do you get paid for this?
Unlike Canada, Venezuela is developing it's unconventional oil at a measured pace.
Best Hopes for SOME exported oil in 2030,
Alan
Indonesia will increase production.
Indonesia will increase production.
Indonesia will increase production.
Indonesia will increase production.
Indonesia will increase production.
Hey, the US increased production in 2007 too!
S'truth!
Or smart management, why sell the oil cheap today when you can sell it at a higher price in a decade?
Thanks, WT. If you ever wonder what affect your writing has, and TOD, last Sept I left my job to take a job that has zero travel...I work from home now. I was spending a small fortune on fuel commuting to Phoenix, but having been an avid TOD reader for years, I knew higher gas prices were just around the corner and so when this position came up, I felt I knew that it was time to change...and it's worked out quite well...I was in front of the crest. So, thanks to you and all the TOD contributors. I've watched your ELM develop and just want to tell you...great job. I hope our country wakes up, rolls up its sleeves, and then embraces change. Eight years ago had our President only said, "make one of your cars a gas sipper," our populace would have at least started the immunizations...the government failed to protect the public.
Well, good (and bad) advice has no effect on your life, unless you act on the advice.
Has anyone calculated if this 2.24% export drop is more actual oil than was affected by the 1973 Oil Embargo?
That was a net loss of about 4 mbpd. 2.24% however is close to what was taken off the market in 1979.
Yergin (sic) does a good job explaining that even worse than supply shortfall per se was the panic that ensued.
What was better about the 1973 Embargo is that it created universal shortages. Escalating prices creates "demand destruction" which translates to shortage based on the size of your paycheck.
The table looks like:
46,342.2 - 45,838.2 = 504 mbpd (2006)
46,342.2 - 44,832.5 = 1,509.7 mbpd (2007)
Total change per year would be:
504 x 365 - 184 million barrels of oil
1,509.7 x 365 = 551 million barrels of oil
Total Drop in oil exports: 735 million barrels
Oct 73 to March 74 4 mbpd x 181 days = 724 million barrels
Does this seem a reasonable?
In calculating the time span of the 1973 Oil Embargo, it might be shortened to 151 days, Oct 17, 1973 to March 17, 1974.
At 151 days the loss would be 604 million barrels of oil.
If that is a better number, we are at 32% worse than 1973.
In 1973 OPEC specifically cut off the US.
This time around it's the poorer nations getting the shaft first.
Yergin is a great historian on the topic of petroleum. He's a lousy predictor though, so be careful to watch sentence tense when Yergin speaks. Anything past tense is usually pretty good. Anything future tense is usually pretty bad.
I dunno GreyZone...it seems that most of Mr. Yergin's predictions are actually rehashings of the past. "Oil will return to $x per barrel."
A prudent person would ignore him completely
I'm referring to the Yergin of The Prize, not the blinkered Pollyanna. He documents what went down to a T - great book. A must read. I learned heaps from his writings on '73 and '79 to apply to speculate on the outcome of the present situation - achieving the opposite conclusion he has, of course.
I don't see the gulf refiners having an issue getting feedstock ( and not from the SPR). This is a supply chain issue and as of current day, there is still crude to be had elsewhere (not V&M). Unless they are mismanaging their inventories and doing high risk JIT inventory of crude, then the shortfall from V&M can be mitigated, again, as long as there is crude to be had elsewhere and even given the longer transit times.
Taking extra supplies from elsewhere though would result in prices being bid higher, as someone else is currently using them.
It boils down to extra pressure on prices on top of that already in the system, presumably making a break for at least $160/barrel and perhaps $200.
Thanks for another great post, WT and Datamonger.
New MOL (Minimum Operating Level) Demand
GWB gets on his knees and begs the King for more oil. He gets 300,000 b/day (the King was in a good mood).
Assume that this replaces Mexican oil (3 days I think to Houston or New Orleans). 30 days from Saudi Arabia.
(30 - 3) x 300,000 = 8.1 million barrels to fill the longer pipeline. About 20% of one day's net world oil exports for this new demand.
Alan
On the bright side, if there is a revolution in the Kingdom of Oil, we will get to draw down this MOL oil when we need it most.
Thanks to all of you. Seeing this string of tankers as a MOL pipeline helped me understand where the 'extra' barrels may be tied up. The reports of Gulf Coast 'tanker delays' causing that 8.8 million barrel draw last week seems much clearer. Not much comfort in being at the very tail end of that 10,000 mile supply line either.
Read my slow sailing post. Not only can the oil be coming from farther but the tankers can be moving slower.
KSA owns a lot of its own tankers no reason it can fill them and tell the crews to take their time.
KSA can do the following.
1.) Fill local storage and count it as production.
2.) Drain storage to ships and count it as production.
3.) Have the ships sail slow and show it as higher sailings in one particular month to tanker trackers.
4.) Potentially even have ships anchor for a bit after leaving port.
5.) If needed don't fill the tankers completely and add water.
6.) Claim a increase but simply redirect traffic from the west to the east and vice versa.
I agree. That string of tankers/pipeline image is very helpful to me as well. Thanks.
One of the early oil shock model posts I did considered the micro aspects of oil production. (http://mobjectivist.blogspot.com/2005/06/part-i-micro-peak-oil-model.html) The pipeline analogy is very good and it transforms into a dataflow model readily. Each one of the pipeline stages adds a latency and then through an assumption of proportional rates and the math of convolution, you can intuit the way production can shift to the right:

Depending on how efficient the transfer rates are, the curve gets shift a little bit (efficient transfer) and quite a lot (inefficient transfer).
We need to keep the huge size of the V&M net export decline to US shores in perspective. The data table that Datamunger did showed that total worldwide net oil exports dropped by about one mbpd in calendar year 2007.
In a six month period, from 10/07 to 3/08, net oil exports from V&M to US shores fell by 414,000 bpd.
Excellent work Westexas,
I think this is pretty profound because most of the people concerned about peak oil were concerned about production as a whole, but peak net exports matters way more because the price of oil is based off the exports. I think we are going to see oil prices rising a lot faster and sooner than we expected because of this, and the biggest importers are going to be hit hard. I'm am going to be putting ELM into my slideshow I am working on for sure. I don't know why people like Stuart disregarded the ELM? Also Hirsch, Pickens and Simmons don't seem to be saying much about it when they are on TV, It's the next Katrina except it's making landfall but it's a category 6.
Also National Geographic had a pretty good story on Siberia and how Russia is growing off of it's oil riches, perfect example of ELM.
http://ngm.nationalgeographic.com/2008/06/siberian-oil/paul-starobin-text
Thanks and Great Job,
Crews
Last month I had lunch with Matt Simmons during "Platts Securing Benchmarks and Supply: The Challenges for Crude Oil" in Vienna and as well as being very knowledgeable and friendly he also encourages openness regarding peak oil related issues.
In fact the beigest problem at the conference was that apart from Matt and Professor Kjell Aleklett from ASPO all the speakers appeared to be either ignoring or speaking against peak oil.
Matt and Kjell are forced to keep repeating the same BASIC message because peak oil is not recognised by the industry, even at this late date.
The export Land Model and E.R.O.E.I. are too advanced to discuss when the you can’t even get the rest of the speakers to acknowledge peak oil.
Here's another reported drop
Cameroon Oil Production Dropped 2% Last Year on Drilling Delays
But there are still optimists...
Nigeria: OPEC to Spend $160 Billion to Increase Capacity
World oil output at 95-100 mbpd by 2020:Total
Sooner than later we will confront essential issues. Will the financial consequences of internal US demand destruction hobble demand in other countries? Is is possible for the US to live off its own production at 5-6mbpd? Is that enough for essential services: production, transport, processing, and delivery of agriculture goods; energy; and home maintenance? Will a US with a wrecked economy have the will to invade other countries for petroleum? What does the world economy look like with a United States dependent on it's own petroleum?
Current US extraction rates are at approx. 1950 level. Imagine the level of economic activity US had in 1950 and then factor in double the populace. Personally, I think the US can live well with its own current oil flow rate after considerable dislocation and resettlement and restructuring of the economy and vast alteration of personal behavior and culture. There's a lot of fat in the USA that must be lost through a crash diet.
Good work, WT. You've been beating the gongs for ELM for a while now, but it looks like it's just about now that the poop is nearing the blades.
I continue to point on that there is an additional adverse factor, much harder to prove, but a direct result of simple logic: hoarding. The incentives for taking oil out of the ground diminish when it's value goes up exponentially just sitting there. The cost of oil is determined at the margin, going down several miles into the ocean. What's the incentive for those with easier-to-get (relatively) oil to be in a big rush to bring it to the top?
I use the word hoarding which has negative connotations I do not intend, any more than withholding cocaine from an addict is negative, except that it's dangerous.
In a word, cashflow.
Cashflow v future asset value? No one is ever in a position to resist today's dollar v many more tomorrow? I think there are some that will be able to figure it out. And if they can't figure it out on their own, being accused of it by you-know-who might set them to thinking about it.
On top of that, those incentives must have plunged on May 18, when GWB told leaders of ME countries:
I translate: “Keep in mind that just as you will be depleting your finite oil reserves, we will be turning more and more of our crops into biofuels, no matter what happens to people in food importing countries (like yours, BTW).”
If those leaders then had a look at what happened lately with the purchasing power of their dollar reserves in terms of grains, oilseeds, etc., courtesy of the current US monetary policy, the only logical response from them would be to cut down their oil exports to just cover their imports, so as not to add any further dollar to their fast-depreciating (in real terms) reserves.
With all due respect, the same logic was used during the Florida land boom of the 1920s, and during the recent housing boom:
"The incentives for selling this plot of land in Florida diminish when its value goes up exponentially just sitting there. Soon we'll be running out of land, nobody is making any more. Just buy it and sit on it, the price is guaranteed to go up!"
Or as Mark Twain allegedly said: "Buy land, they're not making any more of it"
I know that land and oil aren't directly comparable - land can be used and resold, oil can only be used once - but if everybody just sits on their oil wells and nobody is selling, then the first person to blink gets the highest price. That's why OPEC failed. Also most exporters need to sell oil in order to buy food (Iran), or to import manufactured goods to provide the illusion of ever-increasing prosperity (KSA). The oil producers can't afford to just sit on their wealth; you can't eat oil, you can't drive oil, it has to be traded for food or cars or other goods in the global economy.
It's not either-or -- one need only pump less than one can. No one stops pumping altogether. Is everyone forced to pump to the max? No. That's all I'm saying.
I agree; pumping below capacity is what Saudi Arabia has been doing for years. But they were possibly the only ones doing so; and now, despite the clear potential for long-term price rises, nearly every country is still pumping to capacity.
The sovereign wealth funds are instructive: if they believed oil was the best investment, they would be hoarding it; but instead states like Abu Dhabi and Kuwait prefer to exchange oil for stocks and shares. The rationale is to replace a finite resource with an infinite revenue stream. But will the assets they are buying continue to provide economic rent in a post-peak world?
Abu Dhabi is investing in a University and town called Masdar that does not require oil to run. NPR did a story it a few weeks ago.
One of the disturbing things about this is that if you watch the documentaries that are out there on YouTube etc 'A Crude Awakening', Oil Smoke and Mirrors' et al. most of them were made in 2005/2006.
The overall picture they present is that about half of the world's producers have gone into decline
and whilst they remain great primers .... judging from the table above it would appear that the picture has changed .. somewhat dramatically.
Oh ... heck.
Time for a sequel or three.
The more I try to look at the bigger picture of why oil prices continue to go up, the more convinced I am that the export land model (ELM) is trumping peak oil. When we eventually hit peak oil (who knows when that will be...) it's only doing to make things more painful than they already are.
I sent a private email to WestTexas asking him to recant his model so we could figure out real out production :)
I figured if the US congress can sue its suppliers then hey I might give it a shot :)
No your right at the moment its practically impossible to know what the real oil production is. In a sense export land has made the data set very noisy. But the problem with this is that we probably have also started into a fairly steep production decline and eventually it will show up in the data on top of export land.
I did a big long post on this but it boils down to Export Land and Production drops having a slightly different signature in price.
Export land is incremental pressure and would be steadily driving up the price. Dropping production regardless of the shell games people play eventually shows up as a steep drop in inventory delivery etc. You can hide it but not forever. This causes more of a surge in prices and price spikes.
Export land pretty much ensures that once new highs are reached because of production problems the lows won't be much lower.
So production declines are driving the highest high's and export land is driving the lowest lows for price.
So the recent price increase since last October have seem to indicated both processes are in play and we are past peak in production and export land is active. It may be six or more months before oil producers are forced to admit to production declines but eventually they will.
My stab is this should result in prices never dropping more than 10-15 dollars from the last highest high regardless of how high prices go.
Memmel: One factor almost everyone ignores is the huge undervaluation of the Chinese Yuan-a doubling of the Yuan value over the next 6-7 years-which is the current trend-would cut oil prices in half for the world's largest industrial economy.
Well to some extent but they run a trade surplus and have a lot of dollars these would devalue.
I'd say what ever they make off increasing the value of the yen would be lost in lower exports and devaluation of their foreign currency holdings so at first pass its a wash. Also of course they would
be paying more for imports of all other commodities. And potentially food imports in the future.
Now if the Yuan could some how take over the role of the petro-dollar allowing them to print as much as they wish and maintain a strong currency then its a different story. However in my opinion oil itself has taken on the role of gold and we no longer have real fiat currencies instead the price of everything is pegged to oil.
This means regardless of games to change the relative value of the various fiat currencies the overall cost of everything is now constant vs oil. So its now better to treat the currencies as working under a oil standard. Note that this is very deflationary.
Regardless of whether we are at peak or "peak-lite" (a term coined by Robert Rapier to describe the period shortly before peak), the key issue is that supply is not covering growing demand at current prices thus prices increase to constrain demand to the existing supply. It will, of course, be worse after peak than before.
Some of those who argue we are not yet at peak should take that prior sentence and think on it. If these are the sorts of economic dislocations and crude prices we are seeing before peak, what will it look like if oil supply begins to contract at a 4.5% annual rate? Anyone? Anyone?
Hey folks, see the "share this" button? Go hit that, then click reddit, the go vote this up in as many subreddits as you wish. :)
I reddit.
But will it help?
I'm not sure 'hoarding' sounds worse than 'resource nationalism' which seems to cover the same concept. Perhaps a slump on a scale comparable to the Great Depression is preferable to continuing along the growth path we're on, both in relation to the environment and specifically in relation to Peak Oil?
Obviously there are 'problems', to put it mildly, in arguing for a 'slump', but perhaps, on balance, it might be the lesser of two evils?
Hey Westexas...
Ever hear of a guy by the name of John Nash?
He was the subject of the movie 'A Beautiful Mind'...
He was a mathemetician that basically came up with an economic theory called 'Game Theory'.
He went on to win the Nobel Prize in Economics.
The ELM seems to be a great (possibly new) economic theory and may come to pass (unfortunately)...
Anyway, yes, even folks who weren't quite looking to make big discoveries win the Nobel. For instance, the gentlemen who discovered the remnants of the big bang weren't even looking for it, and won the prize in 1978- a prize today worth about $1.6 Mil.
Just a thought...
Or a more likely scenario is that hordes of angry Formerly Well Off's go after the Peak Oil/Peak Export messengers with pitchforks and torches.
don't forget the boiling oil and witchcraft.
Nahhh... The oil (even if it's biodeisel) will be worth about $500/barrel by then and either too expensive to find or too valauble to use this way.
Acutally, I beleive the Nobel Prize is paid in Euros, so it might be north of $2 Mil by now, and maybe WAY more in a few years.
And the medallion they give you is made of gold- a very precious commodity Post PO...
:)
Actually, I think that the boiling oil will be reserved for the guys running the Peak Oil websites.
Nothing wrong with the ELM as it looks a lot like the leveling effect outcome of unconstrained globalization. Spreading the wealth as is promised by globalization allows the poor people to become more wealthy at the expense of the average wealthy, who will lose some share of economic resources. This basically shuffles the chairs on the deck. ELM does the same thing, but perhaps in reverse. It shows how certain countries will feel more pain than others but not necessarily how the collective will fare.
Westexas, I've been following your (and Khebab's) work on the ELM for some time - it was certainly eye opening for me when I first read it.
I have a question with regard to how you model export land countries' growth in oil demand. How do you account for the decision-making of export land governments that rely solely on oil revenue? Most of the middle east, and Venezuela, fall into this category. If their net exports ever truly fell to zero, the governments would be bankrupt, as their primary source of revenue is oil sales.
While rising oil prices will buy exporting governments time, eventually they will have to scale back domestic oil subsidies, or even introduce rationing, in order to maintain minimum government revenues.
I'm not suggesting that this implies KSA or others will keep exports at current levels - but I am suggesting that exports will probably level off at a much lower level, rather than hit zero. Iran , for instance, has already begun rationing as it feels the pinch of lower net exports.
Have you taken this into account in your modeling, or do you have reason to believe that this is unlikely?
I have proposed Phase One and Phase Two net export declines.
In Phase One, cash flow from export sales increases, even as export volume declines, because rising oil prices more than offset declining volume.
In Phase Two, cash flow from export sales falls, as export volume declines, because rising oil prices can't offset declining volume.
In most cases, we would probably expect to see a positive feedback loop in Phase One, causing an even faster rate of increase in consumption, e.g., Saudi Arabia. I suspect that by the time that an exporter gets in Phase Two, what they do regarding consumption won't matter a whole lot. And I have tried to use the term "approaching zero net oil exports." We may see a lot of world trade being reduced to net food exporters largely trading with net energy exporters.
Also, if you look at the original ELM, I used a consumption increase of +2.5%/year, which with the production decline resulted in Export Land going to zero net exports in nine years. If they had no increase in consumption, they would go to zero in 14 years, not a really big difference.
And who will Brazil, #2 ag exporter and quite possibly 1 million b/day oil exporter, trade with ?
I think the President of Brazil said that "God must be a Brazilian".
Best Hopes for Brazil,
ALan
I just hope it stays ignored while the US and other bellic countries point their nukes around.
Ever hear of the Monroe Doctrine...?
Someone here in the good ol' USA will look at this as just an extension of our own backyard like we have for about the last 200 years... Brazil will kinda be like the neighbor with the garden that the kids in the neighborhood will go and eat the vegetables from when they aren't looking.
Except the kids in the neighborhood will be poor and starving.
And one of those kids is a big bully with a red, white, and blue flag...
And nukes. (And as Teddy Roosevelt said about the Monroe Doctrine: "Speak softly and carry a big stick".)
Now we have the Cheney doctrine: "We don't need no steenkin' doctrine!"
"We may see a lot of world trade being reduced to net food exporters largely trading with net energy exporters."
Australia is both but we will need oil to keep the food production rolling along so net energy exporters are also vulnerable to oil shocks. Oz currently has net imports of 35% of oil supply after being briefly self sufficient in 2000. Our chief mineral export is still coal but a lot of oil is still required to move it from mines to ships. Oil supply disruptions could easily threaten our exports of coal and urnaium. "Net energy export" is a label that too many politicians in Australia like to throw around to give comfort to the masses that we are OK but the recent petrol prices have certainly given lie to to that argument.
Er, CTL?
Maybe. It will take 10 years just for the politicians to approve it and you have the whole GHG debate to overcome first. At any rate it is not going to do much more than provide enough synfuel for essential services, one of which may be deemed to be agriculture. I think GTL or CNG more likely than CTL but any of these alternatives are going to be expensive.
I'd doubt that past experience will be a reliable guide to how fast decisions will get taken in future.
The decisions may be just as dumb as they are now, and are likely to be even less thought through, but with the pressures that we are talking about, in this case not enough oil to produce coal, uranium and food for export, then the decisions will happen quickly at least.
If there were serious delay in products which the big nations need, then one way or another they will take the decisions for them.
I'm pretty sure that here in Oz - and in many other places around the world - the whole concept of emissions control will be thrown out the window as Oil become more scarce and more expensive.
We will burn everything in a desperate effort to "keep the good times rollin'". QLD is spending Au$13,000/minute on roads, and most of the new construction (including an upgrade of the road to the Brisbane Airport, talk about throwing good money after bad) won't be ready till about 2012.
At least when we get shortages, we can dig the roads up and recycle the Oil in them...
looking at the period in question.... Oct 2007 to March 2008
With recent world prices demand is down in the US...
here's the demand graph comparing Oct through to March '08 with the same period '07.
comparing Feb 08 to Feb 07, demand was down 1.5 million barrels per day
comparing March 08 with March 07, demand was down 800 thousands barrels per day
So with demand down so much, US net imports from somewhere had to fall
Looks like you might have found some of it :)
Could also explain falling inventories
Why hold inventory if people arent buying???
To add a bit.... if the US was experiencing a special net import supply problem (beyond the world situation) i think one would expect to see WTI spike much higher than Brent...
Take a look at Louisiana Sweet vs. Brent: http://www.upstreamonline.com/market_data/?id=markets_crude
WTI is a quirky measure. Cushing inventory is building slowly (nearby refineries shut down) while Gulf Coast inventory has been falling sharply.
Any idea what effect today's unplanned shutdown of the Motiva Port Arthur (TX) refinery will have?
no spike in Louisiana sweet
Could you give a link to the EIA monthly data ? I scanned their site and it did not jump out at me.
I know where to get the weekly data, which is rushed out 4.5 days later with estimates, etc.
The monthly data is much better quality, but slower.
Thanks,
Alan
http://tonto.eia.doe.gov/dnav/pet/pet_cons_psup_dc_nus_mbbl_m.htm
To get barrels per day, twiddle the menu at the top
DM, did you see the discussion/request for a regression up above? If you have that data handy that they are talking about, I can run it quick and dirty...send it to me at the eds box.
The FED has good exchange rate data...easily downloadable
http://research.stlouisfed.org/fred2/categories/15
and they maintain a WTI spot series
http://research.stlouisfed.org/fred2/series/OILPRICE?cid=98
Or you can get nymex data from the eia
http://tonto.eia.doe.gov/dnav/pet/pet_pri_fut_s1_d.htm
sorry, should have been clearer. I am actually in a meeting right now--will be for a couple of hours. Was hoping someone could get the data and send it to me (in excel is fine), so I can just run it...then I'll post results, etc. when I get home.
Prof -- I am running the regression now...will post results shortly
Since we have just two variables, we might as well just look at the correlation and its significance.
From January 1999 to May 28, 2008 the two variables (exchange rate of $ to Euro and price per barrel of oil) is .82395 with an associated p-value < .0001. This is highly significant. In fact, these two measures share some (.83)^2 = 69% of their variance.
For just January 2008 to May 28, 2008 the two variables are correlated .78365 with an associated p-value <.0001, sharing 61% of their variance.
To add one more fun fact...
Feb & March of this year were the first two back to back months of US consumption below 20 million barrels per day since May and June of 2003
yes, i'm a baseball fan :)
That is a supply graph (as you can read in the parenthesis). Of course, it is also a demand graph, since demand is supply.
The price going up is what tells how scarse oil has become, not supply (demand) graphs. Also, US net imports decrweased because production decreased (or demand decreased, if you want to make things look confusing) and other countries are overbiding the US.
Inventories may be falling because people think that it is a temporary price peak, and things will get into normalcy again. Or, maybe because people are burning monetary savings to survive, thus selling the oil to customers sooner.
at the eia product supplied is the same as consumption which is the same as demand in common parlance
marcosdumay is right--what's important is not really how much demand has fallen, but how much the price has had to go up to get that much demand reduction. That's a reflection of supply problems relative to demand.
Well, first and foremost, Mexico is on the fast track to oblivion regarding net oil exports.
Regarding Venezuela, the recent data are a continuation of a 10 year trend of declining oil exports. Part of the decline in Venezuelan exports to the US may be them choosing to send their oil elsewhere, but the decline in what they are sending us is pretty clear.
Also, why favor oil exporters 30 days away over exporters 5 days away, unless oil companies had no choice?
And the year to date numbers show a year over year decline of about 450,000 bpd in US consumption:
http://www.eia.doe.gov/pub/oil_gas/petroleum/data_publications/weekly_pe...
One key point to remember. The US is showing a long term production decline. If we want to keep our net oil imports flat, we have to reduce our consumption at the same rate that our domestic production declines.
But do we want to keep net oil imports flat?
Arent we are trying to break our oil addiction, especially our addiction to imports?
The point is that our net imports have been historically driven higher by a combination of falling domestic production and increasing consumption. In effect this is the ELM, but in reverse.
In Export Land, what the exporter can and will export (post peak) is a function of the difference between falling production and (generally) increasing consumption.
In the US, Import Land, what we have been importing is the difference between (generally) rising consumption and falling domestic production.
Look at both cases.
If Export Land wants to maintain flat net exports, they would have to reduce their consumption at the same volume that their production declined.
If Import Land wants to maintain flat imports, we have to cut our consumption at the same volume that our production declines. If we want to lower imports, we have to curtail consumption at an even faster rate.
WT: Re Iraq oil exports, what % is heading to the USA currently? IYO will Iraq oil exports be sent to Chindia in the future if USA demand drops significantly?
If we want to lower imports, we have to curtail consumption at an even faster rate.
And luckily we are! :)
Net imports down 5.9% in comparison with last year
For last four weeks, down 9.2%
http://www.eia.doe.gov/pub/oil_gas/petroleum/data_publications/weekly_pe...
maybe we should be patting ourselves on the back
(if we keep up the good work)
But we have been meeting demand by drawing down inventories, which cannot continue indefinitely. That was the final point I made in the post. Gulf Coast crude oil inventories have dropped 9% in two weeks, and we can't go to zero crude oil inventories. We are constrained by the Minimum Operating Level (MOL), about 270 mb or so for the total US (crude oil).
Would someone be good enough to clue me in on MOL? Perhaps a pointer to another post?
Minimum Operating Level...
OK, think of the water in your house.
Let's say you live in the city use 100 gallons a day. However, in order for that 100 gallons to come to you, it needs to go through the pipes from the water plant, under the streets, under your yard, and through the tubing in your house. That water plant has to fill up the pipes between your faucet and the plant before you get a drop of water. All that water in these pipes, whether it is 1,000 or 1,000,000 gallons, is needed for you to get water- even though you won't use it immediately. That water in the pipes is the Minimum Operating Level (MOL) for you to get water.
The oil supply chain is the same, like all other steady state supply chains for physical commodities (water in your house, milk at the store, shoes at Wal-Mart, Cars from GM, etc.) that require product to be present within the line in order to receive it in a timely manner.
Make sense...?
Thank you for the help.
I wonder if anyone can point me to further thoughts on what happens if we go below this? Are the figures referred to total amounts in inventory?
You can't go below MOL since the oil then doesn't flow to the place where it will be consumed.
For some strange accounting reason the oil in the pipes is counted as stock - the only trouble is we don't know for sure just how big (or small) MOL is since the supply chain has so many stotage buffers along the way from oil well to car fuel tank.
From what I am reading you can indeed go below MOL.
And what you say is correct, that the oil would not flow.
Since we are in a world with a rapid decline in available oil, then some idea of how much safety margin we have and how close we are to the pipeline grinding to a halt in different countries would be helpful.
Also, what happens to the oil in the stock - can it be moved by other means?
Here is the data I found on MOL:
http://www.inteldaily.com/?c=154&a=2101
The Peak Oil Crisis: The Minimum Operating Level
Annoyingly this only deals with gasolene, as there are other products involved.
As I see it, you reduce MOL by reducing the scale of the infrastructure.
Shut down a percentage of service stations to start with, building up to shutting down interstate pipelines etc. Fun huh?
Following Katrina, the Colonial Pipeline was shut down briefly. Reportedly this was due to power failures in the Gulf region. (Fuel prices spiked on the East Coast.) Could it instead have been an MOL problem? That is, supply disruptions in the Gulf caused the flow of product in the pipeline to drop below MOL. Flow had to be halted until sufficient product had built up to keep the pipeline functioning.
Does this make any sense?
From http://tonto.eia.doe.gov/oog/info/twip/twip_crude.html
Note that from last July (about 350mb) thru to December (about 285mb), US Crude Oil stocks fell 65 million barrels. If that falling trend is repeated this year (which I assume it will unless US imports increase drastically this year during that period, or oil consumption falls significantly), then the US is facing stock levels declining from about 310mb (current level) to 245mb by December 2008. Which is in 6 months. Which is easily below MOL from what I gather.
http://www.theoildrum.com/node/2975
Declining Net Oil Exports Versus “Near Record High” Crude Oil Inventories: What is going on?
(September, 2007)
Jeffrey J. Brown
And here is what we have seen for the week ending 5/23, versus one year ago (weekly, except for Refinery Utilization, which is four week running average):
Net Oil Exports: As Datamunger noted, an accelerating net export decline rate in 2007
Crude Oil Prices: $130, versus $65 one year ago
Refinery Utilization: 87%, versus 90% one year ago
Product Prices (Gasoline, Gulf Coast Wholesale): $3.22 per gallon, versus $2.31 one year ago
Total Product Inventories: 657 mb, versus 661 mb one year ago
MOL for finished products should be dropping as retailers drop out of the market.
This obviously doesn't have a direct impact on the crude side of the equation, but for every retail outlet that closes due to lack of supply or simply being unwilling to continue playing "catch the next shipment's price" that's some thousands of gallons of storage that goes fallow or is destroyed outright. That should have a significant effect on the bottom line MOL for the system as a whole.
I have personally seen retailers in the upper Midwest doing this. I would be surprised if it is not occurring elsewhere at a fair clip as well, especially in "end of the pipeline" locations and small independents.
I'll not repeat my previous post on US demand but the demand drop is entirely consistent with the tanking of the US housing industry and probably is not directly related to changes in oil prices.
http://europe.theoildrum.com/node/4007#comment-353037
Building houses is not surprisingly a big user of fossil fuels and since the newest houses are farther out VMT increases stop building houses and demand flattens.
It seems to me that's a graph of supply, not demand. If prices didn't go up, it might be demand.
Anyway, about the 414 kbd. I have a question. If stocks were down 15 Mbbl over the last two weeks, divide by 14 and you get a little over 1 Mbbl/day shortage. If demand was constant we're talking a lot more than 414 kbd decrease. Is the difference equal to the increased transit distance?
Second question. Assuming 400 kbd lower shipment from V&M, and a VLCC holds 2M bbl, then we need an addition 400x7 = 2.8Mbbl/week or roughly 1 VLCC shipment every 5 days. Assuming there are plenty of VLCCs available, but the round trip time increases from 12 days to 48 days (increase of 36 days) So for the static case we need 48/5 or about 10 new tankers in transit to/from the ME plus a few more quickly to make up for any current shortfall. Assuming we dispatched some of these when we first found out about the V&M shortfall, we'd have a gap of about 36 days during which we have to live on 2.8M bbl/week less.
Is this the general thinking?
Given we seem to have a shortage of more like 8M bbl/week for the last two weeks, and it doesn't seem to be due to fog, is it reasonable to assume our real shortage is a lot more than 400 kbd ?
Chris
having thought about it a little more, I think I can summarize
The decline in net exports is a world problem, not specifically local, since we have a world market and oil is fungible
US net imports are declining (6% approx) at a faster rate than the decline in world net exports (2 1/2% approx). This additional decline (3 1/2%) isn't forced on us since the markets are open for biz if we want to buy more
we don't
Not at current price
So the additional decline in net imports is a demand thing, we are cutting back
(used less last winter than in 1978)
So, how can the current decline in gulf coast imports be a big additional crisis?
These Fed officials think up to a 20% drop in consumption over the next 10 years will be the effect of current prices staying the same
http://dallasfed.org/research/eclett/2008/el0805.html
If so, refineries and other types of oil related facilities are going to close. Inventories will drop big. Net exports will plunge maybe 30% assuming domestic production holds up ok.
None of this would have to be attributed to an additional supply crisis. prices jsut have to stay the same.
You have to look at overall imports for the US esp gasoline imports to get a better picture of US demand.
I think at best right now the US is unwilling to import either gasoline or oil and resell gasoline at its current price. US gasoline prices have been depressed for some time. I think your on the right track but you really have to look at the entire picture.
In my opinion the big picture for the US is the fact we have seen a weak rise in gasoline prices but no increase in gasoline imports and falling oil imports. This says that gasoline would have to increase a lot more before the US can be competitive in a potentially more distant export market. Note that inventories have consistently been falling over the same period.
Also as imports from Mexico and Venezuela dry up our oil imports are causing us to compete more directly with countries that where finished product exporters to the US form the same oil exporters. This suggests that pressure on gasoline prices should increase. Once this happens we can see if the US can successfully get both the oil and the gasoline it needs. But right now in my opinion gasoline is still under priced given the changes that have taken place in with oil imports from VenMex and it will take time for the market to rebalance.
The problem is that we have two fast decliners right on our doorstep. The entire worldwide annual net export decline in 2007 was about one mbpd. Just the combined net export decline from V&M to the US was 414,000 bpd to 10/07 to 3/08. It's not like we didn't want the oil. Imports from the Persian Gulf went up by about the same amount. So, in effect we did have to bid the price up to get the oil coming our way. Crude oil prices went up at an annual rate of over 60%/year from 10/07 to 5/08.
In the past few weeks, we have met demand on the Gulf Coast by drawing down inventories. I do agree that we have to further reduce our consumption and/or bid the price of crude up. But I also think that having two fast decliners on our doorstep will be a continuing problem for the Gulf Coast.
Also, the decline in our demand has really been pretty modest--down 2.1% year to date over same period last year, which required more than a $40 move in prices in eight months.
The problem is that we have two fast decliners right on our doorstep.
but oil is fungible
in some important ways it doesn't matter where you get it
If those V&M imports were replaced by persian gulf imports as you say...well then that was hardly a hurricane was it? :)
you might want to try to incorporate the following into your model---
-- that US demand is showing signs of declining faster than declines in world net exports (this will have some restraining effect on world prices. lots if other developed nations behave similarly).
-- that US net imports are shrinking at a faster rate than world net exports, even considering declining stocks and without US oil markets spiking higher than other markets. in other words: there is a rapid decline in US imports with no signs of internal stress (shortages, price spikes) in excess of the current world situation.
anyhow, good discussion.
I'll check in next year when we have another years worth of data.
My bet: World net exports decline again but the decline rate does not accelerate.
But by taking more oil exports from the Middle East we are taking oil that formerly went to Europe they refined it and sent us our their excess gasoline. The diesel shortage is actually a symptom of this. Europe is not refining enough excess oil to produce gasoline and enough diesel because we are now importing this oil and refining it in the US.
Oil may be fungible but the direct loss of oil that went to the US is still a loss. The only way out of this is for both the US and Europe to beat Asia for oil imports to restore US gasoline imports. So for the US to not be effected this new demand for ME oil has to be transmitted such that it results in lower imports for nations that don't export gasoline to the US.
For this to happen gasoline prices in the US have to rise a lot to allow nations that export gasoline to the US to import oil and out compete China and then have enough excess gasoline for export and meet their diesel demand which means of course diesel prices have to increase even more :)
To some extent the US probably can export diesel back to Europe to help matters a bit but until the new equilibrium is reached if I'm right the US will not see gasoline imports like we used to they will remain low.
In any case the market is destabilized at the moment and a round of increases in finished product prices must happen to re stabilize it. This will continue to ratchet up until import demand from China slows and or US demand drops or both.
The hurricane analogy was not to what was happening in the past six months, but to what is happening. The big drop in Gulf Coast crude oil imports and the big drop crude inventories were both in the past few weeks. Viewed in isolation, this would be no big deal, just a statistical blip, but when you put in perspective, in light of the two fast decliners on our doorstep, it makes things look interesting this summer.
My bet is that given the alternative of bidding the price of crude up, to redirect declining exports to our shores, there will be enormous pressure on the Bush Administration to release oil from the SPR.
In regard to an accelerating net export decline rates, in our top five paper we warned that it would happen in 2007, and that is what we saw. We shall see what happens in 2008.
Also, the decline in our demand has really been pretty modest--down 2.1% year to date over same period last year, which required more than a $40 move in prices in eight months.
using the monthly data only (not paying attention to the weekly estimates which are crap), the drop is more like 4.5%
declines in demand though are never linear like that.
When it starts to drop, it can plunge......even after the price of oil falls.
----------------------
Calculating the year to date decline in demand...
Have to use the monthly bpd figures, not the monthly total barrel figures because 2008 had an extra day in Feb (leap year).
2007
Jan 20,559,000
Feb 21,271,000
March 20,529,000
Average: 20,786,000
2008
Jan 20,114,000
Feb 19,782,000
March 19,732,000
Average: 19,876,000
Decline: -4.38%
http://tonto.eia.doe.gov/dnav/pet/hist/mttupus2m.htm
To see that the weekly demand estimates are lousy, just compare the old ones (Feb & March '08 say) to the monthly totals that were eventually released. They were *way* off!!
and yet they are never revised
If you look at the table
http://en.wikipedia.org/wiki/Hyper-exponential_distribution
The move up from about 19,000 to 20,000+ perfectly concides with the housing bubble which really got going in 2003 despite high oil prices. The reversion back to 19,000-20,000 brings demand back inline with pre housing bubble demand levels. Given a small amount of population growth over the last 5 years.
I'm willing to bet demand will not decrease significantly from the current level at best down to 19,400-19,700.
If you want to crunch the numbers the demand increase and decline that your showing is perfectly correlated with the housing bubble not with oil prices in fact US demand increased all the way through the price spike in oil until housing collapsed.
Taking 2000-2002 as base demand pre-housing bubble lets see if US demand drops much below its current levels. I posit that it won't.
Time will tell.
Now I'm not saying that after this increasing prices won't result in a slow decline in US consumption but if you look at the historical data and our current population at best it can go down to 17,000-18,000 before it hits a really sticky level.
Good luck with the demand destruction predictions.
The year to date decline number is based on total days, which smooths out monthly fluctuations, and which shows a year to date decline of 2.1%, versus 2007.
re drawing down inventories
here's a chart of the action for the last 6 years from this monthly series (excludes the strategic petroleum reserve)
http://tonto.eia.doe.gov/dnav/pet/hist/mtestus1m.htm
for the period in question (from oct 07 to mar 08) it looks pretty average
That's it, i'm off
See everybody next year at this time
As noted up the thread, the big draw down in Gulf Coast inventories was in the past couple of weeks, following a big drop in crude oil imports to the Gulf Coast, which started about three weeks ago. The question is what happens from here.
Westexas, how do imports by Mexico of refined petroleum fit into this? Some of the oil that is exported is effectively being refined and brought back in, so that should be subtracted out from net exports at some stage. Or is that already done? Also it must affect their balance of payments, since they are paying more for that refined fuel than they earn from exporting the equivalent amount of raw oil. Are both of these factors taken into account in the estimation of the effective net-zero-export date?
Yes, beside the net oil imports then we need to add in the refined petroleum we are importing as well...is this what you are saying? I read that you are suggesting to subtract out the US exported refined petroleum. Of course, that needs to be done as well.
The EIA defines Net Oil Exports and Net Oil Imports as the (positive or negative) difference between Total Liquids Production less Total Liquids Consumption.
Assume Production Land, with production of two mbpd, with no refinery capacity, and with consumption of one mbpd.
Refinery Land has two mbpd of refining capacity, but no production, and with consumption of one mbpd.
Let's ignore refinery gains.
Production Land exports two mbpd of crude oil to Refinery Land. Refinery Land exports one mbpd of refined product back to Production Land, consuming the other one mbpd.
So, Production Land has two mbpd of gross oil exports, one mbpd of net oil exports.
And Refinery Land has two mbpd of gross oil imports, but one mbpd of net oil imports.
Ok...I should know better than to second guess the experts. At any rate, I found an interesting case study on the EIA website titled "Impacts of the Venezuelan Crude Oil Production Loss ". This is from back in 2002 when there was a strike. Many interesting charts and discussion about the effects on the refineries. Would like to see this recast under todays situation. Wait...you already are doing that here!
http://www.eia.doe.gov/pub/oil_gas/petroleum/feature_articles/2003/venez...
I'm not sure I'm an expert, but I do suffer from EO-OCD, Exported Oil Obsessive Compulsive Disorder, which is contagious.
Ok, thanks for the clarification.
I think the following link is instrumental to our understanding of how energy demand may change in the US:
http://www.eia.doe.gov/emeu/aer/txt/ptb0105.html
On a BTU / GDP dollar basis (2000 dollars), the energy intensity of the economy declined by 27% over the ten years from 1976 to 1986. This appears to be the fastest drop in the data series.
Since we are currently faced with similar (and probably more dire) circumstances, we have to assume that all actors in the economy will pursue similar measures, and energy intensity will decline further, and perhaps at a similar rate.
So let's say the rosy scenario is that we can knock energy intensity down by about 1/3 in the next 10 years. Ordinarily this wouldn't actually decrease demand, since economic growth of 3%/year would cause all of the energy efficiency increases to be used up.
If we assume a more painful scenario (though not a doomer scenario) where real GDP growth is zero over the next ten years, then the decrease in energy intensity of about 3% a year would be close to enough to compensate for decline rates (when new projects are included).
The doomer scenario of 8% per year decline cannot be countered through energy efficiency and technology advancement alone, it would seem.
The ELM predicts total export decline in this range. So either we will innovate energy efficiencies at a much greater rate than in the 70's and 80's, or we will experience a significant GDP shrinkage (an economic depression), or we will go to war to ensure supplies as a temporary solution. Perhaps all of the above.
The energy intensity of the U.S. economy has dropped at least in part because we've been riding on the backs of the Chinese. They're doing the manufacturing, which takes all the energy, but we get something like 90 cents of every dollar for the products they make. Our economy's share of those dollars goes to marketing people and financiers and corporate honchos.
With wages in China going up, and with the cost of transporting goods going up, and with profits getting squeezed as consumers opt for lower-priced brands, our GDP's share of the sales price of Chinese goods is shrinking at a good clip.
So, either we will start doing more of our own manufacturing, which means our energy use per unit of GDP will go up, or we will continue buying fewer and fewer goods from China, which hurts us at a rate of 90 cents for every 10 cents it hurts China--meaning our GDP per unit of energy use goes down.
Either way, I see the energy intensity of our economy getting worse, at least over the intermediate term, rather than better.
Since this energy intensity thing is generally measured in "dollars" and the price of energy has doubled in the last year or so, isn't it true that the "energy intensity" of our economy has increased greatly in the last 12-18 months?
I keep hearing things like "our energy intensity is half of what it was in the 1970s". Isn't this logic a little dated?
You have to measure the oil in barrels and the GDP in dollars and then it looks really pretty. You see, if the USA only used 1000 barrels of oil a year the economy would be super "energy efficient" even if the cost of those 1000 barrels exceeded the GDP of the country-if you are confused, read anything written by Alan Greenspan or Henry Blodget (or a thousand other well known mouthpieces).
Actually, if you take a look at the link I posted above, you'll see the percentage of GDP spent on energy for every since the early 70's.
This ratio has dropped over time, although it seems to be creeping up again lately, as a result of the factors dissected here at TOD.
But it's nowhere near as high as in the late 70's, at least not yet.
Those DOE's #'s suffer from at least two defects:
(A) The contribution of FIRE (finance, insurance, real estate) economy firms to our GDP has been way overstated in recent years. A proper analysis would back those losses out of GDP. So, the energy intensiveness is undercalculated.
(B) Since Carter, the CPI has been tweaked to make GDP growth look more favorable. Again, this undercalculates energy intensiveness.
Also, as a matter of interpretation, the reduction in energy intensiveness during the late 70's and early 80's might well have come from outsourcing manufacturing, which (as I understand it) picked up pace then.
Good luck cutting the largest industry left in the US building houses is pretty much already dead and this has resulted in basically flat to slightly declining demand. The next big one is commercial real estate but this does not have the same consumer side demand component. I.e if they don't build the new mall you have 10 others to go too. Or the 50'th redundant strip mall with a nail saloon. So tanking commercial real estate and consumer purchases should have a lot lower impact on oil usage vs housing.
Almost all our so called conservation was from offshoring of industries to Asia so the combined demand has actually grown dramatically its just arbitrary accounting by dividing the real economy which is China/India/US/Europe that gives you conservation in one place and growth in another.
In my opinion once the housing industry is dead we have very little left to cut without introducing major lifestyle changes and any further offshoring simply moves demand around.
In any case the largest fuel intensive industry in the US has collapsed and people are excited about the 400kbpd drop in demand. If we have to crash other parts of our economy to get similar savings I'd dare say we are in a bit of trouble.
IMO these discussions about impressive USA adaptability are worthy of Merrill Lynch-gasoline expenditures are up 32% YOY in the USA (from memory)-this is adapting? The accounting looks suspect-how can energy intensity have decreased when the amount of money spent on energy has gone up so much more than GDP? You have to compare apples to apples-dollars to dollars. When you look at GDP (US dollars) divided by US dollars spent on energy this more accurate ratio looks pretty sickly.
Greetings from the UK
I am just a humble small business owner who makes a range of Chinese ready meals for a living. I have no tech knowledge of global oil production.
I've become an avid daily reader of your site for over 18 months and being a small businessman I'm naturally trying to figure out where the price of diesel is heading (£1.31 per litre today!) because clearly it affects my future plans in a big way.
I read all this speculation which is based on complex data, but I have a layman's tale to tell.
My wife buys onions for our business because we use them in just about everything we make. We buy Spanish onions because they are 3 time the size of our English onions which make them a lot easier to peel and prepare. They also taste stronger which suits our food. For years we have paid about £8 - £10 per 20 Kg sack. When the Spanish go out of season we switch to Chilean and for a couple of months the price ticks up to £12 - £14 per 20Kg sack.
Last year there was a bad crop and a shortage of supply. My wife comes back to base and says "onions are expensive this week, I just paid £18 for Spanish" . The next week she comes back and says "my god I just had to pay £24 for the onions" . After 3 weeks or so we got to £34.
Now the key thing to grasp here is that we could not switch to buying potatoes because they were cheaper. We had to have onions, as did every other food producer, restaurant etc. The guy with the onion soup factory though, he was quickly out of business.
So ask me where I think the price of crude is heading. Well when an £8 bag of onions is selling for £34 because of a supply issue, I think you're all way of the mark!
Thanks for keeping me informed.
Hi wokman,
Thanks for sharing your firsthand experience.
I'm curious - do you know where each of those kinds of onions are grown?
Great post Professor. I wonder if Mr. Brown has the data base and time to apply his ELM model to Indonesia. Probably most here are already know that they have recently become a net importer. I've recently worked in the Deep Water Gulf of Mexico and have heard various tales of how quickly production is dropping in Cantrell Field, offshore Mexico. Certainly some of the numbers and conditions mentioned were exaggerated but if true the nitrogene injection program is seeing the N break through much sooner then modeled. I can't varify it and thus won't believe it, for the moment anyway, but it has been said that production has dropped at a 50% (annual) rate the last 2 or 3 months. But if this latest urban legend is close to being true it should show up clearly in the export numbers over the next few months.
http://graphoilogy.blogspot.com/2008/01/quantitative-assessment-of-futur...
This paper has a plot of the year over year changes in net oil exports for the ELM, the UK and Indonesia. We plotted from the first year of decline to the final year of net oil exports. Note that a constant exponential decline would plot as a flat line, parallel to the horizontal axis. What the plot shows are accelerating net export decline rates.
From everything that I have read, Cantarell is crashing, which means that Mexico is on the fast track to zero net oil exports.
WT
Yes and Russia looks like it will your next case in point, The Russians are interesting as they separate exports to their commonwealth and the "rest" which brings another geopolitical group into play. What I like about the ELM is that it neatly separates countries into two groups and quantifies the supply relationship between them, this has to be more appropriate to oil pricing than glibly grouping world production/consumption figures.
Recently one of the oil majors bought a huge tanker of refined fuel into NZ from the Ukraine, mainly because of our strict fuel quality measures and stated it was getting harder to source, no one seemed to even notice the absurdity of shipping the stuff halfway round the world or the dire warning inherent in the statement.
Keep up the good work
Neven
Europe has its own problems with proximal petroleum producers--Norway and Russia. Our middle case has both of them approaching zero net oil exports in about 16 years or so.
BTW, the ELM, Indonesia and the UK were all consuming about half of their production at final peak, and the time periods from final peak to zero net oil exports were 9, 8 and 7 years respectively.
Mexico, at what appears to have been their peak production rate in 2004, was consuming about 50% of their production. This is why I view 2014 as the outer limit for Mexico approaching zero net oil exports.
Hey Westexas!
I'm looking for a graph of Saudi Arabian Production with The number of drilling rigs superimposed over it, and another of the same except with Texas.. might you know where I could find one?
Probably the best you will be able to do is a graph of US or Lower drilling.
Even this analyst at morningstar mentions net export decline:
http://www.morningstar.com/cover/videocenter.html?bctid=1581481352&lineu...
Although I'm not sure about his comments about massive new refinery coming on-line that will process heavy sour crude that in oversupply.
a news story about tanker cancellations in Gulf coast....
http://uk.reuters.com/article/oilRpt/idUKN2939765720080529?sp=true
I mentioned that same story in a prior Drumbeat and the point is - no fog. No reason is given for the cancellations but fog was assumed by many investors. The reality is something else. We do not yet know what that something else is, but WT's ELM is a better candidate than fog!
I think the fog excuse came from one pundit who claimed the fog on the gulf coast was the worst in years.
if that is "smoke and mirrors" or fog and mirrors, then we shall surley see some movement from the coming weeks as we see continued declines in inventory?
I think in some peoples mind - after last Thursday there was some tankers circling patiently in the gulf full of millions of barrels of oil just waiting for fog to lift to offload their bounty.
The market certainly seems to be taking a rest, with prices floating around $127. Tommorrows report will be interesting indeed.
The actual decline in Gulf Coast crude oil imports last week was relatively small. The much bigger declines were in the prior weeks.
Sorry for the threadjack. Can anyone give me the link to monthly oil production? It seems to me that the general consensus is that oil production peaked in 2005, is this true? If so how can we be producing more liquid fuel now than ever before? It even looks like theres MORE liquid fuel being produced than there is oil being imported, how can this be?
Also please check out this link: http://peswiki.com/index.php/Directory:Bell_Bio-Energy,_Inc
Any one think this holds water?
You can find graphs of oil production in the monthly Oil Watch articles. The graphs for total liquid fuels include crude oil, liquefied natural gas (LNG) and ethanol. I am not convinced world crude oil production has peaked because it has been varying around 73 Mb/d to 74 Mb/d since 2005. I think we are at a plateau of an extended peak. We may be past the peak in world crude oil exports.
Concerning the Wiki article about Bell Bio-Energy's bacteria, I think the Chinese proverb on the page says it well: "He who burns his food goes hungry."
Datamunger up thread gave a link to the EIA data table, I believe. In any case, go to the EIA website and search around.
Note that one of the many areas of contention around "peak oil" that us outsiders have to learn to deal with is the question of what is meant by "oil".
A few questions:
1) What percentage decline rate in exported oil is too sharp for the Western industrialized economies to handle the decline in an orderly fashion? Where does chaos start to break out?
2) How much will oil producers hold back in order to sell at higher prices later? Not that historical ELM percentage declines have been based on experience of nations that were perhaps not fully ELM aware and who did not expect huge rising oil prices. The final generation of ELM nations will know soon enough that they are the last generation. Won't they react differently?
3) Will countries that change into dictatorships do better in handling the transition because of enforced investment in developing efficiencies and alternatives?
IMO the cutbacks will come after a major price drop, putting a floor under the oil price and thus encouraging the speculators/investors to stay long. If I was advising OPEC, I would tell them to act like the PPT or the Fed and show speculators/investors that you will protect a floor-that way you have all the investors/speculators working with you doing the heavy lifting.
Hi future,
1) TODer Andre' (aangel)has a nice summary of articles on economic impacts at
http://www.inspiringgreenleadership.com/blog/aangel/estimating-economic-...
2) A slightly different question is: What is the specific change that might occur as a result of being "ELM aware"?, i.e., what is the possible chain of reasoning that connects the "awareness" to the action ("react differently")?
Or, to put it another way, how does/would the "awareness" affect the dynamic of needing cash v. oil?
3) How do you define "dictatorship"?
(said w. a tenuous and slightly sad :)).
1) Nobody knows (AFAIK), it'll be a fun little surprise
2) They will hold back as much as they can without causing an oil war?
3) Some will, Totalitarian rule will mean they are much faster at decision making and have more power to implement policy, however, if they implement the wrong policies they won't do to well. On average they will probably be better off than the United States as far as working with what they have. Congress is full of clueless people which is a trend I don't see dissipating soon. Obama and McCain have both admitted that they don't understand economics very well.
Actually, that should be a good thing, right?
The last thing we need is for a President to be responding to, or generating, or catering to, market signals.
TOD Editor Stuart Staniford did such an analysis in years past. I don't recall the exact details or have the specific URL handy but I believe Stuart estimated 8% decline to be the breaking point beyond which society had no chance to survive. That doesn't mean society will make it at lower rates, just that we have a chance to make it.
Stuart also assessed the economic impacts of oil shocks that cause price increases throughout the economy in Inflationary Collapses, or The NPV of Grandchildren.
If I can find the other article by Stuart that attempted to assess the decline rate problem I will post the link to that as well. Those articles are by no means definitive but since I've seen few other attempts to tackle that problem, I still reference Stuart's work.
Thanks Grey,
Yes, Stuart's work reflects a direct answer.
Here's where he asks the question. http://www.theoildrum.com/story/2005/8/24/161535/296
If you find the 8% conclusion, could you post it?
"What percentage decline rate in exported oil is too sharp for the Western industrialized economies to handle the decline in an orderly fashion? "
Well, I saw a recent study which estimated that 40% of US workers could telecommute, though only 4% actually do so. The remaining 60% could carpool, and cut down their consumption by at least 50%, so the US could easily reduce commuting oil consumption by 50%, under emergency conditions.
Vacation fuel consumption would be easy to cut: just vacation in one's own state, instead of driving across country - the only loss would be a slight reduction in vacation novelty. Deliveries and shopping fuel consumption could be greatly reduced by online shopping and trip planning & sharing.
I think the US could cut fuel consumption by 25% in 6 months with only relatively small costs in convenience. I suspect it could reduce 50% in a year, and still manage to provide all essential economic functions (I'm not including tourism and entertainment as an essential).
Carsharing (as in zipcar.com) and carpooling would allow the sharing of scarce hybrids and PHEV/EV's (the average US vehicle is only 1% utilized, European utilization rates are probably lower).
"Will countries that change into dictatorships do better "
WWII style emergency management isn't quite the same as dictatorship. People will do extraordinary things, if only they believe they're necessary.
Contrary to MSM mythology, there are no signs of an orderly transition at all as you are describing. Someone should explain exactly how a 32% increase in gasoline spending is an orderly transition-at the current pace, the economy would be trashed completely, so any transition is yet to even start.
Actually, that's what I always want to ask after one of Nick's posts..."great..when does it start?"
Hi Nick,
re: "The remaining 60% could carpool, and cut down their consumption by at least 50%, so the US could easily reduce commuting oil consumption by 50%, under emergency conditions."
Do you see any *way* for these "emergency conditions" to be put in place prior to an emergency, in order to conserve?
What happens when the price or availability requires a reduction of greater than 50%?
re: "I suspect it could reduce 50% in a year, and still manage to provide all essential economic functions (I'm not including tourism and entertainment as an essential)."
What happens to the people who (formerly) worked in these sectors?
Do you have any ideas about how they can continue to meet their basic needs having lost their jobs?
This article disregards the fact that the Nigerian production was extremely affected some weeks ago by attacks and by a very effective strike.
At the same time, there was a strike action in Scotland, that reduced North Sea output and probably required increased imports to Europe.
I would say the reduced GOM imports for the last 2 weeks were to be expected, and are mainly due to the Nigeria effects.
This does not mean that VenMex are not reducing their exports.
Of course that is happening, and will continue.
But the numbers of the last few weeks are not representative of that decrease.
It would be more accurate to say that we don't know if they are representative or not. We do know that the V&M accounted for more than 20% of total US imports in 10/07, which was probably more than 40% of imports into the Gulf Coast. And we know that Mexico is on a fast track to zero, with Venezuela showing a net export decline that would, at the current rate, result in a 50% decline in 10 years.
Personally, the hypothesis that local is constrained, leading to much greater sensitivity to tanker availability, coincident with Iran tying up something like 16 VLCCs now, strikes me as reasonable.
Just conjecture, and I doubt Iran were looking for a way to piss off the US - but if the above is correct, they may have found one.
Just an intuition :
I'm thinking about a direct correlation between this GOM import decline and the rapid climb in oil prices these past few months.
When oil has been ordered on a long-term contract, and can't be delivered because of force majeure, whether it be strikes in Nigeria, production declines in Mexico, or whatever, then the unsupplied buyer is thrown onto the spot market, and needs to find cargos in a hurry. Even if the shortage only concerns one region, e.g. GOM, this will tend to bid world prices up.
Correct so supply problems tend to result in sharp increases in price while base export land is a relentless constant force. Of course its almost impossible to figure out the cause of the supply problems completely.
But the direct result of supply problems is buying more oil on the spot market forcing prices up.
Export land acts to destabilize longer term contracts as refineries have to look for different suppliers this also can lead to supply disruptions and new contracts have to be created. One of my contentions is that the overall oil market gets even more opaque then it already is as we have had massive amounts of uncertainty injected into the system.
For example given all the information I've been able to gather I cannot even begin to predict what gasoline imports into the US will be this summer. The only thing I'm pretty sure of is they probably won't be higher then in the past. But with all the changes that are happening it seems that the answer is we simply don't know. And I don't think thats a result of lack of information I think they are really not known by anyone.
The full impact of falling VenMex production is a lot larger than simply lower imports into the Gulf coast its rippling out through a heavily strained oil industry.
WestTexas and memmel:
I wonder if you have applied your Export Land Model to Canadian exports to USA? I believe that Canada is a principal supplier of energy to USA, but also an importer of oil on the East Coast. I believe also that Canada has a "developed" economy and that energy costs are not subsidised by the national government.
However, the Deputy Leader of the Opposition has suggested lately that it would make more sense to extend the pipelines easterly to permit Alberta oil to flow to Ontario and Atlantic Canada. He also suggested some alternatives to North-South flows of electricity and gas.
I wonder if Canadian exports to USA will also fall?
Canada actually showed a net oil export decline last year, about -1.3%/year, and I wouldn't be surprised to see more and more unhappiness in Eastern Canada.
This is a very interesting discussion. Yes in Eastern Canada the price of gasoline is higher -higher fuel taxes and now carbon taxes are being introduced.
Another aspect to consider with the advent of peak oil –Europe with their high fuel taxes is in effect subsidizing the consumption habits of all other countries. Their high fuel taxes decreases their overall demand thus decreasing at the margin the price of crude oil. The real beneficiaries of the high European fuel taxes are all consumers who pay market prices for their oil products and importing Governments who subsidize local consumption.
To some extent this is true but the tax money is recycled internally and once the price gets too high they can start cutting taxes.
In my opinion its a tortoise vs the hare game. Europe has chosen the tortoise route which should allow the EU economy to degrade gracefully relative to the US. I'm not saying it won't have a hard time just they do have a pressure relief valve by cutting fuel taxes and benefits. Eventually of course welfare will be a thing of the past no matter what happens. You don't get third world demographics with welfare.
Now if Europeans don't start dramatically slashing services and then taxes soon then I think they blow up just as badly as the US if not worse.
Canada should really be treated as two different countries energywise western and eastern Canada.
As far as I know there are no pipelines going west to east in Cananda and eastern Cananda has pretty much the same import setup as the eastern US. I don't think east has ever been a net exporter.
This split also highlight the potentially large rift between the western provinces and the east.
Farther out in the future I could easily see Cascadia form consisting of the North western US and western Canadian provinces and Alaska. Geographically its a natural country.
http://en.wikipedia.org/wiki/Cascadia_%28independence_movement%29
Agree, there is a divide between Eastern/central Canada and the Prairies/West coast regions.
My main point was If European fuel prices were not so high, the rest of the world would end up paying significantly higher prices, especially since there is no longer any excess productive capacity to speak of.
I can see Europeans increasing their purchases of gasoline poered car in the future which will impact North America's gasoline prices.
As to whether Europe will decrease their fuel taxes in the future as the price of crude steadily increases - IMO governments will fight this move very strongly unless they have a replacement tax handy ortherwise this means they must start dismantling the welfare state.
Europe has to dismantle the welfare state. It does not have a choice. The only saving grace is its so full of what we call pork that you can decrease it a lot before real poverty becomes a issue.
The US has to do the same thing but its safety net if you will is not as deep.
Eventually of course Europeans will realize this. The best approach is to start early and triage ensuring all ablebodied people who can work work. And example I used for England was to assign multiple single mothers to one council flat. This would allow one to watch the younger children and the rest to work and cut costs considerably across the board. In exchange for some crowding that provides a force to get off welfare you cut costs dramatically and people don't starve.
I suspect however that people will be stubborn and cling to a welfare lifestyle thats on par with the working force until the programs are simply dismantled and we return to conditions similar to Brazil with zero welfare support and real malnutrition.
The problem is that I fear Europe will quickly polarize on the welfare and immigration issues and this will lead to a resurgence of radical nationalism that will prevent tough but fair and enlightened measures from being adopted early.
What people don't realize is that once the welfare state is dismantled real democracy and middle class wages are lost. A reasonable welfare state places a lower bound on wages once its gone the middle class will realize to late that welfare was also a safety net for itself in the sense it removed the excess low skilled population from the work force. It will find pretty quick that a lot of the jobs that used to pay well can be preformed for a fraction of the cost by someone highly motivated by hunger.