Forecasting coal production until 2100
Forecasting coal production until 2100
S. H. Mohr
G. M. Evans
University of Newcastle, Faculty of Engineering and Built Environment, Chemical Engineering, University Drive, Callaghan, NSW 2308, Australia
Abstract
A model capable of projecting mineral resources production has been developed. The model includes supply and demand interactions, and has been applied to all coal producing countries. A model of worldwide coal production has been developed for 3 scenarios. The ultimately recoverable resources (URR) estimates used in the scenarios ranged from 700 Gt to 1243 Gt. The model indicates that worldwide coal production will peak between 2010 and 2048 on a mass basis and between 2011 and 2047 on an energy basis. The Best Guess scenario, assumed a URR of 1144 Gt and peaks in 2034 on a mass basis, and in 2026 on an energy basis.
1 Introduction
Coal is widely used in the generation of electricity and in the production of steel, and is considered to be an abundant resource. In 2006 world production of all coal types was 6.2 Gt/y and the current reserves to production ratio (R/P) is 133 years [1]. There have been a few estimates of future coal production and all [2,3,4] have used Hubbert's bell curve technique. Hubbert [2] in 1976 estimated future coal production by applying a bell shaped curve to global production, and predicted it would peak at between 10-24 Gt/y in 2100-2200 depending on the URR. Laherrere [3] in 2004 used a similar approach to obtain a peak production of
~ 7.2 Gt/y in 2050. The EWG [4] in 2007 used a modified approach, in that future production was assumed to be a bell shaped production profile was applied to all countries and types, rather than on a global basis and only applied the profile to recent production statistics to obtain a peak production of
~ 7.4 Gt/y in 2025. The notion that coal is abundant less clear, whilst the R/P ratio and early literature[2] indicates coal is abundant[1], recent studies[3,4] suggest otherwise.
The reduction in the peak year estimates from Hubbert [2] (2100-2200) to the most recent analysis from the EWG [4] (2025) highlight important differences in the modelling analysis. Firstly, the discrepancy in the predictions between Hubbert [2] and Laherrere [3] (2050) is due to a lower URR value assumed by Laherrere [3]; both modelled production as a bell curve and applied it to global coal production. For Laherrere [3] and the EWG [4] essentially the same URR (Laherrere[3] assumes a URR of 600 Gtoe, and the EWG[4] assume cumulative production plus reserves, obtained from WEC 2007 [5] with the exception of USA. On a tonnes basis both equate to a URR of ∼1100 - 1200 Gt) was assumed and a bell curve profile of production estimated, but a difference of 25 years for the peak year was found. The fundamental difference was that Laherrere [3] modelled production globally, while the EWG [4] applied it to each country and type and only used recent production statistics as a basis for analysis. Theoretically, the sum of countries productions should equal the global value resulting in no significant difference in the peak year. The reason for the difference is not entirely clear.
The differences in peak coal production year estimates raises a number of questions about the overall modelling approach to coal production; especially given that the most recent prediction[4] forecasts that coal production will decline beyond 2025. The aim of this study therefore, was to critically examine URR estimates and to develop a coal production model based on a country-by-country analysis, which is not reliant on a bell curve production profile. The resultant peak year prediction could then be compared to the previous studies.
A review of literature will be presented to determine the coal Ultimately Recoverable Resources (URR) estimates. Peat and oil shale will not be considered as coal; the data will be split as best as possible into Anthracite, Bituminous, Sub-bituminous and Lignite for each country which had or has coal. A description of the model developed to predict coal production will be provided. The results of the model along with a discussion will be presented, followed by a conclusion.
2 Literature Ultimately Recoverable Resources Estimates
There are very few URR estimates for coal, Hubbert [2] assumed in 1976 that the coal URR was between 2,000 Gt and 7,600 Gt. Laherrere [3] in 2004 and EWG [4] both assumed a coal URR of
~ 1100-1200 Gt. In the case of the EWG [4], the URR was determined by assuming that WEC 2007 [5] reserve values combined with cumulative production represented the best estimate of the URR. Rutledge [6] estimated the worldwide coal URR to be approximately 660 Gt, using only coal production statistics and the technique of Hubbert Linearisation.
The EWG [4] consider their URR value as an overestimate of the actual URR, whereas others believe it would be an underestimate [7]. The classical view is that the URR estimate from the EWG [] would be too low as Thielemann et al 2007 [7] explains "Every year, coal resources move into reserves as our knowledge of coal deposits improve and new pits or pit sections are developed". So by the classical view we would expect the URR from EWG [4] and Laherrere [3] to be an underestimate. However the EWG [4] and Kavalov [8] both highlight that reserve and resource estimates have been declining. Resources have decreased nearly 50% over the last 25 years [4] and reserves have decreased by 137 Gt during the last 6 years to now be 847 Gt [8]. However the classical theory indicates that reserves and resources should have increased [7]. Ultimately since coal resources and reserves have not been following the classical view we can only assume that the EWG [4] URR estimate is an overestimate.
Three scenarios are analysed in the article. In the first scenario we estimated worldwide coal URR based on Hubbert's Linearisation Technique (denote this scenario HL) and applied the method to all countries with coal production. (Coal production statistics used in this article were estimated from a variety of sources [1,5,6,9–20].) We obtained a URR of 700 Gt from the Hubbert Linearisation Technique, which is very similar to Rutledge's estimate of 660 Gt, using the same technique [6]. The second scenario calculated the URR via the method of adding reserves to cumulative production and this scenario is denoted R+C. We estimated a URR of 1243 Gt by the R+C method, which is similar to the EWG[4] and Laherrere [3] URR value. The last scenario is our Best Guess estimate of the URR. The Best Guess scenario, denoted BG, assumes a URR of 1144 Gt. Table indicates the URR for all countries and types, and details where the URR values are determined.
3 Model Description
The model has been briefly described previously [21]. The modelling philosophy was to try and replicate real world exploitation of a mineral resource. The model includes supply and demand interactions so that production is influenced by the demand. The model has production occurring from individual mines, and production can be increased by bringing more mines online or upgrading existing mines. Outside influences such as wars and depressions can also be factored into the model. The model has several key steps:
- The markets to which the model interacts with is chosen. In the three scenarios for the coal model, the markets chosen are regional/continental and are: Africa, Asia, FSU, Europe, North America, Oceania and South America.
- The model works on individual countries and types. For each country and type, the maximum production of all mines, MjP is estimated along with the mine-life of all mines MjL. All mines are assumed to take 4 years to start up and shut down, along with the ability to have a forced shutdown early and restart later on. There is also the ability for mines to upgrade, which involves a mine increasing production over 4 years to twice the maximum production for the rest of its working life. MjL and MjP combined with the individual URR, determines the total number of mines MjT for the country and type. Figure 1 shows an illustrative example of an individual mine's production.
- An iterative procedure is applied, which has supply and demand interactions applied on a continent level. This determines when mines come online, if they have a forced shutdown, and if/when they upgrade. Production for the country is readily determined by adding the production from the individual mines.
The iterative procedure is explained in some detail here. The model examined each market (Asia, Europe etc) separately, and for each year the total number of the individual mines' production is added to obtain a production total for each country and type. For example, assume that we are at year t and in a particular continent and we know the following terms: the intrinsic demand in year t, M
D[t], and the total supply for a continent at year t, M
S[t]. Also for each country and type in the continent we know the amount of coal produced in year t, P
j[t], and the number of mines online, M
j[t], and the activities of the mines (commenced, shut down, upgraded). We now need to determine the supply and demand for the year t+1.
3.1 Demand
The demand M
D[t+1] for the continent is estimated by equation 1 [21].
| |
|
| MD[t]ekD[t], where, MD[0]=MD0 |
| | (1) |
|
Where M
D0 is the initial demand, and k
D[t] is the demand rate variable, which is described in equation 2 [21]
| |
|
| kD0-k1 |
æ
è
|
MS[t]-MD[t]
MS[t]
|
ö
ø
|
. |
| | (2) |
|
Where k
D0 is the equilibrium growth rate value, and k
1 is a proportionate constant linking the difference in supply and demand to the demand growth rate. k
D0 ranged from 0.035 to 0.1 in value and all except for Asia are constant. In Asia k
D0 changed from 0.05 to 0.10 in order to account for the rapid development in China and India since the Asian Crisis in 1999.
3.2 Supply
The supply of coal in the year t+1, M
S[t+1], is determined by summing the productions in the individual countries and coal types in the year t+1, P
j[t+1] as shown in equation 3 [21].
The production of coal in a given country and type, P
j[t+1], is determined by knowing whether or not there is a disruption in year t. A disruption is added into the model to take account of effects such as the Great Depression and world wars etc. If a disruption has been inputed into the model, then some of the mines are brought offline, and hence production is reduced. If no disruption is present, then the number of new mines brought online or restarted needs to be determined.
The number of mines online M
j[t+1] is a function of production, P
j[t], and of the supply and demand as shown in equation 4 [21].
| |
|
|
é MjT -(MjT-Mj[t])e-kjS[t][(Pj[t])/(URRj)]
ù |
| | (4) |
|
Where k
jS[t] is the supply rate variable for the specific country and type, note that initially one mine is online. The supply rate variable is similar to the demand rate variable and is shown in equation 5 [21]
| |
|
| kjS0+k2 |
æ
è
|
MS[t]-MD[t]
MS[t]
|
ö
ø
|
, |
| | (5) |
|
Where k
jS0 is the equilibrium supply rate for the specific country and type and k
2 is a proportionate constant applied to all countries and regions. The equilibrium supply rate is a constant in almost all cases. However, in a few key places, events have caused this value to have a step change: In North America, at the end of the 1960s there was a strong departure from high sulfur USA bituminous coals to lower sulfur coals and this had the effect of stunting USA bituminous coal production, whilst also heavily increasing production from other coal sources. The second place where k
S0 is not a constant is in China, where the rate of growth since 2000 has been considerably higher than was previously the case.
The last component of the iterative procedure is determining how many mines are upgraded each year. The number of mines upgraded between year t and t+1, M
jU[t+1], is determined by equation , and is directly related to the number of mines online and the difference between supply and demand.
| |
|
|
é
ê
|
k3 |
æ
è
|
MS[t]-MD[t]
MS[t]
|
-kU |
ö
ø
|
Mj[t] |
ù
ú
|
|
| | (6) |
|
Where k
U is a minimum gap between supply and demand necessary before mines are upgraded, and k
3 is a proportionality constant. Let q
ji[t+1] denote the production i-th mine in the j-th country and type in the year t+1. Since we know when the i-th mine started and its history, we can determine the total supply to the market as:
| |
|
| |
| |
|
|
å
j
|
|
Mj[t+1]
å
i=1
|
qji[t+1] |
| |
|
The constants k
1,k
2,k
3,k
U are on a continent basis.
Historically, Europe is the only continent where coal production has already peaked and is declining; Europe peaked in 1988 and production is declining at an average rate of 3% per year. The constants were determined by finding the best fit to European production and these values were then used for the other continents and scenarios, all of which have not peaked. The constant k
S0 is determined by fitting to the individual production curve for a given country and type. The constant k
D0 is determined, by observing the historical growth rate for each continent.
4 Results and Discussion
The model's predictions of coal production are shown in three formats. Figure 2 shows production from the major coal producing countries on a tonnage basis, Figure 3 indicates the production of the different coal types, in tonnes, and Figure 4 has the coal production by coal type in energy units (EJ). The model indicates world coal production in tonnes will peak between 2010 - 2048, and in an energy basis, will peak between 2011 and 2047. The large range in peak year estimates cannot be narrowed until reliable URR estimates are available.
The URR estimates used in the scenario hopefully reflect the actual URR. The HL scenario URR, should guarantee an underestimate in the URR, as there are places where coal is known to exist but production is currently insignificant or non-existent - e.g. Alaska. The R+C scenario URR is assumed to be an overestimate due to the declining official reserves and resources [4,8], which are speculated to continue to decline[4]. We therefore cautiously believe that the worldwide coal URR is between 700 and 1243 Gt, and that the prediction from the model implies that coal production will peak sometime between 2010 and 2048, is approximately correct. Our BG scenario URR of 1144 Gt is a slightly educated guess, and is typically obtained by choosing the HL or R+C scenario URR values for each different country and type. The BG scenario indicates that coal production will peak in 2034 on a tonnage basis and in 2026 on an energy basis. Based on the coal URR estimates, the notion that coal is abundant is unlikely, however further work is needed to determine accurate URR estimates.
4.1 Model Criticism
The model has numerous limitations which will be outlined. The model required more than 400 constants to be inputted, (M
jL, M
jP and k
jS0 for all 132 countries and type, as well as k
U, k
1, k
2, k
3). The number of constants makes application of the model difficult and time consuming. The assumption that all the maximum mine productions for a given country and type is constant over time is too simplistic, as history indicates maximum mine production rates increased over time in America [23]. The iterative approach of the model causes the model to take several hours to run. It is preferred that external disruptions such as the Great Depression be implemented in demand rather than supply. Laherrere [3] and the EWG [4] using Hubbert's Theory and a similar URR, produce moderately similar peak year estimates, hence there are questions as to why develop such a complicated model.
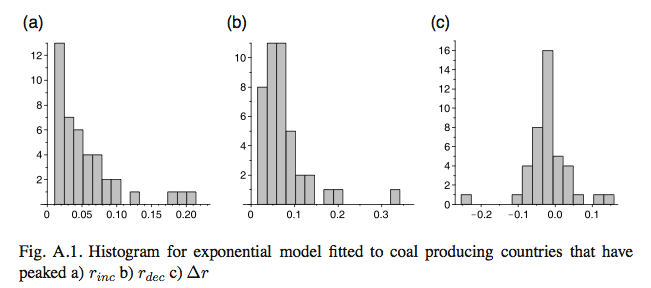
There were numerous reasons for why the model was created. First, Hubbert's theory assumes production is a symmetric bell curve, yet analysis similar to that done by Brandt [22] for oil production, indicates that the rate difference
Dr = r
inc - r
dec is negative with a mean of -0.019 and a median of -0.018, with a standard deviation of 0.059 (see appendix for more details). Also with Hubbert's method there is no underlying theory explaining why production ought to follow a symmetric bell curve. Our model has been developed to attempt to replicate how coal is extracted with production from mines and with supply and demand interactions, as well as external disruptions (wars, depressions etc). The number of constants required is time-consuming, and work is continuing to develop a normalised approach to readily apply the model to many countries, which could minimise the number of variables used. Further work is required to produce better models that are more effective and replicate reality more accurately.
5 Conclusion
A model has been developed which uses supply and demand considerations and this has been used to model worldwide coal production. The model has been applied to coal, but can be used for any resource where production is derived from mining. World coal URR value has been estimated at between 700 and 1243 Gt of coal. The model projects that worldwide coal production will peak between 2010 and 2048 on a tonnage basis, and between 2011 and 2047 on an energy basis. The notion that coal is widely abundant therefore appears to be unjustified. Further work is needed to better determine the URR range of coal.
6 Acknowledgments
We wish to thank the EIA, and Minerals UK staff as well as Jean Laherrere and Dave Rutledge for their help in acquiring coal production statistics. Thanks too, to Michelle Buckland for helping to edit this article.
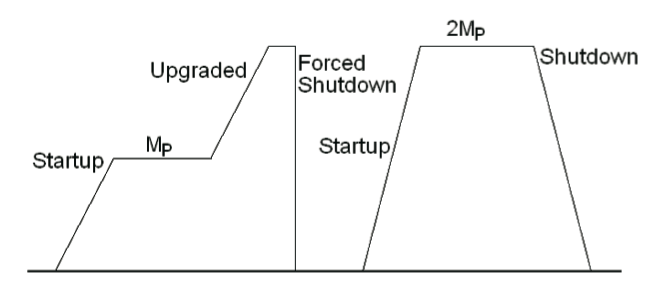 Figure 1: An example of a mines production over time

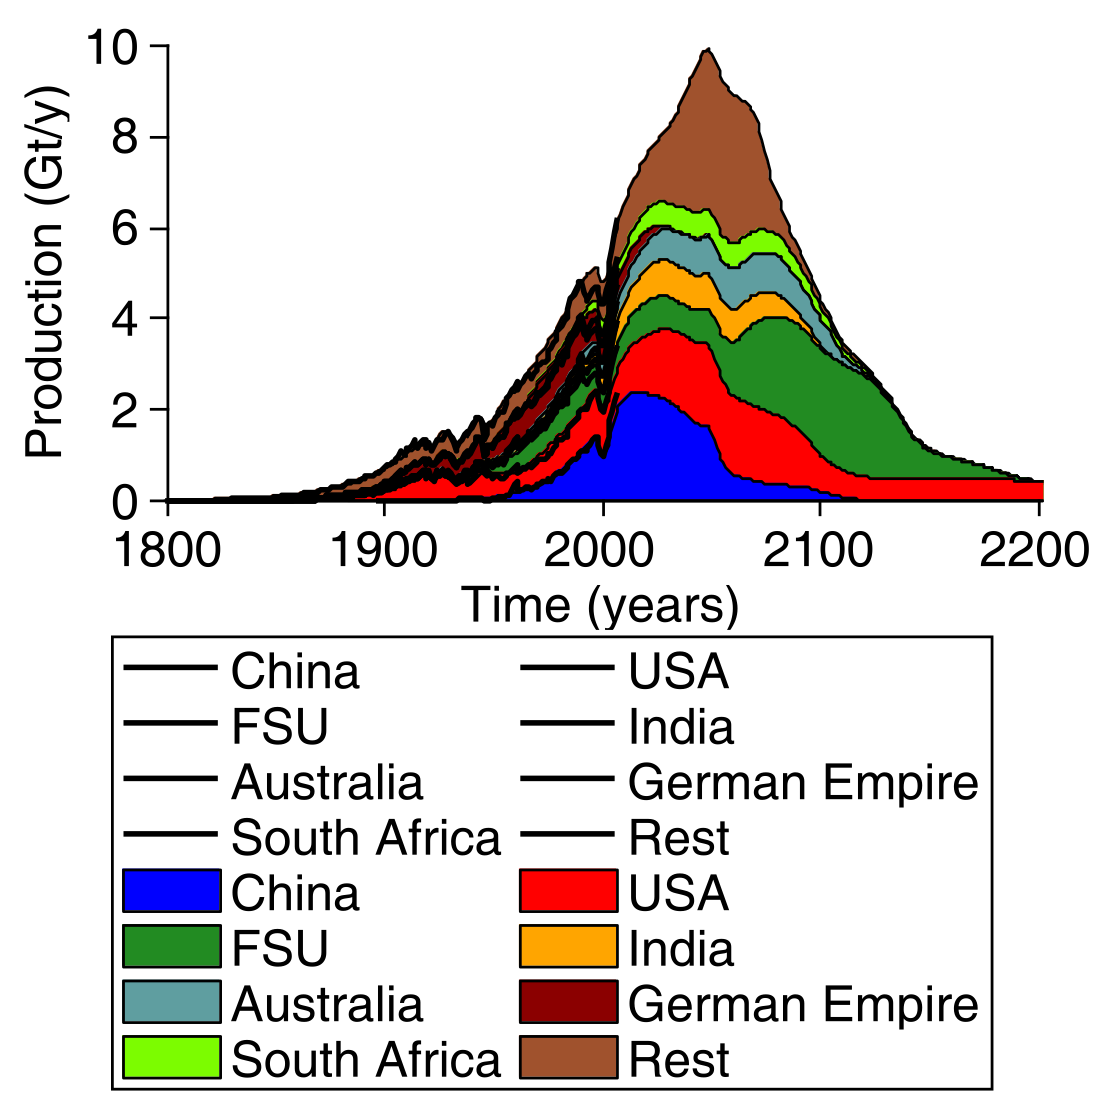
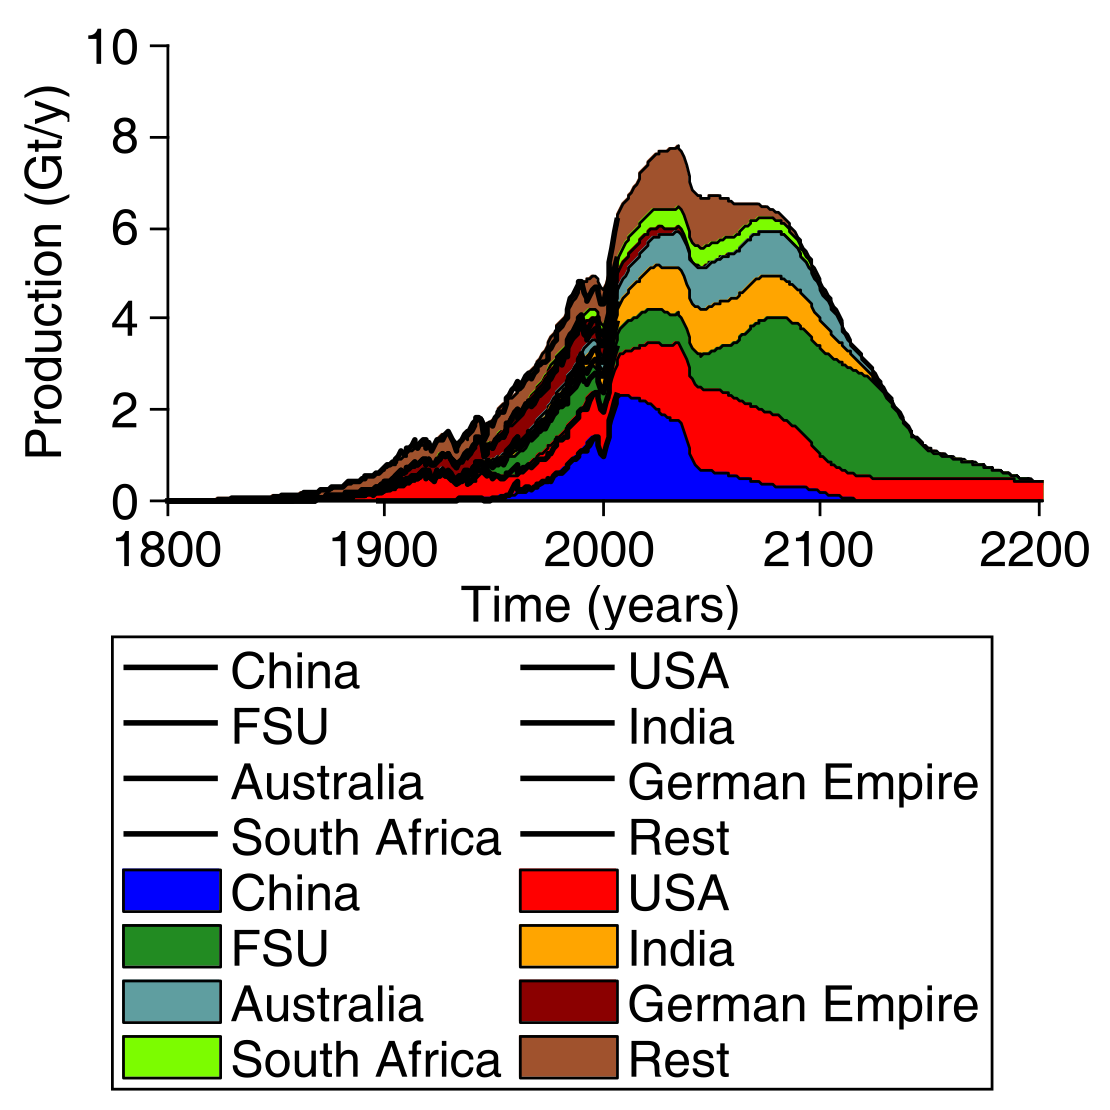 Figure 2: Coal production prediction for major producers in Gt/y for a) The HL scenario b) The R+C scenario c) The BG scenario
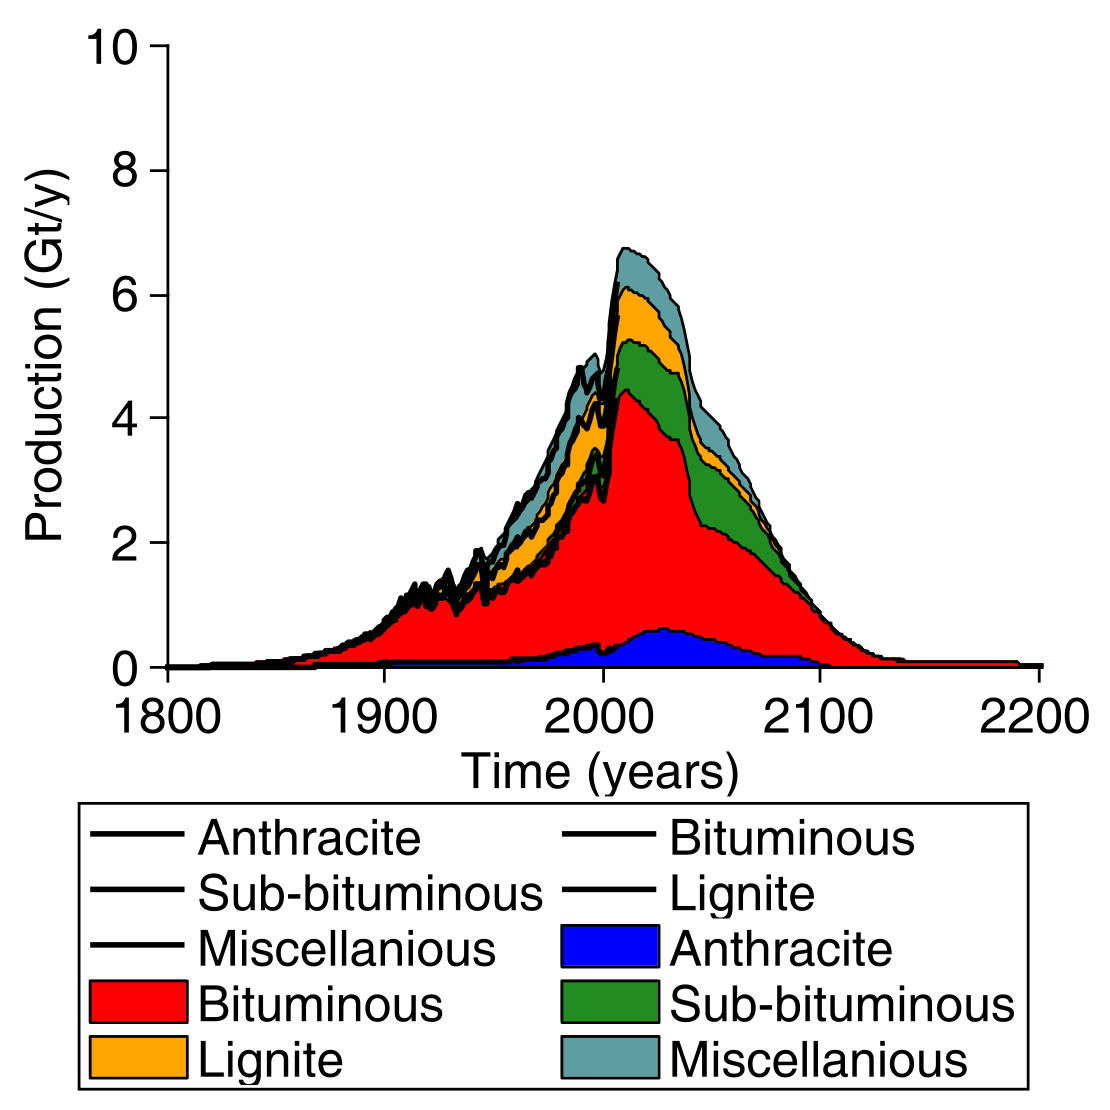

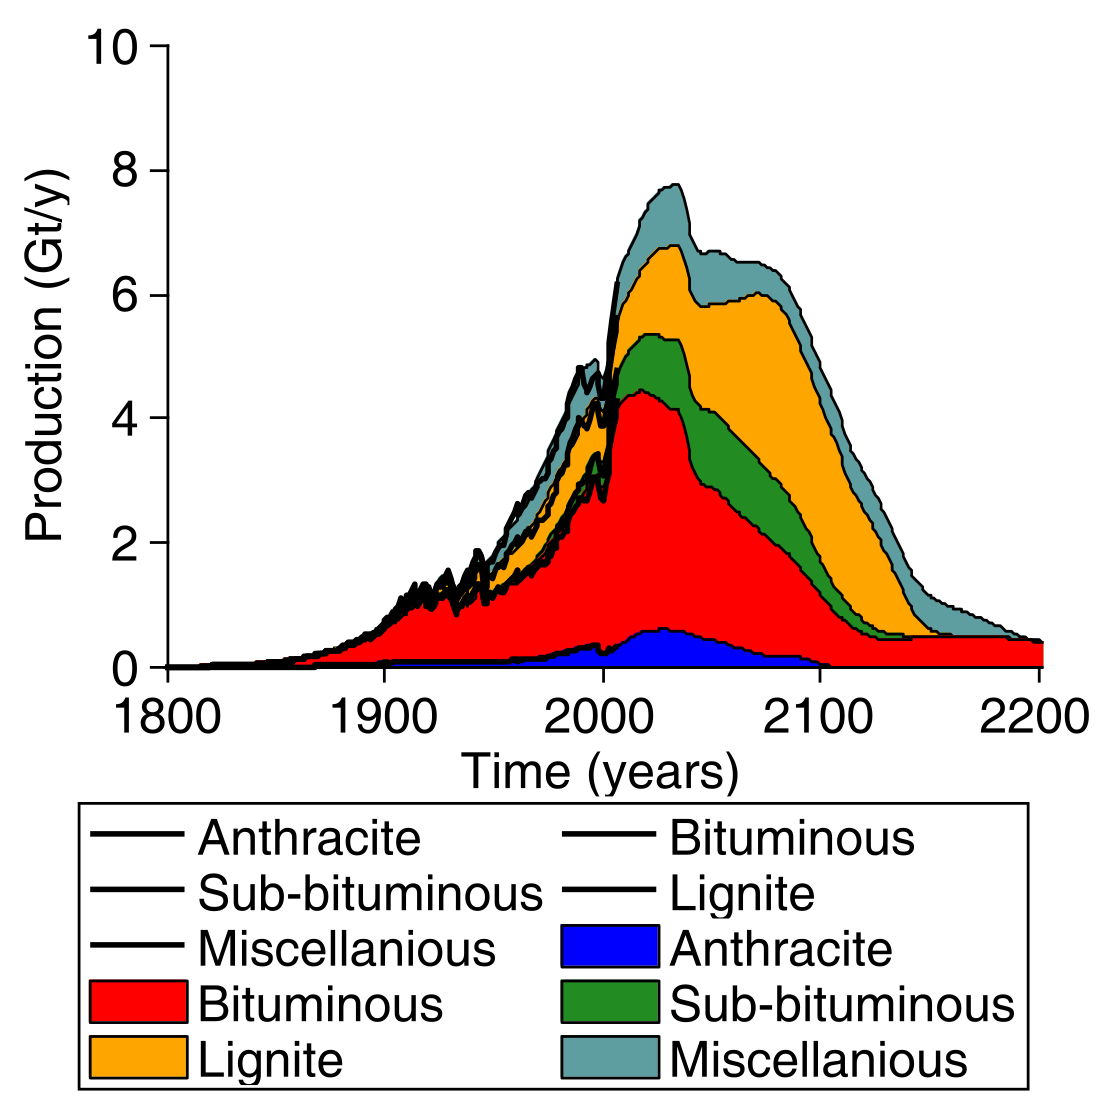 Figure 3: Coal production prediction for different coal types in Gt/y for a) The HL scenario b) The R+C scenario c) The BG scenario
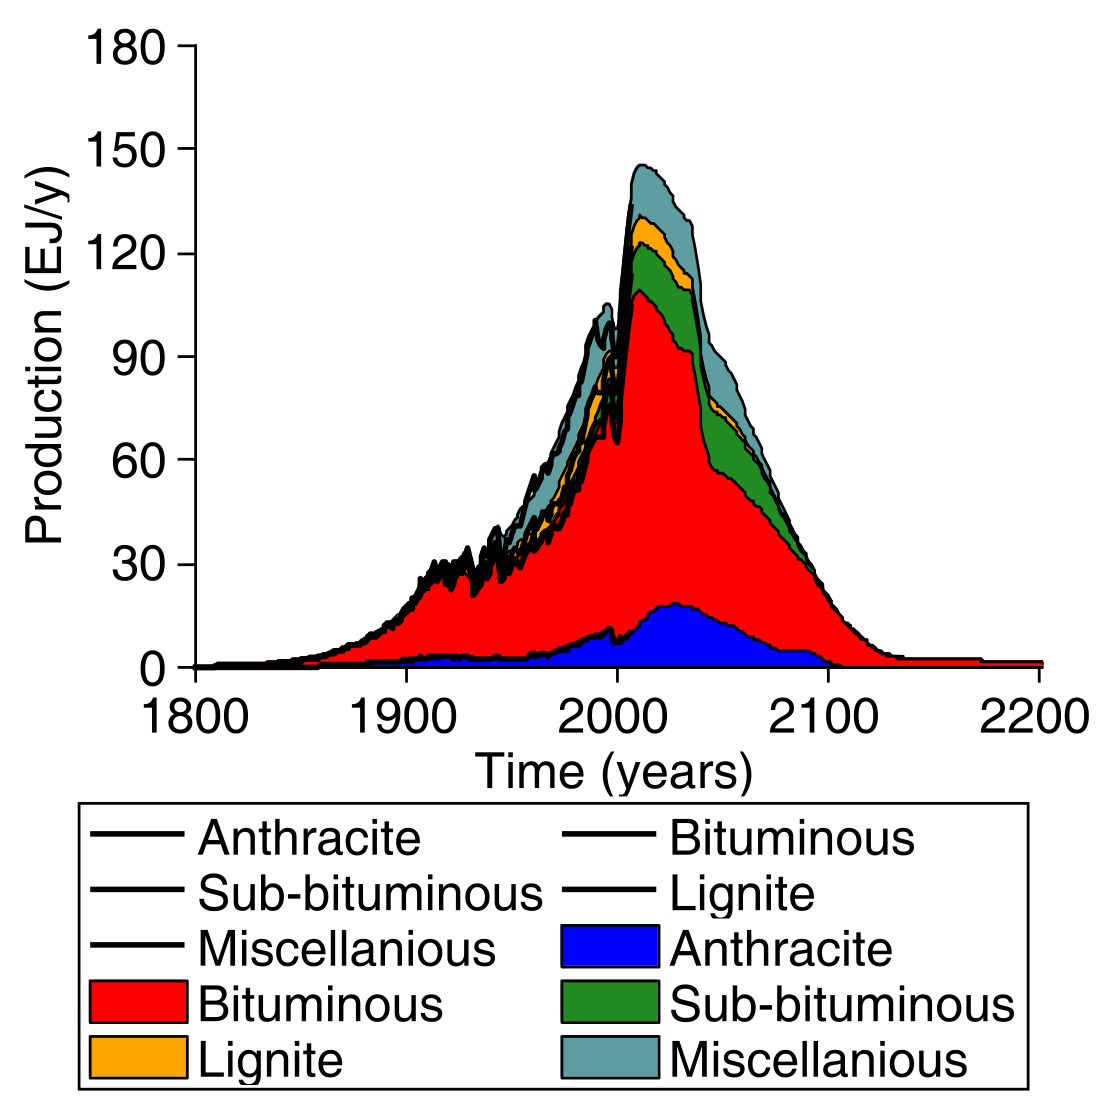
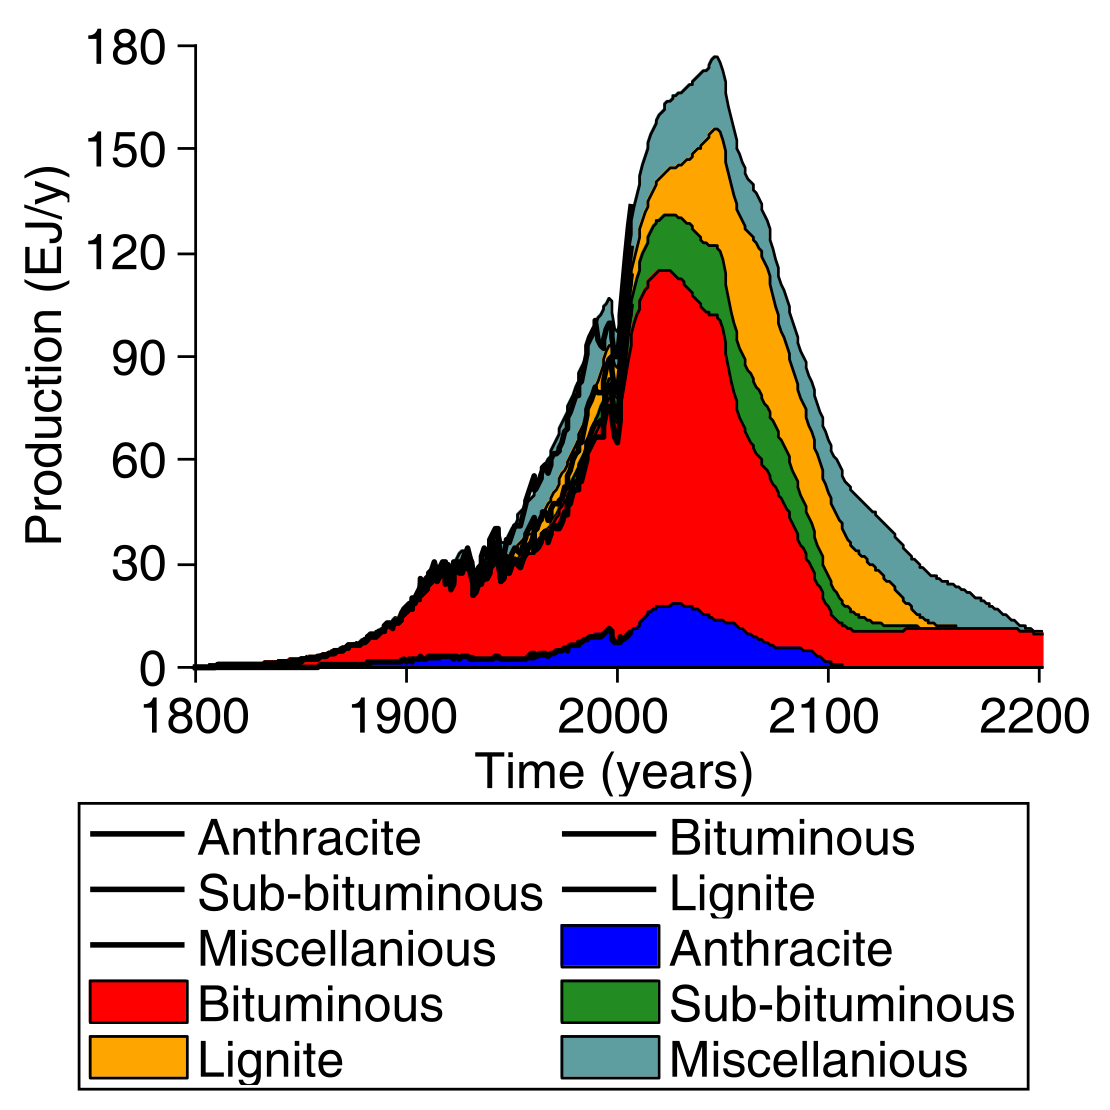
 Figure 4: Coal production prediction for different coal types in EJ/y for a) The HL scenario b) The R+C scenario c) The BG scenario
A Coal data analysis
The exponential functions applied to the coal producing countries that have peaked, were:
| |
|
|
yp1erinc(t-tp1) ; t £ tp1 |
| | (7) |
| |
|
| yp2erdec(t-tp2) ; t ³ tp2 |
| | (8) |
|
Where, (t
p1,y
p1) is the point where production enters the plateau of production, and (t
p2,y
p2) is the point where production exits the production plateau. The histograms of r
inc, r
dec and
Dr are shown in Figure A1.
B Tabulated results
Table B1: The URR estimates for the different scenarios in Gt
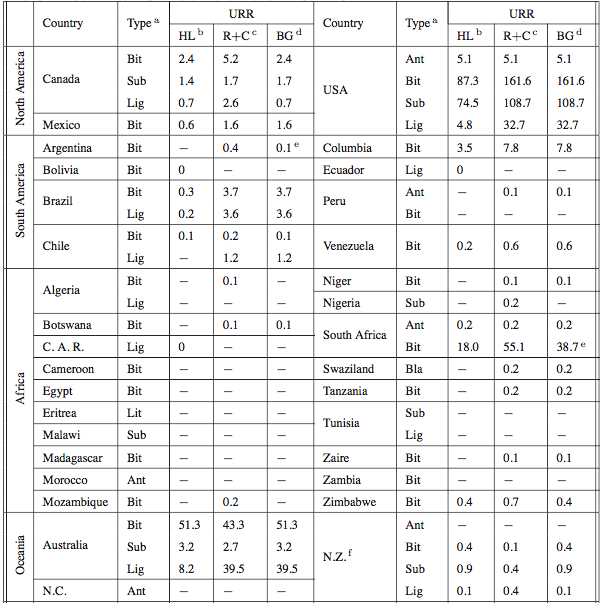

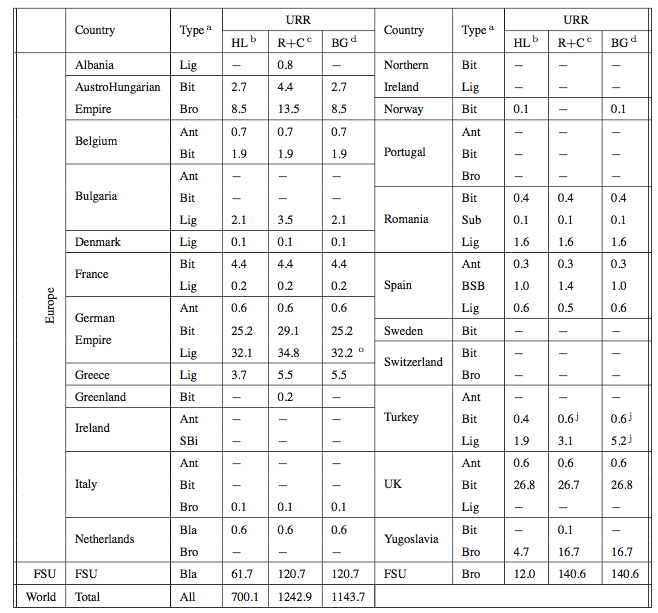
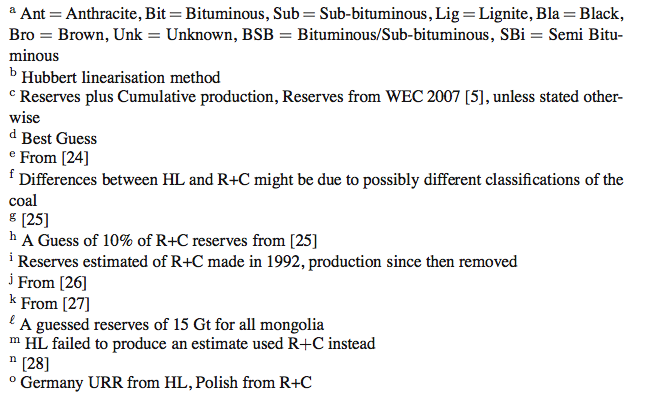 Table B.2: The peak year estimates for various countries and types for the different scenarios
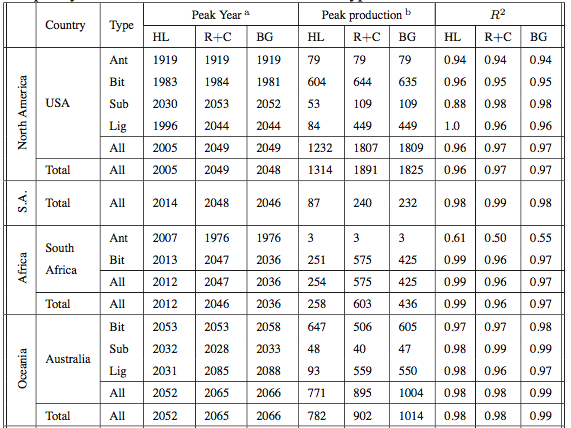
aIf production has flat plateau type peak, then the peak year is the first year of the plateau, bracket number refers to peak year in an energy basis, otherwise mass basis.
bBracked value is production in EJ/y, otherwise Mt/y.
References
- [1]
- BP 2008 Statistical Review of World Energy, June 2008, BP website:
http://www.bp.com/statisticalreview (8/10/2008)
- [2]
- Hubbert M. K., Exponential Growth as a Transient Phenomenon in Human History. World Wildlife Fund's Conference, The Fragile Earth: Towards Strategies for Survival, San Francisco, 1976.
- [3]
- Laherrere J., Oil and gas: what future? Groningen Annual Energy Convention 2006.
http://www.oilcrisis.com/Laherrere/groningen.pdf (24/09/08)
- [4]
- Zittel W., Schindler J., Coal: Resources and Future Production, Energy Watch Group, Paper No. 1/07, 2007.
http://www.energywatchgroup.org/fileadmin/global/pdf/EWG_Report_Coal_10-07-2007ms.pdf (24/09/08)
- [5]
- World Energy Council, 2007 Survey of Energy Resources, 2007
- [6]
- Rutledge D., Hubbert's Peak, The Coal Question, and Climate Change, October 2007:
http://rutledge.caltech.edu/ (2/10/08)
- [7]
- Thielemann T., Schmidt S., Gerling J. P., Lignite and hard coal: Energy suppliers for world needs until the year 2100 - An outlook. International Journal of Coal Geology 2007; 72(1-14)
- [8]
- Kavalov, B., Peteves S. D., The Future of Coal. The Institute for Energy (IFE), prepared for European Commission Joint Research Centre EUR 22744 EN 2007.
http://ie.jrc.ec.europa.eu/publications/scientific_publications/2007/EUR22744EN.pdf (24/09/08)
- [9]
- Minerals U.K. World Mineral Statistics: Years 1913 to 2006.
- [10]
- Mitchell B. R., European Historical Statistics: 1750-1975, Second revised edition, 1981, The Macmillan Press.
- [11]
- Mitchell B. R., International Historical Statistics: Africa and Asia, 1982, New York University Press.
- [12]
- Mitchell B. R., International Historical Statistics: The Americas and Australasia, 1983, Gale Research Company
- [13]
- Australian Bureau of Statistics: Yearbooks - 1908-2008. Australian Bureau of Statistics website:
http://www.abs.gov.au (8/10/08)
- [14]
- Canadian Mineral Industry - Historical Information, Canadian Minerals Yearbooks 1944-1999, Canadian Mineral Statistics 1886-1956, Natural Resources Canada website
http://www.nrcan.gc.ca/mms/cmy/info-hist_e.htm
- [15]
- Ouptut of Saleable Coal in the Principal Districts of Great Britain and Ireland and the Total Selling Value at Pit, Durham Mining Museum website
http://www.dmm.org.uk/stats/toutput.htm (8/10/08)
- [16]
- Pollard S., A New Estimate of British Coal Production, 1750-1850, The Economic History Review, 33(2), pg 212-235, 1980
- [17]
- Milici R. C., The Coalprod Database: Historical Production Data for the Major Coal-Producing Regions of the Conterminous United States U.S.G.S Open File Report 97-447
- [18]
- International Coal Production Tables, EIA website:
http://www.eia.doe.gov/emeu/international/coalproduction.html (8/10/2008)
- [19]
- World Coal Production, CoalPortal website:
http://www.coalportal.com/production_trade_data.cfm?data_type=Production (8/10/2008)
- [20]
- The Brunei Coal Mine, The Daily Brunei Resources, Sunday June 11th 2006, The Daily Brunei Resources website:
http://bruneiresources.blogspot.com/2006/06/brunei-coal-mine.html (8/10/2008)
- [21]
- Mohr S., and Evans G., Demand-Supply Interaction on Future Mining Resource Production: The Coal Model, CSRP'08 Conference, 18-19th November 2008.
- [22]
- Brandt A. R., Testing Hubbert, Energy Policy, 35(5), pg 3074-3088, 2007.
- [23]
- R. Bonskowski, W. D. Watson, F. Freme, Coal Production in the United States - An Historical Overview, EIA website
http://www.eia.doe.gov/cneaf/coal/page/coal_production_review.pdf (12/11/08)
- [24]
- Baruya P. S. et al., Coal Online, Coal Resources, IEA Clean Coal Centre, 2003.
http://www.coalonline.net/site/coalonline/content/home (8/10/08)
- [25]
- E.I.A., Country Analysis Briefs, Bangladesh, July 2006,
http://www.eia.doe.gov/cabs/Bangladesh/Coal.html (9/10/08)
- [26]
- E.I.A. Coal reserves, EIA website:
http://www.eia.doe.gov/emeu/international/contents.html (9/10/08)
- [27]
- Mongolia: Business Opportunities for 2005, Special Advertising Section, Fortune Magazine September 19th, 2005,
http://www.timeinc.net/fortune/services/sections/fortune/intl/media/2005_09mongolia.pdf (9/20/08)
- [28]
- Vietnam Ministry of Foreign Affairs, Vietnam, Japan discuss minerals policies, Other news, 4th December 2007,
http://www.mofa.gov.vn/en/nr040807104143/nr040807105039/ns071204093549 (9/10/08)
File translated from
TEX
by
TTH,
version 3.85.
On 31 Mar 2009, 09:21.

is fig 4 labelled correctly?
sorry to jump ahead to the pretty graphs first
I think fig 3 is the one mislabeled (or accidently inserted, as it looks just like the previous figure).
yes fig 3 is wrong, should look similar to fig 4 but in Gt/y
My fault! Sorry about that. It was getting too late, and I decided to go to bed rather than doing the checking that I should have done.
Hi Gail,
Thanks for posting this paper. It is an important contribution because the approach for estimating the ultimate is independent of the geological estimates, which historically have been biased high, and it has some independence from the straight curve fits. Steve's instincts are leading us to an ultimate that is somewhere between ones based on straight curve fits and ones based on reserves. In the context of previous Oil Drum discussions,these results imply
1. IPCC scenario coal production is too high
2. There is not likely to be enough coal for coal-to-liquids to substitute for oil on a global scale
3. Given the enormous difficulties in developing energy infrastructure in terms of time and money, encouraging alternatives for electricity is a good idea, regardless of what you think about climate.
A question for Steve,
Any thoughts on the possibility of considering different decline rates for underground mines and surface mines? In the UK, surface mining started as a small war-time add-on to underground production. But its decline rate is lower, so it is now half of production.
Dave
the differences between surface mining and underground would be great to look into, particularly if it explains why the UK is more or less symmetric, whereas Europe as a whole is declining Assymmetrically. definitely something to ponder, might be 'fun' getting the production statistics tho.
And the effect of this is what? Perhaps the authors of this paper or Rutledge could post HL graphs, etc., using the IPCC URR(s) vs. the ones in this paper?
I wonder because adding large amounts of URR to HLs for crude change the peak almost not at all for all practical purposes. Is it the same with coal? If so, the economic effects of IPCC overestimates aren't likely to be important.
Referring back to #1, it doesn't matter if the IPCC has overestimated reserves if climate sensitivity is greater than, even double, 3C as the positive effects of having less coal to burn are made up by the fact that the 3C sensitivity is as much as half of what observations suggest. In fact, I doubt IPCC-stated reserves are more than double those here (I'm confident you will correct me if wrong), so we still end up with a massive problem if 3C is low.
The solutions chosen are not independent of considerations of Anthropogenically-driven Climate Change because not all solutions are good for both energetic and climate issues. We must be careful about dismissing ACC.
Cheers
Hi ccpo,
The maximum cumulative in an IPCC scenario through 2100 is 3,400Gt (at 21GJ/t), and in that scenario, production is still rising in 2100. This implies an ultimate of around 7,000Gt or more.
Dave
Reading through this thread one thing becomes clear: there is less certainty about coal reserves than about either PO or ACC, which is fascinating. I'd have thought coal reserves would be more easily quantified than oil.
The 7 trillion vs. 1.2 trillion spread is pretty wide and worth investigating, but given the uncertainty about coal reserves and the time left to act (Hirsch, et al. 2005), it's an academic question, at best. Decisions about energy and climate will need to be made long before verifiable numbers for coal are ever determined.
We come back to risk assessment. Is it worth the risk that there *aren't* enough coal reserves, that there *isn't* enough CO2 to push us into catastrophic climate changes, that tipping points are happening now... etc?
I don't see how it is.
Besides, what are generations a hundred, two hundred, five hundred years from now supposed to use for energy? Etc.
That is, I think the discussion is moot wrt policy. We have no choice. And if we don't act, we risk it all. Those aren't odds I'm interested in.
Cheers
One of the many Amazon reader reviews of Jeff Goodell's book Big Coal. Goodell is a journalist. Early in the book he discusses the extreme paucity of recent and reliable data (at the time of writing) on US coal resources. http://www.amazon.com/review/R1SNO0J3Z5RNO8/ref=cm_cr_pr_viewpnt#R1SNO0J...
This is an interesting study, thanks for posting.
I was unclear regarding the units for 'Peak Production' in table B.2. Is that GT per year?
For the USA, it seems as if the amounts associated with lignite and subbituminous were reversed, but that may just be my near term focus on current production of subbit vs. lignite.
For steam-electric applications, it can be argued that coal is widely (but not infinitely) substitutable. The larger concern would be when metallurgical grade coal dries up, how will this affect cost of steel production? I would expect this to be the first pinch that indicates peaking of coal.
Table B.2 is Mt/y (missing a footnote sorry)
The URR seems to be correct.
I got the footnotes in now.
This translation software doesn't quite handle everything.
Could you show more detail about the US? In particular, reserves and resources, not including cumulative production to date? The bituminous reserve figure appears far too low. I'd also be curious to see the projected consumption curve for the US, as I expect consumption to flatten and then decline fairly soon due to CO2-related restrictions.
Hubbert's bell curve technique doesn't tell us anything about the underlying causes of production peaks and declines: Coal production in the US and UK, for instance, has less to do with the resource, and more to do with the availability of other fuels (i.e., oil and lower sulfur coals), and internal politics (i.e., the mine workers union vs Thatcher).
In other words, in many cases we have been seeing peak demand, not supply. Mercury and lead, for instance, have seen peak demand. If you apply Hubbert's bell curve technique to production, you'll get results that have little to do with the actual resource.
Coal really needs a bottom up analysis, not an HL analysis.
Hi Nick,
A curve fit to production data gives 155Mt for future British production. This is consistent with the 155Mt given for proved, recoverable reserves in the 2007 World Energy Council survey. Curve fits to production data give reasonable estimates for future production from 1900 on. The first time Britain submitted realistic reserves to the WEC was in 2004.
The last time Britain submitted a resources number to the WEC was in 2001:
"British Coal’s annual report for 1991/1992, coal in place (in seams over 0.6 metres thick and less than 1 200 metres deep) was estimated as 190 billion tonnes, of which some 45 billion tonnes could be extracted with current technology."
Could you please explain to me how the bottom-up resource number of 190Gt (or 45Gt) is more useful than the 155Mt number that comes from a production curve fit?
Thanks,
Dave
"Could you please explain to me how the bottom-up resource number of 190Gt (or 45Gt) is more useful than the 155Mt number that comes from a production curve fit?"
I'm puzzled. It's not useful to know that the 155mt figure is "what is likely to be produced", not "what's available if we really needed to produce it"?
If we got clearer on this notion, we might be able to replace statements like this:"The notion that coal is widely abundant therefore appears to be unjustified." with "The notion that coal is is likely to be produced in every larger quantities therefore appears to be unjustified."
They're very, very different things. One suggests either that we face a dangerous cliff of energy scarcity (presuming we need coal) or that concerns about CO2 emissions are unwarranted (presuming we don't need coal). The other suggests that in the ordinary course of events we're only likely to phase coal out, if things keep on going according to BAU, but that we could certainly burn it if we decided we needed to.
It's very important to know that geology isn't the primary decision maker, economics and politics is. We're not going to physically run out of coal, we're going to have to decide to phase it out.
There are still a lot of people who'd like to dig up all of that coal and burn it - here's an example: http://www.journallive.co.uk/north-east-news/todays-news/2007/10/15/old-...
Hubbert's Linearization is a bit of mathematical legerdemain.
The formula P/Q= k*(1-Q/URR) has a direct solution of
Q= URR/(1+URR*exp(-k*t)) and so production P which is just Q differentiated over time is
P=URR^2*k* exp(-k*t)/((1+U*exp(-kt))^2
'If' we are at peak all we need to know is how much coal we've burned(50% of URR) and how much production is occuring.
When you are at peak P=k*Q*(1-.5URR/URR) or k=2*P/Q.
So if we use Rutledge's HL case--URR of 700 Gtcoal, and we are at Peak at 7 Gtcoal/year, k=2*7/350=4%.
So the production curve would be
P=700^2*.04*exp(-.04*t)/(1+700*exp(-.04*t))^2
http://img246.imageshack.us/img246/927/700i.png
For the high R+C case--URR of 1243 Peak at 10 Gtcoal/yr k=2*10/622=.032
So the production curve for R+C would be
P=1243^2*.032*exp(-.032*t)/(1+1243*exp(-.032*t))^2
http://img246.imageshack.us/img246/246/1243.png
It is interesting how nicely these curves work but they aren't remotely scientific( unless you accept the much reviled geological estimates of URR). Just look at how fast coal use races upward in R+C after 2000 just to follow the logistic curve!
They are just based on when you assume a Peak is, using whatever URR you want and how high production you assume.
The BG hypothesis looks like a summation of curves but ends up plateauing for 60 years at 8 Gt/yr. It is probably somewhat less inaccurate because it is a sum of 'expert' estimates of URR--I do think the authors did try to use some judgement but their 'tool' (HL) is a bit silly.
I think we can predict future consumption based on our current need and depletion on respectable geological estimates(not state estimates..the Chinese claim they have a trillion tons of coal!).
I think we will use as much energy as we can dig up and while consumption may not increase, constant demand will cause miners to dig for energy regardless of 'curves'.
Hi
I think I need to clarify.
We only used the HL trend for the HL URR estimate - we were aiming with this to confirm for ourselves that Daves URR via this method was plausible and to then apply the numbers in the model. likewise we used the Reserves + Cumulative to get another URR estimate - had there been detailed URR estimate for world coal (eg made by the USGS), we would have used it and created a fourth scenario. I am not a geologist, nor an economist and do not claim to know what the URR of coal is, I'm simply using the "best" numbers I can find. The HL trends for Europe are interesting, particularly in that Germany, Poland and UK, seem to be revising their reserve estimates downward to numbers that are in line with the HL trend. (so much for mathematical trickery, perhaps reserves inertia)
If China has so much coal, why did their last revision of reserves back around 1992 go downward and not upward?, why is the WEC reserve estimate unchanged and not dramatically increased?? - I personally think their 1992 estimate is pretty close to the mark.
BG = best guess = least worst guess, some numbers are from the HL trend estimate, some are reserves + cumulative, others are numbers found from other references. Again if there is so much coal, where are the geological estimates on the URR to back the statement. In the abscence of good geological estimates, I'm forced to make estimates from other methods and guess.
Forth the model does not use hubberts curve, nor does the code require peak year estimates, demand-supply interactions are included to attempt to force the production to continue on the BAU trend.
"I think we can predict future consumption based on our current need and depletion on respectable geological estimates(not state estimates..the Chinese claim they have a trillion tons of coal!)."
what respectable geological estimates?? I've taken the WEC reserves to create the R+C scenario. Is this the respectable geological estimate? if not, what is?
economist and do not claim to know what the URR of coal is, I'm simply using the "best" numbers I can find. The HL trends for Europe are interesting, particularly in that Germany, Poland and UK, seem to be revising their reserve estimates downward to numbers that are in line with the HL trend. (so much for mathematical trickery, perhaps reserves inertia)
Hi,
I looked at the question of coal reserve in Europe 6 month ago and found a report in French about coal reserve that mentioned that the strong downward reserve estimates after 2003 were linked to mine closing in 2004 due to the end of subsidies to mining industry imposed by EU. As a result the last French mines closed (no more official reserve even though the coal is still in place) as well as many mines in Germany and Belgium. If I remember correctly, the decrease for lignite reserve in Germany was over a factor 10 after the change in economical situation (no subsidies authorized). A strong raise in the cost of coal could make these reserves "reappear" suddenly because they become again economical... if there is no ecological opposition. You could check the pre-2004 reserve estimate for Europe to compare and see the discrepancies in reserve estimate.
The same thing happened with uranium in 2004: All the uranium reserve of France suddenly disappearing in 2004 because in became uneconomical after subsidies were cut. Again in that case, the mine closed and some of the reserves (over 10,000 tons) were never touched.
Anyway, the drop in reserve estimate is not due to re-evaluation of the amount of coal by geologists but to an economical decision at the level of EU. Such decision could be reversed if countries become desperate for some energy source.
Beside that, I find this paper pretty good.
Christophe
And that's exactly why the "Reserves" figure is not an "Ultimate Reserves" figure, much less an overestimate of URR.
Take a look at Gail's graph for coal at one large field; a 10% increase in the retail cost of electricity would be enough to make reserves in that field increase by six times.
Such massive price-based variability demonstrates that not only are Reserves not the same as URR, they're not even a good estimate for it. (For coal, anyway.)
The US has not added to coal electricity generation capacity in years, and industrial production using coal has moved offshore. The result is flat to declining US demand, since natural gas is taking the place of coal. Reserves are reserves in open mines, as I understand it. There is little incentive to add new mines, when current capacity is plenty for the immediate future. I suspect this is part of the reason reserves are not growing, not the lack of coal.
One point of the USGS Study regarding the Gillette Field in Wyoming is that the amount of coal production is quite dependent on price.
Heading Out (Dave Summers) assures me that newer technology is available to increase production, if prices were somewhat higher. Wyoming coal prices have been very low for a long time. (Gillette coal is from the Powder River Basin).
AddedBecause of these issues, I think production is likely to be more than HL would suggest. On the other hand, lack of oil to operate equipment (and failure to quickly replace this equipment with electric equipment) may very much slow production.
WEC and USGS are quite respectable estimates IMO, but not Energy Watch or HL based estimates. I heard some Chinese guy on TV saying that they have a trillion tons(evidently that is what the Chinese government is telling its citizens). India also has bad figures IMO because is has very high levels of ash in it. Technologies like CCS could use high sulfur coals which currently pose a acid rain problem( high BTU Illinois coal is burnt but 'diluted' with low BTU Wyoming coal).
US coal reserves(extractable with present technology, not including protected areas, etc.) are officially 270 Gt but US coal resources are 447 Gt(indicated and inferred).One technology that could greatly increase coal use is in-situ underground coal gasification(UCG).
I am sure you know all this but is it included in your estimate?
http://tiny.cc/OuvU7
Then there are billions of tons of oil shale which the Estonians burn as coal. I doubt these are included.
http://en.wikipedia.org/wiki/Narva_Power_Plants
You must realize that here at TOD the argument is continually made that we will run out of coal before we reach the red line of 450ppm, 600 ppm, 1000 ppm etc. and HL is used to predict production for coal to prove it.
I am relieved that you are using expert assessments rather than relying on mathematical 'tools'.
Coal is dirty and the biggest GHG problem but coal is important not just for electricity but for plastics, fertilizer, etc. and it WILL be mined.
Shale particularly that mined in Estonia (but also Brazil) is included in our work on unconventional oil. (hopefully gets accepted at some point in time).
Coal insitu-gasification is treated as unconventional gas (or will be if I get round to it).
evidently I hit a nerve, I'm not particularly interested in the URR of coal, I am interested in creating better and more accurate models to predict energy and other resources production. The URR value to me, is a necessary evil I need to get from somewhere - I'd be much happier if there was a general consenses on what the URR value is, and just use high low estimates from that. I hope the real URR is somewhere contained in the interval indicated, but I do not know, and cannot know that (again, I'm a Mathematican and Chemical Engineer, not a Geologist or Economist). I'm happy if I've gotten the URR wrong, its straight forward to change the numbers in the model, again, if there are geological based, recent estimates that indicate the URR is somewhere outside the range (eg a justification for the IPCC estimate of 7000 Gt that Dave mentioned) then please let me know. that way I can modify the model for the phd and use HL trend as a low case, a presumably modified best guess case and some high case based on a better geological URR estimate.
The IPCC estimate comes from basically counting every bit of solid carbon in the world as "coal". That means the thin seams nobody bothers digging up and uses for coal seam gasification, the shale, estimated undiscovered reserves in the Arctic, etc.
That's why price affects reserves - if you were willing to pay $10 billion a barrel you could get oil from Titan the hydrocarbon moon of Saturn.
With the various studies reviewed by the IPCC, there's no consideration that at certain price points people will just give up on it as an energy source - whether they want to or not. Some thoughts along those lines are in The Freezing Point of Industrial Society.
I concluded that "To create and maintain a modern industrial economy requires fuel affordability of something between 1,500-10,000lt per person annually." That is, if you can't afford at least 1,500lt of fuel with the median income, then you won't have SUVs and plastic wishbones and factories and so on.
I mean, you can still build these things, rich people will still have them, but it won't be widespread the way it is in the West today.
So the price point where fuel affordability is 1,500-10,000lt per person, that's where you need to look for URR for oil. Coal and gas will be in appropriate proportion to that. It's still only a rough idea with a large margin of error, but it's less than the variance given in the literature.
I think that this varies enormously by country.
My hope is that US consumption will stay flat, and start falling. Given that the US has the largest reserves, that's pretty important.
I suspect that UK consumption will also stay low.
China and India may burn everything they can find, though China is certainly ramping up wind, solar and nuclear (India also, though somewhat less), and electrical demand is certainly falling below earlier projections. That's worth some detailed analysis.
Australia? Hard to know, but they don't seem to be limiting their coal production and exports at all. This may depend on demand from Asia, which is hard to project.
Germany might be a middle case.
Majorian,
I still think EnergyWatch are producing good work but it may be helpfull to break the post-peak curve into 2 elements, the bulk curve followed by a long slim tail.
Judgments as to what is economically recoverable using current economics and technology seem to support an early peak and a substantial reduction below IPCC SRES scenarios (which IIRC are based on IEA data). But that may not be the whole story.
I'm picturing the situation much later this century (assuming we've not cracked fusion), we may see a situation where people are using the sort of mining technology employed at the start of the industrial revolution (even before) to extract reserves we would not normally consider recoverable. Indeed the technology would not be solely early/pre-industrial because we'd still have some benefit from what we have learned since. It's not necessary for the whole globe to be working at such a low-tech level without heavy machinery, such mining could be confined to regional areas.
In impoverished societies well beyond peak energy labour may well be cheaper than machines. Just look at what the Egyptians achieved at Ghiza with cheap labour (relative to modern standards) and the will of the ruling class.
This reduction of rate of emission might seem to be reassuring. However Dr David Archer in "Millennial Atmospheric Lifetime of Anthropogenic CO2" concludes:
"The [carbon cycle] model studies we reviewed here differ substantially from each other in
parameterizations of oceanic and land carbon uptakes, the deep-sea sediment response,
and emissions pathways. However, despite all these differences, the models agree that the
substantial fraction of projected CO2 emissions will stay in the atmosphere for millennia,
and a part of fossil fuel CO2 will remain in atmosphere forever. Many slowly responding
components of the climate system, such as ice sheets and methane hydrates,
will be affected, and significant sea level rise is inevitable."
In view of which if I am correct in suggesting a "long slim tail" of emissions as humanity scratches out the last reserves of coal, the tail may be long and slim, but it would still be significant in terms of additions to the carbon cycle. However estimating how much coal may be extracted in that tail (time integral) will be virtually impossible with so much uncertainty about the assumptions that need to be used.
Many thanks for this post.
An immediate question is 'if China's coal production will peak soon (like in the next five years) what will happen to its industrial boomtime?'. They are 70% dependent on coal and production has quadrupled since 1981.
And ....they should be hitting their own internal peak oil in the same timeframe.
As for the US, I was interested to find that peak coalfield productivity in short tons/man hour seems to have peaked in 2000.
See
http://www.eia.doe.gov/emeu/aer/pdf/pages/sec7_15.pdf
Looks like declining EROEI is setting in,
BobE
This appears to be quite a sophisticated piece of resource modeling, and a good one to bring out when someone blithely comments that 'we have enough coal left to last hundreds of years, so why worry.'
I know I am in over my head here, so if this conjecture is way off base, anyone please feel free to correct the error(s) in my thinking.
I think I have a fairly decent layman's understanding of the physical mechanisms by which an oil field depletes due to various factors affecting the flow of fluids in the subsurface. (From my days in the environmental consulting field I am at least conversant in hydrogeology as it pertains to attempts at manipulating groundwater flow for the purpose of site remediation.) I recognize that beyond certain practical limits, there isn't a whole hell of a lot you can physically do to increase production once an oil field gets past a certain point in its depletion history.
Now, when it comes to the surface mining of coal, it appears to me that the limitations to production rates have less to do with geology and more to do with logistics and level of investment. By that I mean: if one has a huge sprawling shallow coal deposit and one is currently operating a single large monster dragline/shovel system, one theoretically could almost double production (and deplete the field almost twice as fast) by putting in a second such monster dragline/shovel system. While doing so may not be feasible from an economic standpoint, it would still be feasible from a purely physical standpoint. True? Half true? Dead wrong?
Furthermore, if one is surface mining a fairly thin seam of coal, once the operation is fully up and running it would seem that the production rate would be fairly steady from the start of operations until near the end. In other words, as long as the seam still contains coal and is readily accessible, it would seem that with a given rig one could mine pretty much the same amount of coal day after day with little geology based decline. True?
If the above is true, then wouldn't the depletion mechanism regarding the surface mining of coal be an entirely different animal than that represented by the type of depletion models we frequently see presented and discussed here at TOD?
I am of course talking about a single mine. Perhaps in the aggregate, as more and more surface mining operations are tapped out one might see the same effect as with oil fields, even though the depletion mechanisms are entirely different.
Am I making any sense here?
Coal seams can be mined from multiple points simultaneously, but this is no different from drilling for oil as producers can use multilaterals. There seems to be an optimum mine or well size that has increased with time in both cases. Also surface coal mines do not have a flat production curve, both coal seam and overburden thickness vary in almost all fields. Wyoming mines started with 80-100' seams of coal under 40' of overburden. The same mines are still producing, but the ratios have reversed. So Hubbert's curve should still apply for coal as far as these factors go.
But Hubbert's curve only applies on the primary energy supply, curves seen in other resources are mere artifacts of the inexpensive and plentiful energy supply. Withdraw that energy and all other resource extraction will slow.
So the question to ask is, will we transition to another primary energy source? If we do, then Hubbert's curve will continue to apply to other resources. But if we don't, non-primary energy production will decline along with everything else.
Most of the evidence supporting and confirming Hubbert's curve supports the shape of the curve up to the peak, but not the shape afterwords in a world short of energy, which we haven't experienced yet. It is quite possible and even likely that we will not see a smooth Hubbert's decline. My money is on an extended plateau which rapidly eats up remaining real oil reserves followed by a near vertical decline dropping far below the smooth curve, with perhaps some violent whipsaws on the decline. Unfortunately, in the case of oil, the production plateau is history. Instead of replacing oil, NG, coal and most other alternatives are also ramping down. This tends to support the idea that we will fail the transition.
Can our economy tomorrow support sustained high prices for alternative energies without oil? Many of this site's readers are died-in-the-wool cornucopians, to them the answer will always be yes. I keep an open mind, but the evidence is overwhelmingly negative. Oil appears to play the part of a keystone block in an arch. Hence I prepare for the worst while hoping for the best.
Oh, and this is completely off topic, but I see a high correlation between personal sustainability and pessimism. Most of the people who have any chance of surviving rapid decline are pessimistic. Others who cannot prepare are almost universally optimistic, fatalistic, or strident, none of which will do any good in a real decline. Clearly if people allow their circumstances to bias their judgment rather than the other way around, we are in a world of trouble, all of us.
So, if you live in an unsustainable situation, discount your optimistic view. Don't take this personally, Joule.
Cold Camel
Hi Joule
your pretty much on the money with how we were thinking. We 'see' a mines production over time as trapeziums, they need a few years to remove the overburden and reach a maximum production typically determined by the geology and economics, and often they upgrade and increase their production, and at some point in time shut down due to the remaining coal being uneconomic to continue extracting. At the moment the model sees all the mines as the same size (something we are dislike and openly critise, and I'm trying to modify this - actually part of todays plans :D). you can only build so many mines, and with the mines in place, the only remaining option is to upgrade the mine to double production. The ability of mines to upgrade over time (as opposed to say oil wells which tend to decrease over time) is what gives an asymmetric curve in the model (up slow, down fast) interesting this is what happened in Europe, though strangely not in the UK. in the world prediction, its reasonably symmetric, this could be due to oversimplifications in the model, or something else. much more research is needed (and trivially an improve model). unfortunately I believe that a healthy fear that oil is scarce has meant that we have had many years of research into oil and some good stuff on decline curves etc. the notion that coal is abundant and therefore we can relax, appears to be why there has far less research. (just look at the difficulties in getting coal production statistics, compared to oil statistics).
Speaking of coal production statistics, Richard Heinberg was telling me that in his new book on coal he will detail exactly how bad the situation is. Should be interesting reading. (I don't want to repeat what he said because I'm not certain of the details.)
Looks like Amazon will be carrying it starting in late May:
Blackout: Coal, Climate and the Last Energy Crisis
Another approach may be total activity modelling that could show coal demand is limited by other factors such as liquid fuels and total water use. The recent TOD article by Dolores Garcia concluded that flattened coal demand would limit CO2 to 510 ppm.
I haven't absorbed the meaning of the co-efficients yet but an observation is that in a recession thermal coal holds the line but metallurgical or coking coal takes a hit. If I recall the numbers properly in 2006 Australia exported 229 Mt of bituminous (black) coal split roughly half between thermal and coking. Domestic black coal use was 84 Mt and brown coal (lignite) was thought to be about 65 Mt. Coking coal exports are rumoured to be down 30% or .3(.5)229 = 34 Mt just 9% of total coal production.
Complicating factors are the weak threat of a cap and trade scheme and a looming Chinese buyout of several Australian coal mines. Nonetheless Australian coal production may have gotten as high as it will ever get around 2008 due to politics and global demand factors, not logistics. In fact coal railroads and export loaders were expanded in capacity, so far unused. If this 'political peak' theory is correct the Australian future production graph would therefore be a long plateau.
Limit? 510 ppm is a different planet Earth.
Mohr's analysis is on the resource side of coal. But what about the sink side (CO2 concentration in the atmosphere)? If we define the climate of the last century as the climate which can support a population of, say, 5-6 billion, then the absorption capacity of the atmosphere and the oceans for CO2 HAS ALREADY PEAKED, possibly 20-30 years ago. Compared to the 300 ppm of a warm period under natural climate change we are now very much in CO2 overshoot mode at 385 ppm.
If the coal in the above graphs is ever burnt, planet Earth will warm up to such a degree that our present civilisation will not survive.
My assumption is that the density at which weird weather and climate change events happen in the next years will increase in a way that we are forced to abandon coal much earlier than is naively assumed.
We just had this
Wilkins ice shelf collapse
http://www.realclimate.org/index.php/archives/2009/04/wilkins-ice-shelf-...
How do these coal addicts actually think this will continue?
Another aspect to the whole energy question is one that I have, on occasion, raised, which is of course net exports.
The EIA estimates net coal exports on the basis of BTU content. It would be interesting to compile the combined net coal exports by the top 10 net coal exporters for the past 10 to 20 years or so.
Three examples:
Chinese Net Coal Exports (Trillion BTU’s):
http://tonto.eia.doe.gov/country/img/charts/CH_coal_import_export_large.png
US:
http://tonto.eia.doe.gov/country/img/charts/US_coal_import_export_large.png
Australia:
http://tonto.eia.doe.gov/country/img/charts/AS_coal_import_export_large.png
The EIA shows that these three countries combined net coal exports were 7429 Trillion BTU's in 2000, and 7089 Trillion BTU's in 2006, an annual decline rate of a little less than one percent per year.
Here are Indonesia & Russia, showing a combined increase from 1788 Trillion BTU's in 2000 to 4902 in 2006:
Indonesia:
http://tonto.eia.doe.gov/country/img/charts/ID_coal_import_export_large.png
Russia:
http://tonto.eia.doe.gov/country/img/charts/RS_coal_import_export_large.png
The total for all five was 9,217 in 2000 and 11,991 Trillion BTU's in 2006.
BTW, the premier example of net exports peaking long before production peaks was the US in regard to oil production. We went from finding our largest Lower 48 oil field in 1930, the East Texas Field, and from being a leading oil exporter and primary source of oil for the Allies in the Second World War, to net oil importer status only 18 years later, in 1948, 22 years before our oil production peaked.
Hold it. Australia is building a 3rd coal loader in Newcastle and a new coal terminal at Gladstone, both on the East coast.
http://risingtide.org.au/coalloadersapproved
Nod for new CQ coal terminal
April 21, 2008 02:47pm
ONE of Australia's largest coal terminals has been approved for central Queensland.
Federal Environment Minister Peter Garrett has signed off on the environmental impact study for Wiggins Island Coal Terminal, an expansion of Gladstone port's coal terminal.
http://www.news.com.au/couriermail/story/0,23739,23574040-3102,00.html
Yes, Peter Garrett, from Midnight Oil.
That's why NASA climatologist James Hansen writes:
http://www.columbia.edu/~jeh1/mailings/2009/20090215_Damocles.pdf
Of course the key point is the total volume of net coal exports. As noted above, just the recent combined decline in net coal exports from China & the US exceeds the recent increase in net coal exports from Australia.
Excellent analysis. I especially appreciate that there was a closer look to the mine production pattern, which in fact looks different from what we are used from oil or natural gas wells and which can be quite irregular (see examples for the South African mine production between 1980 and 2006:
http://www.dme.gov.za/pdfs/minerals/D2%202007%20final%20-%20April2007.pdf
)
I also appreciate that changes in demand are considered, however I would like to know on which data this is based on. In fact the demand trend should be quite complex, as it didn't always grow but also decline (e.g. due to abandoning the use of coal for heating or steam trains).
Looking at the figures 2 to 4 I am wondering what the almost vertical drop in 2030...2050 is due to. Any guess?
Hi
thanks for the positive feedback, the demand is very crude at the moment, in the present model its an exponential fit that changes due to interactions with the supply. We are working on making the demand more complicated, and accounting for changes in demand at the moment - not sure how successful it will be.
many thanks for the link - I'm trying to find yearly mine statistics for all mines in a given region since mining began (or atleast close to) in order to valid or modify the code - I'm working with NSW data with a few unfortunate gaps. if anyone knows of such data, for a region please let me know. (does the South African data exist for pre 1980's?)
the vertical drop is a direct result of the steep rise in Chinese coal production, with the mine life fixed for each mine, essentially during 2000-2010 a lot of mines are added and once these mines are exhausted, the are all shut down, hence the steep decline.
Steve, two thoughts.
First, I think it would be helpful to think in terms of two analyses: "likely", and "possible". Historical trends are extremely helpful for "likely", and the HL analysis is helpful there as well. Of course, current policy development (especially US cap and trade) are also important. On the other hand, "possible" needs to be based purely on geology, as best as possible. "likely", and "possible" can differ enormously, as we've seen in the case of the UK (where they're likely to use less than 1% of their resources).
2nd, it looks to me like the most important places for further analysis are China and "rest" of the world. They're the ones that peak soonest - China in particular has very large implications for the world economy, and CO2 emissions - without those two peaks, coal production appears to peak more than 50 years from now (which is really outside the timeframe we, or anyone, needs to be concerned about - we're going to have solved our energy problems, or sunk beneath the sea, before then).
Hi
I'm happy to include a higher URR scenario into the model, what number would it be though? if its 7,000 Gt as mentioned above, is valide then there is little point in attempting to predict coal production. the BGR indicate resources in the order of 20,000 Gt, if we assume 50% recovery, then thats 10,000 Gt and modelling coal production in the future is a pointless excerise.
The UK certainly claim to have a large amount of resources, and there are mining companies in the UK keen to extract coal, so I guess the question I'd like to know is why has production been declining for ~90 years, why did they adjust there reserves to a value very similar to the HL projected number, granted the EU could have made mining harder back in 2004, but up until mid 2008, the price of coal (atleast in Newcastle) was very high. again, I'm not a geologist, but I think a geological estimate of the URR for coal is long overdue.
Hello SMohr. Just to clarify a question on your paper: what do you mean by 'German Empire' re Europe's coal reserves? (this isn't a loaded question - I just want to know what geographical area is covered).
Cheers
its modern day Germany + Poland (including Saarland), the reason for having to combine the countries was due to the data being not good enough to separate into Poland and Germany.
" if we assume 50% recovery, then thats 10,000 Gt and modelling coal production in the future is a pointless excerise."
Yes, I think in the majority of the world (certainly in the US and UK) that geological limits will be unimportant. I hope that this will be the case in China and India: both they and the environment will be enormously better off if substitutes like wind, nuclear and solar take hold sufficiently quickly to prevent burning every last ton of Chindian coal.
"I'd like to know is why has [UK] production been declining for ~90 years"
Better and cheaper substitutes. The history of oil by Yergin ("The Prize") does a good job of telling the story of how UK coal was partially displaced by oil. Later, cheap coal imports, combined with conflict with the coal miner's union (especially between a militant, strike-prone union and a conservative government), killed most of the rest of the domestic coal mining industry.
"why did they adjust there reserves to a value very similar to the HL projected number"
The key here is the concept of "economic to produce". If your domestic/regional coal costs $35/ton to produce, and imports (or other regions) cost $30/ton, the imports will win, without some sort of import restrictions. The same applies to burning the coal - if your coal has excess sulfur, and is slightly more expensive to burn, it won't be used. It doesn't matter how much you have (the Illinois Basin probably has 150B tons of high-sulfur coal), a slight cost difference just eliminates you.