Five Easy Leases: Ghawar's Discovery Wells
Posted by JoulesBurn on June 6, 2009 - 11:08am
 A few months back, Saudi Aramco commissioned a story about the first wells in the Ghawar oil field in Saudi Arabia, the world's largest.
With the title "Ghawar's Magnificent Five", it was published first on the Saudi Aramco website but has subsequently appeared elsewhere.
Saudi Aramco later published the same article along with the companion piece "Still Going Strong" (subtitled "57-year-old super-giant Ghawar oil field productive as ever") in the Fall 2008 issue of SA Dimensions magazine, also available on their website1.
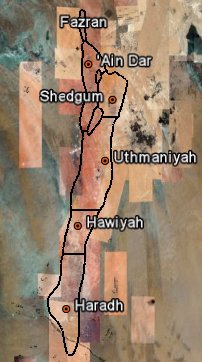
"Magnificent Five" is the newly minted moniker2 for the group of discovery wells, one for each of the five major production areas of Ghawar: 'Ain Dar, Shedgum, Uthmaniyah, Hawiyah, and Haradh.
These articles are remarkable in that Saudi Aramco rarely reveals production details for specific wells in Ghawar, but something in this myth-building exercise is amiss -- both in the consistency of the numbers provided and their use as indicators for the state of the wells and the overall field.
In this article, I will examine the data provided for these wells and cross check with other available information including satellite imagery available within Google Earth. There is definitely more to the story, and this uncut version is actually more interesting than what Saudi Aramco has released to theaters.
A few months back, Saudi Aramco commissioned a story about the first wells in the Ghawar oil field in Saudi Arabia, the world's largest.
With the title "Ghawar's Magnificent Five", it was published first on the Saudi Aramco website but has subsequently appeared elsewhere.
Saudi Aramco later published the same article along with the companion piece "Still Going Strong" (subtitled "57-year-old super-giant Ghawar oil field productive as ever") in the Fall 2008 issue of SA Dimensions magazine, also available on their website1.
"Magnificent Five" is the newly minted moniker2 for the group of discovery wells, one for each of the five major production areas of Ghawar: 'Ain Dar, Shedgum, Uthmaniyah, Hawiyah, and Haradh.
These articles are remarkable in that Saudi Aramco rarely reveals production details for specific wells in Ghawar, but something in this myth-building exercise is amiss -- both in the consistency of the numbers provided and their use as indicators for the state of the wells and the overall field.
In this article, I will examine the data provided for these wells and cross check with other available information including satellite imagery available within Google Earth. There is definitely more to the story, and this uncut version is actually more interesting than what Saudi Aramco has released to theaters.
1http://www.saudiaramco.com. Click Newsroom/Publications/Dimensions.
2The wells' new nickname invokes the grandeur of another movie: The Magnificent Seven. It is noteworthy, though, that most of the seven died prematurely.
First Things First
The first, (or discovery) well is certainly critical to the success of an oil field in that, well, there has to be one. Its story can also be one of drama, as is the case for the first (successful) well in Saudi Arabia, Damman #7 (aptly named "Prosperity Well"), located a short walk from Saudi Aramco's headquarters in Dhahran. Here are some excerpts from an account of the drilling:By May, 1937, everybody around Dammam admitted that the well was in bad shape and was going to be slow. There was a spurt in July that took them down to 2,400 feet, then delays again. On October 6 they had reached 3,300 feet. Tests then, as well as on the 11th and 13th at slighly greater depths, produced the same report: "No oil, no water." At 3,600 feet, on October 16, they got their first showing of oil—about two gallons, in a flow of thin gas-cut mud. On the last day of 1937, with the hole drilled to 4,535 feet, the well blew out when the control equipment failed. After contact was reestablished, measurements showed the well making 30 million cubic feet of gas a day against 1,600 pounds back pressure. Because of the high pressure they let it blow for seven hours while mixing mud to kill it with, and then killed it without difficulty. There was no oil in the gas it blew. ... While he was selling them, Ohliger's crew was drilling past the "fish" that it had been unable to pick up, and on March 4, 1938, San Francisco got the word that blew it back again into the euphoria of the summer of 1936. Tested on that day, No.7 flowed at the rate of 1,585 barrels a day. Tested three days later, it flowed at the rate of 3,690 barrels. The drilling party stuck the tester in the hole and couldn't get it out, and the well, flowing as nearly open as possible through the stuck pipe, went on producing at a rate that made them cheer.
Pretty gripping stuff, and probably worth the well being immortalized with a nickname and by mounting the original wellhead at Saudi Aramco headquarters. Anyway, back to the "Magnificant Five".
Given its size, Ghawar warrants five discovery wells (Fazran's well didn't make the team). Disappointingly, the tale related for each of these discoveries is not as gripping as that for Damman #7. Also, these are likely not the most productive wells in each of the areas, and lauding the achievement of any particular well in Ghawar seems somewhat akin to giving the straw credit for the margarita. So why tell their story? As shown in the excerpts below, it seems to be a case of wanting to cement the legacy while reassuring the world that the "Glory Days" are not gone.
Since the discovery of the Ghawar field in 1948, Saudi Aramco has implemented best-in-class reservoir management practices and leading technologies that have evolved over the years. As a result, the Magnificent Five have demonstrated extraordinary performance with extended lifecycles and outstanding oil recovery.and in conclusion:
Altogether, the Magnificent Five have produced nearly 350 million barrels of oil. There’s no telling how much more they will produce — as the end of their story is not yet in sight.Unless you go looking for it.
Sweeping In
Before we look more closely at the "Mag Five", let's address an important aspect of Ghawar not discussed in the articles. The Ghawar oil field has been subjected to peripheral water injection for nearly 40 years. The goal of the water injection is to maintain pressure at the oil/water contact (OWC) so as to enable the oil to flow uniformly towards the wells. As the OWC moves upwards as the oil is displaced, wells nearer to the periphery of the field will be expected to encounter water sooner than those in the middle. Ideally, the field would be developed in stages, with the first producers situated a modest distance from the (original) OWC and wells further updip either choked back (to concentrate flow on the first producers) or simply undrilled. This is shown below. Click the Start/Continue button to proceed through the various stages of field depletion.
| Figure 1. Peripheral water injection. |
If the first wells are drilled near the middle of the field, a successful sweep would mean that they would remain successful producers for most of the field's life. As we will see, four of the "Magnificent Five" are indeed located in the middle of their respective areas of Ghawar. There was one slight miss, however.
The Ghawar field is 264 km (164 miles) long, but it is not the simple anticline pictured above. This is shown in the cross-sectional representations below. A single NW-trending anticline in the south becomes two in Uthmaniyah. This has implications for the uniformity of the water flood, as distance from the water injectors will tend to keep the "valley" between the anticlines dry longer than would be predicted from gravity-dominated drainage. Note the exaggerated vertical relief in most 3-D reservoir depictions.
 |
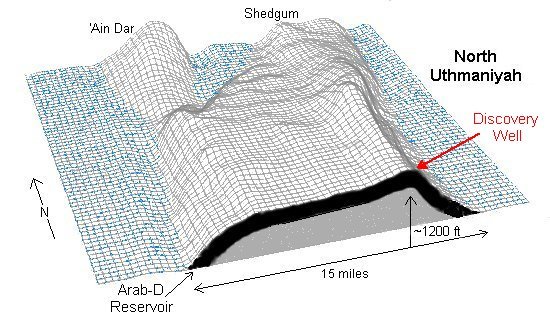 |
| Figure 2. left: location of discovery wells on 3-D rendering of Arab-D reservoir for Ghawar; right: cutaway rendering near 'Uthmaniyah discovery well | |
Stacking the Deck
The "Mag Five" article provides some basic production data for each of the five wells, including production start, cumulative oil produced, and current flow. For these, one can calculate the average daily flow rate for each well. These data are summarized in the table below:

Two of the wells (Hawiyah-1 and Haradh-1) were presumed to be shutdown along with their respective fields during the price crash in the 1980s , so the years 1983-1990 were excluded from their calculated averages. And though the authors are loathe to type the words, the Uthmaniyah discovery well died a watery death some years ago.
Most of the production has come from the 'Ain Dar and Shedgum wells, due mostly to their high flow rates, but also because they have been flowing more or less continuously. They are both down from their lifetime average flow rates, however.
A couple of months after the "Mag Five" article came out, a story in Forbes appeared which used similar information in a story on Saudi oil:"We go really slow and soft," says Al-Naim, the engineering chief. "Ghawar we treat as you would a young woman." Every Aramco well is fitted with an adjustable steel choke that restricts a standard 3-inch-diameter well bore down to a quarter-inch or less. Slowing the well reduces the amount of water that is produced alongside the oil, and a gentler flow protects the reservoir from damage. Aramco's oldest operating well, Ain Dar 1, was drilled in 1948. This single well in the Ghawar complex has produced 152 million barrels from its original casing. The well's free-flow rate is now 8,000 barrels a day, but Aramco restricts it to 2,500. It insists that rumors of Ghawar's demise are premature. The field has given up some 45 billion of at least 100 billion barrels of original oil in place (only Aramco knows for sure, and it's not telling), yet still easily produces 5 million barrels a day; its overall water cut has declined in recent years to only 28%. Says Nasser, "If I needed more production I could go to Ghawar and boost it to 10 million barrels a day."
The suggestion here is that 'Ain Dar-1 could be producing more than its lifetime average but is instead being throttled back to 2500 or lower. The more outlandish claim -- that Ghawar could produce 10 million barrels on demand -- does make one question any numbers provided. For one thing, there is no way to provide that much water to pump into Ghawar, and thus the field pressure would quickly collapse.
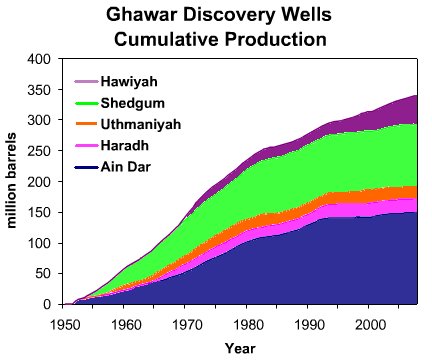
The "Still Going Strong" article presents similar numbers but also tantalizes us with a graphic showing the production history for the wells. Unfortunately, it was routed through Saudi Aramco's data obfuscation department; their first act was providing running sums instead of showing actual rates, and the second was stacking the data to yield a completely meaningless summation of the five disparate wells. This graphic is reproduced below.
|
| Figure 3. Stacked presentation of cumulative production for five Ghawar discovery wells |
It is possible, though, to resurrect the more pertinent data from the above, more clearly delineating the production trend for each well:
| Figure 4. Unstacked presentation of cumulative production for five Ghawar discovery wells. Note: The above graphic is interactive. Click on each of the five well names to highlight an individual production history. Each will be discussed in detail subsequently. |
One could take this a step further by differentiating each curve to yield the instantaneous rate over time, but the noise level becomes too distracting to be helpful. Average daily flow rates can be obtained from periods of relatively steady production, however, as will be shown later. One thing that is apparent from the above graphic is that production for each of the Uthmaniyah, Hawiyah, and Haradh wells was rather minimal for a 20 year period. Possible explanations for the above production trends for each well will be covered in the next section.
Location Location
The "Mag Five" article shows approximate locations for each of the wells. More useful are old Saudi Aramco maps for Ghawar which show the well positions relative to other numbered wells, including Figure 3b from:
"Ghawar Oil Field, Saudi Arabia"

Bulletin of the American Association of Petroleum Geologists

Vol 43, No. 2 (February, 1959), pp 434-454
| |
| Figure 5. Left: Discovery wells for Ghawar shown on Google Earth map. Right: Overlay of 1959 map section for north Ghawar on Google Earth. Large black dots are discovery wells, small dots are other 1959 wells. Move cursor over image to show actual locations of existing wells which correspond to those on 1959 map. | |
The well spacings on this map were overlayed on the actual spacings on the imagery in Google Earth. A combination of sufficient resolution on the map (in the vicinity of each discovery well) and the relatively sparse well placement in Ghawar permits an unequivocal identification of each of the five wells. A Google Earth KML file which includes the well locations and the Ghawar field boundaries can be found here.
For more information about (and examples of) using Google Earth to geo-reference maps, see the links below.
Note: Underlying satellite imagery in the figures for this work are copyright Google and DigitalGlobe.
In the next sections, I will look more closely at each of the discovery wells -- both literally and figuratively.
'Ain Dar-1
The 'Ain Dar discovery well, the first well drilled in Ghawar, is located in north central 'Ain Dar. After pinpointing the exact location of the well a shown earlier, one thing to do is take a close look to see if anything is or has been happening around the wellhead. New features of Google Earth makes this a simple task, as archival images (if they exist) can be browsed to look for changes. For the area around 'Ain Dar #1, images are available from 2003 and 2006, as shown below.
| Figure 6. Close up satellite image of 'Ain Dar discovery well from 2003. Mouseover reveals 2006 appearance. |
Note that there are pipelines running both north (to Gas Oil Separation Plant #1) and south (to GOSP #2). From the images, it appears that the south pipeline is the one currently in use. There are some small changes visible, including a plumbing replacement at the wellhead. It is not likely that any other substantial modification of this well has been done. By way of comparison, consider the image pair (shown below) for another 'Ain Dar well, located 4.5 km to the northeast of ANDR-1. This well was being re-drilled in 2006, and such efforts leave a pronounced footprint on the wellsite. Newer drilling procedures seem to require the staging of more equipment and facilities, thus requiring more physical area. Older wells which have not been redrilled retain the original footprint.
| Figure 7. Close up satellite image of another 'Ain Dar well obtained in 2003. Mouseover reveals 2006 re-drilling. |
Although not much can be discerned from looking at the well itself, more is learned by looking at the surrounding wells. The north-central part of 'Ain Dar was apparently an area of interest for Saudi Aramco in 2003-2005, with several new wells added to provide additional dry production for delivery to the existing Gas-Oil Separation Plants (GOSPs). Three articles from Saudi Aramco give useful information (often unwittingly) on the placement of a Maximum Reservoir Contact (MRC) well in northern Ghawar: ANDR-524.
- Water Management in North 'Ain Dar, Saudi Arabia (SPE 93439
- Optimizing Maximum-Reservoir-Contact wells: Application to Saudi Arabian Reservoirs (IPTC 10395).
- Well Placement Optimization Using GIS (from 2005 ESRI International User Conference Proceedings
MRC wells typically have two or more laterals drilled horizontally from a single wellbore. Saudi Aramco had previously placed such wells in the low-permeability Shaybah field and more recently in the Haradh area of Ghawar (Haradh II increment). The ANDR-524 was the first MRC well targeting Ghawar's higher-quality rock in the north. The goal was to tap into multiple reservoirs layers simultaneously with the capability of shutting off individual laterals as they became watered out. According to the above articles, this was an area that (in 2005 or so) was seemingly on the front lines in 'Ain Dar for maximizing oil extraction from thinned oil layers before of the advancing water made it less accessible. The latter two articles included oil thickness plots which indicate the depletion state of the reservoir in the vicinity of the location of the new MRC well. In Water Under the Gas Cap in Ain Dar, I showed how Google Earth could be used to geo-locate ANDR-524 and these oil layer thickness diagrams. After pinpointing the exact location of ANDR-1, as luck would have it, I realized that it lies within area covered by the oil thickness plot from the ESRI article.
Shown below is an interactive view of a 25 sq. km area near ANDR-1 obtained using Google Earth. Mouseover the image to show exact wellhead locations, and then click on image to show the oil layer thickess contours. The date of the image is May 2006.
| Figure 8. Section of Ghawar near 'Ain Dar discovery well. Mouseover show actual well locations visible in May 2006.Click on image to view oil thickness plot superimposed on the satellite imagery. Labeled contours correspond to the top of the Arab-D reservoir in feet below sea level, and red trace indicates boundary of gas cap located at the crest of 'Ain Dar. Click here to view the well area in Google Maps. |
The 2006 image above shows mostly weathered well sites along with two newer wells. By comparing with the archival 2003 image, small changes were observed for seven wells similar to those noted for ANDR-1 above. Wells drilled prior to 2003 were at 1 km spacing, and from looking at the well layout in the overlay (click on image), they would seem to be vertical wells. New wells, including ANDR-524, are drilled horizontally with possible multilaterals. Thus, the location of the wellhead is less determinant of what part of the field is being drained by it. The laterals of ANDR-524 are targeting unswept oil to the east. At the top of the overlay, there is an indication of a bi-lateral well with one arm going after oil near ANDR-1, although the location of the northern-most new wellhead is a few hundred meters distant. The other new well is probably targeting the thinning oil column to the east similar to ANDR-524.
There was no scale for the oil thickness map provided in the ESRI article, but it is similar in color scheme to oil-thickness diagrams published elsewhere by Saudi Aramco engineers. There are 7-8 distinct color bands in the full image. Assuming a 200 ft. full thickness, this would give ~30 feet per division. Based on this estimate, the Arab-D reservoir where penetrated by 'Ain Dar #1 is crudely estimated to have 50-80 feet of oil left. Unfortunately, it is not certain that this diagram accurately reflects the state of the reservoir just before ANDR-524 was drilled. However, the ESRI article describes the use of a software program with a specific purpose: assist in the placing of a new well by combining geophysical data and existing well placement data in a Geographic Informtion System. The program seems to rely on current data and does not have predictive capability (e.g. simulating the depletion state some years in the future).
The task of planning a new well in a field with a high density of wells, complex geological features, multiple formation targets and advancing flood front or expanding gas cap is extremely challenging.
...
The existing well locations, flood front/oil column maps and reservoir structure information can now be used as an effective guide to place new well locations.
Finally, the state of the reservoir near ANDR-524 as suggested by the diagram is consistent with this description from the first of the three referenced articles:
The well is placed at the top of the target reservoir in a partially flooded area of the field and is planned to produce dry oil while the surrounding vertical wells are producing at water cuts in the range of 32-62%.
...
Following the successful operation of this MRC well, additional complex wells are planned to be drilled to further develop the field and keep water-cut at the current level of 42%.
ANDR-1 Production History
The collective Saudi Aramco articles provide the following data -- initial rate: 15,600 bpd; 2008 rate: 2100 bpd; cumulative: 152 million barrels; first water produced in 1999. Looking at the cumulative production profile below, the well was not produced at the reportedly high initial rate for long. Production did ramp up about the time that powered water injection was implemented in the field (gas was injected before this to maintain pressure, followed by gravity-fed water injection).
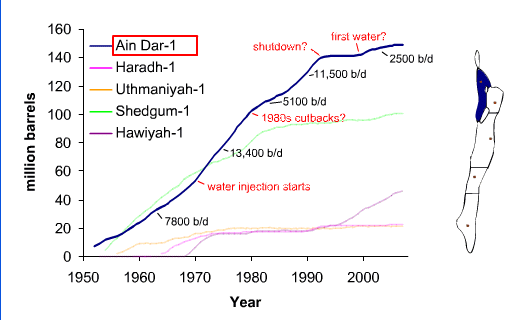
Figure 9. 'Ain Dar-1 cumulative production.
The production dropoff around 1980 is conceivably explained by the overall cut in North Ghawar production about that time, as seen by the combined 'Ain Dar/Shedgum production history (provided by Nansen Saleri, then of Saudi Aramco, in 2004) shown below. However, the nearly complete cessation of production in the early 1990s does not correlate with what was going on in the overall field. A more likely explanation than the one provided in the articles is that water hit the well in the early 1990s, and then it was shut down until more wells in drier areas could be put in so as to lessen the load on the GOSPs which, as revealed by Saudi Aramco, were processing all the water they could handle. The well was flowing again by 1999, although the rate has been decreasing somewhat since.
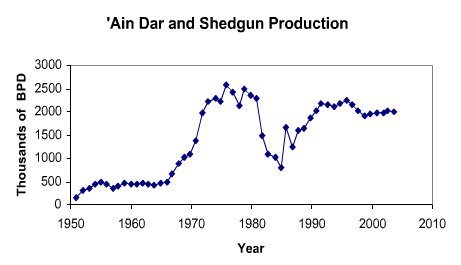
Figure 10. 'Ain Dar/Shedgum daily oil production history
In summary, this well has had a remarkable, if somewhat erratic, production history. It clearly has its best days behind it, though, as the water level will keep rising until nothing but water flows. If it is not capped and redrilled as a horizontal, it will either be shutdown or throttled way back as newer horizontal wells drain the oil from its vicinity.
Haradh-1
The discovery well in Haradh was the second well to be drilled in Ghawar, and seemed to be quite productive initially (6,400 bbl/d). However, due to the distance to the existing production facilities at Abqaiq, HRDH-1 was not brought online until the early 1960s. A few dilineation wells had been drilled by then, as seven wells appear on the 1959 Haradh map. The well count increased to 12 by 1971, and then to at least 65 over the next twenty years. Haradh was completely shut off for most of the 1980s, and it wasn't until the first of three redevelopment increments (Haradh-I) was completed in 1996 that Haradh contributed much to Ghawar's total flow. This first increment was first completed with vertical wells and water injectors, but the water flood proved to be very erratic and many wells quickly watered out. Haradh is hightly fractured, and even though vertical wells rarely cut through them, these fractures, in combination with Super-k intervals, created conduits by which water could prematurely flow from injectors to wells, bypassing the oil. Super-k intervals are relatively thin sections of reservoir rock (as little as a few feet) which contribute disproportionally to the overall flow of the well. These are handy when flowing oil, but much less so when flowing water.
The vertical wells of Haradh-I were later supplemented with horizontal wells, and the plan for the Haradh-II increment called for all horizontal producers and injectors. 3-D seismic mapping of Haradh was performed to identify major fractures such that horizontal wells could be directed so as to avoid them. Problems still arose, however. During the drilling of several wells, lost circulation of drilling fluid was reported. Normally, drilling fluid (or mud) is pumped down to the drill head and returns to the surface carrying debris. If a fracture or Super-k interval is penetrated by the drilling, as much as 100% of the drilling fluid (or mud) does not get recirculated but instead gets pumped into the reservoir. This adds considerably to the time and expense of drilling the well, but also indicates a significant probability for early water breakthrough depending on where the loss is occuring and the distance from the water injectors. Somewhat after Haradh-II was brought online in 2003, a few MRC wells were added to the mix. The advantage of these was that individual laterals could be shut off if they started flowing water. This trend culminated in the decision to develop the final increment, Haradh-III, using only MRC producers.
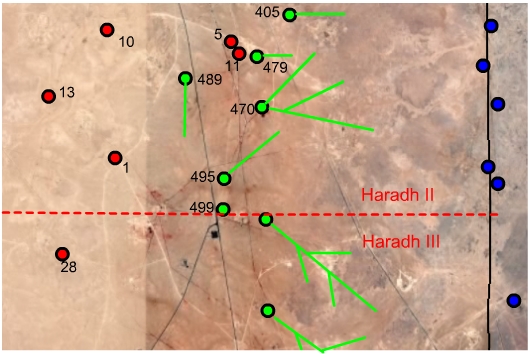
The Haradh discovery well is located in the center of the "heel" and on the southern edge of what would become the Haradh-II increment, as shown in the figure below. The base image shows the locations of wells prior to the 1996 redevelopment. Mouseover reveals the locations of Haradh-II wells trajectories of the laterals. Mouseclick shows the locations of subsequent drilling in the area (caveat: the lower third of the image dates to 2004, whereas the upper two thirds dates to 2006). Note the added wells between HRDH-1 (discovery well) and the water injectors to the east. A closeup look at HRDH-1 isn't particularly informative.
| Figure 11. Google Earth view for central Haradh showing locations of early wells. Mouseover shows Haradh-II development. Click to show additions visible in 2006. |
It is likely that HRDH-1 production was deemed inconsequential or perhaps counterproductive to the newer production plans, and this likely became more the case after Haradh-II was completed.
Any delineation between Haradh-II and Haradh-III oil is artificial, of course. The bottomhole pressure for HRDH-1 will be affected by downdip wells corresponding to both increments. Shown in the image below is a closer view of HRDH-1 relative to the newer wells. One of the Haradh-II wells, HRDH-489 the well closest to HRDH-1, experienced 100% circulation loss during drilling, but the later drilling of the MRC well HRDH-470 seemed to go more smoothly. As for Haradh_III, Saudi Aramco published some pressure measurements taken when the new injectors were completed (prior to production; see Figure 5 in this paper). The low pressure zone at the top of the figure corresponds to the area of the field encompassing wells HRDH-1, HRDH-13, and HRDH-28. A scale for the pressure gradations was not provided, unfortunately.
|
| Figure 12. Closeup Google Earth view of wells near HRDH-1 (Haradh discovery well). |
HRDH-1 Production History
As the plot below indicates, most of the cumulative production of HRDH-1 occured prior to the shutdown in the 1980s, despite the absence of water injection during those early years. Although the restarted production was boosted with acid stimulation up to 6700 bbl/d in 1990, this spurt only lasted a couple of years for reasons unreported. While it probably has the capability of flowing 2300 bbl/day as reported, this doesn't appear to have been the case over the last few years.
Figure 12. Haradh-1 cumulative production.
'Uthmaniyah-1
One close Google Earth look at the 'Uthmaniyah discovery well reveals the current status rather clearly; it became a non-performing asset sometime prior to 2006.
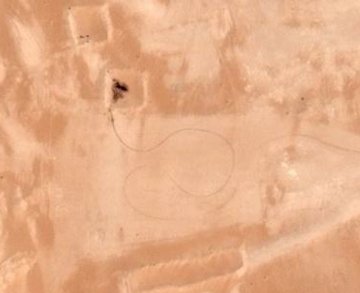 |
| Figure 13. The ghost well that is UTMN-1 |
As is the case with ANDR-1, there is some information as to the status of the reservoir in the vicinity of UTMN-1. Shown below is the area of the field near this well. Mouseover shows the oil layer thickness values reported in a figure from this paper but which can also be found here. This discovery well is clearly out to sea. The darker blue and green areas have 0-30 feet and > 120 feet of oil, respectively, remaining from over 200 feet initially. Click on the graphic to show the coutours for the top of the Arab-D reservoir. UTMN-1 is about half way up to the local crest for the east ridge, so it is not that surprising that is has watered out. It is amusing that the author avoids saying this outright, however.
| Figure 14. Google Earth view showing wells near UTMN-1. Red and green placemarks denote older and newer wells respectively, green diamonds denote drilling rigs, and blue placemarks denote water injectors. Mouseover shows recent oil thickness as described in text. Click to show elevation contours for Arab-D reservoir. |
UTMN-1 Production History
It is claimed that UTMN-1 produced at 11,300 bbl/day in its first year, and this is somewhat consistent with the reported cumulative production profile shown below. However, the well seemed to be offline in the early 1960s, and then was again rather useless by 1975 as the waterflood had overrun it. Dates were not given for the reported attempt to shut off the water-producing sections of the well or its unreported abandonment. Perhaps a good well, but in an unfortunate location.
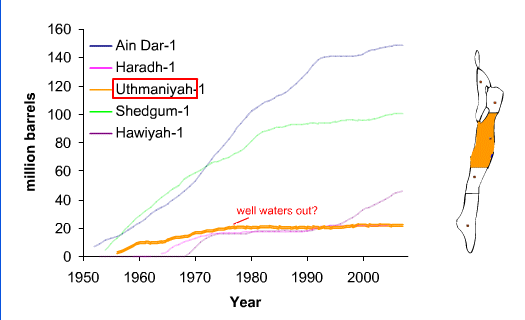
Figure 15. 'Uthmaniyah-1 cumulative production.
Shedgum-1
The Shedgum discovery well is located well updip of the water injectors on the east flank, but as Shedgum has been produced heavily for a long time, SDGM-1 is seeing higher water. Although the Saudi Aramco articles mention a recent project to drill a horizontal sidetrack of the well, the 2006 Google Earth/Maps view does not show recent evidence of this. There is a 2009 Digital Globe image of the area available, but GE hasn't incorporated the high resolution version; the low-res version shows no obvious changes around the well.
As was the case for ANDR-1, SDGM-1 is located in an area for which an oil thickness plot was published (IPTC 10395). As shown in the figure below (click on image), water clearly has reached the discovery well. It does seem to be in a better situation than ANDR-1, so it is interesting that it has been redrilled while the latter has not.
| Figure 16. Section of Ghawar near the Shedgum discovery well. Mouseover shows nearby oil (red) and gas (yellow) well locations. Click on image to show ~2005 oil thickness overlay. Click here to view the well area in Google Maps. |
SDGM-1 Production History
This well actually started its life with a higher production rate than ANDR-1, although it slowly declined (possibly along with the pressure in the field). The rejuvenation just prior to 1980 followed the acid treatment by a few years, and powered water injection was started before then as well. Other maintenance didn't seem to have much of an effect, though. Any connection to the overall Shedgum production is also not obvious.
If the most recent resurgence is due to the horizontal sidetrack, this would suggest this was done early in the current decade. 3700 barrels per day seems a bit high though.
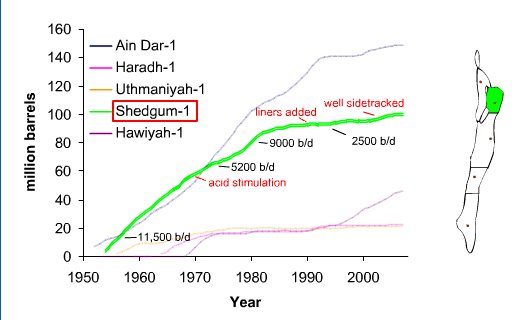
Figure 17. Shedgum-1 cumulative production.
Hawiyah-1
Of all of the Ghawar discovery wells, Hawiyah-1 seems best positioned for sustained production. It is located near the center of a section of Ghawar which should a lot of oil left. Very little data on the production history or current status of Hawiyah has been made available. However, the following was reported in 2005:
Pre-mature water injection breakthrough into the mid-field areas, through high permeability zones and fractures, caused some wells to die, leaving trapped oil behind and affecting reservoir sweep efficiency. The field is being developed by drilling highly deviated and true horizontal wells. Many of these wells died right after drilling or after a short period of production due to excessive water production from high flow intervals. Water isolation in such wells is both a challenge and expensive. The challenges include understanding the mechanism of water movement in the reservoir horizontally and vertically that might enable communication of the water from the lower zones to the upper zones through the reservoir after the water zone isolation in the well bore.
Similar to the case for Haradh, the Google Earth coverage of Hawiyah is a patchwork of 2004 and 2006 imagery. HWYH-1 is located in the north-center of Hawiyah, somewhat closer to the west flank than the east, in an area photographed in 2004. As shown below, four new wells located about 1 mile east of HWYH-1 were drilled between 2004 and 2006. These newer wells are midway between the injector lines, and it is curious that new wells are being drilled there at this point in the production history for Hawiyah. Of course, horizontal trajectories could be pointing in any direction from the wellheads with extents of several kilometers.
| Figure 18. Section of Ghawar near Hawiyah discovery well as photographed in 2004. Mouseover shows oil reveals 2006 imagery covering two-thirds of the view. Click here to view the well area in Google Maps. |
HWYH-1 Production History
It was reported that HWYH-1 initially produced 4,800 bpd and then 7600 bpd after acid stimulation in 1977. However, the shown profile below is more consistent with these values reversed.
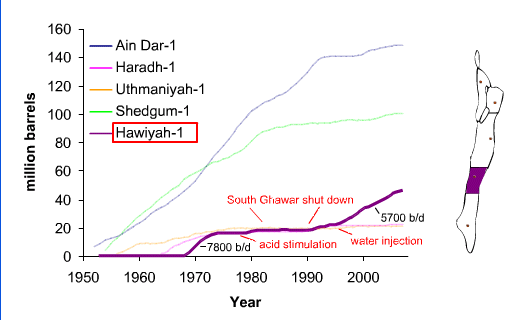
Figure 19. Hawiyah-1 cumulative production.
Also, the average rate over the last decade was higher (5700 bbl/d) than is reported for the current (4600 bbl/d). The improvements to the water injection for Hawiyah during the 1990s perhaps accounts for most of the increased flow from HWYH-1.
Hawiyah-1: A Natural Horizontal Well
Given the lower porosity and permeability values for southern Ghawar in comparison to the north, both the Hawiyah and Haradh discovery wells had better flow rates than one would predict. As for HWYH-1, it turns out that it is no ordinary well, but rather a Super-k well.
In 2000, a study by Meyer et. al. on Super-k wells in the Hawiyah area of Ghawar was published:
Stratigraphic and Petrophysical Characteristics of Cored Arab-D "Super-k Intervals, Hawiyah Area, Ghawar Field, Saudi Arabia"

Franz O. Meyer, Rex C. Price, and Saleh M. Al Raimi

GeoArabia, Vol. 5, No. #3, 2000, pp. 355-384.
This paper is not widely available, but several figures from it and discussion thereof are available in the doctoral dissertation of Joe Voelker (starting on page 111). A Super-k well is defined as a well which intersects an interval (rock layer) having a productivity/injectivity of 500 barrels per day per foot. Based on flowmeter measurements, 88 wells (both producers and injectors) were identified as Super-k, and 8 of these wells were cored for further analysis. One of these, identified as HWYH-C in the paper, is unveiled here as Hawiyah-1. The Super-k behavior of this well is rather extreme:
Ninety-one percent of the oil produced (1,161.8 bf/d/ft) is from a section measuring 15 ft in HWYH-C. Super-k flow (820 bf/d/ft) is from the bottom six feet, and high flow (342 bf/d/ft) also occurs from the top nine feet.
From these numbers, it would seem that we have some actual flow measurements that we can compare with those reported in the "Mag Five" articles. Unfortunately, the numbers from the Meyer paper don't quite add up. Consider:
1,161.8 bbl/day/ft times 15 ft gives 17,430 bbl/day
However, if we compute the flow from the six and nine foot sections separately (and then sum), we get:
820 bbl/day/ft times 6 ft plus 342 bbl/day/ft times 9 ft = 7998 bbl/day
Either the average rate of 1,161.8 bbl/day/ft from the 15 ft. section is correct, or the rates for the six and nine foot sections are -- but not both. Suspiciously, 820 plus 342 roughly equals 1161.8, so perhaps (astonishingly) the authors just added the two averages to get a new one. If is the case, then the total flow for the 15 ft section would really be 7998 b/d, or an average of 533 b/d/ft across the entire 15 ft. section. This is consistent with the reported production history of HWYH-1; dividing by .91 (the fraction of oil from the 15 ft. section) gives 8789 bbl/day for the entire well. In any case, this well is capable of higher production than is currently the case, and as of the 2000 publication date for the paper, was not producing significant water.
It is worth reflecting on this amazing phenomenon; a vertical well is drilled through ~200 feet of reservoir, but 56% of the oil flows out of a five foot slab and another 35% flows from an adjacent nine feet. But the permeabilities of the rock these intervals are not high enough to support these flows, so something else is going on.
Core plug analysis throughout the 15-foot thick flow zone indicates that good but not exceptionally high permeability (average 540 md) occurs in the predominantly grainstone interval. Furthermore, the average permeability is higher in the high-flow zone (612 md) than it is in the super-k flow interval (344 md). Fractures readily explain this discrepancy because they override the matrix permeability at the base of the super-k interval. Supporting evidence includes observed fractures in the recovered core, an underlying enterval of core rubble within the basal part of the super-k flow interval, and two feet of missing core immediately beneath it.
What does this flow look like? In his dissertation, Joe Voelker found that a linear flow model is better supported by the data than a radial flow model. Thus, it is perhaps best to think of a Super-k well as a natural horizontal well, where the Super-k interval acts as the (perforated) horizontal well bore. This is very adventageous when this oil flows into this interval (or fracture) from the immediate surroundings, but it is rather disasterous when water flows in. If the latter occurs, isolating the interval (blocking the flow) can dramatically lower the water cut, but the result is a much reduced oil rate. In many such cases, Saudi Aramco has chosen to produce the Super-k flow and deal with the extra water as the lesser of two evils. The Hawiyah discovery well seems to have avoided this fate so far, as the Super-k interval is in the upper layers of the reservoir -- although a fracture could eventually produce water from lower layers as the flood front advances.
Conclusion
A closer look at the continuing saga of the five Ghawar discovery wells provides an interesting glimpse at the history and current state of the field. Ghawar is truly an outlier, even amongst supergiant fields. Its full story, with warts and all, is much more interesting than what seems to squeeze out of the Saudi Aramco PR department. But even a field as unique as Ghawar has a finite supply of oil, and most of the original wells are reaching the limit of their usefulness. Perhaps not coincidentally, Ghawar might be getting a respite. Saudi oil minister Al-Naimi has indicated that Ghawar output will be cut back as Khurais is brought online in a few weeks.
Credits
- http://www.saudiaramco.com. Click Newsroom/Publications/Dimensions
- "Ghawar Oil Field, Saudi Arabia", Bulletin of the American Association of Petroleum Geologists, Vol 43, No. 2 (February, 1959), pp 434-454
- Water Management in North 'Ain Dar, Saudi Arabia (SPE 93439)
- (Optimizing Maximum-Reservoir-Contact wells: Application to Saudi Arabian Reservoirs (IPTC 10395))
- Well Placement Optimization Using GIS (2005 ESRI International User Conference Proceedings)
- Fifty-Year Crude Oil Supply Scenarios: Saudi Aramco’s Perspective
- First Lateral-Flow-Controlled Maximum Reservoir Contact (MRC) Well in Saudi Arabia: Drilling & Completion: Challenges & Achievements: Case Study (SPE 87959)
- A Probability Approach to Development of a Large Carbonate Reservoir with Natural Fractures and Stratiform Super-Permeabilities (SPE 81433)
- Maximum Reservoir Contact Wells: A new Generation of Wells for Developing Tight Reservoir Facies (Salam P. Salamy, SPE Distinguished Lecturer Series Program 2004 -2005)
- Reservoir Monitoring with Permanent Borehole Seismic Sensors
- Inflatable Enables Successful Water Shutoff in High Angle Wellbores in Ghawar Field
- A Reservoir Characterization of Arab-D Super-K (Joe Voelker Thesis, 2004)
- Stratigraphic and Petrophysical Characteristics of Cored Arab-D "Super-k Intervals, Hawiyah Area, Ghawar Field, Saudi Arabia" Franz O. Meyer, Rex C. Price, and Saleh M. Al Raimi GeoArabia, Vol. 5, No. #3, 2000, pp. 355-384.
Contact
- Content: editors at theoildrum dot com
- Tech support: support at theoildrum dot com
License

This work is licensed under a Creative Commons Attribution-Share Alike 3.0 United States License.
Fascinating work! but it'll take me at least a week to fully digest.
Joules,
Did you try deconvolving those cumulative graphs to yearly production histories? The rates should show the story of why North Ghawar is so important, and by eye the gradients of the cumulative plots paints an interesting story if correlated to Aramco spare capacity and price.
I unstacked them, if that's what you mean by deconvolving (really just subtracting). To get the production rate from the cumulative, you take the derivative. However, the starting graphic wasn't that good, and the errors expand after awhile. I did note slopes where it was fairly clear.
Excellent Joules-
When do the cumulatives end??
One of the great mysteries is starting to be answered as it is apparent from the family of cumulative curves that they have begun pulling Hawiyah hard to make the market.
Thanks
FF
If he does mean deconvolving, then it would be a deconvolution of the yearly production with an exponential decline function. The result would give us an incremental yearly reserve growth function.
I argue that we should be doing more of these convolution based analyses otherwise we can never separate the decline from the growth factors.
Reserve growth is typically a hyperbolic 1/(1+1/t) factor while exponential decline goes as e-t. The combination of these two is not something easily expressable in closed form.
Yep, something like that. Since these are single wells, we have a good idea how they will naturally behave.
However the thing I'm interested in is where the slow downs/cuts in production hit. If Aramco decide to produce a million less barrels to force prices up - where are those cuts felt?
If they've been cutting back on North Ghawar then those high quality fields might have a long life left. However if they don't then they have to basically be empty - and with them much of the production capacity.
However as Joules says, reversing out that much from cumulative numbers tends to push the noise through the roof.
In one of the SPE papers on water management in north Uthmaniyah, Saudi Aramco listed one of the remedies as rotating a well out of production. I know they also do that for wells in Safaniyah. This might have been going on for some of the wells here, but it's hard to tell. ANDR-1 seems to have been shut off in the 90s, but it didn't correlate with an overall decrease from 'Ain Dar/Shedgum. That's why I think it was a water issue there.
I'm skeptical of depletion modeling for Ghawar as a whole, and certainly for individual wells. There are too many other things going on. Different bottom-hole pressures, valves possible closed up top, and increasing water cuts.
My usual take is that you acquire a distribution of responses, statistically aggregate these, and then use a probability model to come up with a macro behavior.
This is referred to a stochastic model. This approach works in many other engineering and science domains but for some reason, is historically not done here.
Dunno why this is, but Steve_Piper yesterday said [regarding most geologists] "They are by training data-oriented empiricists who rely very little on models."
http://www.theoildrum.com/node/5460#comment-507710
I agree that concentrating on any one field is deadly inaccurate, yet the aggregate stochastic model tells us what we want to know.
Stochastic approaches work when you have a statistically useful set. If you average enough fields, you might come up with a model that you can apply to similar large sets. It is possible that the random "above ground factors" cancel out, and the remaining behavior is related to geology and normal production logistics. But this behavior hardly be useful for predicting a single field (or well).
Stochastic approaches are being used to come up with better estimates for porosity and permeability in heterogeneous reservoirs such as the Arab-D carbonate. Kringing (interpolating) between widely spaced wells and 3D seismic still leaves much to be desired. You still can't predict what an individual well will do, but it might help in deciding where to put it (i.e. place your bets). You can search around and find a few examples such as:
http://www.spe.org/elibrary/servlet/spepreview?id=SPE-104496-MS&speCommo...
Stochastic both in the geospatial and the temporal domains.
Web -- I suppose I'm not one of those empiricist geologists. I've been pretty much a development/reservoir geologist my whole career. Virtually all my work has focused on stochastic analysis. I suppose this is the distinction between those of us who work production histories vs. those without hard data speculating of on the "what if" possibilities out there. If anything I tend to ignore what the "book" says about theoretical production models. But when you have hard data refuting those models it's easy to do.
And thus we are back to the primary problem with the KSA numbers. IMO even if we just had the change in water cut over time for each well we could make much more reliable estimate of future production levels then any theoretical reservoir model. Of course, there's much more data then water cut to be mined but at least it would give a glimpse into the current state of the system.
I just don't see anyone talk about this stuff with the same terminology as many of the other applied mathematicians in other discipline.
Further, I see a real distinction between using models to try to empirically fit and thus make projections on availability or viability (i.e. via kriging) AND that of just basic understanding. Of the latter, no one is making any fundamental kind of effort. I have explored about ten different spatial and temporal behaviors that could use a basic explanation that otherwise get completely glossed over in every oil text that I have come across. This seems to me to be an incredible oversight -- coming from a basic physics background, the fundamental understanding was always the first priority. I just don't get why this occurs in this field.
If there are awards for 'Best Post of the Year' then my vote goes to this. Wow! Gold Star. Innovative extraction of useable quality information from open sources, super analysis, excellent use of graphics and photo imagery.
Very nice work. My compliments.
(The description of Figure 8 may need a touch up edit for the mouse over vs. click functions)
Thanks. (Fixed, I think)
LOL
Best sentence of the year !
One thing I get from reading your report is that the Saudi's are working hard to produce the oil they are producing. Regardless of the claims its obvious that its taken a lot of engineering to produce Ghawar its not been a walk in the park.
It seems each well has seen a significant amount of investment and are produced as long as possible. In many of the cases one has to wonder if this well is so troublesome why not just shut it in till later you have plenty of oil right ?
Also although your not bringing it out in this article one of the big problems with Ghawar is a shortage of above ground water handling capacity. Your effectively implying it but as far as I know they simply don't have the ability to handle a large number of high water cut wells at Ghawar.
I bring it up because I think its playing a large role in Ghawar production level s right now. As high water cut wells are shut off as the overwhelm the current water handling capacity production out of Ghawar will slow. At some point Ghawar at great cost will need to be transformed to run in stripper well mode. And at best this probably will simply keep production steady at some fairly low rate say 1-2mbd for several decades. One could think that overall production would probably actually drop lower for a while until water handling capacity was expanded to deal with high water cuts.
Now this opens up a interesting perspective into Saudi oil production. Given the social and economic situation in Saudi Arabia its really difficult to see them smoothly transition into a very mature producer like the US. In fact the way they are producing Ghawar is consistent with the political situation they are deferring the massive investment needed for mature production until after its clear that the political situation is stable. Given the export land model one has to wonder just like the Saudi's probably are what the future holds.
Here is something on water issues that ace pointed me to:
http://arabianoilandgas.com/article-5607-tech_focus_saudi_aramco_water_s...
we can take this all the way to the bottom of the well. water increases the pressure gradient within the wellbore because 1) water is more dense than oil and 2) three component flow(oil, water and gas) increases friction.
if aramco hasn't already figured it out, they certainly will. handling large volumes of water is a routine oilfield operation.
Yes but at what production rate for oil ?
The problem is not that the Saudi's can't produce their fields at high water cut but will the production rate be high enough to ensure the stability of the Kingdom in its present form ?
Given the political problems in the region when oil was plentiful I wonder whats going to happen when the region finally has to admit to being in decline.
Interesting article :)
You can look at it both ways they obviously expect to have a water problem and given the size of a field like Ghawar I actually agree that a traditional approach is probably not going to work well. This looks like a much better approach.
However I still don't see a smooth transition although this has a much higher probability of allowing them to do a better job bringing high water cut wells back online.
They have yet another problem thats more difficult to solve just looking at this it looks like it a move to a more traditional five spot style producer injector solution.
http://www.answers.com/topic/five-spot-well-pattern
However they are still limited by the overall amount of water they can inject.
I think its 5 million barrels a day or so right now.
http://www.energybulletin.net/node/1269
The point is there is a limit to how much water they can inject into the field and if your producing wells at a 90% water cut with say 10 mbd water injection that your production is 1mbd. If its 5 then 500kbd if this injection.
Even if scheme works I'd be surprised if they can get production much over 1mbd.
Of course the fact that they are working on solving the problem that they must solve has a lot of implications.
your 1st link takes me to info on a 5 spot bolt pattern on f150 wheel's.
glen morton's article states 7 million bpd water injection, for whatever that is worth.
and i don't dispute that ghawar will decline and will probably never see 5 million bpd again, ever, but will it be a gypsy moth ?
http://en.wikipedia.org/wiki/The_Gypsy_Moths
(the gypsy moth played by bert lancaster thought he could fly with a cape)
Are you sure ?
It's not just in anticipation of future water issues. In both Abqaiq and Hawiyah, they have previously tested multiphase pumps to deal with the low pressure problem.
If you want to know the truth about Saudi Arabia follow the water :)
JoulesBurn ---
Thanks for the superb work.
Being only slightly literate in the subject, it will take some time and effort.
Awesome post! One of the few very long one that I seriously felt strongly compelled to read all of. I concur with the sentiment that this may be post of the year. Heck, this should be a basis for a documentary... or an action movie!
...well, that probably won't happen until hell freezes over, so we've got a good shot sometime in the recovery after the peak.
but one note:
"cumulative" sounds like you mean all the OIL PRODUCED UP UNTIL A CERTAIN POINT. I mean not the rate, but the total extracted. If I read your graphs that way, then things are about 3 orders of magnitude off and obviously... 'millions' of barrels per day is a measure of rate.
The plots are for cumulative production as you have defined it. Remember that we are talking about individual wells. For example, ANDR-1 has averaged something over 7000 barrels per day (just divide the 150 million barrels cumulative by the number of years). To get the rate at any point in time in barrels/day, look at the gradient (slope) of the curve, taking the (delta)production divided by (delta)time in days.
Smoothed a bit. Not too hard to see a bell curve in that
Memmel -- re: your 5-spot pattern: was someone indicating this approach was being used at Ghawar? Probably just a speculation perhaps. From what I’ve read regarding fractures in the reservoirs I doubt this would work well. Such patterns work best when there ‘s a uniform permeability distribution in the rock. There is one phenomenon that is the absolute killer when it comes to water flooding/pressure maintenance: channeling. In the case of a carbonate reservoir with a significant fracture system it’s easy to visualize. The injected water enters a fracture which also extends to a producing well. The fracture perm is much higher then the matrix perm and thus the water quickly bypasses the oil saturated matrix and heads straight to the producer. This even happens in sandstone reservoirs. I once saw an operator inject over 300,000 bbl of water and only recover 3000 bo from the offset producers. I don’t think the oil cut was ever better then a few percent. Quickly the water cut reached 100% but he kept injecting thinking that the water would eventually start pushing the oil out. That is the common picture you’ll see in all reservoir engineering texts. In the real world it seldom ever works just like that.
Not knowing the details there could be much oil in Ghawar that has been stranded due to channeling. There are some techniques to try to kill the channels but they almost always produce minimal results. This is one reason I tend to be skeptical of forward projections in such reservoirs. The production plot may be a nice predictable line at one point in time. But if the water level reaches a fracture that’s connected to a producer the water cut of that well could jump to nearly 100% in a matter of months.
Hmm the problem with Ghawar is the way they are flooding the field now in my opinion is not scalable to stripping at 90% water cut.
The five spot game works because your re-injecting the water. No way can you pump enough water into Ghawar to get good stripper wells using any other method.
Correct me if I'm wrong here.
Given what you just said going to stripper wells in Ghawar is probably not going to happen or if it does water handling issues will result in a very low production rate.
Basically for all intents and purposes taking what you just said Ghawar is toast as a high production rate oil field once the water hits.
My opinion then is that Ghawar production should drop off rapidly and that it will be a very slow process to bring the field back up under high water cut conditions. And very expensive.
And last but not least Ghawar has really been produced with a lot of natural complex horizontal wells because of the fracturing so its not quite right to treat it as a conventional tighter vertically drilled reservoir. Even the old horizontal wells because of the fracture network where producing better than the most modern multi branched horizontal well. ( High tech low tech )
This suggests Ghawars production profile will follow the decline pattern seen in our modern wells very high flow rates then bang the water hits.
I hope one day we get the real numbers on Ghawars last days I bet the Saudi's are facing some incredible decline rates. Lots of juicy intrigue inside the Kingdom.
Maybe later someone high up will spill the beans.
I can't say you're wrong with any certainty memmel given the lack of details we have to work with. But if I've read correctly elsewhere the water "has hit". But even that phrase is full of uncertainty. I saw the KSA offer that the water cut was around 25%. But that really tells us nothing. Is it a 25% c/w with each well? Is it a 25% w/c when you look at the entire flow stream? In other words are some wells doing a 3% w/c with others doing an 85% w/c? So many possibilities it's rather pointless to speculate IMO.
So let's just look at a generalized scenario. In a strong bottom water drive reservoir with a uniform distribution of permeability a five-spot patterns does zero to help recovery. You just pump all the water you can into the down dip water leg. Now the other extreme: zero water drive. No force to drive the oil out except the original pressure which depletes very quickly. Then throw in a variable perm pattern. In the case a five-spot is your only hope to make decent recovery. Now one more scenario: same as just above but throw in some significant natural fractural system. Some of the 5-spots work well but others fail immediately when the injected water is transported to the producers via the fractures with virtually no oil sweep.
From what I can tell different parts of Ghawar's reservoirs, to varying degrees, fall somewhere between these extremes. Even with all the data at hand I'm sure the KSA gets hit with surprises along the way...some good and others not so good. Thus we are back to dealing with the just the gross (and often fudged) numbers to base expectations upon.
Extract data from cumulative graph using photoshop grids, plug into excel spreadsheet, differentiate, smooth a little.
As Grinspoon would say "Dead Cat three times".
Going along with my post above and your post I'm think the smoking gun about the true situation at Ghawar has been around for almost 70 years. Its the fact that they could not keep the pressure up.
Given its well documented to be highly fractured and even drilling vertical wells into such a reservoir will result in fantastic flow rates at first.
But then you have a problem most of the oil is not actually coming out of the matrix but out of the fractured areas pressure should drop like a rock.
This is exactly what happened very early in the fields life thus the water injection.
Whats important is that most of Ghawar has been under the super straw effect from very early in the fields life even before we really developed the advanced technology.
Technical fixed first to deal with pressure then later water work for a bit but I'm pretty sure that the field will now show a fast decline thats not really recoverable because its not a problem of water in a highly fractured limestone matrix. I just don't see most of the remaining oil in the matrix mobilizing.
You can get some of it with advanced drilling but your really just mopping up and it won't be at high flow rates.
We will see but I suspect that.
1.) Ghawar has started into decline at some point in the last three years.
2.) This decline will be steep and by steep I mean 30% annual decline rates are quite possible.
And given the way things have gone so far we can expect if this is true then our leaders will do everything they can to cover it up and keep pushing the need for people to spend so I'm interested to watch how all of this unfolds.
Per this in depth analysis, I think we can easily see that Ghawar is an aging Giant headed for a potential sharp decline once the water level rises high enough in the not too distant future. However, in spite of the close analysis of the Saudi oil fields, a bigger story might be the projected decline of the Russian oil fields in the next 2-3 years. Their oil fields were abandoned in the early 80's due to a lack of pressure (from too fast an extraction), but were later tapped using horizontal drilling and fracing. Those same fields are now pumping out some 9.4 mbd, and represent the largest contribution to non-Opec oil. Non-Opec oil is already in decline, but once Russian extraction drops to 3-4 mbd, it will really be cause for concern, possibly panic.
Right now the more billionaires than any other city in the world, Moscow, are crying the blues for 75 dollars a barrel oil because of the cost of exploration. However, word is they aren't reinvesting oil profits for exploration, instead opting for an oppulent lifestyle, while crocodile tears fall for more money per barrel.
Now, what if the Russian sharp oil decline occurs simultaneous with a Saudi oil decline? That would mean a drop of 7-9 mbd, while the world will be demanding ever more oil in its post recession, economic expansion. The difference between what is available and what can be brought to market could be 10-14 mbd, raising the price of oil to well over 500 dollars per barrel and the world economy will plummet into a full on depression.
Am I right or am I wrong here? Please, someone stick a fork in me.
There certainly seem to be early signs of a Russian decline. Simultaneous Russian & Saudi decline? Now I would call that a fast collapse scenario.
Isn't 2-to-3 years also the timeline for Mexican oil exports to drop to negligible? I think it would be most inconsiderate if KSA, Russia, and Mexico all said "sorry, we can't produce more" at about the same time.
Didn't the Mayans say something about December 2012?
Ah, yes, the Mayans and the 2012 prophecy. Why does it seem like the closer we get to that date the shorter time seems to feel? You know that feeling as your car goes out of control and everything seems like its in slow motion, with some part of your mind saying, 'time is getting shorter'. Mexico, Russia and the Saudi's. No, not 2011-2012. No, couldn't be.
Mayan aside its amazing how you can do all kinds of variants on the future of our society starting from different view points and you keep coming up with 2011-2012.
Its like impossible to get a different answer. Even simply looking at the US financial situation easily drops 2011-2012 out as TSHTF time.
Simple baby boomer demographics coupled with the current debt levels lands right there as the start of serious issues.
Heck even aggressive climate change projects tend to suggest serious problems by 2011-2012.
If you follow the arctic ice.
http://arctic.atmos.uiuc.edu/cryosphere/
All the multi-year ice is in serious trouble so we could well see the Arctic effectively ice free this year if so its quite reasonable that we could see new climatic conditions as early as 2011-2012 as we have effectively added a new ocean to the planet.
All kinds of not very good things seem to either begin growing large enough to be a issue or reach a sort of peak in 2011-2012.
Even the wackos get the same number :)
http://www.buzzle.com/editorials/9-2-2005-75965.asp
I'm not suggesting that these guys are anything but crazy but I think given that they are also super doomers focusing on trying to figure out the next bad thing that they tend to filter out the sort of consensus then adapt their methods to fit. A stop clock is right twice a day and the stopped clocks have overall picked this same time period. Maybe right answers for the wrong public reasons.
All the various fortune tellers and seers etc etc tend to as near as I can tell practice keen observation in order to adjust their predictions using a sham method to try and hit the truth.
The Mayan thing became big as its a sort of fake approach that happens to overlay with many peoples intuitive timeline of events developed from their own observations.
Underneath all of this baloney there are of course real observations that people are making that are causing them to not dismiss this junk out of hand.
And obviously these are people who might not have the best grasp of science. But the fact that the lunatic fringe is getting wound up with about the same timing as more scientific but still very extreme approaches is interesting and not something to ignore completely.
I have a hard time understanding how people think this way but I do think that you don't get this sort of growing lunatic fringe unless a lot of normal people are becoming very uneasy about the future. So its a sort of warped way to see how people who read The National Enquirer are feeling its a signal that the common man is now getting worried.
I guess I'm saying although its warped its actually a sort of valid data point if you understand where its coming from as its filtered from real data. In a very strange and crazy way but thats not for me to judge :)
I agree with your post Memmel, and must say I often agree with your posts. You tend to have a mix of oil geology and real world perspective I find interesting when perusing the posts on the Drum.
I am fascinated by the Mayan prophecy, and although its fun to correlate coming events with that now famous 12/21/2012 date, I do it with a non-lunacy, meaning I realize all too well that predictions are just that, predictions.
I was serious however regarding how much gelogic interest there is here regarding Saudi oil, versus Russian oil, which in my opinion is much more likely to precipitously drop its production in the next 2-3 years. And with very little of those billions going to new exploration in Russia, the drop to world supply could be very dramatic. But I'd be interested to get your take on it. I'd also like to see the kind of in depth analysis on Russian fields as we get on Ghawar, but that's up to the writers of course.
Chris
I agree about Russia, without the Soviet collapse Russian oil production would be in decline for some 20 years already.
Chris,
This is a participatory exercise. I'll even send you some starting Google Earth files, if you want. Not much, yet, but I know where a few biggies are. If you believe that Russian production will crash in the next couple of years, and have information that supports that, we'll make a guest post out of it.
Challenges in doing a similar analysis for Russia:
1) Saudi Aramco is formerly an American Co., most literature is in English.
2) Google Earth coverage of vast Russia is not great yet.
3) Less productive fields, with 10X wells, in the woods (as opposed to barren desert).
I don't have time enough to make all the Saudi info that I have accessible. I would really welcome someone else expanding this idea to other countries.
JB
I know some Russian (still learning in fact), so let me know if I could help.
Until recently the Russians have seemed to be fairly forthright in talking about their oil production. They have stated several times that production is starting to decline.
Its just recently that they have started blaming lack of investment as the problem.
Until they went and messed it up the Russians did have the support of the Western Oil Companies.
My understanding of complexity indicates that the information from Russia will get increasingly garbled as production declines. I'd not even call it misinformation since I think wee will see simply increasingly contradictory reports.
However most of the oil in Russia has been extracted in a manner similar to the US a large number of vertical wells with late use of water drive. I expect Russia decline to be similar to the US and follow HL fairly well. We had a fairly late technical boost thats lifted production over HL but its not clear Russia will really get this.
As far as I know the correct Shock Model and HL don't differ all that much for Russia.
I don't see Russian production crashing like Saudi Arabia. I'd love more information but I'd be surprised if Russian production deviates to much from the model.
Now thats for early decline above ground issues in Russia could readily cause a steeper decline curve esp as they move away from peak but thats not geology.
I think Export Land esp if the oil prices rise substantially is going to be more of an issue for Russia. We have already seen that the more money the Russians make the more they party and the less they invest in production.
A much bigger problem is Gazprom I've seen no indication that the projections for conventional North American NG production where wrong and they showed production levels effectively falling off a cliff. Just like I expect Russia to roughly follow the US in oil production I expect the same in NG production without the addition of UNG sources.
And last but not least this leaves Russia as one of the few remaining large oil exporters the geopolitics of this are interesting to say the least. Esp if you couple it with a high probability that they may be unable to meet European NG demand.
Thanks for the information on Russia Memmel. Very informative. I'm going to try to find the articles on Russia that piqued my concern & interest to link for Joules later today.
Thanks JB for your response. My understanding of a quick drop off of Russian oil in the next 2-3 years is from a recent article I read. I didn't bookmark it, but if and when I find it again I'll add another post here with the link. By the way, great information on Ghawar - always a lot of interest on that front. Just think Russia is an unfolding story as well, but now understand from items 1-3 the problems associated with developing a more in depth analysis. Great work, thanks, Chris.
Hmm I wonder how. I'd be interested I'll watch for your post.
My understanding is that they are producing at 90% water cut from most of their fields so I'd be surprised to see any sort of rapid change in production levels.
I do expect a rapid drop in US production but thats from the shallow offshore production in the GOM getting shut in because of the cost of clean up and various onshore and offshore horizontal wells falling rapidly in production.
Now I don't know how big a role horizontal wells have played in reviving Russian production.
Google for :
Use of horizontal drilling in Russia
Indicates I may have underestimated the use of horizontal drilling.
But I'd suggest following through the horizontal drilling angle is interesting.
If we can get some idea of how widespread its been in Russia that could bolster arguments of a faster decline.
http://books.google.com/books?id=KhWSoz5uvLoC&pg=PA63&lpg=PA63&dq=Number...
That link suggests that Russian extraction methods are not near as primitive as has been presented in the popular press.
Maybe they came late to the fast collapse party but you could be right.
Well don't forget Robert Heinlein. In his Future History series, after Nehemiah Scudder (Sarah Palin?) was elected president in 2012, the US became a theocracy, and there were no more free elections for quite some time.
In any case, regarding oil, Sam's best case is that the top five net oil exporters will have shipped about half of their post-2005 cumulative net oil exports by around 2014, and Mexico will probably be in the vicinity of zero net oil exports in the 2012 to 2014 time frame.
Memmel & Joules, Here is that link to the article regarding Russian oil.
http://www.mcclatchydc.com/homepage/story/49962.html
And here is the quote regarding a two year period till a sharp decline.
That strategy is potentially disastrous, said Valery Kryukov, who researches oil companies in western Siberia for a government-funded think tank.
"If the situation which exists now stays the same, oil production will start to decline seriously in two years," Kryukov said in a phone interview from his offices in the city of Novosibirsk.
Chris
Here is Sam's outlook for Russian production (from mature basins) and for consumption (initial projected 10 year numbers are shown):
http://graphoilogy.blogspot.com/2008/01/quantitative-assessment-of-futur...
While the frontier basins will help, I suspect that that they are to Russia as Alaska is to the US. Alaska helped, but it was no panacea.
Very informative graphs Westexas. Appreciate it, but so you know, I went to the link and found the graph for Russia which is just below the one you posted, which is for Saudi oil. The one for Russia actually shows a much steeper predicted decline. I tried pasting it here, but hit a snag.
The labels refer to the graphs above the labels, so the one I posted is for Russia. The first three production/consumption graphs are for Saudi Arabia, Russia and Norway. The graph you are referring to is for Norway.
What an odd way of lableling something. Got it now - thanks.