150 Years of Plenitude: The Story of Oil
Posted by Gail the Actuary on August 27, 2009 - 10:34am
This post is a guest post by Morgan Downey. Morgan is author of the book ‘Oil 101’.
Exactly one hundred and fifty years ago, on August 27, 1859, the first commercial oil well in the US began producing. The subsequent petroleum bounty has enabled and defined modern civilization.
This post is a status update in honor of the day--on how far we have come and our immediate challenges.
A Brief History of Oil
People have used oil obtained from the ground since at least 4,000BC. In the Middle East, crude oil that seeped to the surface was used to waterproof boats and as an adhesive in the construction of buildings and roads. Crude oil was also refined in minor quantities for lamp and heating oil in ancient China, though this technology never made it directly to modern times. By 600AD, the Byzantines used crude oil to produce a flame-throwing weapon known as Greek fire.
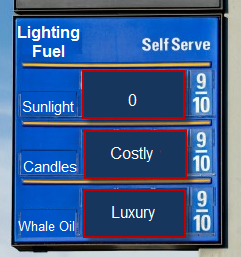
The modern oil industry began as a result of the search for inexpensive lighting. Until 1859, most people obtained artificial light by burning animal fats in the form of beeswax candles or whale oil. Whale oil shed the purest light of all available fuels, and became a luxury product. Overfishing led to a decline in the whale population (click here to see a cool whale video today) and a sharp increase in whale oil prices.
In order to take advantage of the high prices of illumination, a group of investors hired a railroad conductor named Edwin Drake to head to a location close to where traces of crude oil had been observed on the surface. After a nervous few weeks in rural Pennsylvania, Drake struck oil on August 27, 1859. The 69 foot deep well on a salt dome rock formation yielded around 15 barrels a day. Others quickly followed Drake and drilling soon spread across the region.
The petroleum that flowed from this well in what became known as Oil Creek, near Titusville, Pennsylvania, started the modern oil industry we know today (oil had been produced in other parts of the world, but the Titusville well kicked off industry on a large scale).
The new industry was gradually consolidated and monopolized by one man, John D. Rockefeller, and his Standard Oil Company. In 1911, Standard Oil was split by anti-monopoly legislation into several competing firms. Esso (“S. O.” for Standard Oil), which later became Exxon, remains the most well known of the Standard Oil children.
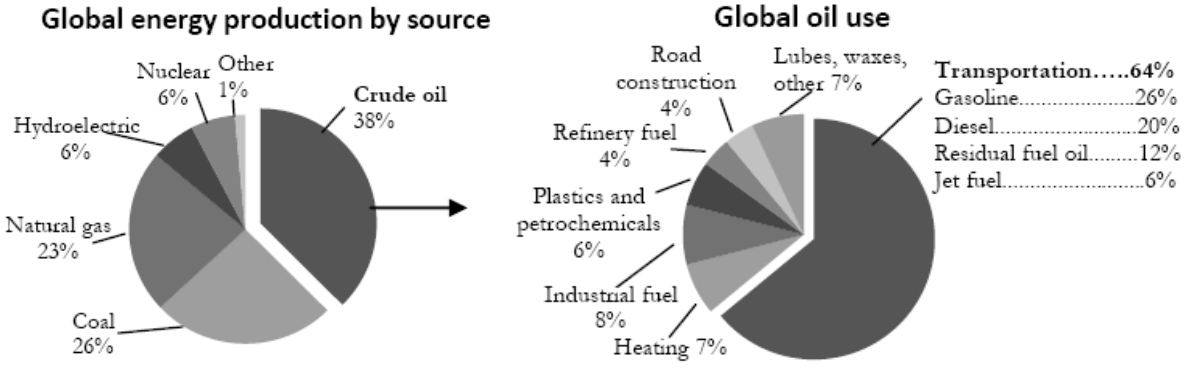
Up until the early 1900s, although economically important for lighting, oil was not used for much else. This quickly changed with the development of mass produced automobiles and aircraft such that by the 1950s oil had almost completely transitioned to being a transportation fuel. Today (see charts below), two-thirds of oil is used for transportation with the remaining third used for heating oil, plastics and road surfacing. A very small amount of oil is used for electricity generation as oil is generally more expensive than coal or natural gas.
The success of the oil industry in finding oil has always been its greatest challenge. Oil prices remained low during long periods of unforeseen oversupply while demand steadily caught up.
Standard Oil managed excess production capacity initially. Then, in the early 1930s, the Texas Railroad Commission (TRC) and similar but smaller organizations in other oil producing US states were given a government mandate to impose production restrictions to ration the amount of crude produced in each state. The US was a very large crude oil producer at that time and the government sought to prevent the bankruptcy of the industry during the Great Depression.
The global pricing ability of the TRC disappeared in 1970 when US oil production began to steadily decline. OPEC (the Organization of Petroleum Exporting Countries) was formed in 1960 in Baghdad. This new organization took over the role of managing excess production capacity in 1971. Today, OPEC members control just over 40% of global crude oil production. While non-OPEC producers generally pump as fast as they can, OPEC members occasionally restrain oil supply in order to support prices.
In the late 1970s and 1980s, oil began to be traded on futures exchanges. Heating oil futures first traded on the New York Mercantile Exchange (NYMEX) in 1978, followed by gasoline futures in 1981, and crude oil futures in 1983. This created price transparency between producers and consumers never witnessed before and finally removed oil price determination from the shady smoke-filled rooms where prices had been set previously.
What is crude oil?
Organic materials such as plankton and algae that have been deposited in sedimentary layers over many years on ocean and floors are believed to account for most crude oil. Contrary to popular perception, dinosaurs and other large animals are not thought to account for much oil.
All living creatures are composed of the elements carbon, hydrogen, oxygen, nitrogen, sulfur, phosphorus, along with minor amounts of other elements. Crude oil is composed of these same elements in addition to small amounts of inorganic materials picked up from the surrounding area. If buried deep enough and long enough the heat and pressure closer to the earth’s core combines the hydrogen and carbon over time to produce hydrocarbon molecules.
The primary factor which makes oil so valuable is that these liquid hydrocarbon molecules quickly release a large amount of energy as heat when combined with oxygen in a process called oxidization, more commonly referred to as combustion or burning.
Being lighter than surrounding rock, newly formed crude oil tends to head to the surface where it evaporates or is eaten by bacteria. If it is to be found today, the oil needs have been trapped under a suitable cap rock on its way to the surface.
A crude oil reservoir does not resemble an underground lake; instead, an accumulation of crude oil is contained between grains of sand or within tiny pores inside an otherwise solid rock matrix, like a rigid finely perforated sponge.
The hundreds of different grades of crude oil produced today are literally crude. To be used, they must be boiled in a refinery to separate out individual finished products including gasoline, diesel, heating oil, jet, and residual fuel. Each product has a different boiling temperature range.
The two factors which are most important for refineries to know about crude oil are its density and sulfur content.
In general, less dense, or lighter, crude is more valuable--it will more easily yield high value light products such as gasoline. Heavy crude oils can be processed to yield light products also, but only with the use of expensive and energy intensive processes which crack the heavier molecules.
Crude oil can be referred to as being sweet--low in sulfur, or sour--high in sulfur. Sulfur corrodes metal piping and tanks in producer and refining facilities. It also becomes a pollutant when burned, and sulfur in tailpipe exhaust damages catalytic converters. Refineries have to use costly methods to remove the sulfur from products such as gasoline and diesel, so the less sulfur in the crude to begin with, the better.
The Future
Global oil discoveries have declined steadily since the early 1960s despite periods of high prices and advances in exploration and production technology. The deficit has grown such that around the world we are now consuming roughly three times the amount of oil we are discovering each year.
The current rate of daily oil supply (around 85 million barrels per day) is becoming increasingly difficult and more expensive to maintain. Between September 2005 (see story) and July 2008 the global oil market ran out of spare production capacity. With all the taps fully open, supply could not meet demand. Oil consumers were shocked by this rare event.
Oil prices rose to a peak of US$147 per barrel in 2008, in order to slow down demand growth. The first annual fall in oil demand since the early 1980s began to take place (see story).
Many, including the OECD’s International Energy Agency (IEA), forecast another supply “crunch” between late 2010 and 2012, depending on how quickly global demand recovers.
Looking forward a little further, the discovery deficit is now so large that the IEA estimates an equivalent of six additional Saudi Arabias need to be found and developed, requiring cumulative investments of US$26 trillion, to meet expected 2030 global oil demand.
Just like Edwin Drake and his driller “Uncle Billy” on the morning of August 27, 1859, unless consumer behavior changes, the oil industry has a lot of work to do.
Contact
- Content: editors at theoildrum dot com
- Tech support: support at theoildrum dot com
License

This work is licensed under a Creative Commons Attribution-Share Alike 3.0 United States License.
Nicely summarized.
I've read about an actual underground pool of oil - your exception to the rule. Think it's in Texas? And perhaps I read about it in your book, which I can't locate at the moment, having shuffled around my library a bit. Seem to recall the ceiling is about 16 feet high. You can't blame those early drillers for not thinking oil must be down there in lakes and rivers - conduct a poll nowadays about the nature of oil and underground structures, and most people would no doubt reply that it's flowing along like a subterranean Potomac or Rhine.
And even though it is 150 years later, no one really has sought out to understand why oil-bearing reservoirs have the characteristic size distribution that they have empirically been observed to exhibit. The blue dots in the following chart show the size distribution histogram of North Sea reservoirs.


Because the distribution generally follows a simple relationship, one can actually linearize the data, much the same as we do with Hubbert Linearization, and come up with the following kind of plot.
The interesting parts of this analysis are (1) that that this simple behavior can easily be derived by considering that dispersive forces exist in the trapping of oil underground, and (2) that there really appears to be no upper limit that a reservoir can attain. For the latter, we can see that fewer and fewer large reservoirs occur but that the "hyperbolic" dispersion continues toward infinite sizes. Yet, of course, we just have to consider that dispersion only occurs over the course of time and over finite volumes so that there are real temporal and spatial constraints that prevent the sizes from ever getting much bigger than we have observed.
Still, the laws of dispersive aggregation indicates that we always have to consider the possibility of a gigantic find to occur, as we have not yet explored every nook and cranny underground. This essentially backs up the idea that the Black Swan theory and fat-tail phenomena (of which reservoir sizing is a prime example) is real and we have to be aware of the probabilities.
So back to the question, why after 150 years has no one really looked at this fundamental paradox?
A more thorough discussion here: http://mobjectivist.blogspot.com/2008/10/dispersive-discovery-field-size...
WebHubbleTelescope wrote:Still, the laws of dispersive aggregation indicates that we always have to consider the possibility of a gigantic find to occur, as we have not yet explored every nook and cranny underground. This essentially backs up the idea that the Black Swan theory and fat-tail phenomena (of which reservoir sizing is a prime example) is real and we have to be aware of the probabilities.
I don't think this is a significant probability. The really large oil fields are just that: really large. Ghawar, if I remember correctly, is about 1000 square miles in area. That's not something easily overlooked. As an industry, we have explored, at least superficially, every nook and cranny of the earth's surface. I have personally examined seismic data from such unlikely locations as deep water off the southwest coast of Greenland; barely-explored valleys in a war zone in Afghanistan (the Russians did some exploration when they occupied the country); deep water off Senegal; deep water off western Nigeria (all the oil is in eastern areas); and many other places where oil is known, and where there is no known oil.
Really large oil fields are really easy to find. Almost all of the "super-giants" were discovered before modern technology was invented, many of then by accident. As far as I know, the most recently discovered field with proved reserves over 10 billion barrels was Cantarell, in 1979, and while much of today's exploration technology was in place by then, its discovery was accidental, coming before Pemex had started serious offshore exploration.
Since about 1980, the oil exploration industry has at least looked at almost every sedimentary basin in the world. The remaining oil to be found will be in small accumulations. A "giant" field in the 21st century will be a few hundred million barrels (a few days supply for the world at current rates of consumption) and we'll be very lucky if we find ten or twenty of them a year. They will be in nasty places to work: places where the water is very deep, or where the winters are very cold, or where there is no water at all, or where someone is shooting at you, or where there are really nasty endemic diseases. In more hospitable areas we will still find small oil fields, and lots of them. But not enough to replace the giants.
Guess you haven't heard the news, then: Iran announces massive oil find - UPI.com
Deffeyes wrote of the probability of finding that one last superdupergiant - "Imelda" or "Ho Chi Min." Have you ever trawled through the archives of the SPE, WHT? It seems like by now somebody should have taken every analytical approach to cracking this nut that could be, but you always insist this isn't the case. Have any random oil finders contacted you about your work, also?
I don't know the complete history of the analysis, but the cream should rise to the top and some solid understanding should have become common knowledge by now. Instead, all we really see are variants of log-normal and Pareto distributions used as heuristics for describing reservoir sizes. The most I have seen is hand-waving. Deffeyes himself only describes the log-normal as an "and"-ing of a set of probability distributions, which tends to create a characteristic shape along a logarithmic axis. In my mind, this is really not good enough, but apparently this lax attitude is par for the course amongst geologists. They seem to be really data-driven and live and die by empiricism. That is the rationale for my stubborn insistence in trying to figure this out. I guess that I come from a scientific background that has that need for fundamental understanding embedded in my psyche.
I have gotten some occasional contacts about this work. An applied mathematician in France, B.Michel has also worked on this, but he takes an approach that I don't agree with.
Oh goody. 20 trillion bbl, so, we can all shut down and go home, right? Party on! I'm guessing its supposed to read 20 billion, which is what, 270 days world consumption?
20,000 billion milli-barrels perhaps?
The most important point to report and verify and they print it w/o editorial comment or suspicion.
It was good for some yucks at peakoil.com: World's largest oil field discovered in Iran? Albeit I smited the forehead a bit at people who entertained the idea that it could be anything but a misprint.
I just went to the UPI.com link and it says "...the semiofficial Fars news agency reports has in-place reserves of more than 20 billion barrels." Maybe it's been changed since original post?
The legend for the blue dots in the "Dispersive Aggregation Simulation" diagram is missing. Is the blue dots really real data?
It is real data. The legend is missing for the data because it is an exactly scaled overlay from a different chart. I usually do this so I don't have to transcribe the data points.
no problem, that even bigger super-super-super giant is there, it's just on Titan ;)
That is pretty much the idea of dispersive discovery. The rates of search for oil in the rest of the solar system is fairly slow :( so that will take a long time to discover. The scope of the dispersion is the volume of space that we are sifting through.
Hey, a theory has to be bullet-proof :)
The other factor overlooked in statistical analysis like this is the cost. If finding oil were simply a matter of spinning a roulette wheel, sure, you could just spin some more and come up with more big finds.
The problem with the ROI for spinning that wheel is it goes down in a way that makes the investment in spinning it to find cheap oil prohibitively expensive.
Theoretical limits may not exist for some things like oil finds, but that's a problem with how we construct our theory to ignore the reality of the escalating effort involved. The natural limit is cost, and the point where "I give up" is always how you ultimately find it. In this case that's how the observer eventually gets into the equation.
Does anyone have a plot of the cost of discovering new reserves?
Dispersive discovery has a cost factor built into it through the search acceleration factor. With pure exponentially accelerating search, the estimated profit has to always be greater than the cost. This is essentially greed and the profit motive working away. As soon as the expected cost exceeds the profit, the acceleration should slow down. Of course as you infer, this is all on a continuum and remains a big unknown.
If we had a plot of cost then we would also have much better data on the discoveries themselves. Only in places like UK North Sea and Norway are oil companies required by law to document their data :(
Hello Morgan,
Thxs for this writeup. I posted this a few days ago in the Michael Lynch thread, but it seems even more appropriate posted here to truly honor Edwin Drake, plus all those millions, employee and civilian alike, that have lost their lives to the FF-industry. An older link, to be sure, but things have only got worse since 2000 [Please see the included oil production chart]:
http://www.hubbertpeak.com/us/pa/
------------------------------------
"When Will the Joy Ride End?"
by Randy Udall, 1999
PENNZOIL: Our most famous motor oil honors the state where the Oil Age began.
..In 1891 the Quaker State produced enough oil to light the U.S. for 7 months. In 1937, when its production reached a second lower peak, Pennsylvania supplied enough to run the now motorized country for 7 days. Today the state’s oil could power the U.S. for only 3 hours. Although there are still 19,000 wells in Pennsylvania, collectively they produce a puny 6,900 barrels each day. In contrast, Saudi Arabia produces 8 million barrels—1,100 times as much—from just 1,400 wells.
Update: 16,250 wells producing 4,027 barrels per day, averaging 0.2 barrels per day per well, Oil and Gas Journal, December 18, 2000
---------------------------
According to Michael Lynch's "the combination of new discoveries and revisions to size estimates of older fields" means that 150 years of constant tech-improvement applied to Col. Drake's first oilwell and other wells should have now transformed Pennsylvania's oilfields into the world's largest reservoir with a daily flowrate that dwarfs KSA's Ghawar.
Uh, I don't think so!
I think Yergin & Lynch should be doing the half-glass Peakoil Shoutout daily to honor Drake & Hubbert. IMO, it could greatly help re-align their "estimates" of what lies ahead for us, the Global Overshoot.
EDIT: for typo-errors.
Bob Shaw in Phx,Az Are Humans Smarter than Yeast?
This country had every opportunity to continue the green energy revolution Carter started 30 plus years ago, but his renewable tax breaks were nixed and the solar panels were pulled from the White House rooftop to the cheers of most Americans. Our society went on to develop a national fleet of massive SUV's, including the Hummer. In fact the Hummer got a 100 thousand dollar (heavy equipment) tax break for being over 8500 lbs. It only got a few miles a gallon, yet the Prius which gets great mileage received no tax advantage.
Instead of making the changes that were needed, we acted as an example to China and India that excess was the right pursuit, and now they are mimicing us in every way. Sales of new vehicles in China this year has exceeded sales in the US for the first time, and their top seller are huge SUV's.
We need more Saudia Arabia's. Oh boy, do we ever! Yet the total CO2 count parts per million keeps rising and with it a changing climate towards inevitable tipping points.
Well, anyway we can't go back and do it over again, so I suppose the oil industry is on the bubble to find much more oil so we can continue to have the illusion of endless BAU.
Toyota's Prius briefly got a federal tax break for the purchaser. There was a ceiling of IIRC 60,000 units over the first year of the tax credit, but it was worth $3,150. I know because I took this credit along with the State of PA energy conservation rebate of $500. It all added up to $3,650 off of the purchase price of around $27,000; pretty nice break. Of course, with tax credits one must first pay more in taxes than the credit is worth or it is worth correspondingly less.
What do you base your opinion on? As an adult during that time period, I saw no such support for the removal of the panels, aside from some far-right pundits.
They were removed because the poorly installed mounts had damaged the roof, causing water leakage. They were removed to allow the roof to be fixed, and never put back on. Nixon did not symbolically destroy them.
Reagan, not Nixon. But, more to the point, Reagan was responsible for gutting renewable energy research and development at the federal level. He also, if I recall correctly, installed an Interior Secretary who didn't believe in conservation because God was going to end the world anyway.
Somewhat off topic, but on this site there are often rants about or against the large and vocal Christian demographic in the USA. Usually they are stated as "they believe X therefore", etc. This is a major logical fallacy. No one knows what anyone believes, and as there are pretty well no negative consequences and many positive consequences of a public display of Christian belief in the USA (e.g. Bill Clinton carrying his own copy of the Bible to church during the Monica farce)it will continue. Were there even minimum negative consequences, as in illegal drug possession or as existed for Gays or Abortionists decades ago, you would have a better handle on what people actually "believe".
Being a church attending atheist myself, I would agree with this.
Religion is apparently off limits unless you are running for public office, in which case you need to profess faith. Name a single senator or above ever elected who has been an avowed atheist or agnostic. Not to say that they weren't church attending atheists, but appearances apparently mean a lot.
A guy told me that in Atlanta you need to show up at church on Sunday if you have corporate or business ambitions-not sure if this is accurate or not.
So why is it not the same in any other OECD country? In Canada, I would be embarrassed to discover what if any religion our prime minister might or might not subscribe to, as would any news reporter. Certainly it wouldn't make any difference in my or any other voter's choice AFAIK. Well, maybe in some small outlying area in the praries, but not very much. Yet when I did a software contract in Arkansas, the plant manager where I was working actually introduced me to the "plant minister", a full time religious leader for the employees. At first I thought he was joking, and nearly burst out laughing.
The panels will have a new home: Smithsonian gets solar panel that once graced White House roof | The Global Warming Statistics. Do they have a display for Jimmy's cardigan sweater, too?
MEOW!
the panels turned sunlight into electricity that heated water in the staff kitchen
Really?
I'm pretty sure they got that wrong, I believe that they were just solar thermal hot water.
That sounds right.
Great history, but you conclude with:
Isn't part of the real dilemma that investing in "the green revolution" to produce the same growing amounts of energy for creating the growing number and kinds of products and services the economies "need", going to cost a great deal more?
I had forgotten this:
I am struck between that situation and now. The US government has been busy bailing out banks. But the natural gas industry looks like it is headed for trouble, at current prices. The government is looking at increased regulation of speculators, but isn't very concerned about the industry.
The oil industry worldwide would be better able to make investment decisions, if prices were more stable, but no one seems to be coming to the rescue on that either (Except possibly OPEC).
I am going to guess that their thinking is similar to yours: that the energy industry (along with all other industries) needs credit to function "normally"... therefore a bank bailout would function as a trickledown bailout for everyone? I believe that was the language it was couched in... "Getting the credit markets working again" etc...
Not to say that I agree with this, but I would guess that is the general thinking. I don't think they are thinking of demand destruction via low prices and shut-in wells, as a bad thing, simply a market reaction, which it is. And, to be honest, I am not sure I think it is a bad thing either... though probably for different reasons. I would like to see FF use curbed slowly, not plowed through ahead in a BAU scheme, to allow efficieny and maybe electrification to start now, even if it results in current economic decline.
BAU is probably impossible already anyway. Though really, BAU is sort of a BS term. There is no usual business except to maximize profits. This requires adjusting and adapting to the real world situation. Things have always been changing.
Oil's 150th Birthday
I take a strong objection to these postings!
Drake was a year late.
Oil Springs,Ont, CANADA Beat Drake By A Year!
1st commercial oil well in North America drilled in 1858 by James Williams in Oil Springs,Ont Canada.This town still stands and spawned a whole industry in nearby Sarnia,Ont(chemical alley).Imperial Oil,Suncor,Dow,Union Carbide,Nova,Shell, Bayer,Cabot, Ethyl have plants there.
We need someone from Canada pointing these things out to us at the time (and perhaps writing posts).
The Chinese were drilling for oil back in ancient times. Oil had also been drilled for in Eastern Europe. I mentioned that small amounts of oil had been produced in different parts of the world before Titusville in the piece. But your point is well taken.
Up until the early 1900s, although economically important for lighting, oil was not used for much else. July 2008...The first annual fall in oil demand since the early 1980s began to take place.
Electricity successfully replaced oil in the late 1800's for lighting - the Edison bulb was superior in every way to kerosene. If gasoline for automobiles hadn't come along, the oil industry would have been in real trouble.
Now it's time for electricity to do the same for transportation. Electric motors are superior in every way to infernal combustion engines. Now that oil is no longer dirt cheap, and batteries are finally good enough to power hybrids and plug-ins, the transition is under way.
“I'd put my money on solar energy… I hope we don't have to wait til oil and coal run out before we tackle that.” —Thomas Edison, in conversation with Henry Ford and Harvey Firestone, March 1931
That's a great quote, isn't it?
I read a conspiracy theory once, that claimed that Edison was developing an improved battery and planning an EV in cooperation with Henry Ford, but that all of his labs were attacked by arson to prevent it. I have no idea if this theory is credible - does anyone have information?
In the long run, of course, Edison was right. In the meantime, we have a solar derivative in the form of wind as our cheapest source of renewable power.
Check out Internal Combustion by Edwin Black:
Quite the gripping Gilded Age saga. Black documents the machinations of the coal industry as well - back to the 13th century or thereabouts, the Royal Foresters and proscriptions against the commonry taking so much as a twig out of the woods; this evolving into use of coal far before the Newcome engine. Exactly how much of this is suitable stuff for Art Bell I'm not sure and don't care; the material on the decades of half-measure attempts to market crude EVs is where the story really hits its stride. Recommended.
He doesn't leave out the tale of the mysterious fires at the supposedly fire-proof Edison Labs, either.
That looks like fun reading...
Now as then, most analysis completely omits the cost problem.
Cost is a true reflection of the whole system complication involved. The integrated delivery system with all it's parts remains the true source of the availability of any resource, and without it any resource might as well be on the Moon.
I first noticed that when doing passive solar research in the 70's. There was a lot of ingenious work being done, with some of the most promising things only needing the home owner to be involved in steering the system. That's hugely adds to the cost.
Swan invented the light bulb, Edison just stole the patent as it was not US.
This seems to be a good account: http://www.coolquiz.com/trivia/explain/docs/edison.asp
Edison's strongest ability may have been that of developing and popularizing other people's inventions. On the other hand, that's an enormously valuable thing to the public, if not to competitors.
Good short historical overview, but...
This is such a weak ending, one wonders if you are trying not to be pinned down on anything about Peak Oil.
I mentioned supply is struggling to grow to meet growing demand and discoveries have been in a long decline.
I feel that people can draw a more reasoned and clear conclusion when presented with facts in a non-dramatic style.
Morgan,
Oil production in the US seemed to stop declining last year, in part due to increased drilling, in part due to natural gas liquids.
Do you think that US production has a reasonable chance of maintaining that plateau?
Domestic US natural gas liquids (NGLs) production has not changed that much over the past 3-4 years. (NGLS production globally is growing as part of total hydrocarbon liquids.)
The stabilization in US production over the past 3 years (and likely for the next 2) has come from incremental offshore Gulf of Mexico production in addition to a small incremental contribution from crop-based fuels.
Also, last year (2008) we had a relatively mild hurricane season compared to the prior years and so offshore production was a little higher due to that.
I hadn't looked at EIA data in several months - I was surprised to see that US crude production had actually increased significantly in 2009 to about 5.25M bbl/day, which was about the level of 2005.
It sounds like you estimate that US total liquids production will start dropping again roughly in 2011. Is that about right?
Would you guess that the decline after that would be something like the gradual (2%) decline we've seen in the last several decades?
Ethanol production is the primary source of growth in US domestic supply over the next few years. The amount of increase in supply is not very significant (100,000 barrels per day) compared to total US oil consumption (19 million barrels per day).
After 2011 the US crop-fuels increase may have maxed out.
The US may open additional offshore areas which are currently restricted. This may boost US oil production, or at least partially offset declines in other areas of US domestic production for a few years.
The ethanol "production growth" does not subtract out the fuel required to plant/harvest/process it in the first place, so this metric is misleading.
You are correct. Ethanol is added to total liquids on a gross not net (of liquids required to produce that ethanol) basis.
Usually when people talk about total liquids production the gross figure is used. This is not the best measure but it is the best we've got to work with. The truest measure would be net Btu available to consumers.
Really? I get a nominal increase of 365.3 kb/d from 2005-2008 using RFA data; of course, curb some of that due to lower btu content, etc. I see how the goals they've set do drop from 120.68 kb/d additional in 2010 to 65.23 kb/d additional the next year, but they rise up shortly thereafter to >100 kb/d more per year again, up to 195.69 kb/d additional in 2021/2022, the last year with the mandate in place, I assume. At that stage the total would be 2348.34 kb/d.
RFA - Renewable Fuels Association. I've been curious as to what stage we'll be utilizing 100% of the corn crop, of course; anybody know? Also I've been trying to find a brand of catsup that doesn't have HFCS in it...
a brand of catsup that doesn't have HFCS
Heinz organic ketchup: no HFCS at all. Tastes much better, but costs about twice as much.
Registered Dem, but don't want to pad John Kerry's wallet if at all possible. Fight the Power! And all that. Plus I only enjoy the odd French Fry anyway, wouldn't mind paying a real premium for something with more care put into its creation.
Plus all that labeling is hoo ha, have't you heard? Organic isn't more nutritious, study says - OregonLive.com. Michael Pollan documented what BS the term is with his example of Cascadian Farms, who devolved from being an honest small time organic operation to basically utilizing the industrial ag toolkit with just enough Green to make the EPA happy. What convinced me in any case was that their food sucks.
Well, I don't know what would make you happy.
I was just looking for a ketchup that didn't have HFCS. The taste was a bonus that compensated for the price.
I found what I was looking for - I was happy.
Don't let the perfect be the enemy of the good.
If you look at the individual PADD levels, you can see where some of the additions have come into play. For example ND oil production has double over the last couple of years from less than 100,000 BPD to more than 200,000 BPD. Kansas has also increased somewhat.
But the offshore (GOM, Alaska) have picked up for various reasons. In the GOM, even though you had a complete shut-in for aperiod of time last year, you had a fairly quick recovery, plus a few projects that had been badly damaged during the 2004 and 2005 hurricane seasons finally coming on line. But the GOM is still a ways from it's last peak in 2002. As they move to deeper and deeper water and bring projects on line you get these fluctuation. But as we are discovering, these flows larger flows may be quite short-lived.
Assuming you are familiar with the Hirsch Report, do you agree with its findings about economic impact? If so, wouldn't that be at least the minimum basis for describing the future? If not, which scenario do you most closely identify (or describe your own)?
I am familiar with the Hirsch Report. There are so many variables involved with oil consumption and supply that it is extremely diffiicult to predict how things will play out as oil supply eventually declines.
That's why the oil drum is good as various posters cover the gamut of scenarios.
My personal view of the most likely scenario is that no significant advance mitigating action will be taken by the vast majority of people until oil production has been clearly observed to be in decline for a number of years. Then, action will occur in response to a series of recession creating price spikes.
I don't think that crude oil will ever price above US$200 (in constant dollar terms) for any average rolling 12 month period. There may be a series of price spikes, some perhaps with individual months of days above US$200. These price spikes will create changes in consumption behavior.
Whether people will panic and freak out or simply get on with adapting is difficult to predict. Individuals and cultures react very differently to adversity and challenges. Also, how people and cultures react is tied up with what people have available to adapt to and that itself it difficult to predict.
no significant advance mitigating action will be taken by the vast majority of people
I would think that the most import advance mitigating action would be electric transportation. This would include hybrids and plug-in hybrids (including Extended Range EVs like the Chevy Volt and Plug-in Hybrid EVs like a plug-in Prius) of various sorts.
Does that make sense to you?
It looks to me like the US and China are doing moderately well in ramping up hybrids and EREVs and PHEVs: the Chevy Volt will be ready for large production volumes in 2011, and a wide range of PHEVs and EVs is coming in the next several years, from almost all of the major car makers. Also, I think enough early-adopters are out there to allow these vehicles to ramp up to pretty large production volumes, putting them only a few years away from being the primary mode. So, I think that when mainstream buyers are ready, the electric vehicles will pretty much be there.
Does that make sense? If so, does that encourage you?
A portfolio approach of a bit of every solution is the most likely scenario. Electric vehicles will be part of the portfolio for sure.
Hello Nick,
Your Quote: "I would think that the most import advance mitigating action would be electric transportation."
http://www.evwind.es/noticias.php?id_not=977
------------------------
The Future of Transportation by Shai Agassi (Founder and CEO of Better Place)
------------------------
My alternative suggestion:
http://www.theoildrum.com/node/5713/534023
---------------------
Thxs for the DB toplink: "The Future of Transportation by Shai Agassi". After his talk on TED, I was wondering when he would get around to writing something we could examine more closely.
Since I believe the [Hanson,Duncan,Memmel, et al] fast-crash shark-fin scenario will predominate soon [or is it already here?]: IMO, Shai needs to move his impressive speculation downstream to the real-world realm of strategic reserves of bicycles & wheelbarrows, batt-bikes, batt-trucks for local movement of goods from Alan's ideas, and hoped for exponential growth of networks of SpiderWebRiding...
-----------------------
I like the Agassi discussion.
I like your idea of electric bikes: no question, they're the most efficient*, cheapest, fast-to-implement form of transportation there is.
*Yes, much more efficient than walking, though walking is certainly good for you.
Bicycling per se trumps all other forms of transport, according to many posters here, anyway. EBikes would be ideal if you're tubby and live at the top of a hill.
Deploying these solutions effectively is one of the big unknowns; China has a fleet of no less than 100 million Electric Bikes, dominating worldwide sales of ca. 23 million yearly, so there's no denying the things can be produced in great volume. But as it is there's little market share in the US, so long as we're focusing on that market. In the wake of fuel shortages would there be time to ship enough here, or set up adequate domestic manufacturing? Those Chinese bikes sell for $290 equiv on average, too; arbitrage sales would be no problem.
One thing's for sure, even with a price spike they fly off the shelves. Retailers in my locale ran out of scooters and ebikes practically overnight last summer; now they're back to full stocks, no surprise.
Bicycling per se trumps all other forms of transport
Push bicycles are efficient, but electric motors are much more so. Now, if you need aerobic exercise, have no disabilities, have showering facilities at your work, etc, then push bikes are ideal.
In the wake of fuel shortages would there be time to ship enough here, or set up adequate domestic manufacturing?
Sure. People can carpool until then. Seriously.
Carpool to where, Disneyland, visit grandma, maybe you think to work, we'll just carry on BAU.
Do you have any idea what would be happening to the world if there wasn't enough fuel to drive, not just for a little while, not just while we wait for things to get better, its forever and a day and getting worse every day.
Just stand on a freeway overpass for a few minutes. Look down and what do you see, fire trucks, ambulances, police cars, cement trucks, delivery vans, freezer vans, food deliveries, construction vehicles, service vehicles, buses, taxis and many more which would astound you.....but you won't see a lot of fuel trucks? Then look on the map for mines, factories, farms, airports.........Sure they can carpool too.
You think a little fuel shortage and BAU will continue? Ride a bike, carpool, take the bus. That's your solution?
With a temporary shortage we could and would make do but shortages forever and increasing, that is a problem of insurmountable proportions. Instantly there is a shortage of an indispensable item or commodity exploitation will arrive.
From the gas station owner saying he has run out but selling out the back door to family and friends and whomever might like to pay a little extra to selling adulterated fuel. Every man and his dog with a supply will have some to sell at a price. That will spawn banditry and probably riots.
I don't think fuel shortages will be accepted gracefully for a length of time and probably not at all. If we can't replace as close as possible, one for one and without discrimination our ICE's with alternatives as the shortages bite, do not expect to carpool and get a meaningful stop-gap solution.
If I sound strident, interpret as a rant.
Obviously, carpooling is a temporary, transitional solution.
The solution for passenger vehicles, for quite a long time (perhaps forever), will be plug-ins, especially extended range EVs like the Chevy Volt, which use only 10% as much fuel as the average US vehicle, and whose backup ICE generators could all be powered by ethanol if need be. Of course, electric bikes would be useful as well, and a lot easier to produce a lot of quickly.
Almost all long haul freight is likely to go by electric train, unless PV becomes a lot more efficient....
You seem to have a clear reading of the data, but may be missing the reason why the future price will be controlled by "price spikes" as you say, that are not maintained.
That's the sign of a whole economic system running out of options for growth, and still being growth driven by policy, practice and expectation.
The shift from a positive sum game to a negative sum game (for a growth driven community of players) is like the music starting to only end again in musical chairs. Someone has to fall down. In a zero sum game, gains by some are built from losses by others. In economic systems that means waves of failure for whole sectors, like we're now going through, with some of our sectors seeming certain to be the big long term losers.
the future price will be controlled by "price spikes" as you say, that are not maintained. That's the sign of a whole economic system running out of options for growth
Yes, but it's also a sign of a commodity which is reaching the price of substitutes, and of consumers who are switching from short-term to long-term demand elasticity.
We're dependent on oil in the short-term, but not in the long-term.
Will, here are some thoughts on the last Hirsch report:
http://energyfaq.blogspot.com/2008/06/there-are-several-studies-by-rober...
That just barely scratches the surface. In addition to Std. Oil of NJ (=ESSO, =Exxon), you had:
Std. Oil of NY (=SOCONY, +Vacuum = SOCONY Vacuum, =SOCONY Mobil, =Mobil)
Std Oil of Ohio (=SOHIO, merged with BP)
Std Oil of Indiana (=AMOCO, merged with BP)
Std Oil of Calif. (=SoCal, =Chevron)
Atlatic (+ Richfield = Atlantic Richfield, =ARCO)
Continental Oil Co (=CONOCO)
Ohio Oil Co (=Marathon)
South Penn Oil Co (=Pennzoil)
This is by no means a complete list, there were many other smaller units that were eventually absorbed by larger companies, mostly one of the above. For a more complete list, see The Wikipedia article.
I have often felt that Oil was the one Wish we wish we had not asked for.
If we had only found coal, then our cities would still be built around rail. Coal to liquids would have provided an expensive, and rare, glimpse of what free roaming vehicles might be like, but most would never have owned one.
Because we found oil we (mostly the US) have built our cities around free roaming vehicles. And so we are going to be squeezed hard once it runs out.
If oil had never been found, the transition from coal to wind or solar would have be much less painful.
If we had only found coal, then our cities would still be built around rail. Coal to liquids would have provided an expensive, and rare, glimpse of what free roaming vehicles might be like, but most would never have owned one.
I agree - we certainly would have been much better off.
We would have gone to EVs. By 1912 there were thousands of EVs on the road, and electric trucks were also selling well.
Ferdinand Porsche had designed an extended range EV like the contemporary Chevy Volt. Given that an ErEV uses 10% as much liquid fuel as a contemporary US ICE vehicle, it could have run on our limited supplies of ethanol - the Model T was built to run on ethanol.
The lack of oil would have slowed down personal transportation only slightly.
We would have been much better off.
Would have, maybe.
But we're not. The fact of the matter is that no energy regime short of nuclear fusion has the capability to support the kinds of urban sprawl we Americans are used to. Phasing out fossil fuels won't send us into the dark ages, but it will force us to abandon the suburbs. There simply isn't enough biofuel, coal-to-liquid, natural gas, or uranium to support the energy needs of a humanity with a car culture like the US. It's questionable if there's enough economically recoverable lithium to provide enough batteries to run an EV based transportation system.
Using coal or natural gas for transportation fuels would only exhaust those two reserves of energy. Nuclear power is great, but without some advances in nuclear technology we could be looking at a uranium supply crunch in the next decade. We can't produce enough biomass to replace fossil fuels without seriously disrupting food supplies and oceanic ecosystems, nor can we build enough wind turbines, hydrokinetic turbines, solar cells, or what have you to supply enough electricity to power an EV society.
We've got to get people out of their cars.
nor can we build enough wind turbines, hydrokinetic turbines, solar cells, or what have you to supply enough electricity to power an EV society.
Sure we can. It would only require an expansion of US KWH electrical generation of about 17% to replace all 230M light vehicles on the road (not that we need that many - they're only about 2% utilized). For wind see
http://energyfaq.blogspot.com/2009/07/is-there-enough-wind-resource-to.html
and for solar:
http://energyfaq.blogspot.com/2009/02/could-solar-supply-all-our-electri...
It's questionable if there's enough economically recoverable lithium to provide enough batteries to run an EV based transportation system.
Nah - that's an urban legend. See http://energyfaq.blogspot.com/2009/02/could-we-run-out-of-lithium-for-ev...
without some advances in nuclear technology we could be looking at a uranium supply crunch in the next decade.
I think that was addressed pretty thoroughly on TOD just a week ago.
Assuming Nick's Energy FAQ is your blog, how carefully did you study your sources?
The reference, Lithium Counterpoint: No Shortage For Electric Cars (Gas 2.0, Karen Pease, Oct. 13, 2008), for Western Lithium's apparent estimate of the amount of in place resource of lithium carbonate at its mine in Kings Valley, NV, refers to another article, Western Uranium Corporation Provides Corporate Activity Update (Mining Exploration News, April 2, 2008) that contains this information:
What is Chevron Resource's definition of the lithium carbonate resource? Both you and Karen Pease seem to assume it means the amount of lithium carbonate that can be ultimately extracted and brought to market at roughly the current economic price. Upon searching for a clarification of this definition I found New Li Resource Estimate at Western Lithium's King's Valley Property Supports the Potential Development of Lithium, Reuters, Jan. 20, 2009:
These are indicated and inferred resources with a minimum concentration of .20% Lithium and comprise only 1 of 5 sites. I do not understand why the term lithium carbonate equivalent is being used in place of lithium carbonate. The estimate of 25 billion pounds of "lithium carbonate resource" at all five deposits is guesswork because samples were only collected at one of them. 606,000 tonnes of LCE is 1.2 billion pounds (assuming U.S. tonnes = 2,000 pounds) which differs from the 1.7 billion pounds stated by Mining Exploration News. At a potential production rate of 20,000 tonnes of LCE / year, a potential of 800,000 batteries containing 50 pounds of Lithium could be produced per year which would be a rather slow rate of conversion for the U.S. automobile fleet.
In Karen Pease's article she does not discuss how much energy is needed to concentrate increasingly rarefied deposits of Lithium. The notion that Lithium can be extracted and concentrated from sea water for 5 to 7 times the current cost assumes cheap plentiful energy and an economy that can afford expensive batteries.
The world is not saved because an author glosses over the details or a fledgling company makes fantastic claims about its resources using vague language. They have to deliver on its promises first.
You're assuming that lithium is a large part of the cost of the battery even at future costs of assembly. I can't find much on line, but at $4000/tonne of Li2CO3, the actual lithium (in ionic form) is about $10/lb. This is a significant cost element (and even more so at $70/lb), but it's hardly crippling.
Edit: At a nominal 3.3 volts and 100% coulomb efficiency (which I understand Li-ion cells have), a gram of lithium will store about 12.6 watt-hours [3.3 V * 96500 coulombs per mole / (7 grams/mole * 3600 sec/hr)]. A Volt's worth of lithium is only about 1.3 kg (3 pounds). A single deposit of 1.7 billion pounds of lithium carbonate is sufficient for about 110 million Volt batteries. At $70/pound, the lithium would add perhaps $200 to the price of the car.
Well, those links are stuffed full of inaccurate information.
Lithium-Ion Battery Recycling Issues (Linda Gaines, Argonne National Laboratory, May 21, 2009, PDF warning) indicates on page 13 a LiMn2O4 car battery with a 40 mile range contains 1.4 kg of lithium. Apparently the Chevy Volt will use a battery containing this compound, lithium manganese spinel.
If Western Lithium can get production up to 20,000 tonnes of lithium carbonate equivalent per year (assuming LCE is Li2CO3), they would produce about:
2(6.9 g/mol)/(73.9 g/mol) * 20,000 tonnes = 3,700 tonnes of Li per year,
or enough for 2.4 million lithium batteries per year for the Chevy Volt. The U.S. Department of Transportation indicates in State Motor-Vehicle Registrations - 2007 that there are 136 million registered private and commercial automobiles (not buses, trucks nor motorcycles) in the U.S. Assuming Western Lithium could unrealistically expand production to the maximum rate within a year, 57 years would be needed to replace them all. That is an improvement, but still does not provide abundant lithium as Nick proclaims because the vast majority of the automobile fleet probably needs to be converted within the next 20 years to avoid pain.
Gee, do you think they could maybe... mine more than one deposit at a time, if the demand called for it? Ignoring the other 23.3 billion pounds of resource if you should have demand for 14 million batteries per year seems like, well, something you'd only do in a straw-man argument.
The article did not specify whether the potential rate of mining referred to one or all five areas. I am not knowledgeable about the lithium extraction process, but there may be resource constraints, such as energy or water, that limit the amount of processing. Western Lithium has to extract lithium from clay from a minimum concentration of .20% in a valley in the Nevada desert. Since a satellite photo shows farming in the valley, the water is likely claimed by others.
Karen Pease's article she does not discuss how much energy is needed to concentrate increasingly rarefied deposits of Lithium. The world is not saved because an author glosses over the details
The discussion of seawater extraction discusses energy concerns.
...Assuming Western Lithium could unrealistically expand production to the maximum rate within a year, 57 years would be needed to replace them all.
You're assuming this is the only source of lithium - it's just one example of sources not counted by those who originally raised concerns about lithium supplies.
I am not knowledgeable about the lithium extraction process
It's good of you to admit this, but... wouldn't it be better raise potential concerns after having done some research to support them?
but there may be resource constraints, such as energy or water
Do you have any specific reasons for your concerns?
There is no mention of the amount of energy needed to extract Lithium from sea water. She is referring to the total amount of the resource which is nothing more than a statement that Lithium is a moderately abundant element in the Earth's crust. She uses an economic argument that ignores the effort and resources required to concentrate Lithium. You echoed her arguments. Until the arguments include an honest assessment of whether Lithium production can be increased fast enough to compensate for the decline in crude oil production, you two are glossing over the difficulties.
I made no such assumption. I debunked the argument that the Lithium deposit in Kings Valley, NV is our savior for manufacturing automotive Lithium batteries by showing that their potential rate of production is insufficient to convert the automotive fleet in the time frame predicted by ELM, ~23 years.
In an ideal world we would both have enough time and information to follow this advice.
Do you realize that the concern over the availability of Lithium is not about its abundance, but rather the rate and price at which it can be brought to market? An argument that the price of Lithium could rise by 5 or 10 times without significantly affecting the price of a Lithium-ion battery does not address what would actually happen to the price of Lithium if the production is increased 20 times during the next 40 years (Gaines 2009, p17).
Lithium Unicorns and Alternative Energy Storage, Seeking Alpha, John Petersen January 08, 2009
It is more expensive to extract Lithium from clay than from brine, but I can not find any source indicating how much more.
My concern over the future availability and price of Lithium remain. Developing PHEV's which would reduce the amount of Lithium needed compared to EV's and recycling Lithium as Gaines advocates may be necessary to reduce the demand for freshly mined Lithium.
Don't you think that's implied in "even with first-generation technology, it’s only $22-$32/kg cheap"?
There is no mention of the amount of energy needed to extract Lithium from sea water.
Pease's reference includes this: "seawater is first evaporated by solar energy to increase the concentration of lithium and to decrease the concentration of other cations in the bittern which then passes into a Dowex-50 ion exchange bed for cation adsorption. Lithium ions are then eluted with dilute hydrochloric acid forming an aqueous lithium chloride which is subsequently concentrated and electrolyzed. The energy requirement for lithium extraction varies between 0.08 and 2.46 kWh(e)/gm for a range of production rates varying between 10/sup 4/ and 10/sup 8/ kg/y; this is small compared to the energy produced from the use of lithium in a CTR having a value of 3400 kWh(e)/g Li."
Until the arguments include an honest assessment of whether Lithium production can be increased fast enough to compensate for the decline in crude oil production, you two are glossing over the difficulties.
The original concerns were about reserves and resources - subsequent rebuttals have effectively shown that these concerns were misplaced.
Now, do you have any specific reasons or evidence to suggest that resources can not be developed quickly enough? In other words, you have the burden of proof. As a comparison, look at how TOD contributors have provided evidence of Peak Oil - they didn't just argue that oil suppliers/exporters should prove that there are no problems.
I debunked the argument that the Lithium deposit in Kings Valley, NV is our savior
No one is making that argument. That's just one example of resources not included in the original analyses, which examined S. American suppliers. Other major supplies are in China, for instance.
the concern over the availability of Lithium is not about its abundance, but rather the rate and price at which it can be brought to market
Not really. The analysis by Tahil that started all of this was precisely about resource abundance.
You refer to Gaines, 2009. Her analysis says: "Known Li reserves could meet world demand to 2050" title, page 21. And, that's known reserves, not resources, and she notes that her USGS source is conservative.
recycling Lithium as Gaines advocates
Lithium is recycled now - why wouldn't this continue?
My concern over the future availability and price of Lithium remain
Gaines says that current reserves are sufficient - that's the definition of reserves: something available at current prices.
What sort of math leads to that 2%? Engine efficiency X size of workforce? There are >245 million vehicles in the US minimum, and ca. 90-95 million commuters still drive to work solo: Most of Us Still Drive to Work – Alone
This is a situation which hasn't changed drastically in the last four years, except briefly in 2008 due to the fuel price spike, when MT gained considerable ridership.
A few years ago I calculated the electric power requirement at 107 GW, or about 23% of 2008 US generation. That assumes no efficiencies from electric propulsion, so 17% may well be more accurate.
What sort of math leads to that 2%?
there are about 250M vehicles, but about 20M are motorcycles, etc.
3T VMT divided by 230M = 13,000 miles per year. At an average of 30 MPH, that's 433 hours per year. 433/8760 hours per year = 4.9% utilization.
If the average light vehicle sits 5, that's 1% utilization.
Now, rush hour sees a peak in utilization - it might get as high as 15%: 45% of mileage is commuting, and if 2/3 of it happens during a two hour period (not everyone works the day shift), that's 130 hours of travel in 480 hours in the year (240 working days per year) - divided by 25% occupancy per car, or about 7% utilization. If we assume a maximum utilization factor of 50%, due to scheduling, etc, we get about 15% utilization.
That is to say, on average overall, light vehicles spend 95% of their time parked, and are only 20% utilized when they move. Even at peak, roughly 70% are parked at any one time.
You are incorrect about the mix of vehicles, for 2007 it was 135,933,000 cars and 110,498,000 LDVs in use, for 246,431,000 total: Transportation Energy Data Book Edition 28. Your idea of utility is a bit uncommon to say the least; is 1/3 of our lives wasted because we spend that amount of time asleep?
Well, I'd rely on the Dept of Transportation ( http://www.bts.gov/publications/national_transportation_statistics/html/... ), rather than the DOE. The DOT says 101,469,615 light trucks (I'm not counting buses, or trucks with more than 4 tires) in 2007, for a total of about 237M light vehicles.
My memory was off by 3%, though (perhaps I last looked in 2005, when it was 232M) - useful to know.
is 1/3 of our lives wasted because we spend that amount of time asleep?
No, but 1) unlike human downtime, vehicle downtime is sufficiently low that it's not significant for these calculations, and 2) we don't all sleep at the same time - some people work in the evening or night, and commute then.
Here's an alternative calculation: take the 92.5M commuters you mentioned above, divide by 5 passengers per vehicle, and calculate a need for 18.5M vehicles (7.8% utilization), or about 1 year's production potential.
There's a lot of potential uses for this information: we might want to evaluate the availability of EVs for utility DSM or V2G; we might want to identify the number vehicles we'd need in a car-pooling function to get us through a fuel shortage; or we might want to identify the number EVs we'd need in a car-sharing function to get us through a transition to EVs.
It suggests that once we ramp up PHEV/EREV/EV production, it will only take a year to produce enough vehicles to get everyone to work. We'd need to be really well organized, but it gives a flavor of what's possible...
Rossing mine at 500 fold energy return on low grade ore in once through LWR cycles seems pretty definitave about the long term uranium supply scenario, and decades worth of DU for reenrichment and vast amounts of surplus enrichment capacity speak quite well about any short term scenario. Nuclear power is never going to be threatened by a lack of fuel.
OT: Drop me a line at engineerpoet38215 at the old yeehaw or whatever, I've got a proposal for you.
Nick, I like your creative revisionist history of technology evolution... but that won't take us back to the past. It's still valuable to consider though, because it helps emphasize how very important the path you take somewhere is to the kind of choices you'll then find. The actual choices of the past now leave us with still accumulating physical dependency on the throw-away systems of the past. A major reason why that happened is not accident, but that all our development decisions were and are made to maximize short term profits rather than long term utility.
So few people seem to be taking into account how our choices today are create dependencies and foreclose choices down the road. We should pay more attention to that. Every choice about the direction of development either paves a path of change or sets our feet in the concrete of a remade world we'll have to throw away again. That's a bridge with no landing.
I found it interesting also. I'm speculating that if eg. in future we somehow stumble through petroleum depletion and eg. convert to a hydrogen energy carrier, you (JonFreise) will spend a lot of your time gazing about at the blasphemous hydrogen-fueled vehicles and proclaiming your wish that the petroleum age had never ended. Just saying...
I like your creative revisionist history of technology evolution
Thanks!
that won't take us back to the past
We seem to be going "back" to EVs pretty quickly. Back to the future.
how our choices today are create dependencies and foreclose choices down the road.
Yes, we need a bit more long-term planning.
I bought a copy of "Oil 101" online, and while it was a good book overall, the first few pages stuck in my craw when the author wrote about Drake starting the world's petroleum industry. Canada, of course, had oil wells a year prior in 1858, and Canada Post issued a stamp last year to honour the occasion. And, of course, there were other oil wells elsewhere.
Having said that, I do recommend the book as a good introductory textbook for non-petroleum readers. (I hope the second edition will revise the first few pages.)
When I am asked for good reading about the oil industry, I always recommend the following books:
Twilight In The Desert
A Thousand Barrels A Second
Beyond Oil
(and now) Oil 101
plus, of course, theoildrum.com, greaterfool.ca, and goldseek.com
Between all these, they will educate an average person quite well.
Hi Dale, I have noted your point relating to Canada. And it is well taken. I had to chop sentences out in the editing process and part of that included removing reference to ancient Chinese drilling, Eastern European drilling and Canadian drilling. I will address it in the second edition. Thanks so much for your recommendation and apologies for not including Canada.
From Wikipedia:
http://en.wikipedia.org/wiki/Criticism_of_NASCAR
"According to NASCAR, about 6,000 U.S. gallons (~22,700 litres) of fuel are consumed during a typical Sprint Cup weekend.[9] For the 2006 season, which includes 36 points races, the total for the season would be 216,000 U.S. gallons (818,000 litres). One environmental critic recently estimated NASCAR's total fuel consumption across all series at 2 million U.S. gallons (7.57 million liters) of gas for one season;[10] however, the methodology used has been a point of dispute."
After TSHTF, I keep wondering to myself how long the auto racing industry(Nascar, F1, WRC etc.) will continue? Has anyone on TOD done any calculations as to how much time the complete ban of such a sport will buy us? How about other absolutely wasteful uses of gasoline like monster truck rallies and the like?
This has been discussed here before. I think the conclusion was "not long", but not because of the fuel the racecars/monster trucks consume, but because of the fuel the spectators consume to get there. The same goes for all big sports, the fuel consumption of the cars themselves is relatively low compared to the energy costs of everything else involved.
Electric motors have better torque - I wonder how long before they just go electric?
Here's a nice description of that torque, vs a Porsche: http://articles.latimes.com/2009/feb/06/business/fi-neil6
Here's an electric, 0-60 in 3.5 seconds Ford Pinto dragster! http://www.allcarselectric.com/blog/1034629_npr-rides-in-an-electric-for... and http://news.opb.org/article/5556-new-electric-dragsters-beat-gas-guzzlers/
Here's a discussion of low-CO2 Formula One: http://www.independent.co.uk/sport/motor-racing/formula-zero-carbon-moto...
I believe the Tesla beat several much more expensive ICE sports cars in a recent race. Has anyone seen a report on that?
US gasoline consumption is 383 mg/d, so the cars themselves are hogging down 0.0015665796345% of the total as they tool around in a circle. Banning it would turn the sport into a massive political hot potato that would definitely waste plenty of time that could be better spent on real issues; best to let it die of its own accord.
Morgan,
How easy is it for refineries to reduce gasoline and increase diesel production?
It seems to me that gasoline consumption is by far the easiest thing to reduce - heck, we could reduce gasoline consumption by 25% in 3 months with carpooling! Diesel consumption, on the other hand, is harder to reduce, being mostly heavier equipment.
So, if gasoline consumption were to drop sharply, how much of that excess could be converted into diesel with, say, modifications to refineries?
Individual refineries are usually configured with the ability to change their product output slate by a few percentage points.
Also, the oil refining system is global and so if US consumers cut gasoline consumption and gasoline prices fell (relative to diesel) then someone somewhere else in the world would likely increase gasoline consumption and the gasoline would be shipped there.
Global oil product flows would change to adjust for changes in regional consumption patterns. This happened in the past decade as European consumers switched to diesel vehicles in favor of gasoline. European refiners now send a lot of gasoline to the US and US refineries send diesel to Europe.
It would be a lot smarter to balance the mix of gasoline and diesel vehicles properly to the crack mix of the refineries in both locations, rather than waste energy re-shipping refined products away after importing the crude. An obvious market failure.
The market does corrrect the imbalances after a little time.
Transporting refined products from one region to the other is the short term adjusting factor which keeps the global system in balance.
European refineries produce most of the gasoline consumed in Europe. US refineries produce most of the gasoline consumed in the US. The tranported gasoline between Europe and the US is a small component bringing the market in both regions into balance.
Morgan,
In countries like Mexico and Iran where they don't have the refining capcity to meet their needs but are large oil exporters, so they export oil but import refined products....could you see a situation when supplies get tighter that these type of countries might try to become more vertically integrated where they would build refinieries so they won't be dependent on buying refined products in the open market. This would further reduce exports worldwide but it would give each country more control of their liquid fuels.
This would further reduce exports worldwide
Not really. Increased vertical integration in exporting countries would reduce the supply of crude exports, but increase the supply of refinery product exports, so the net effect would be a wash.
That's one of the flaws in the ELM model - it doesn't account for import substitution like this, or export substitution (e.g., exporting fertilizer instead of natural gas).
A country having a self sufficient refinery system has some strategic value. However, this strategic benefit is very often overestimated.
Being self sufficient with refinery capacity can even be a disadvantage by providing a false sense of energy security. A refinery is useless without crude oil inputs.
For countries like Mexico and Iran, building refineries would be a big mistake.
As long as they import the bulk of their refined products it's easier to convince the population that prices should be kept at world levels, or consumption should be rationed. That separation of production and refining makes the costs of subsidies transparent.
If all gasoline were produced by Pemex, how would the government defend itself from the community activists who would accuse it of profiting from selling high priced gasoline to the poor?
Since net oil exports are defined as domestic production less consumption (in terms of total liquids), I agree that the net effect of refineries would be a wash, so I fail to see how that is a flaw in the ELM. Case #1: Export Land has refining capacity. Case #2: Export Land does not have refining capacity. The end result is the same in both cases--nine years after the final production peak, production of 1.3 mbpd is equal to consumption of 1.3 mbpd (assumptions: consumption = 50% of production at final peak, -5%/year decline rate in production, +2.5%/year rate of increase in consumption).
I suppose that if Export Land were increasing its refining capacity over the decline phase, it might have a small impact on total liquids, because of a slight increase in refinery gains, but it would be a minor effect, and there would be a corresponding drop in refinery gains somewhere else. Regarding items like fertilizer, it's a factor of course, but pretty hard to quantify.
In any case, I proposed the ELM to help me understand, and then explain, Net Export Math. Three key observations: (1) The Net Export decline rate tends to exceed the production decline rate; (2) The Net Export decline rate tends to accelerate with time and (3) Net Export declines are font-end loaded, with the bulk of post-peak Net Oil Exports being shipped early in the decline phase. Four former Net Oil Exporters--China; the UK; Indonesia & Egypt--illustrate all four of these characteristics (note that China had increasing production):
Four Former Net Oil Exporters
Production & Net Export Increases/Declines Per Year, Over the Referenced Time Frame, Are Respectively Shown (EIA, Total Liquids)
China (1985-1992)
+1.8%/year (Prod.) & -16.9%/year (Net Oil Exports)
Indonesia (1996-2003)
-3.9%/year & -28.9%/year
UK (1999-2005)
-7.8%/year & -55.7%/year
Egypt (1999-2006)
-3.8%/year & -37.1%/year
And here are the initial (first year of the decline) and final (last year before net oil importer status) year over year Net Oil Export Decline rates for the four former Net Oil Exporters (showing an accelerating Net Export Decline rate):
China
-5.5%/year (Initial, 1986) & -57.3%/year (Final, 1991)
Indonesia
-16.0%/year (1997) & -69.3%/year (2002)
UK
-38%/year (2000) & -237%/year (2004)
Egypt
-8.6%/year (2000) & -100%/year (2005)
And finally here are the numbers for 17 Net Oil Exporters showing production declines:
17 Net Oil Exporters Showing Production Declines
Production & Net Export Declines Per Year, Over the Referenced Time Frame, Are Respectively Shown (EIA, Total Liquids)
Saudi Arabia (2005-2008)
-1.0%/year (Prod.) & -2.7%/year (Net Oil Exports)
Russia (2007-2008)
-0.9%year & -2.4%/year
Norway (2001-2008)
-4.7%/year & -5.1%/year
Iran (2005-2008)
-0.5%/year & -3.4%/year
Nigeria (2005-2008)
-6.4%/year & -6.9%/year
Venezuela (1997-2008)
-2.6%/year & -4.5%/year
Mexico (2004-2008)
-4.7%/year & -13.5%/year
Colombia (1999-2008)
-3.6%/year & -8.3%/year
Oman (2000-2008)
-3.1%/year & -4.4%/year
Malaysia (2004-2008)
-4.2%/year & -16.8%/year
Syria (1996-2008)
-2.4%/year & -5.5%/year
Vietnam (2004-2008)
-3.5%/year & -46.0%/year
Denmark (2004-2008)
-7.6%/year & -16.4%/year
Yemen (2001-2008)
-5.4%/year & -11.5%/year
Ecuador (2005-2008)
-1.7%/year & -4.4%/year
Gabon (1997-2008)
-3.7%/year & -3.8%/year
Equatorial Guinea (2005-2008)
-1.45%/year & -1.46%/year
We can go back and run different assumptions for "Export Land," i.e., lower & higher rates of consumption at final peak, lower and higher rates of production decline and lower or higher rates of change in consumption (or no change), but the bottom line is that it appears to me that once production starts declining in an oil exporting country, if that country does not cut their consumption at the same rate that their production declines (or at a rate greater than the production decline rate), then their Net Export decline rate will exceed their production decline rate. In fact, that is what the 21 case histories show--over a 23 year time frame from 1985 to 2008. The only countries that came very close to almost exactly matching their production decline rate were Gabon and Equatorial Guinea, which have very low levels of consumption.
Since net oil exports are defined as domestic production less consumption (in terms of total liquids), I agree that the net effect of refineries would be a wash, so I fail to see how that is a flaw in the ELM.
It's a flaw because the ELM counts simple crude oil, not products. If Iran were to decide to build refining capacity of 500K bbl/day, their crude exports could be expected to decline by 500K bbl/day, but their refined products imports would also decline by that much. The overall oil supply situation would be unchanged, but the ELM model would show that net oil exports had fallen by 500K, suggesting a problem that didn't exist.
the bottom line is that it appears to me that once production starts declining in an oil exporting country, if that country does not cut their consumption at the same rate that their production declines (or at a rate greater than the production decline rate), then their Net Export decline rate will exceed their production decline rate.
No question. But, why is this important? What does the model add, vs a world model? If a country is exporting 100K of oil one year, and 90K the next, 10K has been lost to the world. If the country's consumption changes at the same rate as the rest of the world, then the ELM model doesn't add anything.
Let's say the whole world (including this country) is maintaining level consumption rates. If this country consumes 80k, then they just lost 50% of their exports. But, who cares, except for people in that country, who might care about internal matters such as disappearing trade surpluses? What matters is the fact that 10k has been lost to the world, and that's the same for the ELM model or a world model.
It's always interesting when I am told what my own model means. Since Net Oil Exports are defined in terms of total liquids, my intent was that production means total liquids. As I said, Net Oil Exports are defined as domestic production less consumption, and the paper that Sam Foucher and I did on the top five net oil exporters was in terms of total liquids.
I just provided 21 examples of net export decline rates exceeding production decline rates (or rate of increase in production in the case of China), and the four former net oil exporters precisely showed the same three characteristics as the ELM--the net export decline rate exceeded the production decline rate, the net export decline rate accelerated with time and the bulk of post-peak net oil exports (or post-net export peak in the case of China) were shipped early in the decline phase.
This is a graph that shows the simple year over year percentage change in net oil exports for the ELM, for the UK and for Indonesia. Export Land fell between the UK and Indonesia in terms of exponential rates of change in consumption and production. All three showed an accelerating net export decline rate. Note that a simple -5% production decline rate would plot as a flat line, parallel to the horizontal axis. This is the crucial difference between production declines and net export declines.
Since I so far have not been able to find a single example of a exporting country cutting their consumption so that their net oil export decline rate is below their production decline rate, I fully expect that virtually all net oil exporters will show the same pattern that the model showed and that the four former net oil exporter case histories showed, and Sam's best case is that the top five net oil exporters--Saudi Arabia; Russia; Norway; Iran and the UAE-- will have shipped 50% of their post-2005 cumulative net oil exports by the end of 2015.
The bottom line is the longer term pattern that I expect to see is importers bidding against each other for a long term accelerating rate of decline in net oil exports, with losing bidders having to curtail their consumption.
Since Net Oil Exports are defined in terms of total liquids, my intent was that production means total liquids.
Ah, that makes sense. My mistake. I guess I was thinking of non-liquid energy-related imports & exports, like petrochemicals, fertilizer, electricity and aluminum.
Now, when people talk about imports & exports, do they always include refined products?
I just provided 21 examples of net export decline rates exceeding production decline rates
But, who cares if net export decline rates are accelerating - we would expect them to, just as a matter of math, wouldn't we?
And, why is this more important than any other element of oil production & consumption? If US production falls or consumption rises, the US needs more imports, and bidding for imports will fiercer, right? Production or consumption anywhere matters, right?
What does the ELM add, beyond an additive world model??
Net Exports have to be defined in terms of total liquids.
If there are no examples of oil exporting countries cutting their consumption in order to keep their net export decline rate below their production decline rate, and if we expect virtually all exporting countries to follow the accelerating net export decline rate pattern that we have seen in four former net oil exporting countries, what happens to total net oil exports as more and more exporters show declining production?
To paraphrase George Orwell, I think that some consumers are more equal than others.
there are no examples of oil exporting countries cutting their consumption in order to keep their net export decline rate below their production decline rate
Why should they? Why would we expect their consumption to decline faster than the rest of the world? Or to decline faster because of export decline, unless that export decline caused obvious harm to their economy? Why wouldn't their consumption be related to world oil prices, if it was going to be related to anything outside their country?
if we expect virtually all exporting countries to follow the accelerating net export decline rate pattern that we have seen in four former net oil exporting countries
Wouldn't we always expect them to, just based on simple math?
some consumers are more equal than others.
Wouldn't be it much more direct and accurate to analyze countries' consumption levels based on their subsidy and price control systems, which actually directly control consumption?
Again, isn't it total consumption that affects the balance between consumption and production, not just consumption in exporting countries?
Let's assume for the sake of argument that world oil production falls at -2%/year from 2008 to 2018. So, in 2018, total liquids production is down to about 70 mbpd, a decline of about 18%. Let's assume world net oil exports of 44 mbpd in 2008, and for the reasons outlined above, total world net oil exports fall by half by 2018, down to 22 mbpd, which would be a net export decline rate of -7%/year, and the year to year net export decline rate would probably show an overall accelerating rate of decline.
If no oil exporting country has so far kept their net export decline rate below their production decline rate, and if the four former net oil exports precisely showed the same decline pattern as the ELM, IMO, it is a reasonable expectation that the world net export decline rate is going to outpace the overall world production decline rate, and it is reasonable to expect the net export decline rate to accelerate. This is the point that we have been making. The overall production decline rate, from the point of view of oil importing countries, is far less important than the net oil export decline rate.
BTW, an interesting post by "Solardude" on the 8/31 Drumbeat:
The Export Land Model is helpful, in as much as it points out 1) that oil exporters tend to subsidize internal consumption, and 2) a lot of exporters have falling production. It provides a nice, simple and dramatic presentation.
On the other hand, I think it oversimplifies and over dramatizes. It's an attempt to create nice, simple general rules that end up being misleading. For instance, it's simple mathematics that in countries with stable consumption and falling production, exports will show an accelerating decline in % terms, even though exports in absolute numbers are not showing accelerating decline. This leaves a pessimistic impression, when it really doesn't mean anything.
I would argue that it would be much more helpful to identify the countries that subsidize their consumption, and analyze the effect those subsidies have had.
Let's assume for the sake of argument that world oil production falls at -2%/year from 2008 to 2018.
Isn't that the key assumption? If world production was increasing by 2% per year, we wouldn't really have a problem.
if the four former net oil exports precisely showed the same decline pattern as the ELM
Does this really follow? ELM includes countries whose exports are still rising, right? KSA is an important case: we can guess that there's a risk of sharp decline, but we really don't know. For example, it was widely thought on TOD that KSA peaked several years ago, and was in uncontrollable decline - and then it raised production from 2007 to 2008. Russia has a decent chance of declining...but we don't know. The US wasn't expected to be able to reverse it's decline, but 2009 production is back up to 2005 levels (yes, it's not back up to 1981 levels, but that's not the point: it's rising, rather than declining).
The overall production decline rate, from the point of view of oil importing countries, is far less important than the net oil export decline rate.
This assumes that consumption in exporting countries is the only thing that matters - falling consumption (e.g., Japan and the US) frees up export/imports for someone else - doesn't that matter just as much?
There was a report last week that China, the largest world source of rare-earth minerals, has decided to stop exporting them to world markets
FWIW, it's a proposal, not a final decision. More importantly, rare earths are strategic high-tech manufacturing inputs in a way that oil isn't. There really isn't a good reason to hoard it - it will almost always be in the best interest of an exporter to maximize their trade surplus, rather than to subsidize inefficent domestic consumption (obviously, they don't always know this, but it's still true).
------
The ELM assumes a tight linkage between exports and consumption which doesn't exist. Some exporters control prices and subsidize consumers, and some don't. Some importers control prices and subsidize consumers.
ELM suggests hoarding, a suggestion made explicit by the reference to rare-earth export controls, but I'm not aware of any direct controls or attempts to limit exports. Rather, exporting countries tend to have the apparent luxury of protecting their consumers from the harsh realities of the marketplace. That's very different, and it's important to keep in mind that 1) such practices are counter-productive for the exporting country's self-interest, and 2) will face pressures that will tend to erode these consumer "protections".
Dear Nick
Export Land Model is country specific and is not actually related to total global production decline.
The UK production and exports decline occurred even though world production was still increasing. Do you know at what rate UK export decline was? It has gone from exporting 1mbd to nothing in 8 years, I would call that quite dramatic.
You want specific country examples, you could look at Indonesia, Egypt, UK, USA Mexico and Norway.
In these examples you would find countries where petrol is subsidized and therefore causing Oil exports to go to Zero perhaps quicker than it otherwise would have done.
You will also see countries such as UK where petrol is heavily taxed, yet this did not stop exports running down to zero did it? In other words production decline is more powerful than a tax rate of 250% on the untaxed litre of petrol.
Also both consumption and production are equally important, what is often overlooked is a country can increase production but if it's consumption increase is greater it will eventually become an importer, such as China.
So your oil production can go up and you can still end up with a very big problem.
Further anyone who is familiar with this subject will not be suprised by short term reversals in production either in a country or the world as a whole. The USA is clearly in decline and in 10 years will be producing less than it does today.
Export Land Model is country specific and is not actually related to total global production decline.
Well, that makes sense. The problem comes in when we start to use it to analyze and project world wide conditions, like total global net exports, and their effect on consumers.
The UK production and exports decline occurred even though world production was still increasing.
Sure. That's always been the case - look at Pennsylvania.
In these examples you would find countries where petrol is subsidized and therefore causing Oil exports to go to Zero perhaps quicker than it otherwise would have done.
Which ones? Not UK, USA, Mexico and Norway.
Have you seen an analysis by anyone to quantify the effect?
production decline is more powerful than a tax rate of 250% on the untaxed litre of petrol.
The UK has had high tax rates for quite a long time, so we wouldn't expect to see a recent decline in consumption purely due to taxes.
a country can increase production but if it's consumption increase is greater it will eventually become an importer,
Sure. That's why I would argue that we need to look at all countries production and consumption, not just those whose exports are declining.
The USA is clearly in decline and in 10 years will be producing less than it does today.
That's reasonably likely, though I see no indication that it's inevitable. There's clearly quite a bit of potential left both on and off-shore in the lower 48, and in Alaska. If it does decline, it's reasonably likely to be very slowly, which makes a big difference.
I am not sure what the untaxed cost of petrol is in all countries, but if you look at this link.
http://news.bbc.co.uk/1/hi/world/asia-pacific/4296320.stm
Indonesian prices have been subsidized by the government and people will obviously buy what they want, if they can afford it. So the question is how high do prices have to go to get demand to fall substancially.
A look at the effect of the price increase in Indonesia may tell us something, my guess is it would not have much of an effect.
Also you are not correct about Mexico, it does subsidize petrol.
http://www.latinbusinesschronicle.com/app/article.aspx?id=2519
It should use money to find new fields, but this goes to show governments often do not do what is best for the country.
Looking at other oil producing countries which went from exporting to importing, even high tax not reduce demand, only severe recession did that.
The trouble with most oil exporting countries is they used money often to make their own citizens fuel cheap. If any had spent that money creating a ultra modern and cheap public transport system then maybe we could say here is a country to follow.
The eia has data on production and consumption of practically every country, most I have looked at have increasing comsumption.
Mexico, it does subsidize petrol
If you look closely at the article, you'll see that this was a temporary measure, at the peak of oil/gasoline prices.
Looking at other oil producing countries which went from exporting to importing, even high tax not reduce demand,
The UK has had high tax rates for quite a long time, so consumption was already pretty low. We wouldn't expect to see a recent decline in consumption due to taxes.
practically every country, most I have looked at have increasing comsumption.
It depends both on their stage of development and how freely prices move.
Markets do work, when they're allowed to.
Sorry you are not correct on this, Mexico has subsidized fuel costs for years.
http://www.eiu.com/index.asp?layout=ib3PrintArticle&article_id=180437296...
http://banderasnews.com/0805/edat-mexgamble.htm
With regard to the UK, it is now an importer of oil, the question is what would work. Market forces as you put it, simply means prices so high that many reduce or stop consumption. This is the sort of market forces in Egypt where many were reduced to feeding their family one meal a day due to high cost of rice etc.
Back to ELM you are correct in that all countries need to be looked at, once more than half of all export volume is in decline we would then be at global export decline. Then only market forced reduction in any country will release oil to the global market, we may find this cost to be very high. We will probably find that many countries will keep that oil to ensure sufficient fuel for emergency services and army.
Mexico has subsidized fuel costs for years.
Interesting. It looks like the subsidy was pretty small before the peak in oil prices, has returned to being pretty small (the price in March was $.73/liter, which is pretty much a market price), and may be phased out:
"In 2010 petrol consumption should resume, but growth will be moderate as the government gradually reduces the petrol subsidy in order to ease pressure on the public finances."
This is the sort of market forces in Egypt where many were reduced to feeding their family one meal a day due to high cost of rice etc.
That's food - there aren't substitute for food staples. On the other hand, there's lots of substitutes for oil consumption in personal vehicles: carpooling, telecommuting, mass transit, hybrid vehicles, electric vehicles, etc.
only market forced reduction in any country will release oil to the global market, we may find this cost to be very high.
A sustained price over $70/bbl will drive substitutes. A sustained price over $100/bbl will do so quickly.
We will probably find that many countries will keep that oil to ensure sufficient fuel for emergency services and army.
Emergency services don't consume much fuel. Armies, on the other hand, will surely have first access to strategic reserves. Still, armies also only consume a relatively small % of fuel. The US DOD is one the prime sources of funding for solar, wind, and batteries (Guantanamo, the US base in Cuba, is 1/3 wind powered), and is moving to hybrid tanks, etc.
This looks good study
http://sciencepolicy.colorado.edu/prometheus/archives/energy_policy/0014...
Yes, that's good.
The New York Times article is the real source of information, and it's interesting.
"China raised gasoline and diesel prices on June 21, though still keeping them below world levels. World oil prices plunged more than $4 a barrel within minutes on the expectation that Chinese demand would slow."
We see that price control & subsidy policies are more important than whether the country is an exporter or importer:
"The oil company BP, known for thorough statistical analysis of energy markets, estimates that countries with subsidies accounted for 96 percent of the world’s increase in oil use last year — growth that has helped drive prices to record levels."
Basically I feel that an oil exporting country would remain an exporter longer, if it did not subsidize fuel and provided cheap public transport. I think many countries will continue providing cheap fuel to their citizens and cause themselves financial problems. The most harm will be done by these policies in big exporting countries because they can afford them more easily.
Here is a study I found showing how extensive subsidized fuel is in latin America.
http://www.olade.org.ec/documentos2/Subsidios_ENG.pdf
Seems derivative as any book will be given the number on the subject.
Unfortunately it does not add any insights worth the effort of a quick scan judging by this abstract.
A simple illustration: Food production is the biggest and most significant use of oil in the West today.
Totally not in this abstract and I am totally out of here;¬)
Dag, the summary posted above for the 150th anniversary of the Titusville well is a brief summary of the first of 20 chapters.
Does the abstract, introduction or conclusion state unambiguously that 'food production' is the major use of oil in the West.
Failure to articulate the above would be what us oilers come to expect from the uninformed , professional scribblers or authors with hidden agendas.
None of which applies to you I am sure;¬)
'food production' is the major use of oil in the West.
Well, first, that would have to be true, and it isn't. Agriculture accounts for maybe 2% of US oil consumption.
Embedded energy, you person you - end of debate.
Good night.
And where did you get the information that embedded energy was especially important to agriculture?
You either are an irredeemable person, or an irredeemable tool of the government.
In both cases I am not wasting more time on you, if anyone doubts production of food in the US eats up the lions share of your oil imports do a Google search using something like this string, 'proportion of oil imports used for food production' and read.
I appreciate your enthusiasm, but you need to get your information straight. Also, avoid personal attacks/ad hominem - it alienates anyone you're trying to convince, and is against the rules here.
For a profile of oil consumption in Australia, see here: http://anz.theoildrum.com/node/5709#more
You'll see that agriculture uses 5% of Australia's oil.
I think your concern is about agriculture's dependence on oil - you might find this helpful: http://energyfaq.blogspot.com/2008/09/can-everything-be-electrified.html
OK, matey. You have hoisted your self up the yard arm.
Teacher he is being nasty this:
You have launched a personal attack on yourself by your own postings: 2% on your first post, 5% on you second and a different country.
Last refuge of a * is the law.
I am not trying to convince anyone you are the person throwing around references.
I am a qualified scientist I imagine you are not.
As you obviously don't understand the Laws of Thermodynamics or are trying to negate their existence.
http://www.eroei.com/articles/the-chain/oil-and-natural-gas/
I suggest you note the latest addition to the Oil Drum.
http://netenergy.theoildrum.com/
Not going to check your response I would prefer contact with hostile aliens;¬)
a personal attack
A personal attack is...an attack on a person, not an apparent internal data inconsistency.
2% on your first post, 5% on you second and a different country.
And doesn't it make sense that the % would vary slightly between countries?
I am not trying to convince anyone
Then why are we having this discussion?
I am a qualified scientist
If so, you should be able to find the information you need. Don't forget, on TOD authority (professional or otherwise) doesn't matter - all that matters is the information you bring to the table.
the Laws of Thermodynamics
How are they relevant? Has anyone suggested that energy is not being conserved, or that entropy is not increasing?
I looked at your references. I don't see any information about the % of oil consumption by agriculture. I do see arguments about ag being dependent on oil - did you look at the discussion I referred to?
This is just for anyone curious with an intellect.
One word 'Swenson' - that bloke who heads ASPO USA:
http://www.lawofmaximumentropyproduction.com/
So being highly organised is just an efficient form of enthalpy.
Systems follow the route to enthalpy by increasing complexity using more energy.
Some creatures seem to be fond of percentages as they do not have eyes to see the naked science:
'SOME UK FOOD STATISTICS
UK food supply chain
UK food retailing market was worth £103,800 million in 2001
Food manufacturing is the single-largest manufacturing industry in the UK
Food supply chain employs 12.5% of the entire workforce in the UK
Food supply chain contributes 8% to the UK economy
Food and drink accounts for 21% of weekly household expenditure
Food supply chain and unsustainability
Food supply chain is the largest energy user in the UK
Food production and distribution contributes up to 22% of the UK’s total greenhouse emissions
Food travels further than any other product - 129 km compared to the average product travel of 94 km
Wages in the food industry are notoriously low compared to other sectors
Nearly 30% of household waste is food waste'
http://www.energybulletin.net/node/5045
Proper references are included at the end of the article found at the link given above.
http://www.youtube.com/watch?v=sa5XlWWPSmU
Thats what I'm talkin' about, go get em' Dag. I'm savin' that for the next paid shill.
Food production and distribution contributes up to 22% of the UK’s total greenhouse emissions
Well, this is on point, but
first, this is greenhouse emissions: a large part of this is methane from cow digestion, not CO2, and this doesn't tell us anything about oil consumption,
2nd, what does "up to" mean?
3rd, there's no reference/source for this. I found one unreferenced statement elsewhere that the actual average was 15%, but again they had no references.
This article is about agricultural dependence on oil. I agree that this is a valid concern.
If you're interested in solutions, see here: http://energyfaq.blogspot.com/2008/09/can-everything-be-electrified.html
WHALE OIL = LUXURY
Note the pervisity of so called New Economists. A leading defender of NE; who officially believes in Climate Change and does not believe in Peak Oil, uses the whale oil crisis of post-1860 as a handy support to the idea that creative investment scams will get us out of any fuel shortage
Official New Economics dogma on oil depletion, or running out of anything and wrecking the planet's natural systems doing so extends to this rationale: Using up oil, gas, coal and uranium as fast as possible and starting with oil will accelerate the invention or production of neat substitutes and replacements. Experts in this folksy rhetoric like the former president of the European Bank for Reconstruction and Development, which helped organize the modernizing rout in postcommunist east Europe, claim the collapse in whale oil supplies after about 1860, due to the poor things being hunted to near extinction was a good thing. Jacques Attali goes on to claim that electric street lighting was "invented" because whale oil couldnt light the dark and dangerous streets of US and European cities at that time. Running out of whales started the electric street lighting business, of course using coal, oil and gas for power generation.