Verifying the Export Land Model - A Different Approach
Posted by Gail the Actuary on October 1, 2010 - 9:27am
This is a guest post by George C. Lordos, of Nicosia, Cyprus, known as Lumina at The Oil Drum. He has degrees in Philosophy, Politics and Economics from Christ Church College at Oxford University and in Business Administration from the MIT Sloan School of Management, where he specialized on strategy, finance and system dynamics. George has business interests as a Principal/Chairman in food trading, energy efficiency, renewable energy and information technology. He also makes a hobby of blogging about sustainability, energy and finance. George's blog is at baobab2050.org.
The Export Land Model of forecasting future oil supplies available for sale to oil importing economies, which as far as I know was first presented at the 2007 ASPO-USA conference by its authors Sam Foucher and Jeffrey J. Brown, takes my “Cassandra Prize” for its importance and for the deafening silence with which stakeholders have been reacting to it, despite the mainstream media giving it some coverage.
In this post, I use a different way of grouping countries to confirm key insights of the Export Land Model.

Note: For all images, click on figure to view full size version.
In this analysis, a 30-year data set on oil production and consumption which is made publicly available by the U.S. Energy Information Administration is analysed in an effort to confirm the two key insights of the Export Land Model (ELM). These insights, as I understood them, were the following:
1. For oil exporting nations, the higher the level of their domestic oil consumption as a fraction of their production, the more the changes in production volume will amplify the resulting change in net exports.
2. The domestic oil consumption of oil exporting nations will, over long periods, tend to grow faster than the domestic oil consumption of oil importers because of the windfall effect of oil revenues, and will tend to continue to grow even past the production peak, especially whilst net exports remain positive.
In a country that is past its peak of oil production, the above dynamics operate together to cause the net export decline rate to be much higher than the production decline rate. If this effect appears simultaneously in many exporters, for instance due to global peak oil, the accelerated decline in net exports will disproportionately strike nations which are heavily dependent on imported oil.
The analysis, which follows below, confirms that both key insights of ELM are consistent with real-world global production, consumption and net export data from 1980 to date.
PART I: THE SUMMARIZED DATA
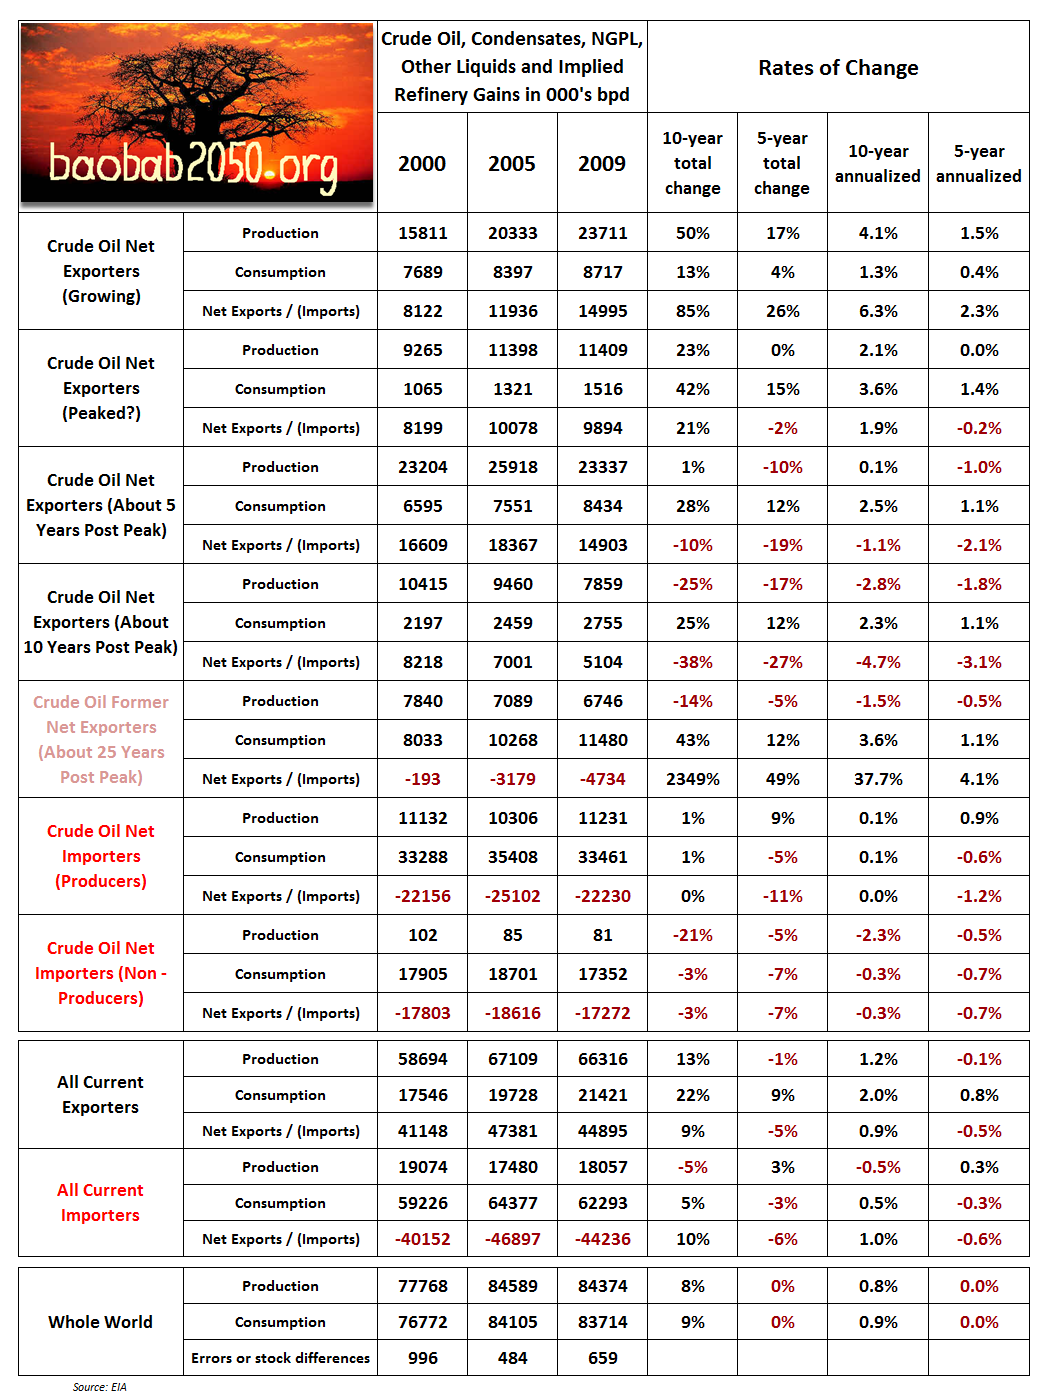
All of the figures in this post are drawn from a summarized data set, an extract of which is shown below:
Click here for a listing of the countries assigned to each grouping.
There are currently 44 countries / territories that are net exporters of crude oil, who therefore supply the requirement of 173 countries who are net importers – and only about a quarter of the latter have some production of their own. At least from the perspective of countries who are heavily dependent on net oil imports, the continued availability of oil on world markets at a reasonable price that their economy can bear is a key factor affecting long term economic and social stability. In Table 1 above, we note that net oil exports of all current exporters are down 5% from their 2005 peak volume.
PART II: CRUDE OIL NET EXPORT ANALYSIS, GROUPING EXPORTERS BY THEIR GROWTH RATE IN NET EXPORTS
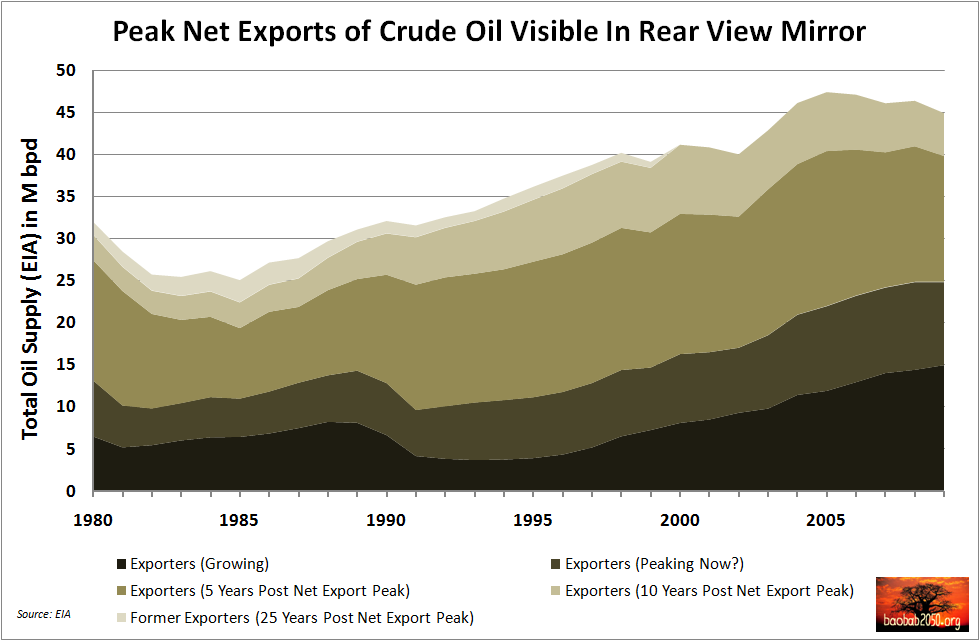
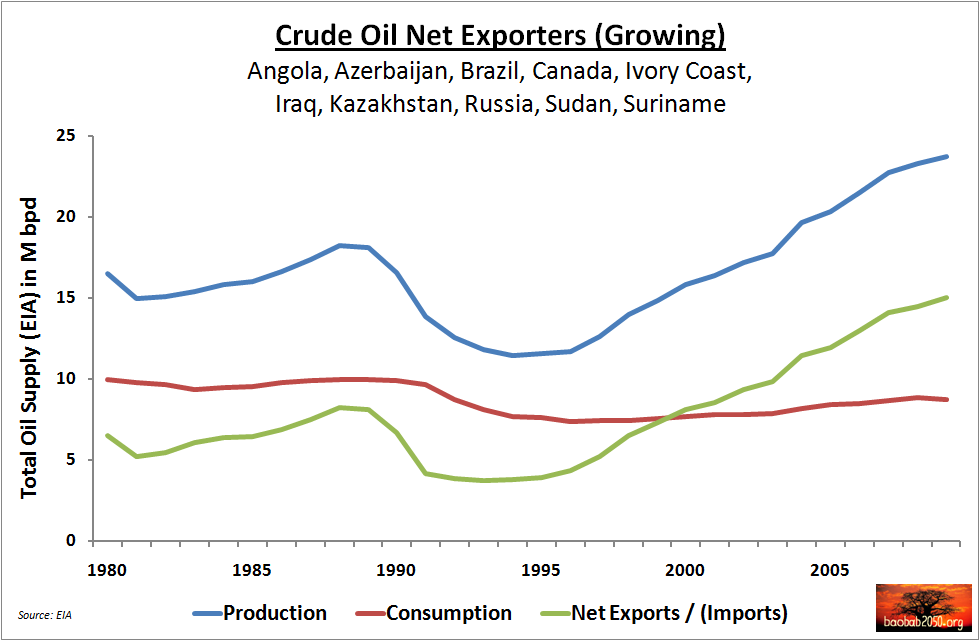
From studying the EIA data, I identified 10 countries which are still posting strong growth in their net exports, which is the green line in Figure 2 below. Together, these countries account for approximately one third of today’s global net exports. Note that this group includes Russia, which suffered a massive production and consumption collapse in the wake of the 1991 implosion of the former Soviet Union. Over the last 10 years (see Table 1 above) this group of countries posted a 50% increase in their crude oil production, a 13% increase in their domestic consumption, and an 85% increase in their net oil exports. This is consistent with both key insights of the ELM.
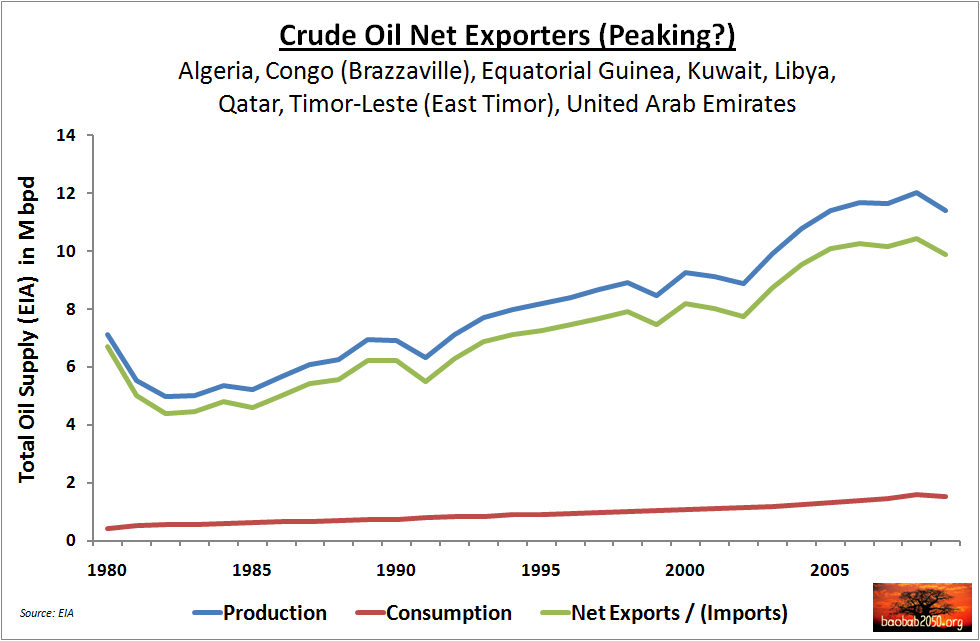
The next group consists of countries which up until recently had exhibited strong net export growth, but have since stalled. Their growth rate in consumption (42% over 10 years) in parallel with their past strong net export performance is consistent with the second ELM insight. The fact that their net export growth rate is neither amplified nor attenuated by the 10-year change in their production rate (they are roughly equal) might also be weakly consistent with the first ELM insight because right at the peak of net exports, the effect should logically change over from amplification to attenuation. I therefore tentatively labelled these exporters as “Peaking?” in Figure 3 below:
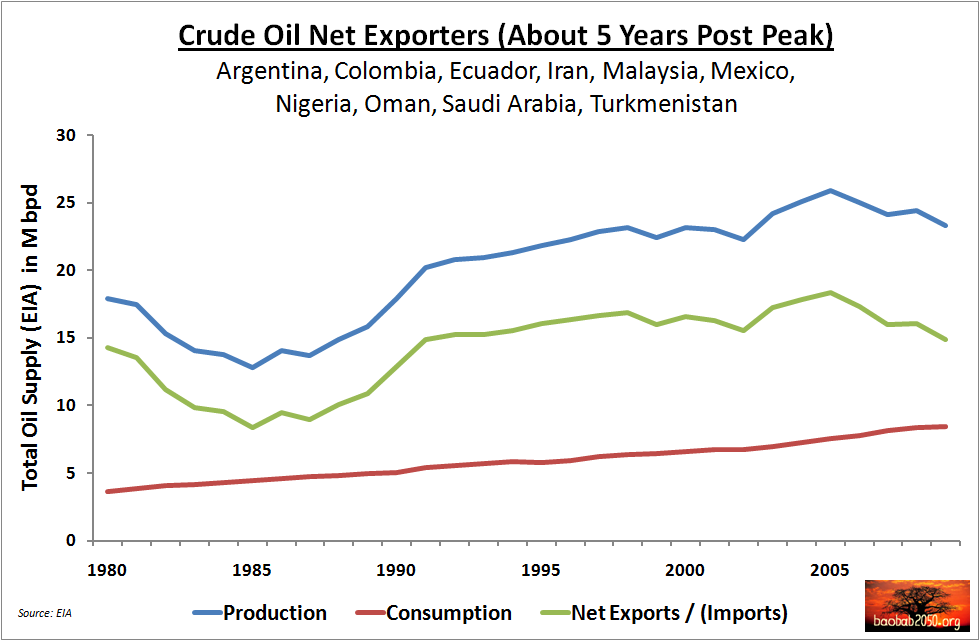
Then, going down the pecking order of net export growth rate, I grouped together the net exporters where I felt more certain about the peak in their net exports. This group experienced a fall in production of 10% over the last 5 years, and together with a 12% domestic consumption increase, they ended up posting a 19% decline in their net exports. This is consistent with both the key insights of ELM. Collectively, their net exports display a clearly visible peak about 5 years ago, as shown in Figure 4 below:
The next group in Figure 5, where net export declines collectively set in an average of 10 years ago, appears to be in terminal net export decline. These countries are in the twilight of their net oil exports. Over the last 10 years, their production has fallen by 25%, domestic consumption rose by 25%, and net exports are still positive but they are down by 38%. This is also consistent with both key insights of ELM.

And finally, the destiny of every oil exporter – a destiny that ELM predicts will strike sooner than most people realize. In Figure 6 I show all the countries which were formerly net exporters, but have since collectively become net importers – with their collective net export peak occurring over 25 years ago. The zero net exports threshold was crossed in 2000, and since then, production has fallen by only 14%, but consumption has risen by 43% – largely thanks to China.

This last group of “former exporters” also confirms the key insights of ELM, but more importantly it amply demonstrates the main reason why ELM should be taken a lot more seriously: although it will take many decades for production from this group to approach zero, their net exports have already been less than zero for one decade. The rapid onset of net export decline is thus “baked into the structure of the global oil system” and all net importers, especially those who have no oil production of their own or few geopolitical chips to bargain with, can only ignore this at their peril.
The implications of ELM for the “health” of a world economy addicted to its daily dose of 85 million barrels of crude oil are serious, and they are mostly being ignored. To some, the two key insights of ELM might seem mathematically trivial and obvious, but out there in the real political economy it is important to confirm the trivial and obvious with real data. It is doubly important in the case of crude oil, because the focus of mainstream media is entirely misplaced: they don’t often go past discoveries, additions to reserves, or maybe production figures if we are lucky.
To sum up this section, and referring back to Figure 1 and Table 1 at the top of the post, apart from the 5% decline in total net exports relative to the 2005 peak we also note that the volume of net exports from the two groups of declining exporters is 20m bpd, which is currently more than the 15m bpd volume of net exports from the group of growing exporters. We also note that the 5-year annualized net export growth rate of the 15 million barrels of the growing group is 2.3%, but the weighted 5-year annualized net export decline rate of the two declining groups is 2.4%. The “peaked?” group, sitting in between the growing and declining groups, exports 10m bpd and their 5 year annualized net export decline rate is almost zero (-0.2%).
Of course these are snapshot comparisons and not fitted trend lines, but this volume and growth rate comparison between growing and declining exporters is nevertheless significant, as it implies that in our immediate future we will see a probably downhill-inclined plateau of net exports. Indeed, fitting a least squares trendline to the 2005 – 2009 production plateau which most people expect to continue, and a long term consumption growth trendline going back to 1996 when the FSU appears to have stopped collapsing, I got these results for a 2010 – 2015 projection of production, consumption and net exports (Figure 7):
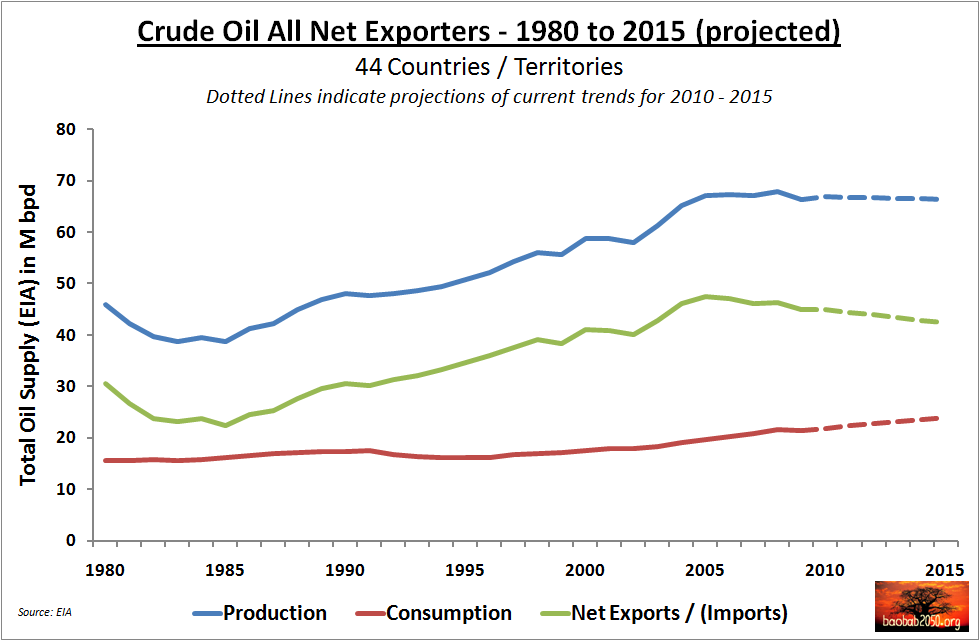
Put in different words, any “plan” to grow total net exports will face the headwinds of (a) having to replace large volumes of declines from the 20m bpd declining group, (b) having to also replace increasing declines from the 10m bpd “peaking?” group, and (c) the growing group possibly speeding up their consumption growth rate to levels similar to those of all other current and former net exporters (see Figure 11 below). Considering that net exports are already 5% below their 2005 peak and that near-term trends are biased towards a downhill rather than an uphill plateau, it is more likely than not that global net exports have already peaked. Therefore, I am going out on a limb and calling 2005 as the peak year for net oil exports – barring any big surprises such as many net exporters suddenly deciding to start investing in cleantech in a big way!
PART III: THE OTHER SIDE OF THE COIN – NET IMPORTERS
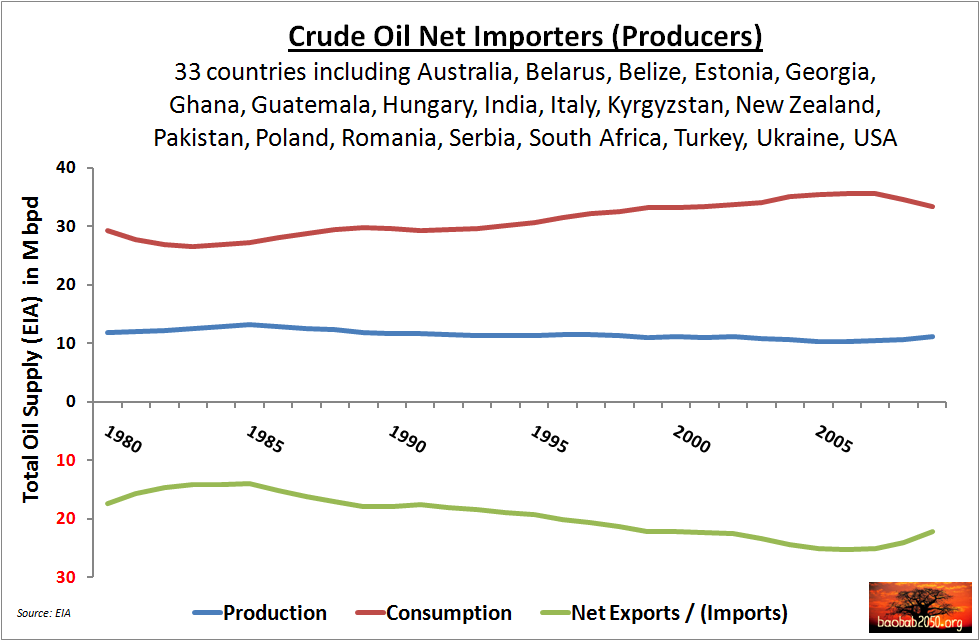
If the peak in net exports is behind us, what happens to net importers? Clearly, the groups of importers who have some production of their own, including all the countries in Figure 6 and some of the countries in Figure 8 below, will have more options available to them as the unavoidable efforts to reduce their economy’s dependence on oil only have to go as far as needed to support the demand with their own production.
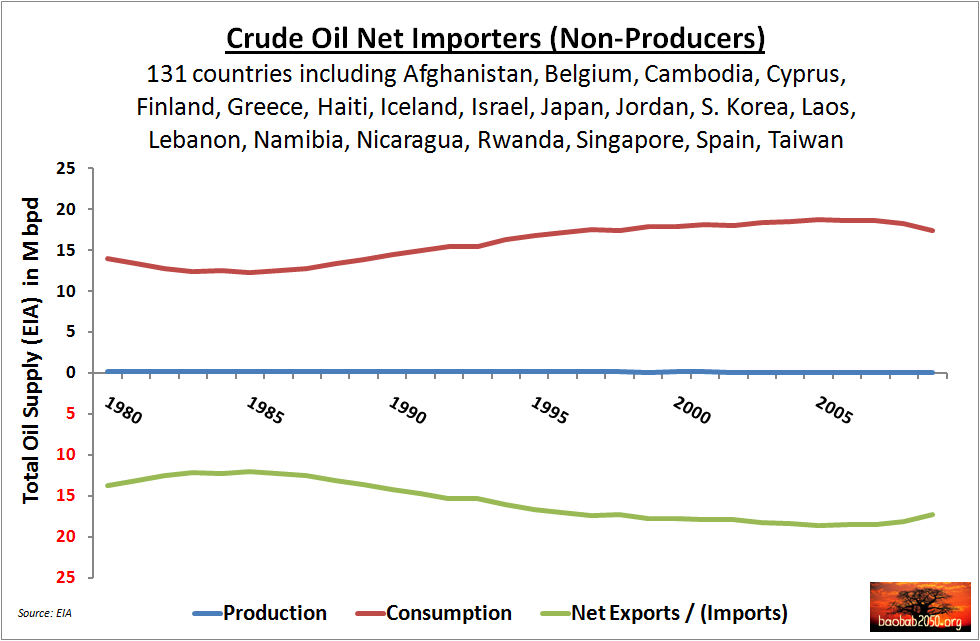
The situation of this group is at least a little more bearable than that of the much larger number of countries – including Japan, South Korea and many E.U. member states – who have no production of their own (Figure 9 below), some of whom will have to wean themselves off oil entirely if they lose access to the world oil markets as shortages of net exports develop.
The situation of most importer countries is made more complicated because it is very unlikely that large, powerful nations will “play nice” and scale back their own import requirement to allow a smoother adjustment for every importer. China has been busy sealing long-term resource purchase agreements in Eurasia and Africa using clever devices to lock in supplies such as pipelines from Siberia and joint venture refineries in the Middle East and Africa, and U.S. troops are all over the Middle East, particularly Iraq which is one of the few potential future growth stories left. It is hard (though not impossible) to model this, but the likely picture past the second decade of this century is that small or geopolitically weak importing countries will pay exorbitant spot prices for crude oil and be confronted with increasingly unstable oil supplies and wrenching emergency adjustment pressures.
PART IV: CONFIRMATION OF THE EXPORT LAND MODEL
The purpose of this post was to find empirical validation of the two key insights of the Export Land Model in real-world data. We analysed production, consumption and net export data for every country in the world from 1980 – 2009 and have found proof that both key insights of ELM are consistent with real-world data. Figures 10 and 11 speak for themselves.

PART V: METHODOLOGY AND REFERENCES
I obtained production and consumption data of “Crude Oil, NGPL, and Other Liquids” from the 1980 – 2009 International Energy Statistics supplied online by the EIA. I then adjusted the production data by a factor of 101.5% to 102.5% to incorporate the appropriate refinery processing gains for each calendar year, thus attributing the RPG’s back to the source of the crude oil. This adjustment is essential to remove noise and obtain a fair picture out of net export data, given that my definition of Net Exports is “Production – Consumption”. Then, using the first year of their independence as my benchmark, I back-casted and pro-rated the production and consumption of “former” countries (USSR, Yugoslavia, Czechoslovakia and Serbia & Montenegro) into the component countries, so as to have a 30 year data set for all of today’s countries. I also merged East and West Germany into “Germany”, and I merged UK and Dutch offshore production figures into the mother countries. I then calculated net exports for each country by simply subtracting consumption from production.
The grouping was accomplished by first calculating “cumulative production to cumulative consumption” ratios, one over the full 30 year period, and another over the last 3 years, and then by grouping countries in descending order of net export growth rate based on these ratios and on the actual 30 year net export history. Other people may group certain countries differently, because for some countries the data may show stagnation or even decline, but the potential to be in a faster-growing group might still be there (Venezuela and Libya come to mind). However, as there are so many unknown unknowns, I decided to stick with what the data has been saying, for better or for worse.
The Export Land Model (ELM) is explained in the following two posts by its original authors:
Declining net oil exports–a temporary decline or a long term trend? – by Jeffrey J. Brown and Samuel Foucher
A quantitative assessment of future net oil exports by the top five net oil exporters – by Jeffrey J. Brown and Samuel Foucher
Contact
- Content: editors at theoildrum dot com
- Tech support: support at theoildrum dot com
License

This work is licensed under a Creative Commons Attribution-Share Alike 3.0 United States License.
Thank you Gail; I got a lot out of reading TOD over the last 4 years and I am happy to contribute something of my own in return!
Thanks, George for the post.
This is an interesting way of looking at things.
It seems like theoretically, there is also a group of countries for which things change going forward--say Iraq suddenly develops a lot of oil production, or Saudi Arabia, or Brazil, or Russia (perhaps near the North Pole). This is what keeps things interesting--and is why we can't just project the past forward.
There could also be changes of a negative sort. Say, Venezuela is not able to pay its bills, and its production drops greatly. Or Ghawar suddenly starts significantly declining in Saudi Arabia, and can't be replaced.
Gail is likely right on this.
Using Iraq as an example, you can disprove the hypothesis. I have the formal definition of what you want to prove a little down in the thread: http://www.theoildrum.com/node/7007#comment-727657
It is really this relation that needs to universally hold:
d(TOC)/dt - d(TOE)/dt > 0
This says that the rate of change of oil consumed by a country is greater than the rate of change of oil exported by a country. In the case of Iraq, by invading the country, the USA could force that country to increase the rate of exports so that d(TOE)/dt > d(TOC)/dt and thus pushing the above relation into negative territory.
Bottom-line is that geopolitical events can violate the model or just the rare statistical anomaly, as Gail points out. This makes it nothing more than a heuristic. Heuristics are not verifiable, but just reflect the empirical data collected. If the observations change significantly, it doesn't disprove the heuristic, you just need to find a different heuristic.
There were two reasons for my choice to group all exporter countries together. First, if I had tried to show each one individually, the info glut would have obscured the exposition of the argument. Second, by grouping countries in "peer groups" based on whether they were pre- or post- peaked (and by how much) with respect to net exports, it is possible to see the endogenously generated patterns in the data which "bring the ELM insights to life" without getting lost in the exogenous noise caused by individual events in individual countries such as wars, economic collapses, etc.
Say that at some point in the future, all Muslim countries decided to prohibit oil from going to any Western countries due to some dogmatic decisions of their rulers.
This would also verify the outcome of export model but not for the reasons that the original model intended. The point is that it is hard to separate out the noise from anything you are trying to verify when it comes to these events.
Gail, I thought about this for a long time while planning the article. In the end I concluded that "things also changed" in the 30 years since 1980, with various ups and downs for various individual countries, yet the big picture was still clearly visible in the data once you aggregate at least 10 or so countries together based on them being in similar stages of their "net exports lifecycle". It is probably the good old central limit theorem at work - the independent random variations in output or consumption of individual countries were mostly absorbed by the sum of the respective variables for a peer group which shares the basic characteristic being studied.
So, that was why I didn't pull out these countries to form a separate group. I thought about it, but I decided to go with the historic rate of change of net exports and ignore my knowledge of POTENTIAL future changes, "for better or for worse" as I said in part 5 of the article.
Nice summation, George.
Is there a mistake in figures 8 and 9?
I'm referring to the double listing of Ghana in both figures. Did you perhaps intend to list Germany in figure 9 with the "non-producer importers"?
Lumina,
Thank you and a question!
Of your professional peers, how many are peak oil aware?
Of course I realize that your answer can be no more than an educated guess.
If there are any MBA and Doctoral candidates in business and economics among the audience today, I am sure the members of this site are interested to hearing what is being said in the classrooms in respect to peak oil.
Oldfarmermac, I have one uncle who is aware, and that's about it. Last night I met someone who came close but he was not aware either. This is not a scientific poll of course ;)
Lumina,
Considering that you move in the rarefied circles of those educated at Oxford and MIT in business and economics,it appears that there is essentially no hope whatsoever of the bau establishment coming to grips with the coming energy crisis until after it breaks over us like a hurricane in the days before there were weather forecasts.
The only silver lining I can find in your comment is that it helps prove my arguments in respect to religion.
People who still believe in a God or various Gods are not any less intelligent than the rest of us; they are simply relying on what they have been told by people they trust and look up to as thier leaders-just like your peers who hold advanced degrees in business related fields and are trained to do research.
Trained they may be, but it seems rather obvious they can't see the forest because all the trees are blocking thier view!
I get a regular scolding from the faithful among those who worship in the church of science for pointing out that the high priests of the church are simply men and women who put on thier pants and dresses just like the rest of us, ignoring whatever it suits them to ignore while minutely documenting any arguments that favor thier agendas.
In respect to fossil fuels, the entire climate establishment more or less swallowed the cornucopians arguments in respect to ff reserves hook, line, and sinker, as it was politically expedient to do so at the time.
Joe Sixpack has heard so many doom and gloom warnings over the last few decades that he has learned to ignore them as nothing more than the pranks a the little boy in a white lab coat crying wolf.
When the wolf finally does make his appearance.........
I am not sure PO will "hit us like a hurricane". I am firmly in the camp that believes that PO occurred in the 2004-2008 timeframe (C+C -All liquids may be later) and one of the results is oils role in the GFC. Economists are now increasingly talking about a double dip recession. If the PO hypothesis is right, it won't be W shaped, but L shaped and we can expect the current situation to persist for a very long time. More unemployment, more businesses going bust and the establishment in continual denial. There will be statistical, timing and regional changes in recorded economic growth that will obscure the real underlying issue, but PO will never be acknowledged by the establishment. We can also expect a great number of social, economic and environmental trends to worsen and/or continue to worsen. All that we will see on a year to year basis will be small trend changes. JH Kunstler called it The Long Emergency. It is really The Long Grind Down. One way of measuring it would be to take a number of statistics and compare them on a decade by decade basis.
It could be like a slow motion train wreck, or it could be like OFM's hurricane when the markets realize what is happening and go through a panic dive. Don't forget the tipping point section of the German military think tank report, which supports the hurricane scenario;
• Banks lose their business base. Cannot pay interest on deposits, because they can not find creditworthy companies.
• Loss of confidence in currencies. The belief in the value-preserving function of money is lost. It only comes to hyper inflation and black markets, then to a barter economy organization at the local level.
• Collapse of value chains. Labor processes are based on the possibility of trade in precursors. The processing of the necessary transactions without money is extremely difficult.
• Unbound monetary collapse. If currencies lose their value in their country of origin, they are no longer exchangeable for foreign currency. International value chains collapse as well.
• Mass unemployment. Modern societies are organized labor and have throughout their history ever differentiated (specialized). Many professions have to deal only with the management of this high degree of complexity and nothing more with the direct production of consumer goods.
• State bankruptcies. In the situation described, state revenue is unable to cover expenditures. The possibilities of additional debt are extremely limited.
• Collapse of critical infrastructure. Neither the physical nor the financial resources now exist for the maintenance of adequate infrastructures. The problem is compounded by the high degree of interdependence between infrastructure subsystems.
• Famines. Ultimately, it will provide a challenge to produce and distribute food in sufficient quantity.
I agree. It could be quick, but it seems unlikely as of right now. "Slow motion train wreck" is a good metaphor. The slow motion won't in case be that slow. It will just appear slow. The establishment showed they could "manage" the GFC using stimulus. They can continue to do that but their options are much more limited. As it is we are seeing govt. contract in various US states and even quite large countries like the UK as well as smaller ones like Greece.
Agree it could go either way. My view however is it will descend in drop downs, just as the 08 collapse was a drop down. Oil goes up in price leading to collapse, followed by cheap oil, increasing economic activity (which is building slowly now), oil price rises and then another step down. I'm guessing the next step down will probably occur in 2011 or 2012.
Hi, OFM.
Am current third year undergrad (Econ and Politics). Not a single one of my ECON lecturers knew about, P.Oil, Expt.Lnd.Model, or the FIRE econ.!!!!! I asked. Shook heads slowly!
Brian P
What's the FIRE econ?
I believe it stands for "Finance, Insurance, Real Estate". It is an umbrella term for all the legalised Ponzi schemes that are out there :-)
I work in professional environment in a finance related field in Asia. I would guess that if you asked people if they have heard of peak 80-90% would say yes, although few would know much about it.
But an increasingly large number of governments and companies speak prominently about adapting to a future world with less energy, often in official publications.
I would expect that everyone working in resource related fields knows something about peak oil. I don't think this was true five years ago.
Good catch, I deleted Ghana from Fig 9. Sorry about that.
I don't understand the title of this post, especially the point about "verifying". Of course the general idea of export/imports is correct and it really doesn't need verification. It is not so much a model as a definition, and you needn't verify a definition.
So this is the definition:
TOC = Total Oil Consumed by Country
TOE = Total Oil Exported to other Countries
Total Oil Produced = TOC + TOE
So to get it in to something that you can verify, you have to postulate an assertion that you can try to falsify.
Perhaps this is the assertion that you would want to verify:
d(TOC)/dt > d(TOE)/dt
This says that the rate of change of oil consumed by a country is greater than the rate of change of oil exported by a country. By itself, this has an infinite number of solutions and is more of a heuristic more than anything else.
Another way to express this is the following:
d(TOC)/dt - d(TOE)/dt > 0
This says that the rate of change of (consumption - export) is always positive.
So to prove this, then you have to plot this on a graph and show that every slope of (consumption - export) for every country in the world is positive. If it doesn't hold everywhere, then the model can not be verified. But then again it doesn't really matter because it is just a heuristic anyway and a heuristic can change depending on what the observations are.
I guess my point is that to do a real verification, you have to formulate the definition into mathematical terms and then demonstrate that the result holds over all possibilities.
I am the one to blame for the title.
It seemed to me that with respect to consumption, what George is doing is calculating what happens in practice for exporters and for other groupings. So in that way, he is verifying that what is expected happens in practice.
In that case, OK, because I don't think the export land model heuristic would have ever been proposed unless it matched what the observations were. The reason to have heuristics is to provide convenient shorthands so people can describe what is happening without having to fundamentally prove anything. Its really a "rule-of-thumb"; people that have used that figure-of-speech before will know what this means.
For example, if it was really hot today, it will be hot tomorrow. That rule-of-thumb holds in the summer. The converse holds if it is in winter. No way to verify this for every case but it works reasonably well.
You know ... we are going to look back over this period and recall it as a 'Golden Era' of plentiful automobiles and parking spaces, cheap(er) hamburgers, 'Entertaining' Tea Party politics, 'Sparkling' reality (ahem) TV and 'Recovery'.
Johnny Heuristic sez we are recovering today therefore we will recover more, tomorrow. Is it winter or summer? Who cares!
Dealing with rates of change during golden eras is very hard to do. How to see where the rates actually change before they do so can be disconcerting. I don't think this export land biz is easy to predict.
Right now, the driver of the rates is the return in hard currency from exports is greater than the rates of return from development (which is driven by the rate of return from hard currency). Hard currency is gained by exporting fuel.
Fuel exporters import hard currency. What matters to fuel exporters is replacing currency imports, regardless of source.
An example of the effect of the change can be seen in Mexico, which has declining hard currency returns from fuel exports but increasing hard currency returns from non- fuel exports (excluding drugs?) mainly automobiles and parts.
Exporting autos/parts inevitably forces hard currency returns to Mexico (increase in fuel imports into USA raising real price). What would the feedback loop be? It's really hard to say at this point.
China is trying to export fuel in the form of solar panels and wind turbines (along with rare earth metals). China will as a consequence import more hard currency while exporting hard currency to purchase more petroleum for its expanding auto fleet. Which will expand faster?
I think a set of converging rate curves can be calculated as (fuel import rate/currency import rate) change in output as GDP - GDP2/time or some such to see if a country can make money selling marijuana fast enough to offset declines in fuel exports.
Of course, the world cannot run on marijuana but it can have fun in the interval ...
It was precisely the point, made in the post, that in the real political economy (the one where political actors distort scientific truths) even definitions need to be verified against data in order to drive home a point.
In addition, the post proves (fig 11) that all exporters grow their consumption faster than the control group of importers, which is an empirical postulate of ELM. Recall that my data set is comprehensive, and it includes every net exporter in the world.
So ELM is verified, and I use the word very carefully and deliberately. If anyone claims they can produce an argument and data which disprove ELM, please come forward with the goods?
Here is an interesting approach to "verification" that totally avoids the real political economy.
I will "prove" that an export land model reduces to EROEI, nothing more nothing less.
The premise is that we have a single oil field rig with a production P. For the purposes of argument, this field can either export to a consumer of that oil, call this Pe or it can use it internally to provide the energy for extraction, Pc.
Then
P = Pe + Pc
But the amount of oil used internally is dependent on the value for Energy Returned on Energy Invested (EROEI) = E.
so that
Pe = (E-1)*P/E which is the standard form for how much energy one can ship elsewhere
and
Pc = P/E
but the export model says this as an invariant
d(Pc)/dt > d(Pe)/dt
which means that the rate of change of oil consumed by a rig is greater than the rate of change of oil exported by that rig over time. This is nothing more than an expression of the law of diminishing returns, in that it gets progressively harder to extract oil from a declining well over time, and progressively more energy is fed into the rig itself.
So when we insert the EROEI factor in the above equation, we get
d((E-1)*P/E)/dt > d(P/E)/dt
which reduces to E > 1.
E=1 is the break even point for where a rig or field ceases to be productive. More energy needs to be invested into the field than can be extracted if E drops below 1.
So the export land model is provably equivalent to EROEI when applied to a single rig or field. Scale that up to where a country essentially "owns" the fields and rigs on its land, and then the rule still holds. The energy is used internally to feed its own country or some fraction is exported to be consumed by other countries. Only when geopolitical events conspire to allow the owners of the fields to become disconnected from their nations (such as in the case of war or global free-trade), will this rule fail to hold.
I think ELM is just a manifestation of EROEI whereby the reinvestment bucket shows arbitrary political boundaries. And the latter is the part that you generally have difficulty in verifying universally, as future events unwind.
Good analysis, but there's a snag: your Pc refers to the energy consumption of a single oil well: the export land model uses it to refer to the internal consumption of an entire country.
You scale up from the former to the latter, which is only legit if energy production is the country's sole activity.
A nation is more than just a collection of oil wells: one might imagine that, in the face of declining oil production, a country might reduce its internal use of energy for other purposes, softening the decline of exports. The export land model finds that this is not the case, but that behavioral tendency is more than just a simple consequence of EROEI limitations.
An exporting country may also invest in industries that are energy intensive and produce products for export. It would therefore capture more of the value chain. But it may still make the same amount of "embodied energy" available to the global economy.
Could you state this mathematically? ELM is supposed to be a mathematical model useful for prediction, but if we can't fit in the constituent factors that influence its behavior, I don't know how ELM can "find" anything.
I confess I'm not up to speed on the mathematics of the ELM, but to continue the formalism you've introduced:
When dealing with nations rather than individual wells, we should divide the national production P into *three* parts:
Pe = export production
Pi = production used internally for non-energy uses
Pr = energy reinvested into energy production
P = Pe + Pi + Pr
We can also redefine
Pc = Pi + Pr = Total national consumption
EROEI = E = P / Pr
The ELM asserts
d(Pc)/dt = d(Pi)/dt + d(Pr)/dt > d(Pe)/dt
You can continue the math in your post using this framework, but the basic issue is that EROEI places no constraints on the Pi term: the ELM is making specific assertions about how this non-reinvested internal consumption changes which go beyond EROEI ideas.
excellent.
Remember, that I originally framed this from the perspective of a single oil rig or oil field. The operator of that rig has no use for that oil unless he can (1) sell it to others or (2) conceptually use it to make more money.
So we jump from a single oil field to a nation of oil fields.
In a global free-trade economy, the collective of oil operators still has no use for the oil for the same reasons. They will ship it to whoever offers the most money. So the Pi term you added simply apportions this according to some efficiency of markets argument. We have to use the full matrix to describe the fractions allocated to various countries based on their ability to pay. The grouping Pi+Pe still holds from the perspective of the aggregated oil fields and we are left with a diminishing returns result.
In a totally nationalistic economy, Pe becomes zero and the Pi term apportions to the "haves" and "have nots" comprising the national economic base. We no longer worry about doing a global matrix (unless we want to know what we are importing). But the math remains the same, replacing Pi+Pe with just Pi, and you still get a diminishing return result.
Anything in between these extremes, which amounts to a mix of free-market and nationalistic economies, I would assert we would see the same result, i.e. diminishing returns.
So no big deal, we would see the same diminishing return result whether or not the economies are free-trade. We are just picking the "haves" and "have-nots" or the winners and losers. The losers just move to the local economy when the economy goes away from free-trade.
--- duplicate post ---
To me, the value of ELM is that it relates to the real world. A mathematical statement of ELM can be useful, but to state the relationship between ELM and the real world mathematically would require a mathematical model of the real world. And not just any model would do. It has to be one that you (and I and everyone else here) understand and accept. Otherwise what is the point? If your argument is not understood by your audience ... why argue?
Yet they want to get quantitative numbers out of the model.
You can't get a quantity unless you do some math. Even a linear extrapolation off of some graph is math.
Anyways your question is completely moot. Goodmanj provided a potential math model that looks intriguing and that we can work with. He apparently did what you thought impossible.
WHT,
What I had in mind when I spoke of a mathematical model is a system of set theoretic objects that supports a logic that is capable of proving the correctness of the system. This is fairly hard to do in pure mathematics without any reference to the real world. It was in the context of you asking someone for a proof of the correctness of statement. Using arithmetic in working out numerical values in a model doesn't make the model 'mathematical' in the sense that it properly supports the concept proof.
And if there were such a model, very few people would understand it. For example, the computer code that is used to model climate effects of atmospheric CO2, is a computational model, not a mathematical model. Running these climate models does not prove anything. Mathematical proofs are hard and, IMHO, seldom worth the effort for a real world problem.
Peace.
Your interpretation is way, way out there as far as I am concerned. It wasn't me that was saying that something was verified; I would know enough not to do this.
Take the case of the multi-body or N-body problem in celestial mechanics. This shows the gravitational pull between N unique objects. You can solve it analytically for two bodies, but you can only compute it for higher values of N, yet no one has any qualms over using a computational model instead of wasting time trying to prove it analytically. So the astrophysicists can do celestial orbits quite fine thank you.
About the climate model for CO2 and its persistence level, it is actually quite straightforward to demonstrate in terms of a probability model.
http://mobjectivist.blogspot.com/2010/04/fat-tail-in-co2-persistence.html
http://mobjectivist.blogspot.com/2010/05/how-shock-model-analysis-relate...
Now what exactly are you saying about the failings of a mathematical model?
WHT, I think you and geek7 are talking past each other, and I think I can help clear up the misunterstanding.
The snag here is that logic has a concept of "model" that is rather different from the common empirical science one:
Model Theory (wikipedia)
IOW, a "theory" is pure syntax; a model is where a theory gets its semantics.
I'm not completely on board with the wiki article; I'd say that in a broad sense, a model could be virtually anything. Two extremes would be: the theory itself; and the real world.
The point would be that while the rl wrld could be a model of the theory, unless our model is formal it is "hard" to prove that our theory is indeed true in it.
The discussion between WHT and Lumina is quite animated, and I'd like to offer an analogy with tongue in cheek:
What happened to Newton when he got banged by an apple?
Physicist: The force acting on apple is GMm/r2, F=ma and then we can figure out the rest using simple (grade 12) math. When there are very many apples, probabilities of apples falling of a tree start playing a role, but each apple follows GMm/r2 and we can figure out more using more difficult math (3rd year uni physics let's say). BTW, those descriptions with probabilities apply to more things, including oil depletion and this is what WHT does.
Scientifically minded individual: Based on observations, we can derive a model that gives us velocity and distance of apple as a function of time and it seems to hold well for all apples and many other objects we've seen so far. The models is conceptually simple and gives us a lot of insight into the problem we are dealing with including some predictive powers. And this is what Lumina does.
That's about right. The latter is a good description of a heuristic.
I go the first route because I have seen how deniers and skeptic completely decimate heuristic arguments. Look at the entire global climate change debate. Scientists working the heuristics side have had limited success in defending their positions.
There is another important element that I add to the mix, the concept of disorder. So rewriting
Scientifically minded individual: Based on observations, we can derive a model that gives us a probability distribution of velocities and distances of apple as a function of time and it seems to hold well for all apples and many other objects we've seen so far. The models is conceptually simple and gives us a lot of insight into the problem we are dealing with including some predictive powers. And this is not what Lumina does.
There is not just one trajectory for oil discovery and production, but a whole set of these based on real world dispersion of behaviors.
Model is a much-used term. From Systems Engineering, which utilizes a great many models of all sorts, a good definition is:
Usually the point of having a model is to answer a question, or sometimes to simply aid description.
Ones uses a model, because, well, it is useful. "Model are to be used, not believed." - George Box
A model, strictly speaking, is rarely "right", "truthful", or even "accurate". It is generally either "effective" or "ineffective" for the use intended.
Therefore, the argument shouldn't be about whether ELM is indeed a model, but whether it is indeed effective for a given purpose. Certainly one could discuss ways to make any model better, but that is as much a tradeoff in terms of effort vs efficacy, as it is of any technical considerations. Determining the effectiveness of models is a professional discipline all its own, and this is not an uncommon area of argument.
ELM is what it is. If it is unsuitable for a need, then a better model may be needed. Or we can just wait and see. In any case, a few moderate examples that fall contrary to the model do not necessarily invalidate the model itself or its usefulness, if an "average" behavior is sufficient and effectively modeled.
Personally, I think it would be interesting to make ELM into a simulation (a model operating over time) based on economic theory and behavior theory ("game theory" is one such subdiscipline). I think human nature tends to be on the side of ELM, but such intuition can often be miscalibrated.
Thanks for that. My last word in a discussion that went on too long: the original Export Land Model with the stylized straight lines for production, consumption and exports (see the first reference link at the bottom of Part 5 of the article) is indeed a model. Although it is a simple model with an equation my 9 year old son would easily understand, the insights evoked by it are of grave importance.
When I think of all the posts in this thread which were about the definitions of words in the title, and the time invested in those, I am reminded of the funny scene in Lord of the Rings: The Two Towers where
I would also add, to cap another discussion on semantics that was also too long, any comparison of model output with real world data which shows that the model is consistent with the data amounts to verification (or validation, or confirmation) of that model. This article confirmed that the insights evoked by watching Export Land Model's stylized straight lines can also be evoked against the entire real world data set. Whereas most models are verified against a sample of the data.
Not all models are built for the purpose of express quantitative prediction, because chaos theory makes certain predictions impossible beyond the short term. If one purpose of ELM is to instill, via the transmission of these insights I talked about above, a sense of urgency in oil importing countries that they must decisively kick the fossil fuel habit, then the model is potentially useful for something other than quantitative prediction - which in any case is very hard to do. Hopefully this verification of the model against real world data has helped in that regard.
I am glad that you straightened that out.
I created a post on my blog earlier today where I analyzed a complete set of real world data against a model that I put together in the last couple of years. The data set is the area distribution of fresh water lakes in various parts of the world. The model does not incorporate chaos, just ordinary disorder and variability in the collection rate and basin collection area, according to the maximum entropy principle. The final form is a single parameter equation describing the distribution. The single parameter does double duty as it also generates the median lake area.
Notice that the fit is perfect. I would say that the fit is so perfect and parsimonious (a one parameter fit that matches the median exactly, so it is essentially a zero parameter fit) that I have VERIFIED that the model explains real world behavior. Look at the scale: it matches over 4 orders of magnitude in one dimension and 5 orders of magnitude in the other dimension. As far as I can tell, no one has ever done this before so it is a novel approach as well. No one can possibly come up with a better model, because it would have to be more complex, and that would violate Occam's Razor.
Devil's Advocate:
Hold on. Its not that easy. You may have missed something in the verification process. You also have to have everyone else agree that what you have done passes all the other sanity checks. That's the tough part, the validation part, and you will realize that your work has only started. Somebody like garyp will come along and completely trash it, saying it doesn't demonstrate complex adaptive systems behavior.
That's OK and that's why this business is fun.
I get the feeling from that last bit that someone is getting niggled.
My actual question would be rather different: so what?
So you have a dispersive model that predicts Amazonian lake sizes. So what? Maybe it might predict oil reservoir sizes. So what?
The exam question here is the availability of oil. ELM provides a simple descriptor connected to oil exports, and therefore the exam question. It won't be exactly right to n orders of magnitude, but it does describe one of the key patterns associated with the availability of oil at the moment. It's prediction forms an attractor (sorry, but it is) around which other factors play out over time, and which is subject to the force of other attactors.
In scientific terms, it produces a testable prediction - which can be shown to be correct(ish) relatively often.
In engineering terms, its useful and answers the 'so what' question.
Maybe you'd like to take your entropic/dispersive model of ... oil reservoirs? ... oil exports? ... whatever it is ... and make a testable prediction that hasn't already been covered. Because at the moment the best I'm seeing is a way to define the maximum possible reserves globally via the previous incidence of field size - something I've seen before and doesn't seem to cover how exploitable it might be.
I'm not getting a eureka moment I'm afraid.
My comment is not necessarily about practicality but about the arc of scientific discovery.
If you know something about probability density functions, you will realize that a PDF can only describe an intrinsic quality. Like knowing the density of a material doesn't allow one to know the actual mass of a specific object, knowing the field size distribution won't allow you to estimate "maximum possible reserves globally". If you said you have seen this before, it was likely in a very misguided context (some USGS report probably). Yet, there are other interesting questions that this finding raises. The reservoir size distribution shows that the mean size diverges to infinity. It may be a weak divergence, but this does tell us about the possibility of other super-giants, and together with dispersive discovery can guide us in generating estimates of how likely that a significant new field would occur.
The arc of scientific discovery really only begins when we start understanding a concept somebody sets forward. My example happens to be grounded in simple models of geology and guided by fundamental concepts of entropy. In contrast, the ELM model seems grounded in socio-economics and vague predictions in human behavior, and only guided by linear extrapolations. Yet, I realize that it will take a lot more than an assertion or two that I write up to make it acceptable to other scientists or analysts. I don't sense that the ELM proponents have that same outlook, as they have seemingly verified and validated the concept all on their own.
So what is the prediction? They can't even write it in precise mathematical terms. In this thread, I offered up the suggestion that the testable prediction is this relation:
dPc/dt - dPe/dt > 0
But all I hear is crickets that this is the correct formulation.
The most amazing part of engineering (and what most people don't realize) is that many of the brilliant innovations come from the engineers that are able to take obscure and cryptic scientific work and turn it into something useful. So where is the meat of the science that makes this anymore than a yawner for any engineer to develop further? I tried to both do the science for these ELM guys and get out some equations that might prove usable, but have only gotten some pushback that what I am doing is somewhat out-of-bounds.
Unless you are talking about social engineering?
You state:
Even for the case of exports=national consumption (a special case), the heart of exportland is that dPe/dt ≠ dPc/dt. Rather dPc/dt continues to be positive whilst dPe/dt is increasingly negative.
Thus when dP/dt = 0 (eg peak):
dPe/dt = -dPc/dt
and since dPc/dt is positive (country is growing because of the oil earnings), dPe/dt has to be negative. In other words its already past peak. QED
By the way, I note you haven't come out with anything that answers the 'so what' question, other than being able to put a handle on the total size of reserves from discovery data. I'm not seeing this as surprising, since the reality of oil exploitation is 'complex', and therefore NOT a case of maximum entropy. That's kind of the point.
If you want to take it in a direction to answer the 'so what' question, may I suggest something else I remember seeing. The size of terrorist incidents worldwide follows a similar smooth curve, allowing you to predict the probability of any size of terrorist incident within a time period - eg it CAN predict social factors, provided there are enough actors and its simple enough.
My guess is you can do something similar to predict the actions of individuals relative to a supply constrained world - taking as the data set basis the actions of the populations of countries where the oil price has already risen above the affordable level. There is a point of strain where things break and civil discord results - and I'm guessing that it is roughly at the same relative point on the 'strain' graph for each country. Predict the strain over time and fold-in the expected fall off in available fuels in each country and you can put a finger on when it all goes to hell. As far as I can see, that would be using an entropy based technique for an area it's good at.
Not if it is a strong production growth situation!
I already did the case elsewhere in this thread if you would care to look around.
P = Pe*(1+f(t)) + Pc*(1-f(t))
(Production exports go up as a perturbation described by f(t))
dP/dt = dPe/dt + Pe*df/dt + dPc/dt - Pc*df/dt
(expanding using the chain rule)
but Pe=Pc and dPe/dt = dPc/dt
(equal amounts go to consumption and export as a first-order approximation which agrees with Figure 1)
so making the substitution
dP/dt = 2*dPe/dt + (Pe-Pc)*df/dt
but since Pe=Pc the second term disappears and you get the same thing as before
If Pe>Pc and df/dt>0 then dPe/dt has to be negative at the peak, which does imply that the export peak occurred earlier, yet df/dt could just as easily been negative for awhile and then the export peak would have occurred later.
In any case, these are all second order effects and the fact that Figure 1 shows the export peak coinciding with the global production peak indicates that these effects are inconsequential. The utility of this as a leading indicator is marginal at best.
You really don't know the diversity of work that I have put into this effort.
You been reading to much of the crazies at the Army War College or something. Read my blog instead and you can get an indication of the stuff I am interested in. It certainly isn't this NSA wankery.
Sorry, but I have to conclude you are trolling.
You go round the houses with some blatantly dodgy steps (dPe/dt = dPc/dt only when at production peak and 50:50 distribution, therefore dP/dt=0, f(t) isn't common except at dP/dt, momentarily), when a simple formulation is all that's needed - in what looks like an attempt to hide your slight of hand.
Couple that with your offhand dismissal of complexity and other dodgy statements and I'm sorry, but I have to conclude you are a green pen merchant.
Oh well.
You can't explain why global peak export happens to line up with global peak production. I wrote an analysis that shows how this can happen and served it up to you on a silver platter.
You have to be able to explain why dP/dt=dPe/dt=0 happened around 2005.
dP/dt=0 in 2005
dPe/dt=0 in 2005
yes look at Figure 1 and any global production graph.
You know which analysis doesn't work?
=> yours
---
And another thing it is at about the 50% situation if you care to look!
I am putting the question (to WHT) here, because I really do not know where it belongs. Aand how much sense it makes, whether it's been answered here on in your blog. There are no stupid questions they tell us...
Here it goes. Tossing coins with 50/50 outcomes leads to binomial distribution. We could say that the process is "driven" by individual probabilities and extends to stating that binomial distribution turns to be an "inherent property" of such observable. It is more than just description, or fit to results.
Is it the same that the processes you are studying (lakes, oil, crystals etc) are really driven by entropy and if we knew values of any additional "parameters" existing in the model, it would imply some other PDF?
In this regards is it the entropy that drives the process?. E.g. in your CO2 persistence blogs you compare results with kinetic models having 5 kinetically limited processes. But is this chemical kinetics "expression" of the process driven by entropy? Or is it situation where the amount of various deterministically and probability driven processes is so complicated that we are unable to extract the components? Which is another way of saying that "it is such a mess" that only looking outside-in via some extensive property
is a better or at least easier way of doing things?
Very astute questions.
Maximum entropy modeling is neat (IMO) in the fact that you can only model based on observable measurements you can make. These generate the constraints for the probability distributions. Any other information you want to include is a no-no as it leads to unwarranted assumptions. So MaxEnt is a way of dealing with limited information.
So if we did have more information, then we would get different results. One of the best examples of a "failed" maximum entropy PDF is the case of mapping out the dispersion in marathon finishing times. Humans show a huge variation in athletic abilities and you should see this in the distribution. There are fairly hard constraints in the maximum speed of a runner but not in the minimal speed of a runner. But then you add in other constraints such as the artificial cut-off time in a specific race, and it screws up the finishing time distribution in the tails. All the people that could race at the slower speeds won't enter the race because they know that they won't make the cut-off time. There is also a bulge in the top runners that gets affected by the lure of prize money. This only affects a few but you can see the bulge. The point is that you can "know" about these things and thus adjust your model and get different results.
When you start piling up the constraints and information it gets harder and harder to model entropy this way, unless the combination of constraints also starts to become random. Then you are back in business and you can reason about this. The best example of this is the distribution of human travel times that I have posted about. The maximum entropy principle applied to this problem gives just about perfect agreement.
Is it the same that the processes you are studying (lakes, oil, crystals etc) are really driven by entropy and if we knew values of any additional "parameters" existing in the model, it would imply some other PDF? Yes indeed, you can look at e.g. other aggregation of lakes within the data set and you can see other PDFs emerge based on the additional knowledge you have.
In this regards is it the entropy that drives the process? Entropy drives the process in that more and more variability is added to the mix when you make your problem more and more and more "global". This is the same as saying that entropy describes the march to filling up the state space.
But is this chemical kinetics "expression" of the process driven by entropy? The 5 processes is someone's attempt at describing the constraints. I simply assumed a lot less knowledge but some fixed constraints (i.e. a diffusion-limited rate) and went from there. Entropy dries it because the assumption that there could be a lot of rate pathways and distance pathways which will fill up state space.
Or is it situation where the amount of various deterministically and probability driven processes is so complicated that we are unable to extract the components? That happens all the time. Most of these "scale-free" probability distributions occur because the dimensionality disappears. So a short time could be caused by a slow rate operating over a short distance and or by a very fast rate operating over a larger distance. Everything gets mixed up so much that you may not be able to extract the essential components or their behaviors.
Which is another way of saying that "it is such a mess" that only looking outside-in via some extensive property is a better or at least easier way of doing things? Yes.
Thanks,
There is a lot of elegance in your method(s); lots to read in your blog, and I am enjoying reading it immensely.
One significant shortcoming of the original ELM is that it contained no obvious way to evaluate how well it fit data from the real world. (at least in my opinion)
Lumina assumes (correctly IMHO) that each individual export land is a microcosm of the whole world.
Subsetting the data according to country or other political subdivision and then grouping according to time after their individual production peaks gives a way to assess the variation the decline after peak. I would expect to find that the post-peak development of each country to be different, and that they would share similarities. But what similarities? and what differences? He is seeing patterns that could only be guessed at and arm-waved without this work.
Bravo, Lumina!
Thank you geek7.
The presumption is that each political unit (country) is on its own in the jungle of the international society. At the risk of oversimplifying, if they produce oil, they will export any surplus to their need. If they don't have a surplus, they will burn their own stuff before importing anything. If they don't produce enough (or any), and they don't have geopolitical muscle to secure their full requirement out of declining available imports, their adjustment period to 90% reductions in oil consumption will be much shorter than they thought. That will be partly because those importers who can foresee the endgame and who have the geopolitical muscle to secure their full oil import requirement are unlikely to play nice, further accelerating the shrinkage of the pie for everyone else. Think of a gun-toting gang taking all the sacks of rice from the UN food aid truck and leaving nothing for the unarmed hungry crowd, which could have been fed had everyone stuck with 1 sack of rice per family.
The traditional focus on just doing production forecasting carries with it the implicit but mistaken assumption that the burden of the future declines will be shared equally. Statements by TPTB such as "at current production rates, oil reserves are sufficient for 50 years" lull stakeholders into a dangerous stupor. Nothing could be further from the truth than the hidden assumption that production declines will be shared equally, and the consequences are very destabilising for a very large number of countries who depend on imports, small and large, developed and developing.
"So ELM is verified, and I use the word very carefully"
"Verified" is OK, but "validated" is a better word for what you have done, IMHO. It makes more clear the connection to the real world.
The connection to the real world is exactly what I set out to find. "Validated" works too, but I am just as comfortable with "verified" or "consistent with" or "confirmed". The main thing is for this connection of ELM to the real world to become visible and believable: that was the point of the exercise.
It was very well presented and clear enough, without a more in depth analysis. But it is fascinating the need by some to squeeze the information in a much more detailed manner to feel some control over or comfort with the conclusion. I suppose the center of a target has its center too, and with enough scrutiny it can be targeted.
I think I understand what you are implying. Most top-notch design firms have a few people designated as "devil's advocates" that appear at review meetings. Ignore what these guys say at your own peril; they are there to keep you from embarrassing yourself later on when something flops.
At later stages, it's also known as peer review, thesis defense, etc and it goes with the territory.
Unfortunately, the internet doesn't have much by the way of quality control so the devil's advocates can often turn into "concern trolls".
Verification & Validation have very specific definitions in engineering circles.
Verification is an objective evaluation of a model or some product that meets some requirements.
Validation is a subjective evaluation of the same thing.
If you were to make a model and give it to some customer, you would do the verification and he would do the validation. It wouldn't matter if the model was correct or not; if he didn't like something about it, he would declare it invalid for its intended purpose and you would have to go for a retry.
AFAIAC, this model is not fit for my purposes and I would not use it. Therefore it is invalid in my view. So it really misses on both accounts.
George,
Thanks for this very careful review of the Export Land Model. I especially appreciate the details of your methodology and will be sure to try out your refinery processing gains adjustment when I start working with the EIA oil data.
While agreeing with WebHubbleTelescope that ELM is an entirely heuristic approach, it is important to recognize that this approach is extremely useful heuristic approach when it comes to explaining what is going on or making predictions. It is easy to understand and, as you have pointed out,
largelyentirely validated by the data. As an explanatory and predictive tool it is far superior to the "multicyclic hubbert analysis" we have seen in a few peer reviewed papers lately.Kudos!
Jon
As you are likely aware, I have some fundamental problems with the export land formulation because it has many of the aspects of a zero-sum game to it.
For example, suppose that the world was composed of a single country. What fundamental rules from ELM can you apply to allow anyone to explain or predict what would happen with declining production? I know exactly what would happen. You would set up a model of the "haves" and "have nots" in the society and they would get busy dividing up the pieces of the pie.
The fact that you have rather artificial political boundaries does not make it any more fundamentally correct or easier to reason about than any other socio-economic model.
Now if you want to do this correctly and account for where the oil is going to, assuming nation boundaries, you have to create a matrix of all the countries that can import and export oil and guess generally what the individual agents will do.
The full Production->Consumption model needed to keep track of all country interactions is set up like the following:
C = [E] P
P is a vector of size N giving the gross Production outputs of N countries.
C is a corresponding vector of the Consumption inputs of N countries.
(ignore the refinery bits where a country will import and then export)
[E] is a matrix of size NxN which describes the relative amounts of oil exported from one country to another. The invariant is that the sum of the elements in a row has to equal unity if an individual element in P gives the gross production. This will also result in the fact that summed Consumption equals summed Production. That is the Export matrix and it can have 900 elements if say N=30 countries.
Inverting that equation and you will find the corresponding import matrix [I] is just [E]-1. They have a built-in relationship so that if you know one, you can get the other.
There are two limiting cases. One case is trivial. It is where each exporting country becomes very nationalistic and only sends exports to itself. If every country did this then [E] will turn into the identity matrix with elements only along the diagonal. You might as well calculate individual production profiles for each country and keeping track of exports is trivial, as there are none.
The other limiting cases is a fairly balanced matrix. Each country sends its exports to other countries depending on its "demand", which further depends on its population among other things. In this case, things rise and lower in unison and export/import bookkeeping is pointless.
The difficult case is anything in between these extremes. The elements of [E] have to stay consistent and also match the consumption demands of all the countries involved. If you don't do this correctly it becomes a GIGO equation and if it only reflects current reality it doesn't tell you much. That is the zero-sum aspect of it.
So who can manage the model while understanding all the complex interactions among all the countries?
You can try to take a shortcut and have it move towards a more balanced approach, which in fact is the highest entropy model. This high entropy is associated with trend toward free-market disorder or to free-market chaos. This explains why peak export lies pretty much on top of the global production peak, give or take. (If you don't believe me look at Figure 1). So ELM doesn't really explain this, it only reflects the underlying production model, i.e zero-sum or you are back to where you started, as ELM is a model of very weak predictive power. It is only second-order in terms of the underlying global production.
Its so much easier to have the agents apply a greedy algorithm and find and extract the oil as fast as possible, which becomes a model of global oil production. Yet no one seems to want to do this except for me, preferring to analyze a second-order effect which is obviously only applicable if you have the first-order effect figured out. I repeat: Import/export=2nd order and oil production=1st order, with the import/export bordering on a zero-sum game, with little predictive strength if game theory elements (war, corporate strategy, etc) come into play.
And this explains why I am not that interested in pursuing a complete ELM. Its nasty in the bookkeeping, hard to explain, and really holds little value in predictive power.
That's the issue which was bothering me throughout reading the article. ELM contends that there is huge significance in the graph line of a)(production - local consumption) as opposed to simply the graph of b)(production), yet in the samples presented such significance simply doesn't show. What policy decisions would a "mover / shaker" make differently given the b) graph data above versus the a) graph? Both are pretty much entirely controlled by the (production) data.
Len,
You got that right.
The only reason I am working the math angle is to figure out exactly what I am missing in my interpretation. Ultimately, if I was deeply convinced that ELM could tell the whole story, I would have dropped the modeling I was doing elsewhere, and would have pursued the ELM approach exclusively. Yet quite clearly to me, the fact that the export peak lines up with the production peak means there is something else to the story. It has been a second-order effect up to now or we would have seen a significant shift in the export peak with some huge associated change in global free-trade policies.
Is it because ELM tells the whole story post-peak? I kind of doubt that too as political boundaries and alliances will change. Then it becomes at best a qualitative model of the restructuring of export/import pathways. And in that case, I would think that we would want to use the matrix formulation I presented in my comment above.
WHT, From what I see, you prefer analytical solutions over "heuristics" of one kind or another.
But what about exploring the area by Monte Carlo approach? Sample over countries, production curves and consumption curves, etc. and see what happens? I know, major heuristics would be involved in assigning probability distributions. But such an experiment could show possible pathways to successful outcomes, and these could be examined further by adding/considering economics/policy?
As we see it now, positive outcomes need miracles.
Monte Carlo techniques are typically either based on sampling from a model, or resampling from a set of data. The former allows you to compute a potentially intractable expression and the latter allows one to determine statistical properties of a limited set of observables.
I can just as easily solve my analytical models using Monte Carlo, which I demonstrate here:
http://mobjectivist.blogspot.com/2009/12/monte-carlo-of-dispersive-disco...
About the only thing it helps with is getting a sense of the statistical noise you would get with a finite number of discoveries. Otherwise you get the same result. The fact is that if you can get an analytical result, it becomes much easier for other people to check your work. OTOH, if you leave it in a computational state, you leave doubt that no one else will be able to reproduce your results. Thus, my preference for analysis whenever possible.
With that as a premise, I think I understand the context of your idea. If I was trying to infer the coefficients of a grand scale export/import matrix, there are ways of learning the coefficients from techniques other than Monte Carlo. For one you might be able to look many of them up, from a country's import/export records. The missing pieces you might be able to piece together from the constraints and a few smart guesses.
Thanks for explanation.
Len, thank you for your thoughts.
One reason why policymakers should look at net exports instead of production is graphically demonstrated by Figure 6 ("Former Exporters") in terms that a layman can understand.
These countries, the Former Exporters, used to export 2 Mbpd back in 1985. Their production and consumption both grew after that, but consumption grew faster, until around 2000 - shortly after what proved to have been their ultimate production peak - their net exports dropped to zero. So we had a 100% drop in net exports over 15 years, from 2mbpd to zero, but over the same period production for this group had actually increased.
Of course Fig 6 is just a group of countries amounting to less than 10% of global production. However, my analysis covers all global production, and the endogenous ELM behaviour is evident in each group of net exporters, including those who are still growing. So simply take the all exporters graph (fig 7) and put the clock forward 10-20 years, by which time global production will surely be declining, and you will have a graph of net exports for all the world's exporters that will increasingly start resembling that of the former exporters in its early days when net exports were in decline, but before the net exports fell below zero.
Then ask yourself: if I was President, should I be looking at the production curve or net export curve? Again, if the early stages of figure 6 resemble a future chart for the whole world, and right now we were sitting at 1990 looking back at just the production data of 1980, 1985, we would be feeling great. But how can things be just great, if global net exports will hit zero in just a decade (2000) and 131 countries would suffer a forced reduction of 100% in their oil consumption? Something has to give, and that would be the fallacy that the most important curve to watch is the production curve.
The value of thinking in ELM terms may be elusive to some, but I suspect that it is not lost to the Chinese. Their overtly manifested policy of locking up future resource extraction streams using joint ventures in refining, mining, etc. puts them far ahead of the curve...
I call that by the well understood names of "isolationism" and "nationalism".
No brainer, the production curve. First-order models always come first. The net export curve is second-order and doesn't come with a fundamental first-order model.
Hmm.
Net Exports = Production - Consumption, for an oil exporting country
Net Income = Revenues - Expenses, for my businesses
Should I call in my business partners and closest associates on Monday at 8am and start evangelizing about the need to maximise Revenue and "stop obsessing with net income which is merely a second order function and does not come with a fundamental first-order model"?
But you have no basis for absolute values of Revenues|Production and Expenses|Consumption.
Those numbers are just floating out there, not grounded to any fundamental model.
I have a global model of cumulative oil discovered over time called Dispersive Discovery. This becomes input to another model called the Oil Shock Model, which generates an estimate for global oil production over time. You need this global production model to reason about the numbers because oil is a finite resource that doesn't just magically appear from some checking account balance.
My problem, and perhaps my advantage, is that I don't think like an economist or a financier.
If I continue to see people ignoring the fundamental fact that finite resources can be absolutely counted, and not treated as some tenuous derivative or price, I will say the same thing -- we need a first-order model before you need the ELM. This is not some business problem that you need solved to maximize profit, it is a model that is closest to reflecting reality.
You don't need a first order model of planetary orbits to state that the sun will rise tomorrow. Even when everyone thought the earth was flat, they still knew that the sun would rise the next morning, set the next evening, and shine for longer in the summer than in the winter. Heuristics are not all bad (unless there is a Black Swan).
For example, suppose that the world was composed of a single country.
I really like the principle you're pursuing here, of ignoring national boundaries and considering the world as a closed system. However, the sad fact is that national boundaries *do* matter: the first figure of the article demonstrates that point, that a nation's production history is a strong determiner of its current consumption trend.
A key assertion of the ELM seems to be that consumers make decisions based on production/export statistics internal to their nation: they don't look at the global energy situation.
Borders are inconvenient and annoyingly variable and contingent, but they can't be ignored.
Yes, and that is precisely why I put it in terms of a matrix formulation above where you keep track of all possible paths between oil exporters and importers. That defines the borders of a closed system (we are not sending oil to Mars yet). The ELM folks don't do this as far as I can tell, preferring to look at in terms of isolated or loosely-coupled systems.
You mean that the USA hasn't looked at the global energy situation since they became a net importer in 1949?
Note that the table I posted in the article is just a summary. In my database, I have three large matrices of 218 rows by 30 columns each, one each for production, consumption and net exports by country. My database is thus a closed system, and it allows all possible paths between exporters and importers implicitly. If one then starts earmarking certain exporters for certain importers only, the impact of that on everyone else is exactly like the dynamics of ELM: the pie shrinks faster than you'd think it would.
Now you understand why I ask the questions. For anyone to have any chance of reproducing what you have done (the hallmark of science, BTW) you need to explicitly lay out your calculations.
So you have 218 oil consumers/producers and 30 oil producers?
There are about 195 countries in the world so the value of 218 almost makes sense. But only about 75 oil producers exist, so you may be a little short on that, unless you count just the significant ones.
So you have 218x30=6540 matrix coefficients in your database?
Is this getting close to what you are doing?
The fundamental problem is that without the first order model of overall production, what exactly are you comparing it against? So it shrinks faster than you think it would ... compared to exactly what? That is my contention of ELM being a second order model.
No, I have 30 years worth of production, consumption and net export data for each of 218 countries. 44 of those are exporters, 131 have little or no production, and the rest of them are importers with some production.
WHT, in response to most of your other comments to this post, I must say each of us have our way of seeing the big picture. My style is to get to the directionally correct answer with as little effort for the author and as much clarity for the reader as possible. Even though I am not lacking in the math and precision department - in fact those skills came in handy while I was working on my dataset for the post - I could never be successful if I tried doing it all over again in your way, simply because my style is different.
If you have a different way of modeling ELM in mind, perhaps you could download the same EIA data using the link in my post and see what you can do with it? I would be interested to read a complete argument that also takes into account the data that is out there. But I can't write that argument myself, because my style takes me elsewhere. I hope you understand.
My style is that of a physicist. The typical approach is to come up with a first-order model and then refine it to second-order when the extra precision is needed. The classical example of this is acceleration due to gravity: to first-order it is constant and then to second-order it goes as the reciprocal of the distance squared between the two objects. Squeezing the extra behavior out of the gravity model will help with accuracy obviously.
My problem is that no one is willing to admit that ELM is a second order model that only adds a delta difference to the first-order global production decline.
So if we have a first-order model that can predict numbers of 80 MB/day global oil consumption in the face of declining reserves, then the second-order ELM effect would be to qualify that 80 MB value with another number, say 2 MB/day/year that would transfer to oil-exporting nations, at the expense of everyone else. It is zero-sum in the fact that it is a transfer effect and does not really change the total significantly.
Now it is time to bet on which effect is stronger, the first-order decline in production or the combination of the first-order decline combined with the second-order ELM effect. You can't take the ELM by itself because it is meaningless without the first-order baseline. Its worse than the gravity model because the second-order model completely subsumes the first-order constant gravity approximation. In the ELM case, you are left hanging without the first-order model in place.
IOW, no one in the BAU crowd has any idea of what you are talking about.
delete...
So this way (matrix following all interactions) one could follow and pursue individual mitigation scenarios?
For example Subsidize oil producing countries to generate electricity from anything but oil. Preposterous, give money to oil producers..But at oil at $80 a barrel,
But some scenarios might be less obvious and could seen my mining the data?
You could in principle follow the interactions, but you wouldn't be able to come up with the matrix coefficients other than in reading them directly from the country-by-country import/export data. These would be valid for only a time as geopolitical dynamics shift.
You might be able to mine information from the matrix through some decomposition methods. Or you could add a small delta shift in some production level and see how it spreads, but that is about it, IMO.
Also, the matrix coefficients are unlikely to be constants, either in time or with respect to production. Indeed, Lumina's data implies that as their production changes, countries shift the relative balance of internal consumption to exports. In mathematical terms, this means the diagonal and nondiagonal elements of [E] are different functions of P: the system is nonlinear, so you can't actually do any fun linear algebra on it.
The consumption/production "matrix" is a handy way of thinking about things, but you can't actually use it to make predictions.
This is exactly right. There are internal feedbacks with clear directions of causality, time lags and momentum involved. Thus the question of "forecasting the future of net oil exports" is eminently suitable to be tackled with a full blown system dynamics model. For those who aren't familiar with system dynamics, it is the discipline behind the World3 computer model, around which the classic "Limits to Growth" books were written by Meadows et al.
Any question regarding the future trajectory of a physical quantity which involves feedbacks, stocks, flows, time lags and nonlinearities is best modeled using System Dynamics techniques. If that were done for net exports, then you would have a first order model for net exports. A SD model for net exports would incorporate existing production models, existing models about economic variables that would indirectly affect oil production and consumption, and existing insights about ELM especially with respect to feedbacks (e.g. a possible feedback between cumulative net exports and the consumption growth rate)
My article above was not an exercise in creating a predictive model. It was a comparison of the ELM theory with real world data to see if the two are consistent. Maybe in future someone who is fluent with System Dynamics will build a real net exports model.
So as long as there are no new big inputs, it's all downhill whichever way we look?
It's downhill in either of the approximations.
First Order approximation
Calculate the global production and watch it decline, assume a global free-market trade of oil
Second Order approximation
Assume that every producing country isolates itself from free-market trade policies to some unknown degree. It will likely quicken the decline in importers and defer the decline in exporters. The amount of this decline is dependent on the exporter's isolationist policies. The overall decline is zero-sum because the flows balance out.
Third Order approximation
Assume that the exporting country, due to its isolationist ways, will use more oil and this will have a slight positive feedback effect as the exporter generates a greater GDP and thus depends even more on its oil production, speeding its own decline and those that may depend on it. I think this is the ELM premise.
If a big new input such as the discovery of a super-giant occurs, all you need to use is the first-order approximation to see which way it goes.
Gotta say WHT, I still disagree with your thesis that exportland and the other inequality effects are second/third order and of little predictive value.
I think it's based on where your standpoint is. If you are looking at the global market as a whole, then global production is indeed first order and exportland is zero-sum. However, if you take the more useful standpoint of 'what it means to me & mine', then exportland and the various other inequality factors are most decidedly first order effects. In fact I'd suggest that GDP per capita is probably more important than global production level (or rather global productive surplus) in determining you access to oil.
Given the reality that your personal 'access to the benefits of oil' quotient is the consequence of a CAS - I don't think you are going to get your wished for simple equation that defines the quotient into the future. That is, however, different from saying it has no predictive value - since exportland defines one of the attractors that shape the behaviour of the total CAS.
If you want to express it in Physics terms, everyone's individual access to oil quotient describes a random walk shaped by the various inequality factors AND global productive surplus. However although you can describe the shape of the distribution (hence ELM as one term), you can't predict each individual member - only the ensemble.
CAS = Complex Adaptive Systems ?
attractors?
All that crap violates Occam's Razor
Ahhh, that explains it then.
You're going to find making sense of the systemic aspects of oil decline very difficult until you get to grips with complexity and loosen the reductionist viewpoint. The sum really is more than the parts.
Yes, but declaring it a "complex system" with "emergent behaviors" and walking away isn't understanding, it's a declaration of surrender.
The way to understand complex systems is to reduce them to simple principles, see where that fails, and then make it less simple until you start getting useful predictions. Which is what WHT is trying to do. It's what Lumina is trying to do too, using more data and less calculus.
In a true chaotic system, this will stop working at some point, but if we were there yet, our models would *tell* us where the predictability limit was.
When was the last time you saw a peak oil graph with error bars that weren't wild-ass guesses?
The other point that garyp will probably not like to admit to is that his complex adaptive systems are completely deterministic. In reality, dispersion and disorder will smear all this behavior out and you won't be able to meaningfully extract any behavior that you can pin to adaptation or some attractor.
garyp also said this
If complexity is better described by disorder, then it is certainly not a reductionist viewpoint. Yes, the sum is much more than the parts -- it is a probabilistic interpretation of the states of the system trying to maximize entropy.
Complexity isn't disorder. The best definition I've got is its a domain where the interactions and feedback within the system make its state closely tied to the precise particulars of its initial state - such that you cannot predict it arbitrarily far into the future via deterministic, reductionist modelling. However, it still exhibits repeated behaviours and characteristics which provide coherence to the whole and allow you to gain an understanding of the system and prediction of its future state statistically. It also provides for prediction of changes in the system around these recognised repeating behaviours.
So it's half way between the mechanistic and true chaos. Not for nothing is the weather usually used as the example.
The key factor, and one where I think I disagree with you, is a complexity system does NOT necessarily maximise entropy (a chaotic state) but exhibits structured behaviours.
You tend to believe, if I understand your postings correctly, that either individual oil fields will export to the best market, anywhere in the world - or that national concerns will limit this in some monotonic fashion. Reality is that certain repeating motifs (attractors) define the behaviours. Some of these include:
I could continue for ages. The point is the sum total of the global, national or personal path is the combination of all of them. As such they form repeating patterns that 'rhyme' - so we tend to see the same meta level behaviours repeated over time - it's not chaotic.
The key part of us tipping over from oil growth to oil decline is it significantly changes the 'force' of some of those attractors - breaking some meta level behaviours and creating new patterns. HOW the world works on the decline is different to how it works on the way up. And THAT is the critical thing to try to get a handle on if you want a useful, actionable, understanding of our post peak world.
Exportland is one factor that helps you get a grip on that world, because its one attractor that will be enhanced in a decline governed world.
The more states you have the more conducive it is to entropy modeling. The classical example of this is statistical mechanics. That is an area that I find most intriguing, economics is going toward econophysics and ecology is going toward using maximum entropy in understanding species diversity. The idea of superstatistics (google it) is also building up some steam.
I wrote up a blog post today noting the almost exact correspondence between oil reservoir size distributions and fresh water lake size distributions: http://mobjectivist.blogspot.com/2010/10/lake-size-distributions.html
I find a lot more richness in describing behaviors in the maximum entropy world than I do in the complexity world. That is my hobby and I will take it as far as it will lead me. Obviously you have your own beliefs, and if you want to pursue that, fine with me. I just won't follow that direction.
Read Murray Gell-Mann's work called The Quark and The Jaguar. Gell-Mann co-founded the Sante Fe Institute which specializes in complexity research, but he makes the strong claim that you can't distinguish between the two in many cases.
Gell-Mann's complexity estimator. "the effective complexity of the observed system (can have) more to do with the particular observer's shortcomings than with the properties of the system observed." (Gell-Mann p.56)
WHT, I mostly agree with your desire to start from fundamentals, but I can't say that complex systems are deterministic in any realistic sense. Most have feedback loops that favor equifinality and some drive for homeostasis, but in many cases the input complexity is so great that it cannot be accurately measured, and the system behavior can be characterized but not solved.
I'll think on this some more. It's certainly an interesting topic.
Paleo,
There is a distinction between the concept of complex systems, and what people do when trying to solve them.
Certainly, in conceptual terms a real complex system does not have to be deterministic, but every time I see one of the equations describing a complex system, it is clearly a deterministic formulation.
The most common example of this is the Lotka-Volterra dynamics in predator-prey relationships.
If you dispersed or varied any of the parameters in the L-V model as you computed the results, you would get a completely different result. But that is not what most people do.
So you are exactly right. I am only suggesting to garyp that his desire to solve these things will be met by the reality of a stochastic world.
Nope. Your proposal is a reductionist approach, see that phrase 'reduce them to simple principles'.
Recognising the system as a complex one isn't surrender, it's the start of recognising which tools have a hope of working. To move forward you seek to recognise the attractors and how they will combine to create recognised patterns in a post peak world. See the other posting for more detail.
Building understanding this way means building from the middle out - taking the patterns, reforming them to the new driving forces (attractors) in a post peak world and putting them together to understand the top level trajectory.
As an example, take exportland. It describes a pattern of political and transportation driven servicing of local needs first, together with an economic growth enhancement from the oil that increases local demand. Combined over the global context and we get a shorter term peak in exports than production, and an unequal distribution of that production.
Now, in a post peak world, a few new attractors surface as strong items. Curtailing export levels to preserve national reserves longer comes up against strong extra-national pressure to pump more and curtail national usage. We get alignments, protection measures, wars and 'accidents' as things trend towards a new set of patterns - which probably mean you don't want to be a small country with oil. The end result is probably to hasten the decline, both in global numbers, and in oil available to the man on the street.
You can't find these things by building up matrices.
I only offered the matrix approach because the people doing ELM do not do a good job explaining exactly what they have done.
I am playing the game of 20 questions and eliminating all the possibilities until they reveal what approach they are using.
Right now I am getting the impression that they are using a linear regression from the last few data points. So there you have the ELM trajectory in all its complex adaptive system glory.
The original ELM model from Jeff and Sam's work is simple for anyone to understand because it is the graph over time of three variables in a linear relationship, Net Exports = Production - Consumption. The comparison of that simple model from 2007 with all of the available real world data resulted in its verification. Verification of a simple model that anyone can understand, which predicts that net exports will plunge to zero while the world is still producing tens of millions of barrels of oil per day, hopefully means that some key decision makers somewhere will decide to take the plunge and kick the fossil fuel bad habit.
A completely different ELM using system dynamics could be built, and such a model could even predict the future. And then it might suffer the same fate as the amazing global atmospheric and oceanic models in the vicious political world outside the hallowed halls of academia, where all a scoundrel has to do is to imply that the scientist has a hidden agenda and then correctly state that the model is a "black box" that only the scientist understands.
We don't need a new ELM, the one my 9 year old son understands does a great job.
Oil is already distributed in an unbalanced fashion between the "haves" and "have nots" of the world and has been for some time. That is free trade, where the oil goes to the highest bidder. The fact that this behavior will continue in the face of declining global oil production is nothing new. It may transition from free trade to isolationism, but this is secondary in the face of declining oil production.
You make it sound like the ELM holds some sort of secret. No, actually the Dispersive Discovery model holds the real secret that any nerd can understand. The discovery profile as it appears requires accelerated or exponential growth in average search rates over time. A continuous accleration cannot continue because the earth's crust is finite. This is Moore's Law writ large but with a clear constraint. If people understood that basic idea, which is pretty obvious IMO, everything else would follow.
Compared to the BAU perspective of most people who are just looking at production, and also compared to assuming an equitable rationing of oil available to export vs the reality of stronger countries taking more than their fair share. In either case, the observer is lulled into a sense that there is "plenty of time" to find a solution, when in fact there is much less time available. In that sense, the "pie shrinks faster than you think it would"
Yes, but compared to what quantitative baseline?
To whatever baseline the non-ELM-aware observer of peak oil had baked into their mental model of the onset and probable impact of the effects of peak oil, before they seriously thought through the implications of ELM
In ELM the baseline model seems to be the data itself and all projections are based on a regression of this data.
You mean that the USA hasn't looked at the global energy situation since they became a net importer in 1949?
By "look at", I mean "base consumption decisions on". And no, we haven't seriously rethought our oil consumption behavior since 1949.
WHT,
I am somewhere in between the Export Land Model camp where the desire for conceptual and matematical simplicity ignores the actual complexity inherent in the system; and your dispersive modeling approach which is justifiable from first principles but requires a certain level of math/statistics background to appreciate.
I believe there are are good things to be said about both approaches as each appeals to a different audience. We need to find convincing arguments for all the different audiences out there from policymakers with no math/science background to scientists and engineers with lots.
My own approach is entirely non-mathematical and relies on our species' visual pattern recognition skills to grasp complex phenomena after repeated exposure to visual representations of data.
I understand why you aren't interested in pursuing the full ELM approach -- it would involve nasty bookkeeping. But the "high entropy" approach is also imperfect when applied to individual nations. Reviewing the data, one finds multiple examples where order -- in the form of government regulation -- is more important in determining production rates than the disordered processes associated with free market capitalism and geologic deposition.
Ultimately, I feel like the disagreement between ELM and your dispersive approach may come down to the scale at which each is looking at the problem.
At the global scale, it is hard to argue with a statistical approach and the simple premise and good fit of your Shock Model.
At the sub-global scale, the Export Land Model seems justified by the data as expounded in this post. It also seems to match many people's conceptual framework.
At the individual nation-state scale I would argue that neither holds that much predictive value and we are thrown back on creating plausible stories for future production and consumption by taking into account 1) existing trends, 2) geologic factors like new discoveries depletion rates and 3) human factors -- political, environmental, technological, etc.
Best Hopes for wider circulation of all these ways of understanding the problem.
Regards,
Jon
I noticed you used the word "plausible", which is useful to establish degrees of certainty. To make any inferences to plausibility, the model has to include ideas from probability, otherwise you have a model which predicts a deterministic outcome. This is the real problem of the ELM and what makes the Dispersive Discovery and Oil Shock models extremely useful in comparison. I have both 1,2, and 3 covered.
1) Existing trends are incorporated through Bayesian reasoning, perfectly suited for a probability-based model
2) Got that covered with both models.
3) Have the greed quotient covered, technological advances accelerate and people will exploit whatever they find to the maximum extent.
ELM covers neither of these, except for (1) perhaps but that is likely just a brain-dead extrapolation.
As Edwin Jaynes said, "probability is the logic of science", something that the ELM folks have completely missed.
IMHO, I do not believe the following always obtains:
It is true most of the time but not always. It certainly can not explain what happened in the Netherlands with natural gas:
Of course ELM cannot explain this either which is why I want folks to have easy access to the actual data. Sometimes, mathematical approaches cannot explain what is going on and you have to do some serious poking around through the local history to understand what happened.
Actually you incorporate massive excursions (i.e. 'outliers") from what you expected into the model itself.
That is the fundamental idea behind most fat-tail models. There is an ongoing discussion of how the traditional statistics community condoned the practice of removing outliers from data. Some statisticians claim this was due to an unjustified need to force the data to obey the so-called normal or Gaussian statistics. The outliers always played havoc on the normal statistical measures, so the suggestion was to remove them.
http://www.leeds.ac.uk/educol/documents/00003759.htm
But as Taleb and others have pointed out with their Black Swan analysis, the outliers are very important and describe the actual situation. IOW, nature does not always follow normal statistics, and instead does what it does. The general rule is that it tends to fill up the state space subject to some constraints (the theory of maximum entropy).
The fact that Netherlands looks like it doesn't fit is acceptable if you have the model that can accommodate the variability.
The EIA doesn't have 2009 gas data, but from 1996 to 2008, the Netherlands showed a 1%/year NG production decline rate, with a 1.4%/year net export decline rate (EIA).
Consumption fell at 0.8%/year, but since this decline rate was below the production decline rate, the net export decline rate exceeded the production decline rate. As noted down the thread, given a production decline in an exporting country, if consumption does not fall at the same rate, or at a faster rate than, the production decline rate, then the net export decline rate will exceed the production decline rate, and the net export decline rate will tend to accelerate with time.
Incidentally, given the Netherlands fairly high C/P ratio (57% in 2008), when and if they show a larger production decline rate, the net export decline rate will be pretty high. In simple percentage terms--assuming flat consumption--a 10% decline in production would translate to a 23% decline in net exports.
"find and extract the oil as fast as possible"---
Yes, I totally agree with that idea, human nature and life forms in general seem to follow this rule....take as much as you can as fast as you can. It seems to be biological behavior coded into the genes. That is why I`ve intuitively kept ELM a little distant from my own (non-mathematical) calculations. I tend to focus on government behavior (scrambling to compensate for shortfalls) and prices of commodities such as oil. I think those are more valuable "tells".
The matrix E is, of course, time dependent and hinges on many factors such as oil requirements of a country as a function of price, state of the economy, introduction of other energy sources, political alliances, etc. Of, course, when oil demand exceeds production, alliances between producers and consumers will change. Does one sell to the highest bidder, not liked at all, or does one sell to a brother country for less?
When times become more difficult, then the bellicosity of a country towards others is a factor. In political science the bellicosity factors for many countries are computed given past history (for example, England and France have one of the highest). But in a time where there is a vital resource shortage, even a less bellicose country with a strong military force may try to secure these resources. To avoid military takeovers, some production countries may align with strong military ones for protection. Hence, the matrix E(t)must be multiplied with the alliance matrix A(t) and the bellicosity matrix B(t) to obtain C(t), the secured oil supplies of countries.
All this shows that it is next to impossible to estimate these matrices. It really requires a crystal ball that can look into the future. Scenario: Year 2050 and oil consumption by far exceeds production. If Canada then wants to sell oil to China because the pay the most, what would the U.S. do? The U.S. needs oil for the military, a high priority. Will Canada be invaded by force or just annexed in a friendly treaty to form the United North-American States? Or will the U.S. resign to cutting the military force? You see the difficulty in creating a predictive model?
Yes I see the difficulty indeed, and that was exactly what I was getting at in offering a matrix formulation. If you don't lay out the premise in detail, no one has any idea what the assumptions are.
Overall, this is not something simple like the fundamentally simple bean-counting model that goes into predicting the first-order global oil discovery and production curves. That one I can defend.
Very well put. Even a model of net exports incorporating various physical and economic feedbacks would only take one as far as the underlying fabric of international society and international trade remain intact, and maybe not even that far. It's like in game theory - as long as the endgame horizon is far into the future, behaviour in the present is predicted by the structure of the game. When the endgame horizon draws closer, the game can change in character nonlinearly as the participants start altering their behaviour in search of advantage.
"oil consumption far exceeds production"----that is impossible, logically speaking.
If the production isn`t there then people won`t be consuming it, which is the cogent point that sort of answers your argument.......without enough oil to power their machines, tanks, whatsits, make MREs, etc.....the US ARmy will be riding horses and shooting rabbits to power their bodies and getting to Canada will be a mighty task, beyond them. (Just as well!)
Jon, is "Other Liquids" in the EIA data set a code word for biofuels? Because the numbers I am working on are "Crude Oil, Condensates, NGPL and Other Liquids"
Given the disastrous EROEI of biofuels (well, other than in Brazil perhaps) should I have excluded biofuels from my dataset? But then what does one do about the consumption side...
On balance I think it was OK to leave them in, but comment & opinions, please...
Nice article, thanks.
Given the US deficit and the huge difference between its military and the next largest military I often wonder if ELM is the underlying reason for this otherwise irrational expenditure. If you assume ELM will require the US to "take" oil in the future then perhaps the military expense makes sense.
Kye Bay
The world is a hard Darwinian place.
You are essentially correct in supposing that ONE OF THE REASONS the conservative wing of the American political establishment has supporteds a large and powerful military establishment is to ensure that we will have access to oil and other resources we need to import when push comes to shove.
When the history of our times is written by the historians of a future age, one of the basic themes will be the right/ left divide in respect to the socialist state and the militaristic state.I suppose a disinterested hostorian will conclude than each side cooperated with the other to the extent necessary and achievable to get what it wanted.
Of course it is necessary to dress this formidable argument for survival up in the clothing of pride, patriotism,love of country, democracy, and so forth.
Whether all this is right or wrong is debatable and the answer will depend on value judgements of course.As a Darwinian, I place a very high value on survival, and as am amatuer student of history I believe the leaders of this country have done approximately what the leaders of any other large and powerful country in a comparable position would have done.
That doesn't mean they were "right", or that they are right today;they were/are simply playing the cards in thier hands, as were/are all the other leaders of all the other countries.
Nature doesn't recognize such terms as right and wrong;if she did, the rabbits would vote the foxes a diet of grasses and herbs.
One thing does seem to happen rather consistently through out history;countries which fail to maintain sufficiently powerful armed forces of thier own are regularly overrun by stronger countries.
We are essentially damned if we do , and damned if we don't, in this respect.
Thanks. I subscribe to the theory that history is not a story of intentional rational planned decisions but rather a story of doing whatever is possible to fulfill our programmed genetic behavior. In this light a huge military makes perfect sense. I also subscribe to Jay Hansen's theory that we are good at lying to ourselves and therefore I suspect our leaders don't acknowledge or understand their reasons for overspending on the military.
This is my view as well.
I work in biology.
I haven't seen anything to dissuade me from the belief that humans simply do whatever is expedient to maximize their selfish utilization of all available resources. The sole goal being to crowd out all potential competitors and win all available ecospace for exclusive use by one's "own" population (or "culture" in the case of humans) as quickly as possible.
Yes. For example, if coal and oil can be extracted we will burn it all. If is not available we won't. Now go read James Hansen's latest book to really get scared for your children.
I think the following is true --
- if a finite resource (not a sustainable resource) is being exploited by multiple enterprises,
and
- if each enterprise has high initial costs and significant economies of scale,
then
- the best economic strategy for each enterprise is to exploit the part of the resource that it owns as rapidly as possible, so long as it is marginally profitable.
In other words, for the above conditions, private ownership does not prevent the Tragedy of the Commons.
Yes, Tragedy of the Commons is exactly what is happening with nonrenewable resources as well as pollution sinks.
Most humans, maybe yes. But many societies are motivated by some other forces and these seem to have lesser problems moving towards some sort of sustainability or at least better use of resources.
Your words "whatever is possible to fufill our programmed genetic behavior" sums the whole shooting match up in very fine fashion.
Once somebody gets it in this respect, nothing men and women do is a mystery anymore.
I do however think that at at least a large minority of our leaders do understand the need for a strong military in terms of competition between and the survival of rival culutures.By leaders I mean all leaders, world wide, not just our own.
One thing about well educated people that never ceases to intrigue me is that while they seem to be willing to accept physical reality as it is describesd by physics and chemistry and geology and so forth,and the reality of boilogical evolution,only a small, small minority are able to take the last step of recognizing our speciesw for what it is-a naked ape.
Somehow almost everybody feels compelled to cling to the notion that there is something inherently different and special about us, something vaguely godlike, and that we are thereby expected to play by different rules than the rest of the biological world.
It just ain't so.
But I wish it were true nevertheless-which brings us right back around to your remarks about our ability to lie to ourselves!
Well said.
"I do however think that at at least a large minority of our leaders do understand the need for a strong military...."
My initial point was that the US could defend itself effectively with 20% of its current military. The huge overshoot must reflect some other underlying need like preparation for the effects of ELM.
Kye - Or as Dirty Harry answered long ago why he carried a .44 mag instead of a .38: "I like having an extra edge." Or as a young recruit asked the old gunny: how do I know if I dug my fox hole deep enough? Answer: "You'll know the second the first round lands close to you. And then you'll know you didn't dig it deep enough...no matter how deep you dug it in the first place."
"Somehow almost everybody feels compelled to cling to the notion that there is something inherently different and special about us, something vaguely godlike, and that we are thereby expected to play by different rules than the rest of the biological world."
Somehow, about the same percentage of "everybody" feels compelled to believe in a supreme being.
delete
OFM,
Over-run by whom?
Let me take your words literally (as they were written):
Russian paratroopers a la Red Dawn?
Chinese folks in a massive invasion fleet?
Canadians?
The only physical over-running threat might be from the Mexican border, and that could be blocked by using forces far smaller, less sophisticated, and expensive then the world-wide global strike machine we have built.
Since you seem like a pretty smart guy, I surmise that you meant that the U.S, would be 'over-run' in our quest for resources extracted from other countries...we would be out-competed, and thus we must resort to threats of intimidation by violence, backed up by periodic demonstrations of killing people and breaking their things.
This 'it is what a great power must do' thesis is simply an expression of the self-licking ice cream cone of American Exceptionalism.
It will work until it doesn't.
Seems like humanity is no different than the foxes and rabbits, or the yeast in vats...blindly following the biological imperative to re-produce and consume until natural limits (sources and sinks) dictate a crash.
Hello, Heisenberg,
I meant the portion of my comment about countries without adequate military power being over run as being a generally observed and agreed upon historical fact ; the US for now and for the next few decades at least is at a near zero risk of being invaded or overrun.
I did not intend that comment to imply the specific interpretation you made of it, but there is indeed a very real possibility of our being out competed and our resorting to " threats of intimidation by violence, backed up by periodic demonstrations of killing people and breaking thier things". As a matter of fact there is a VERY good case to be made that this very scenario you have so deftly if quaintly described is already an established fact.
I don't have time to write an essay trying to explain why the "ice cream cone"part of your comment is in my opinion off the mark;suffice it to say that while great powers don't NECESSARILY HAVE TO do anything,IN PRINCIPLE,they "MUST DO"SOME THINGS IN ORDER TO REMAIN great powers,meaning to retain the status and position of a great power.
You most definitely get it;"it will work until it doesn't".You are being sarcastic.
I would have said the same thing, more or less exactly, but in my own words, and dispassionately.The difference between us in this discussion is that I am simply trying to describe what is going on in relatively neutral academic terms, as if I were a biologist from another world.
If I were a rethuglican foot soldier so called conservative of the type so reviled here,I would of course believe that we would always win all of our fights forever, but I am a realist and rely on the genuine principles of conservatism to keep me for engaging in flights of fancy.We won't be on top forever; as a matter of fact,I rather think that our days as the sole superpower are already numbered, and that it in another fifty or one hundred years the global balance of power will have shifted to such an extent that the world as we know it may well exist only in history books-written by the new winners of course.
You are morally and politically engaged and therefore have a dog in the fight;I'm just an out of towm sports caster filling in and trying to be neutral in my commentary;what I have said would apply equally well to any dominant country at any time in history.
Of course I do not mind admitting that since this is the way the world IS, I am glad indeed that I was lucky enough to be born on the side that is winning at the time I am living.;)
Your last paragraph is in my opinion a very accurate if grim and sad description of the BIG PICTURE REALITY.
It fits very well with what we know to be sound scientific biological theory and fact.
I have said the same thing , approximately , several times previously.
Thank you Kye. Your instinct is correct about the military expenditure being irrational. It is well known that the US is wasting a very large portion of the energy it is consuming. A big reason is that fossil energy is still too cheap. If James Hansen's propsal for a stiff carbon tax with 100% rebate to each citizen were enacted, the trillions wasted on military adventures drastically scaled down, and the ponzi economy reined in, then we would see the dynamic US private sector pour trillions (over time) into renewable energy infrastructure and alternatives to fossil fuel private cars for the transportation problem.
This is really interesting.
Does this mean that peak exports is a leading indicator of peak production?
And when we can see peak exports clearly behind us peak production must be soon to follow?
DD
The BP and EIA data bases show a net export peak in the 2005/2006 time frame. The decline rate so far has been low, but IMO that is obscuring a very high underlying depletion rate in post-2005 global CNE (Cumulative Net Exports). The global net export data we came up with are as follows (principally BP, plus minor input from EIA):
2005: 46 mbpd
2006: 46
2007: 45
2008: 45
2009: 43
The rate of increase in consumption (C) as a percentage of production (P) for global net exporters* is particularly interesting. They went from 26.1% in 2005 to 29.1% in 2009 (C/P). A steady rate of increase in the C/P ratio is what eventually causes net exporters to approach zero net oil exports.
In my opinion, a reasonable estimate is that global post-2005 CNE may be about 50% depleted sometime around 2020.
*Net exporters with 100,000 bpd or more of net exports in 2005.
What were they at historically?
DD, there is no "sure thing" with these, but on balance I would say that peak net exports is a leading indicator of peak production. The reason is that the historic data show a strong pattern of long term rising consumption in almost all oil exporters who enjoy a windfall income from positive net exports. So, as production growth rate slows down before it hits zero and then turns negative, it is overtaken by consumption growth rate, making the net export growth rate negative even though the production growth rate is still positive. Thus you would expect to see a net export peak leading a production peak in any data set where the long term consumption growth trend is positive.
However, whether peak production is a global all-time peak or a deliberate act like an oil embargo cannot be answered by looking at historic production and consumption data alone. You need deeper knowledge to be able to tell the two different kinds of production peaks apart.
Peak production is a leading indicator of peak production. Peak net exports are nothing but a dependent variable. You can see this if you take a simple example: say oil exporters mark 50% of their marginal production increases for export, the rest of the 50% is consumed internally so the differences track. (You can try this with other numbers than 50% and you will get the same result)
P = Pe + Pc
(Production is exports plus consumption)
dP/dt = dPe/dt + dPc/dt
but dPe/dt = dPc/dt
(equal amounts go to production and export as a first-order approximation)
so making the substitution
dP/dt = 2*dPe/dt
Peak is reached when the slope equals zero. Both hit zero at the same time.
QED
And this is pretty much what Figure 1 shows. Peak production likely happened between 2005 and 2008 and so did peak exports. If you have a more parsimonious explanation for this than the math I have given above, I would like to hear it.
FIRST CLAIM: As long as consumption has a positive growth rate, peak net exports must necessarily come before the peak in production.
SECOND CLAIM: Net exports are not a trivially dependent variable of production and are therefore worthy of much more respect by WHT :-)
PROOF:
1. Assume for simplicity and for purposes of exposition that delta consumption is a positive constant and that delta production is a positive number which is initially greater than delta consumption, and which is falling gradually as the country approaches the production peak.
2. Peak net exports occur when delta production, which is steadily falling, equals delta consumption, which is constant.
3. But at the point of peak net exports, delta production is still positive, therefore production is still rising, and so the production peak has not yet occurred.
4. The production peak is reached once delta production falls some more to zero, and therefore by definition the production peak must come later than the net export peak PROVIDED THAT consumption growth rate is positive when production is about to peak*
5. Since the time interval between the two peaks is dependent not only on the rate of change of production, but also on the rate of change of consumption, and since consumption is independent of production, I conclude that net exports are not trivially dependent on production and that they therefore deserve to be studied separately for any insights they may yield that are relevant to the trading of oil among nations.
QED?
* Note: a positive consumption growth rate around time of production peak is the real world situation of almost all oil exporters.
One example will prove lumina's point (as well as the importance of having data that go back before 1980).
1965 -- peak exports
1976 -- peak production
I'll point out again that this will not matter to WHT at the global scale.
But it does matter to lumina at the national scale.
The shape of Romanian production and consumption post peak is also not one to be reproduced by any mathematical models. You really have to study Romanian history to figure out what happened. Math will only take you so far.
Jon
Slight anticipation of peak, what is that 2-3 years? not that big a deal
Apart from Romania not providing a huge set of data to deal with and therefore susceptible to counting noise, Romania is very easy to model.
http://mobjectivist.blogspot.com/2006/07/romania-oil-shock-model.html
The fact that it took place over the entire span of the oil age makes it a bit of an oddball. There was a huge latency between the original discoveries in 1860 and the start of strong production, but apart from that, the production peaks were just delays of the the discovery peaks. I can account for them without having to add perturbation shocks, IOW a straightforward reading of the Oil Shock Model.
Next?
This particular example doesn't just prove the peak timing differences point. It is also consistent with the "net exports goose consumption" point.
While Romania was a net exporter, and for a little while after that period ended, strong consumption growth continued. And it wasn't just any era: Romanian consumption sailed through the first oil shock in 1973 with barely a hint of a pause. By the time the 1979 oil shock rolled around, however, Romania became a net importer. This time around consumption fell in the midst of the oil shock, and in about another decade from that time, the Romanian dictator was executed in the streets as the Iron Curtain fell.
A number of factors will affect consumption growth in net exporters. All other things being equal, the status of net exporter is an independent force that tends to speed up consumption growth.
Afraid of stating it mathematically, eh?
P = Pe*(1+f(t)) + Pc*(1-f(t))
(Production exports go up as a perturbation described by f(t))
dP/dt = dPe/dt + Pe*df/dt + dPc/dt - Pc*df/dt
(expanding using the chain rule)
but Pe=Pc and dPe/dt = dPc/dt
(equal amounts go to consumption and export as a first-order approximation which agrees with Figure 1)
so making the substitution
dP/dt = 2*dPe/dt + (Pe-Pc)*df/dt
but since Pe=Pc the second term disappears and you get the same thing as before
If Pe>Pc and df/dt>0 then dPe/dt has to be negative at the peak, which does imply that the export peak occurred earlier, yet df/dt could just as easily been negative for awhile and then the export peak would have occurred later.
In any case, these are all second order effects and the fact that Figure 1 shows the export peak coinciding with the global production peak indicates that these effects are inconsequential. The utility of this as a leading indicator is marginal at best.
In the real world, where almost all net exporters have positive and varying consumption growth rates, net export peaks are not dependent variables of production, and they are also leading indicators of a production peak. For exporters with generally negative consumption growth rates (I don't know if any exist) then the production peak would be a leading indicator of a net export peak.
That would be too easy; explaining a mathematical insight in plain English is harder.
You opened up a heaping can of worms with that statement.
Elsewhere on this thread a discussion started complaining about what a model actually meant. Well, the current model of the English language is one of a highly ambiguous, context-sensitive grammar, best represented by information theory.
Let me put it this way: There is a reason that we don't program computers using English.
So, yes, explaining a mathematical insight in plain English is harder and likely verging on the impossible. That's why mathematical notation was developed!
I beg to disagree. Here's a small piece about the physicist I happen to admire the most, and not because he got a Nobel prize. It was because he had the far more rare twin gift of being both a great scientist and a great teacher and communicator. Quoting from the Wikipedia entry on The Feynman Lectures on Physics:
The first half of the Feynman Lectures were later published in a book that goes by the title "Six Easy Pieces", these being: Atoms in Motion, Basic Physics, The Relation of Physics to Other Sciences, Conservation of Energy, The Theory of Gravitation and Quantum Behaviour. In the 100 or so pages covered by the first five pieces, there isn't an equation in sight. There are a few numbers and diagrams, but it is mostly plain English. The first equation that I saw flicking through this was in the last essay, which is also mostly English, where there are a few equations on a couple of pages.
My 13 year old daughter is reading Feynman's book right now. She and I are having a lot of fun talking about things like "what keeps a balloon inflated". In the language of my conversations with her, the "teeming crowds" of the invisible molecules of air are trapped inside with no way to escape, and so they are incessantly bumping against the balloon's inside walls, collectively stretching them outward because the sparse number of molecules on the outside of the balloon cannot compete in "bumping power" with the teeming crowds on the inside. But as the rubber stretches into an egg shape, it makes more room which calms down the crowd somewhat, and also the balloon pulls back on itself and squeezes the crowds inside it, joining forces with the guys outside in the battle to stop the inflation and the stretching, which happens when the total opposing forces are equally matched. Then we got adventurous - we read somewhere that for gases, what we call "temperature" is really the speed of the molecules as they zip around inside the balloon, so we decided to put our inflated balloon in the fridge to see if the bumping power would be less after the air inside was cooled down. It must have been - because the balloon shrank and became smaller.
When this 13 year old grows up a little more and sees PV=QT scribbled on a blackboard, she will have a better chance of experiencing this wonderful world of maths, physics and equations, thanks to Richard Feynman and to his rare gift of communicating mathematical insights in plain English.
Well, Richard Feynman said all sorts of things. He is the Yogi Berra of physics, so what?
I read all of Feynman's Lectures. They are full of formal notation.
You can't do the bookkeeping of quantum states without having something like the bra-ket notation.
He has pages and pages of explaining topics simply by using bra-ket notation.
You are confusing Feynman the showman with Feynman the mathematician.
He also said "I think I can safely say that nobody understands quantum mechanics".
That is why all the formal math is there, because it is a descriptive tool and without it you will be lost.
Very good work. I'm in the process of reducing my office commute from 10 minutes to 10 seconds (home office), so time is limited while I try to find items I packed away in some box, but a brief review:
I actually stipulated a simplistic mathematical model to help me understand what happens to net oil exports in an oil exporting country, given an ongoing production decline rate and an ongoing increase in consumption. It seemed reasonable that the net export decline rate would exceed the production decline rate, but I was stunned at how fast the volume of net exports declined. What the model showed was that: (1) The net export decline rate exceeded the production decline rate; (2) The net export decline rate accelerated with time and (3) The decline was "front-end" loaded, with the bulk of post-peak CNE (Cumulative Net Exports) being shipped early in the decline phase.
Only three years into a nine year decline, "Export Land" had already shipped 60% of post-peak CNE, versus a 40% decline in the annual volume of net oil exports.
The three factors which control the net export decline rate are: (1) Consumption as a percentage of production at final peak; (2) The rate of change in production and (3) The rate of change on consumption. Given an ongoing production decline rate, nnless consumption falls at the same rate, or at a rate faster than the production decline rate, then the net export decline rate will exceed the production decline rate, and it will tend to accelerate with time.
"We" (primarily my brilliant co-author, Samuel Foucher) have attempted to mathematically model future net oil exports for the (2005) top five net exporters. Regarding Characteristic #3 of the ELM above, Sam's middle case forecast is that the (2005) top five net oil exporters will have shipped about half of their post-2005 CNE by the end of 2012 (2013, high case). Characteristic #3 is particularly dangerous, because an ongoing slow decline in the volume of global net oil exports is in all likelihood obscuring a high underlying depletion rate in post-2005 global CNE.
And then we have the "Chindia" factor. Their combined net imports, as a percentage of total global net exports*, went from 11.3% in 2005 to 17% in 2009. If we extrapolate this trend, they would be consuming 100% of global net exports in 16 years.
*Net exporters in 2005 with at least 100,000 bpd of net exports (Principally BP data base)
So in the next 16 years, we get to see just how this is NOT really going to happen. What sort of plans in the next 16 years will have the rug pulled out from under them and what will the effects be? Whatever it is has to happen in 16 years.
Seems likely to me that the 'plan' to grow so as to consume 100% of exports is the most delicate thing around.
I agree that it's not going to happen, but I think that what will happen is that most developed countries, especially the US, are going to be forced to make do with a declining share of a falling volume of global net oil exports.
Steve Kopits wrote about potential China scenarios in his guest post How Fast will China's Oil Demand Grow?. I notice that China's vehicle fleet expanded 250.90% 2000-2009, as opposed to 239.21% 1990-2000 and 115.75% 1980-1990. So linear growth forward gives 386.04% 2010-2020? That would be 247 million cars - hey, they do want to be like the US! So call that 7-9 mb/d total gasoline demand, maybe?
That's a figure for their fleet that's in the middle of various forecasts I've looked at, btw.
Very interesting, thanks for that link. I was offline when that was posted and missed it completely.
As noted down the thread, IMO out to at least the 2015 range, it's just a question of how fast that Chindia's net imports increase.
http://www.independent.co.uk/news/world/asia/fears-of-chinese-land-grab-...
Fears of Chinese land grab as Beijing's billions buy up resources
The elite that runs China is riding a running tiger. If they try to get off, or if the tiger stops, it will shake them off and eat them. So the Chinese elite will do all in their power to head off collapse risks, even if it means starving all other importers of the oil they need. Remember that from their geographical position, the Chinese had front row seats to the spectacles of FSU implosion and North Korean famines. It is in this sense that I stated that China and the US will not "play nice" when it comes to sharing a shrinking net exports pie.
It is even possible that the second cold war may have already quietly began - a war about the control of depleting nonrenewable resources which are not sufficient to meet total worldwide demand.
lumina - "second cold war" Not a bad analogy. And I would offer that it's been going on since I started in the oil patch 35 years ago. Beating out “the other guy” for access to mineral leases was a constant discussion. Of course, the other combatants were companies and not countries. Now we see the primary foe is a country. It may be done by Chinese “companies” but they fall into a very different reality than most other companies. First, capitalization: no company has a war chest close in size to these Chinese companies thanks to the financial support of their govt. But IMHO their biggest advantage is a different view of valuation. The rest of us are focused with profit and net present value. Not that the Chinese completely ignore these factors but for them the main goal is access to reserves. I’ve had only minimal contact with managers of Chinese oil companies but what struck me as their most powerful “weapon” in this cold war was a simple and honest question they asked me: If it cost your company $40/bbl to acquire oil why would you sell it to your people for more than $40/bbl? Explaining in terms of profit doesn’t make sense to them: the “profit” would be flowing from the people who would also be the recipients of the profit. So what’s the point? Granted, that’s a somewhat simplistic way to describe the situation but it does seem to be the way the Chinese are “deploying” themselves in this new cold war.
Oil has always been the 'loss leader' creating sales in autos, roads, parking lots, shopping centers, 'housing' and whatnot.
Now that oil is becoming valuable, the concept is changing, but not fast enough for the Chinese who have fallen into the 'USA lifestyle' trap.
What bankrupts the goose will also bankrupt the gander. It may take a little longer ... Look at that oil price! $82!
It's happening right under everyone's nose.
Just today Xinhua News Agency reported that China does not intend to reach a peak in its carbon emissions until it reaches a GDP of $40,000 per capita. For comparison, today the figure for Chinese GDP is $3,000 per capita.
Thank you westexas. Your ELM perspective is important and I hope this demonstration that it is not only consistent with, but pervasively visible throughout real world data, will prove useful to you, Sam and the TOD team.
Two Global Net Export Scenarios for 2015
Assumption: A 5% Decline in Production From 2005 Level, at two consumption levels
At the 2005 to 2009 rate of increase in consumption, top 33 net exporters’ consumption in 2015 would be 19.6 mbpd (versus 17.5 mbpd in 2009). Let's look at the effect of a 5% decline in production, in simple percentage terms, for two different C/P ratios. Here are the 2005 data:
2005 Data:
Production: 62.2 mbpd
Consumption: 16.2
Net Exports: 46.0
Chindia's Share of Net Exports (5.2 mbpd): 11.3%
“Available” Net Exports, excluding Chindia’s share, are 40.8 mbpd
Scenario One for 2015
Assume Production Declines 5% , Consumption = 17.5 mbpd (2009 level)
Production: 59.1 mbpd
Consumption: 17.5
Net Exports: 41.6
Chindia's Projected* Share (12.1 mbpd): 29%
A 5% decline in production causes net exports to drop 9.6%, in simple percentage terms relative to 2005. "Available" Net Exports, excluding Chindia's projected share, drop by 28% (40.8 mbpd to 29.5 mbpd).
*Based on Chindia's 2005 to 2009 rate of increase in net oil imports (BP)
Scenario Two for 2015
Assume Production Declines 5%, Consumption Increases to 19.6 mbpd
Production: 59.1 mbpd
Consumption: 19.6
Net Exports: 39.5
Chindia's Projected* Share (12.1 mbpd):
A 5% decline in production causes net exports to drop 14%, in simple percentage terms, relative to 2005. “Available” Net Exports, excluding Chindia’s projected share, drop by 33% (40.8 mbpd to 27.4 mbpd)
*Based on Chindia's 2005 to 2009 rate of increase in net oil imports (BP)
Summary
If we extrapolate the 2005 to 2009 rate of increase in consumption by the exporting countries out to 2015 and if we extrapolate Chindia's 2005 to 2009 rate of increase in net imports out to 2015, and if we assume a very slight production decline among the exporting countries (0.5%/year from 2005 to 2015), then for every three barrels of oil that non-Chindia countries (net) imported in 2005, they would have to make do with two barrels in 2015.
Interesting conclusion. Projecting historic rates forward has value irrespective of whether the future ACTUALLY turns out to be like the past (validating the linear extrapolation) or not (invalidating it). Here's why:
In a way, what westexas is saying is that "In order for the future to be a linear extrapolation of the past (for China and India), the OECD has to cut its oil consumption by a third (relative to 2005 levels) within 5 years".
Or in other words, something has to give, whether Chindia's future is a linear extrapolation of their recent past, or whether it isn't. A net export squeeze is approaching.
I finally settled on two short term scenarios for global net exports--out to 2015--for our ASPO presentation, rather than trying to make long term guesstimates. With the top five, Sam has some mathematical support for his projections, and he so far has been right about their net exports.
At least out to 2015, I think that it is just a question of how fast Chindia's net imports increase and how fast consumption among the exporting countries increases. I think that the Thirties analogue is important in this regard. Based on a global production chart, it looks like global demand only fell one year, in 1930, and it rose thereafter. US oil prices hit their low in the summer of 1931, rising at 11% per year thereafter, out to the summer of 1937.
The remaining factor is production by the exporting countries.
Wouldn't this decline be mostly due to US foreign policy, which has supressed exports from Iran, Iraq, and Venezuela over this time period?
(Oops, meant to reply to WestTexas data above.)
This model does in fact support Iran's position with regard to developing nuclear energy for civilian use. Perhaps the Iranians understand it better than most and recognize that they have to move away from using oil for domestic energy production. It would also stand to reason that those who are unwilling or unable to understand the implications of the ELM would find Iran's claim to need nuclear energy preposterous given their reserves of oil and gas.
http://en.wikipedia.org/wiki/File:Shah-nukeIran.jpg
The Iranians really do have legitimate reasons to have nuclear power plants . Of course I don't like the idea of them having nuclear weapons....
I really hate the fact that the USA has nuclear weapons.
Undertow, Bravo!
Perhaps someone can post some follow-on articles about the U.S. role in putting the Shah in power and keeping him there (it worked until it didn't), and some pics of Donald Rumsfeld shaking hands with Saddam Hussein circa 1983?
Oh, wait:
http://www.gwu.edu/~nsarchiv/NSAEBB/NSAEBB82/
http://en.wikipedia.org/wiki/1953_Iranian_coup_d%27%C3%A9tat
Our great power game-playing entangles us deeper into other country's internal unrest and local power struggles and invites blow-back, which causes another bigger spiral of military entanglement...
I don't think you could extrapolate what happened in China, United Kingdom and Norway to what might happen with Saudia Arabia, Kuwait and Iraq. The former are industrialized nations with a diversified economy and a substantial if not self-sufficient agricultural production. The latter have little going for them other than oil and oil products. A rule of thumb for the Saudis might be that they would try to maintain a constant level of oil revenues, reducing exports only to the extent that prices rise.
To see what might happen in KSA one might look at Yemen. Yemen did have oil and did export. Now, not so much. Possible complications of differing political circumstances, also, not so much.
Or you can simply look at 30 years of KSA oil consumption history from the EIA, no need to extrapolate from Yemen..
The CAGR (compound annual growth rate) of oil consumption in KSA from 1980 to 2009 was 4.7% p.a.
Their peak production was in 2005 at 11.4mbpd and consumption in that year was 1.96mbpd
In 2009, their production was 10mbpd and consumption 2.43mbpd, for a net export decline of 1.83mbpd over 5 years.
So in the last 5 years, KSA production fell about 2% p.a. but net exports fell by 4% p.a. as consumption rose by 4.7% p.a.
KSA is actually a poster child for ELM
Or is KSA a poster child for ongoing religious isolationism?
Web,
Why focus on one factor? There are many reasons for limiting exports.
Invoking Occam's Razor, a simpler explanation is that leaders of countries are bound to serve their citizens before the serve the rest of world.
This leads directly to ELM.
Luminua has done a great job of seeing the forest instead of the trees. The impact of religion on peak oil is just another tree.
There are increasing reports of oil exporting countries building refineries. One explanation of why they do so at this late stage in the "petroleum age" is the need to refine the increasingly heavier grades of crude and the relative lack of refining capacity for that. But once built, the presence of the refinery in the country of the producer is strategic, as it enables leaders to do exactly what realist said above - to serve (or appease, as the case may be) their local population. As endgame horizons draw closer, this latter strategic consideration will carry more and more weight in such investment decisions.
Yemen had its peak in 2001. For Yemen, we have 9 years of post-peak data. My thought is that 9 years post-peak is not an extrapolation FOR YEMEN, and Yemen has many features that are similar to KSA.(population density, annual rain fall, etc., etc.)
I have had some difficulty getting at the data while keeping up with the interesting comments here, so I don't know whether or not Yemen has some features that make it a poor example of ELM. Of course it is much smaller than KSA. But ELM does not use absolute size of the EL (export land) explicitly.
The difficulty with this idea is that KSA is so very large in comparison to the world market. Like USA as an importer, KSA as an exporter is the 900 lb gorilla, and could be expected to provoke earth shaking responses in the market. Whereas Yemen total production might never have exceeded the reserve capacity of the rest of the market. So, absolute size can matter. Perhaps.
I can turn this difficulty into a research question. Does ELM show similar post-peak behavior in all post-peak countries, independent of country size? Or is there some need for an additional term that is dependent on country size?
Yemen is also a poster child for ELM:
Year.................1995 .... 2000 ... 2005 ... 2009
Production....... 352 ..... 448 ..... 410 ..... 293
Consumption..... 72 ....... 97 ..... 128 ..... 155
Net exports..... 280 ..... 352 ..... 282 ..... 138
This is from my EIA-derived dataset including the small refinery processing gains boost, as per the methodology described in my article.
I think the first ELM insight which is really a mathematical tautology operates similarly for large or small countries, with the amplification effect of delta production on delta net exports (in percentage terms) depending on the fraction of consumption to production at the time of the production peak, as westexas has pointed out.
The second insight, the effects on consumption growth of the windfall from having net oil exports as a tailwind helping economic development, will likely be more pronounced on developing countries and may be absent from OECD exporters because they are already developed and may even be deindustrializing. It may also be absent in the cases of deeply corrupted kleptocracies, where virtually all of the oil windfall goes to Swiss bank accounts of the elites, in which case you can have the population consuming only a steady low volume with exports exploding to the upside, but no economic development to speak of. Consumption growth rates are also affected by demographics, of course, but it would be easy to generate per capita numbers for everything to isolate out the relative contributions of population growth and economic development to oil consumption growth.
Here are the exponential rate of change numbers (1995-2009)
Production: -1.3%/year, down by 17% in simple percentage terms
Consumption: +5.5%/year, up by 115% in simple percentage terms
Net Exports: -5.1%/year, down by 51% in simple percentage terms
The C/P ratio went from 20.5% in 1995 to 52.9% in 2009.
But Saudi oil revenues have increased by 2.89% annually between 1980 and 2010. The Saudis consume more because they can afford to consume more. If the price of oil went into a prolonged depression, they would consume less oil in order to be able to purchase the other necessities of life.
http://www.theoildrum.com/files/LaherrereSaudi_09.PNG
Around 1989 and 1995 you can see a slight dip in consumption corresponding with a period of low prices and low production.
Population and demographics are the primary problem of most producing nations and also the fundamental driving force for ELM. Rising individual consumption is certainly a part but its secondary. You have to take it into account.
Indeed we have excellent info on what happens from post WWII baby boomer demographics which fit well with whats going on in many producing countries right now.
In general the population driven ELM effect will be in force well past zero net exports with most of the world turning into significant importers. Of course this is impossible but its also impossible for these countries to reinvest to diversify without keeping internal consumption high.
Many of these countries don't have strong governmental institutions indeed using the US as and example and the strife in the 60 and 70's one can deduce that a baby boomer effect will eventually challenge the status quo.
Thus the internal dynamics seem to suggest that the most probably outcome will be what I'd call the golden goose effect. These countries will be forced to eat their golden goose or its eggs. Indeed it seems to be simply a variant of Jevon's paradox with cash flow from exports complicating matters.
Now whats really interesting is that when supplies are strained when and exporter suffers internal political strife oil prices should rise and this should rev export land dynamics in the other temporarily stable exporters.
This domino effect if you will that forces other exporters into the golden goose situation should be important.
To some extent certainly you have changes in import demand but the key and critical part is that the major force is rapid political destabilization or spikes. Smooth models cannot capture these point effects and the resulting economic ripples and eventually tidal waves they cause as problems in one country ensure others are forced into a similar scenario.
Yes, but what ultimately drives population growth?
The persistent energy surpluses released from fossil fuels solved many of humanity's traditional problems in the 19th and 20th centuries (and created new ones - chief among them unemployment!). The Four Horsemen (war, famine, plague and is pestilence the fourth?) have been kept largely at bay, ultimately thanks to economic prosperity and food security enabled by the burning of fossil fuels. The exceptions when one or more of the Four Horsemen broke loose to devastate human populations (e.g. the two World wars, Zimbabwe, Darfur, famines in China and North Korea, etc) only serve to underline the rule that large energy surpluses from fossil fuels ultimately enabled the population growth we have in the first place by helping human societies to keep the Four Horsemen at bay for extended periods.
So in my opinion, over very long time scales, a garden of Eden's worth of natural resources can and will hold the Four Horsemen at bay and boost population growth rates, eventually into overshoot mode. Where is this wonderfully wise man who signed all his posts "Are humans smarter than yeast?".... Was it Bob Shaw from Phoenix, Arizona? Is he still around here at TOD?
Can you create a graph similar to figure 6, but without China?
Here you go - I'm not the author but I've used the same datasource:
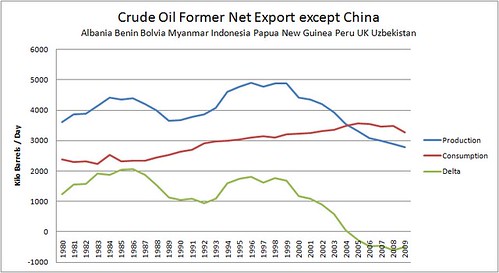
Yes, this is roughly what it looks like with my own cleaned-up dataset as well. Thanks for doing that!
Interesting that taking out an importer of China's size only moved the zero next export date up by 4 years for this group.
Also, China has plenty of economic growth due to exporting its cheap labour in the form of finished goods, hence no problem paying for extra oil. Taking out China from this figure shows that consumption for the rest of the group stopped rising about 1 year after zero net exports hit. Coincidence? I don't know.
Did USA's oil consumption stop rising about a year after we reached zero net exports hit?
That would have placed it in 1950. Obviously it didn't happen because the underlying first-order global production model far outweighs the effects of ELM.
So does ELM=Doom or not? I need to know what size of bunker to buy. ;)
How about a stacked graph of production and consumption from your various classes of exporter/importer as delineated in the article? That would sum up its conclusions rather neatly I'd think.
Ever mess with Google Docs, Web? I was very impressed with the Oil Demand over Time and Income widget Morgan Downey cooked up. You could throw together something similar for future TOC/TOE/TOI/TOetc scenarios that people could play with, would make for a very interesting tool.
Until then we keep screwing around with the numbers. I did a simple headcount of who was contracting/expanding production YOY in the BP data:
The total count keeps increasing, of course, post collapse of USSR and the original Balkanization; but even factoring for that I think we have a problem, Houston.
Enjoyed your article, George, btw. Nice presentation.
A stacked graph is a good idea, but it has to use a free-market trade policy as a baseline and should go way back in time. The USA would show up quite oddly if the data went back far enough.
I use Google Docs regularly. The last time I created a Monte Carlo model of Dispersive Discovery that attaches a patch to each of the TOD regulars. Every time you load it you get an alternate history.
http://spreadsheets.google.com/pub?key=0AuycoDmNCe6wdFVxQ3VoRG1ZdWNjem1V...
based on this post:
http://mobjectivist.blogspot.com/2010/06/oil-discovery-simulation-realit...
The Downey widget is quite nice.
Your suggestion on a tool is appreciated but I can't see myself putting in effort on something that I don't believe will have any kind of payoff.
Thank you KLR. I don't know if ELM is doom or not, I just know that addiction to fossil fuels is deadly in the long run and that my country and my businesses should kick this bad habit, before it kills us.
The problem highlighted by ELM, I believe, is that this deadly addiction can kill faster than most people assume. There is a big difference on one's decision to kick a bad habit if, say, smoking reduces average life span by 10 years vs 40 years, likewise there is a big difference if the economic and social withdrawal symptoms from fossil fuel addiction will strike hard starting 10 years from now, or if they will be a low-intensity illness gradually getting worse over 40 years.
As for worrying about doomsday in general, it is probably best not to as long as one is doing all possible to avert it. I think it was Lord Keynes who famously said "in the long run, we are all dead."
America is the world's biggest and most dynamic economy and issuer of the world's reserve currency. The rules and constraints that apply to everyone else mostly don't apply to the USA - ("yet", some would add!)
Then substitute Japan or Korea or Taiwan for the USA. I see significant oil consumption increases in spite of these countries hitting the export transition long ago.
You can say that this is the result of the USA dragging them along but the sword cuts both ways. Future ELM productivity accelerations among other peak exporting countries will not have the benefit of USA pushing them along as global production declines.
WHT--I think I am beginning to understand your complaint about ELM. It is not a theory with predictive value; it is a set of observations, of interesting patterns. Those patterns of negative correlation are probably not indicative of causation, but are a snapshot of common patterns observed when worldwide supplies tighten as compared to worldwide demand. The USA didn't show that pattern when it became an importer because worldwide production was on the increase. I believe you are saying that worldwide production is the most important independent variable and that the import and export patterns are dependent variables. The dependent variables are affected by geology, politics, economics and the observed patterns are an artifact of the recent set of independent variables which must be named. Am I close?
I don't think so. The USA didn't show that pattern because it has been accumulating private sector debt for 40 years now, because the dollar is the world's reserve currency, because the US has been running large trade deficits and because it is the world's largest economy. If you can easily pay for your imports, whether with debt or with export revenues, then you can import whatever is required by your growing economy without budgetary constraints getting in the way.
Paying for oil imports is like a massive tax on an oil importing economy. The GDP of Cyprus is of the order of $21.5 billion. We import about 60,000 bpd according to the EIA, which costs $1.75 billion per annum (at $80/bbl) or about 8% of GDP. Not surprisingly, Cyprus has accumulated plenty of public and private debt along the way. But if oil importers are collectively facing a massive tax, then oil exporters can be said to be enjoying a massive windfall subsidy. Any subsidised economic activity will tend to expand more than it otherwise would have.
So, there is a reasonable causation story for the correlation we see in the data. Population and starting levels of economic development and many other factors are needed for oil exports to cause oil consumption growth, but there can be no argument that all other things being equal, the revenues from oil exports provide a tail wind which can help economic development. Dubai would likely still have been a fishing village without the UAE's oil windfall. And a fishing village burns a lot less oil than an indoor ski slope in the middle of a desert.
Well said.
The way that ELM describes its "interesting patterns" as you put it, is quite revealing as well. Since no underlying physical model exists, they have to use something akin to a Dead Reckoning or regression model to extrapolate future data points based on recent points. The extrapolation is only based on the data and no physical parameters enter the picture. So if a curve is sloping downwards, they will assume this will continue.
This is what Lumina says elsewhere in this thread:
The US became a net importer, in 1948 (22 years prior to its production peak), because it's rate of increase in consumption exceeded its rate of increase in production. China showed a similar pattern, when it slipped from net exporter status to net importer status, before a production peak.
Regarding the ELM, I simply proposed a simple mathematical model to help me understand "Net Export Math," the interplay between production, consumption and net exports. Other than having an intuitive assumption that the net export decline rate would exceed the production decline rate, I had no preconceived notions as to what the model would show. I was, and remain, stunned at how rapid the net export decline is. As noted elsewhere, given an ongoing production decline in an exporting country, unless consumption falls at the same rate as, or at a rate faster than, the production decline rate, the net export decline rate will exceed the production decline rate, and the net export decline rate will tend to accelerate with time.
So far, I haven't found any examples of oil exporting countries, showing a production decline, that showed a long term rate of decline in consumption that caused the net export decline rate to be less than the production decline rate over a multiyear period. We recently looked at rates of change for 16 net exporting countries showing multiyear production declines. The median observed net export decline rate is about 7%/year, within a range from about 2%/year to over 20%/year. Note that the median rate would cause net exports to decline by 50% in 10 years.
True, but I suspect that is only for the cohort of declining net exporters. You would then need to estimate by how much net exports would grow in the cohort of growing net exporters, and work out the "net" decline. That is why I covered all the exporters in my article, including those who aren't declining yet.
True of course, but the point I was making was that so far I haven't seen any examples of oil exporting countries--showing production declines--where there is a multiyear trend of the production decline rate exceeding the net export decline rate.
And of course, because the net export decline rate tends to accelerate with time, the cumulative impact of the declining net exports far exceeds what one sees with a simple low single digit production decline rate.
Yes, I was just trying to clarify the "net exports down by 50% in 10 years" comment because I didn't want any readers to mistakenly think that you were referring to global net export decline.
Lumina,
Thanks for all of your work.
In comparing figure 6 and the "without China" graph I particularly noticed how closely the form of Production and Delta (difference) curves track. China is a clear exponential and skews the entire set, the 4 year difference is due to the ~1200 net imports added by China from 2000-2004. This throws into sharp relief the roughly equal drop in output for the non-China subset.
It is becoming ever more clear that the United States will not "play nice" no matter which party is in power. Perpetual war appears to be baked in the cake and as Dick Cheney made clear American life style is non negotiable.
Congress and the Obama Administration are following the last administration's lead. We are still in Iraq after nearly 2 years of Obama. Subsidies for biodiesel have stopped, plants sit idle and many of the companies are bankrupt.
Now it appears ethanol subsidies will be dropped at the end of the year and less efficient producers may meet the same fate as biodiesel producers.
On top of that we have the spectacle of many groups protesting a switch to E-15.
http://www.dtnprogressivefarmer.com/dtnag/common/link.do?symbolicName=/a...
It is becoming clearer and clearer that the United States intends to simply take the oil it needs when push comes to shove. Until then, it will try to protect its supply with force. Actions speak louder than words.
The American military intends to grab what it needs first. Then the non negotiable American life style will get what it needs. This implies that there will be countries shut out of oil completely after Peak Oil if they can't grab some or pay the price.
You have been warned.
Sad and tragic you see the United States as a predator. World cop, certainly, for the unearned benefit of Japan, Korea, Germany, UK, France, Italy, Greece, Taiwan, Egypt, KSA, Bahrain, Kuwait, Iraq, Columbia, and Israel of course. We've become so accustomed to peace and prosperity that "war" has lost its essential quality. Vietnam was the last time that the United States waged war. We didn't conquer any oil fields. Pumping IMF cash and IOC capital into Russia, we handed Putin the prize. After deposing Saddam, we paid much, took nothing.
Americans are chumps. Freest and strongest and least corrupt. Frequent and fair elections. Limited government. If American power ever fades, you'll learn what war historically was and could be again.
I'm sure the Danes, Dutch, Poles and Norwegians remember.
I hope you are not serious. I am certain that war has NOT "lost its essential quality" for the Americans injured, maimed and killed in the US drive to conquer oil fields and prop up its military & military contractors. Those people, plus the millions of Iraqis and others killed and injured there surely would also disagree with you.
These people were essentially sacrificed so that bomb making companies and other arms suppliers could keep producing and charging for their output. WHile other Americans work to pay taxes to fund it all.
War has lost its essential quality?????? No, it has not. Not now, not ever. War is always, has always, will always be about the strong taking advantage of the weak. The American soldiers in uniform, despite their big muscles, are weak pawns, uneducated, poor, and (mostly) not as savy as their masters who sit safely in their luxury SUVs stuck in Washington traffic.
You should look beneath the surface of the patriotic speeches your USA politicians spout about "freedom".
One reason I emigrated from the US, never to return, was the flag-waving there, the "we are so great" assumption that I just couldn`t stomach and still cannot. That assumption leads people to believe that whatever the government wants to do must be good. Even if it is not.
Pi,
I understand where you are coming from and admire your noble sentiments and principled point of view.
But you might want to think about this in respect to "war has not lost its essential quality" in terms of present day American politics:
The current war in which we are engaged is something that barely registers with the typical American on the street,unless he or she has a family member or close friend in uniform.
Except for policy wonks and a (relatively) small group of citizens motivated by moral considerations, we have more or less simply forgotten the fact that we are at war.
We are too busy feeling sorry for ourselves about our houses and cars and vacations and stock portfolios to be bothered.
In a country as big as this one, a couple of dozen of our own dead and maimed on a daily basis is simply not enough to make the news these days;we are more interested in athletes and movie stars.
The problems of the local citizens of the places where we are fighting are of so little interest to us that we mostly don't even think about them in passing.
Our elected leaders, including the ones in power now, are really and truly afraid of only one thing-angry voters intent on kicking them out of office because the economy isn't rocking and rolling.
Almost the very last thing I would expect either party to do is to actually pull our armed forces out of the Middle East for fear of being held accountable the following election cycle for a shortage of imported oil in the event the oil ceased to arrive safely on our shores.
War belongs on a continuum of other human behaviors where the strong also take advantage of the weak. It is a special case, though, because it is not controlled easily, with chances for chaos.
The amazing energy profile of the US has led to this situation---the people there are no better and no worse than any other country. But all the energy available has probably led to unbalanced situations where people perceive advantage from a stronger center and act on that premise.
No politician has the guts to re-connect the American people to the costs of our military policy to secure our access to ME oil:
1) re-institute the draft; no exceptions due to college attendance, wealth, status...
2) charge a tax on oil and diesel and jet fuel etc. to cover at least 50% of the total cost of the U.S. military (including retirement, Tricare, and the VA costs and any 'war supplementals')per year.
Between those two actions, people would suddenly be a lot more aware of/connected to our war policies.
Warfare has been much much nicer than it otherwise would have been not to mention more expensive in the recent past. This is due entirely to the presence of the media on the battlefield.
Warfare has not been as total as casualties are not as tolerated by the western civillians. Ordinarily (and in the future) War has resulted in random mass death, mass migration of civillians, and total Destruction of the countryside, complete disreguard of the recognition of humanity of the enemy.
Ordinarily Iraq, Afghanistan, Vietnam etc would have been sorted or else.(no holds barred) even American wars were total until recently.
Media is a strategic consideration that can influence the conduct and outcome of a conflict or even if millitary operations are feasable. To enter into a conflict is pollitically difficult. It's hard to feel good fighting in a war. The moment a non-combatant dies the idea of being the good guys just goes out the window. It's hard to feel justified about being there when innocent bystanders are maimed or killed, taking hits because your there.
Or when you're under wicked fire from the enemy's guns.
To the people on the battlefield dead is still dead of corse, but it's not quite the meat grinder that it has been. Truly war is horror upon horror.
Old men wil start it and young men will fight it. War has always been part of the political toolset. But at least now bits of your dead body are not themselves blown to bits as one side or the other rearranges the countryside-again.
the stink of it.
"Now it appears ethanol subsidies will be dropped at the end of the year and less efficient producers may meet the same fate as biodiesel producers."
You are conflating two absolutely completely different things. First of all the RFS passed in 2007 mandates a use of ethanol is approaching the blend wall- i.e. 10% ethanol. So unless the blend rate is increased from its current 10% level there is no possible further increase in ethanol possible unless one aggressively moves to E85 vehicles. Maintaining the ethanol subsidy is nothing more than a handout to the oil companies- paying them to obey the law. Wish we could all be that lucky.
Bio-Diesel is another matter all together. It can substitute directly for diesel in some conditions and can easily be blended up to 20%. The problem with bio diesel is that once you get past using waste oil - making it from soy oil is just not very competitive price wise. Given the price differential between bio diesel made from soy and fossil fuel diesel - we would be much better off using the direct or indirect subsidy to support alternative energies that are close to being price competitive. Frankly, there is no real technological break through that subsidizing bio-diesel is going to bring about.
Certainly the U.S. is doing this although my opinion is that it is being short-sighted and generally unintelligent (taking liberty in anthropomorphizing a nation).
The U.S. could do alot better when it comes to policy choices like reducing immigration, encouraging efficiency, and like you said home grown biofuels, as problematic as they are. The fact that it is not doing so at the levels needed suggests to me that this is a nation which is skipping normal adulthood and going from adolescence to terminal decline, very quickly.
Successful adaptation requires more than just sticking to your guns in a blaze of glory, as tempting as that is. It requires the recognition of changing circumstances and appropriate reorganization of priorities. In fact all adapted human adults are more or less capable of this, it is one of the sure signs of maturity.
The fact that the U.S. can't "mature" even after 234 years of existence is evidence that it is more or less in a state of arrested development.
And I don't know about you, but I don't trust individuals with large mouths and even larger bodies who are nothing but overgrown kids.
The cost of securing myriad pipelines and the maritime transport of oil seems problematic, even with an unlimited defense budget. How many trillions of dollars per year to keep the pipelines and shipping lanes open? Won’t the Osama effect come into play where low cost terrorist activities result in a massive immune reaction that financially kills the defending state? Will military expenditure become the greater part of the energy investment that results in an insufficient energy return? Maybe the stimulation of military expenditures is the main goal and will consume the lion’s share of the oil prey. I just can't imagine a hundred or so starving, financially collapsed, and deprived nations not acting as spoilers in U.S. and Chinese efforts to acquire the remaining oil.
If Iran had one or two nuclear weapons they could stop very significant flow of world oil exports. Scary thought. But possible.
why would they? I think you fall into same group think- everybody but the United States is irrational. Its the same kind of thinking which leads to idiotic statements like if Iran had a nuclear weapon they would give it to some terrorist group. Even if the United States hasn't figured it out - other countries have- Today's terrorist friend is tomorrows enemy. No sovereign state that has acquired nuclear weapons is going to turn them over to somebody they can't control. There are plenty of examples of terrorist organization that the sponsor has lost control off.
I am not too crazy of a person. But I know that there are major shipping bottlenecks in the Middle East for oil, and nuclear weapons in the region are not a good idea for oil security. Of course, it is just a possibility, but why won't Iran relinquish its nuclear ambitions if it does not have ill intentions? Why does it bother? Countries would help Iran build non-nuclear weapon type plants which would be out in the open for inspection. Building deep underground seems kind of odd in my view. Why does Iran do this?
Oil delivery as it stands today is so delicately balanced that any perturbation in the delivery system whether human or not could really disable the countries that rely on imports. This problem will be exacerbated in the future as exports become tighter.
But is the use of a nuclear weapon necessary in order to disrupt oil shipping at one of its choke points? I think not. Placing conventional under-water mines at these locations would probably be more effective because it would take longer to determine who, exactly, was the perpetrator of the evil deed.
I can't imagine a nuclear state using a nuclear weapon to do something that is better done with conventional weapon. But then "can't imagine" is a famous embarrassing phrase from the early days of the War on Terror.
Concerning Iran in particular: It has been rational for them to work on nuclear power for civilian purposes since the time of the last Shah. But now they have a very legitimate worry that their erstwhile oil customers will threaten to nuke their power plants it they stop exporting oil. I don't know what I would do it I were in their position. Trust the fundamental goodness of the Great Satan? Maybe not.
why won't Iran relinquish its nuclear ambitions if it does not have ill intentions?
I'm always surprised when people who lived through the Cold War ask this...
It comes down to trust. In a world where everyone believes that their enemies are irrational and untrustworthy, if your enemy has nuclear weapons, you need them too, since "the threat of counterattack is the only language they understand". Iran's behavior in the 2000s is no more baffling than the USSR's in the '40s, western Europe's in the '50s, China's in the '60s, India's in the '70s, or Pakistan's in the '90s. They're not crazy, but they worry that their enemies might be.
http://www.youtube.com/watch?v=oRLON3ddZIw&t=15
As much as we like to think of Iran's government as "mad", they're probably the most politically stable nation in the region, excepting Israel - by this I mean being able to maintain security. (The little guys, like Lebanon, Syria don't really count in this regard). Consequently, I'm not exactly concerned about Iran possessing nukes as I am concerned about Pakistan with the nukes it's already got!
It's inevitable, I'm afraid, that we'll wake up one day and the news will be all about who's going to suffer from radioactive fall-out and who's not ...
I tend to think you are right. The Entropy Law sort of seems to be implying that we will totally f#&k up the planet -----maximum disorder----on our way out the door to cosmic oblivion.
Dennis Meadows of "Limits to Growth" fame has an interesting video out there of a talk he gave to The Population Institute about his LTG work. I think somewhere in that talk he said that his LTG models are no longer valid after the point when industrial production enters steep collapse. I suppose this is scientist-speak for the colloquial "all bets are off"!
I agree that action will breed reaction, it is the way of the world. But time lags are also the way of the world, and action precedes reaction. The oil grab may be under way already, and if so it brings forward the day when things will come to a head.
Excellent post, George and Gail. This particular data view gains us another important perspective of the production and export status of oil producing countries. Kudos.
Thank you, Will.
A very interesting post. However, I have a huge problem with extrapolations such as the one in figure 7. Why extrapolate just the last 5 years and not the last 10. Or 15? By chosing to use 2005 to 2009 as your baseline you get a falling trend. Not very suprising when you remember the minor financial hiccup we had in that period. Why not extrapolate the line from 1980 to 1985? That would show that we have negative oil production by now... :-) To me it seems that this is very much a case of cherry picking. Being an engineer, I take a quick look at figure 7 and see a rising trend of production and exports. Not a falling one. I'm not saying you couldn't possibly be right. I'm just saying it doesn't strike me as very probable. Well. I guess in 2015 we will see who is nearer to the truth.
"Therefore, I am going out on a limb and calling 2005 as the peak year for net oil exports – barring any big surprises such as many net exporters suddenly deciding to start investing in cleantech in a big way!"
I'm afraid you are falling into the usual wolftrap. Expect me to pile in some dirt on top of your head when you are stuck at the bottom. :-)
As a rough translation, Nordic sees only relative changes not tied to any baseline but to only an arbitrary point in time. He thus questions the application of the ELM method that doesn't tie in to any overall prediction of total oil production growth or decline.
I would agree and it is frustrating that we get stuck at such an obvious impasse of trying to do a second-order or third-order model before we get the first-order approximation correct. We have to learn to crawl before we can walk, guys.
---
My rule of thumb is that the oil industry guys will never offer up a model of their own but they are relentless in criticizing failings of a potentially flawed or not-well-thought-out premise. See Michael Lynch, reservgrowthrulz, and now Nordic.
Thank you Nordic. I only projected 5 years forward because linear extrapolations in nonlinear dynamic systems are generally a bad idea, and they become a worse idea the farther out in the future you try to go.
I used 2005 to 2009 to extrapolate production for illustrative convenience, because consensus seems to be calling for a peak plateau in production going forward, but the correct method to forecast production would be to make the best possible educated guess at the country level and build a bottom up projection. That was beyond the scope of my post which except for that part of one figure was focused on historic data only and not projections and besides I owned up to my quite deliberate data snoop in the article itself.
As for the wolf trap, I remind you of two things: (a) I said in my article that if net exporters go wild on clean tech to substitute out of burning increasing volumes of their own oil I could yet be proved wrong for calling 2005 a net export peak and (b) if you think I fell into a wolf trap, then take my offer for a bet from the other thread, or offer me a bet here :)
IMO, exportland obscures the big picture(exportworld).
55% of the world export market is Arab and Iran.
Norway, Russia and Kazakhstan are 29%.
Nigeria and Angola are 10%.
Venezuela is 6%.
The EU goobles up 36% of the export market.
East Asia(China, Japan and South Korea) takes 31%.
NORAM(USA, Canada, Mexico) consumes 28% of the world exports.
India swallows up 5%.
The Arabs+Iran are probably about at Peak.
Norway is passed Peak, Russian near and Kazakhstan is pre-peak.
Nigeria and Angola are pre-peak.
Venezuela is post peak(conventional).
Overall the world is near/at peak.
The solution to exportland is for importland to reduce their need for oil.
Some recent numbers.
Consumption (C) as a percentage of production (P) for global net exporters (100,000 bpd plus in 2005) went from 26.1% in 2005 to 29.1% in 2009.
Chindia's combined net imports as a percentage of global net exports went from 11.3% in 2005 to 17.0% in 2009.
If we extrapolate the 2005 to 2009 rate of increase in consumption by the exporting countries out to 2015 and if we extrapolate Chindia's 2005 to 2009 rate of increase in net imports out to 2015, and if we assume a very slight production decline among the exporting countries (0.5%/year from 2005 to 2015), then for every three barrels of oil that non-Chindia countries (net) imported in 2005, they would have to make do with two barrels in 2015.
See note up the thread:
http://www.theoildrum.com/node/7007#comment-728064
The question of projecting Chindia oil consumption is critical and you are right to focus on it. I suspect that much of their oil consumption growth will be correlated with the rate of growth of automobile adoption, but I don't know without looking at data. It is worth the time analysing this question and figuring out a projection for Chindia oil demand, with or without a recovery in the West.
We made the following our summary slide for global net exports:
IMO, there is a 90% plus probability that we will see the following in 2015:
(1) Chindia's combined net imports will be in excess of their 2009 level;
(2) Consumption among the exporting countries will be in excess of their 2009 level;
(3) The combined production by the top 33 exporters in 2015 will be below their 2005 level.
So, I think that it is just a question of to what degree that "Available Net Exports" (after Chindia takes their share) decline between now and 2015. What do you think? Anything you would add?
One thing that bothers me a little is that data for 2005, 2006, 2007 were pre-crisis, maybe even a big part of 2008, and if you include them when you estimate growth rates, you may end up with demand side projections that are too aggressive.
Can you get oil consumption and net import data for 2010, through to say Aug 2010?
If you can, the following might be worth trying:
1. Convert these Jan - Aug 2010 figures to average bpd
2. Get the 2008 and 2009 Jan - Aug figures, convert to average bpd (directly comparable, seasonality eliminated. (US recession had begun in Dec 2007, although US consumer did not throw in the towel until after Lehman. So Jan - Aug 2008 might still be pre crisis. But this way at least it is 1 data point out of 3, not 4 out of 5)
3. Then build a small data set with 3 data points - 2008 bpd, 2009 bpd, 2010 bpd for consumption and net imports, China and India. What is the slope of their trend line?
4. You can use that slope on 2009 prints for consumption and net imports to project from there up to 2015
I haven't snooped the data so I don't know what growth rates will pop out of this exercise. But if you do it and you still see positive consumption and net import growth in the midst of the Great Recession, then you can say that unless major economies implode, you are fairly confident in your projections as a conservative baseline.
I would have done it, but no data on my iPad....away from computer atm
That's why I did two scenarios for consumption in exporting countries: (1) 2009 consumption level flat out to 2015 and (2) Same rate of increase as 2005 to 2009. I suspect that the actual consumption number in 2015 will be between 17.5 mbpd (2009 level) and 19.6 mbpd. Regarding Chindia, especially with China's production probably peaking, I think that extrapolating the 2005 to 2009 rate of increase is a pretty reasonable estimate.
I previously posted a couple of comments a long time ago under a different name (concerned_but_powerless or something similar), but I've been an obsessive lurker for the past few years.
It struck me, rightly or wrongly when I looked at the graph of oil exports, that this is a way of visualising EROEI in action. I realise that there are a lot of other factors (people in exporting countries being able to buy more 'stuff' for example), but with oil production on a plateau for the past few years, net energy must surely have actually been declining in that time as we substitute easy oil with unconventional sources. Isn't the net exports a good way of visualising this? The energy that goes back into the process of extracting oil can't be exported, so as the EROEI declines, so, inevietably will exports.
I'm interested in using this in a presentation, so I'd be keen for people to point out the flaws in the argument. I like the net energy graphs that appeared on her a while back, but the exports graph seems like a nice 'real world' example.
Keep up the good work on here, my outlook on the world has changed dramatically since I first discovered this place. Now I'm trying to put that all into practice. Which is the hard part, but I'm getting there.
David (From the UK)
See good discussion on this very idea starting at
http://www.theoildrum.com/node/7007#comment-727657
That discussion is a good point of departure. Its usually a good idea to reconcile approaches that look conceptually similar and I think that is happening to some degree with EROEI and ELM.
This figure represents the classic idea behind EROEI that I recall Nate and others from TOD discussing a few years ago:
The blue region is the end result of oil being funneled away from productive use to support the extraction activity.
Hi David, and thanks for posting. Perhaps there is an EROEI effect as a partial explanation of the rising consumption trend, but one would need to look into it carefully from two perspectives, first, what exactly is in the public data, and second, could the EROEI effect be large enough to show up as a clearly visible trend in consumption?
First point to check: Exactly what production and consumption is accounted for in the EIA or BP data? Is it possible that some of the energy used in extraction is gas that is burned before it is accounted for in the records that we get to see? To see the effect you are looking for, the energy used in fossil fuel extraction must be accounted for in both production and consumption.
Second point, would the EROEI effect be visible? Imagine a developing country a few years into the dawn of its petroleum era, consuming 1 barrel per year, and producing 10 barrels per year. Thirty years later, it is consuming 4 barrels and producing 15 barrels per year. Meanwhile, over the same period, EROEI of oil extraction went down from 75:1 to 25:1. This means that the energy cost went up from 1/75th of a barrel to 1/25th of a barrel. So the energy cost of the total annual production used to be 10/75ths of a barrel thirty years ago, but today it is (15/25)= 45/75ths of a bbl. The increase in the energy used to extract energy is 35/75ths of a barrel. So in this made up example where the proportions of the numbers chosen are not all that different from typical real world numbers, approximately half a barrel of the increased consumption over thirty years is accounted for by the falling EROEI, and therefore the other two and a half barrels would be explained by economic development and population growth.
In other words, in this made up example, when trying to explain why consumption rose from 1 barrel to 4 barrels over thirty years ELM and population growth effects would dominate EROEI effects by a factor of five. It would be easy to plug in real data and get a good handle on how much of an impact falling EROEI is having on the rising consumption trend lines seen in the data. My hunch is "not much", at least not until EROEI from oil production falls so much as to cause serious problems to society. We aren't at that point yet I think.
I think that the EROEI effect is one major piece of the ELM that needs more investigation. The other is embedded energy. It is well known that much of the U.S. consumption of oil is via oil use embedded in imported products, which shows up in the exporting country's consumption figures.
I've finally clarified for myself my reservation about the ELM concept, which is that it arbitrarily makes a distinction between "new significant consumers added in the export nation" versus "new significant consumers added in non-exporting nations". A couple of examples should help clarify.
1) Why is the addition of another million price-competitive oil consumers (owners of an average automobile who drives to a middle-class job to work) in China [not significant in ELM] different for world oil supply/demand discussions from another million in Iran or Saudi Arabia [significant in ELM]
2) Why does the status of the population's oil-consuming population change dramatically if a nation is a net exporter? If Canada chooses not to develop the oil sands and drops out of the exporter status, does it's consumption fall off the ELM scale? More interesting, if Brazil discovers and develops a single significant find sufficient to allow it to export even small amounts for a short time, do its consumers suddenly acquire an importance to world oil supplies which they didn't have prior?
This bit about distinguishing among oil consumers by whether they live in an exporting nation or not is a false path. What is needed is
First, an assumption that the market for oil is world-wide and fairly open, as a first approximation.
Second, acknowledgement that there exists an "average" world-wide consumer, at the approximate median between the most gluttonous (eg. Canadian middle-class) and the least gluttonous (eg. Chinese / Russian / Indian / Brazilian worker with a steady job for wages sufficient to support the purchase of a petroleum-fueled vehicle and sufficient fuel to use it regularly, and on an upward trend economically). Given this information one can then a) calculate the annual consumption of an "average" oil consumer. b) the number of such "average" consumers worldwide c) given some economic projections, the approximate rate of addition worldwide of people to the cohort of "average" consumers projected in various regions. d) Ideally also a factor for the sensitivity of the consumers, at minimum by region, to increases in petroleum prices and its economic effects.
Third, useful estimates of present and future production, decline rates, additions to petroleum reserves / resources, and declining EROEI effects. Also important would be the significance to EROEI of the characteristics of the regional supply's type of crude, eg. Venezuela's heavy is less effective than Norway or Russia's light.
Fourth, useful projections of market-modifying factors such as a regional population's proximity to a point of production, refining, transportation etc., and the significance (eg. cost in oil of the transportation).
============
Bottom line, I fail to see the importance of whether any particular potential consumer lives within the same national border as production.
I have read the article and fully agree with lengould's comments. I fail to see the global significance of the ELM model. I think that the state of the economy and industrial development in a country (economic power) is more significant than 'years since peak', when trying to predict future oil consumption.
Decreasing production, and faster decreasing import opportunities, are serious concerns, but I think that the IMMEDIATE consequence of peak oil is that it is the first IMPENETRABLE LIMIT TO GROWTH that the world economy has met. I am convinced that the stagnating oil production from 2004 onwards, is the real reason behind the present 'finance crisis'. The economic consequences were disguised a few years, by inventive credit institutions and creative money making. After the galloping prices through 2007 and first half of 2008, culminating with a 150 dollar spike, it was evident that higher prices did not give more oil. The US credit market had the most fragile bubbles, that burst in 2008, and some national economies in Europe are also seriously hurt by the stagnation.
Your points are valid, I agree with you that different stages of development imply different levels of per capita oil consumption, but this leads straight back to ELM, in that over 30 years of nonstop windfall from oil can accelerate development in those countries which started off undeveloped. Hence the even steeper consumption lines in oil exporter countries which were undeveloped back in 1980. There was no attempt to predict future consumption other than an extrapolation of recent trends in one chart. It would take another article to fully analyse all drivers of consumption growth - the windfall effect of ELM is just one impulse and it only works on developing nations.
The point of the article was to compare 100% of the global historic data set to the original ELM insights. The grouping was done by what stage in the export lifecycle each country was in to make it easier to carry out this comparison, and to demonstrate what happens to each exporter eventually. There was no claim that being 5 years or 10 years post peak has any intrinsic significance.
Len,
I think the answer is that oil exporters tend to control oil product prices. Thus, in these countries the market for oil is not world-wide and fairly open.
The straightforward implication is that ELM is focusing on the wrong thing: it would be more useful to analyze the difference in consumption behavior between price-controlled countries vs free-price countries. For instance, Mexico doesn't price-control or subsidize oil products, and their changes in consumption have been similar to the world average.
Also, this focuses our attention on the key question: when will countries decide to drop price controls? China, for instance, did so recently, and that may make a big difference in the future.
The usual approximation is that you take the mean and set the standard deviation to approximate the mean and then you run that through the hopper and see how things change. You will get a mix of countries that have different trade policies and these will effect the export balance in different ways and thus smear out any deterministic outcome.
Countries that horde their oil will see the exporters that sell it free-market get huge profits and they may second-guess their original motivation. Oh well, its all game theory anyways and all possible policies will play in the mix, as many policies as there are ways to extract money from other people.
The UK and Indonesia are interesting case histories. At their respective final production peaks, their consumption as a percentage of production was 59% and 53% respectively. UK production fell at 7.2%/year over a six year period. Indonesian production fell at 2.6%/year over a nine year period. UK taxed energy consumption; Indonesia subsidized energy consumption. UK had a very low rate of increase in consumption over the decline period (+0.5%/year). Indonesian consumption grew at 4.3%/year.
UK went to zero net exports in six years (actually seven, but year seven was very low). Indonesia went to zero net exports in 9 years.
Given an ongoing production decline, unless an exporting country cuts their consumption at the same rate that their production falls, or at a rate faster than their production falls, the net export decline rate will exceed the production decline rate and it will tend to accelerate with time.
Jeffrey,
You're not really responding to what I said, just providing familiar info.
So, UK production fell faster, while Indonesian consumption grew faster, so their exports fell in similar ways. Some countries will have slower production declines, or slower consumption increases.
Your last point is simple math. I can see why this kind of analysis is important to individual exporting countries, but not so much to the world market.
Basically, if world consumption is trying to rise, and world oil production is falling, then we have a problem. As more countries see increase in consumption, or declines in production, we'll more problems. If a minority of countries are in decline, the problem is smaller. If a majority of countries are growing production, the problem is bigger.
Again, who cares whether an oil consumer is in KSA or in the US, if they're both subject to the same oil price dynamics?? If the price rises, one or both will cut back and/or find substitutes.
Several possible differences to the oil price dynamics they might be subjected to, I will just go over the two biggest ones.
Assume no subsidies, Saudi and US drivers pay exact same price at the pump.
If the oil price rises, other things being equal some money exits circulation in US (import land) and is transferred to circulation in Saudi (export land). Other things being equal, economic activity slows in US and increases in Saudi. Average Saudi driver sees increase in his personal income, US driver sees decrease, both see the same price increase for gasoline. All other things being equal, Saudi driver is therefore more likely to shrug off the oil price increase and keep driving vs the American driver.
Now back to that pesky real world. Iran, Venezuela, Saudi and many other oil producers had, and I think mostly still have, the very bad habit of subsidising domestic oil consumption. It is a strategy known from Roman times as "bread and games", I guess the modern version is bread and gasoline. With domestic prices disconnected from the market, there is no signal to the export land consumer telling him to cut back. So export land consumer carries on partying: in 2008 when oil price rises and recession killed Hummer sales in the US, sales were booming in Venezuela for the simple reason that gasoline there cost cents to a gallon.
If the oil price rises, other things being equal some money exits circulation in US (import land) and is transferred to circulation in Saudi (export land). Other things being equal, economic activity slows in US and increases in Saudi.
Yes, this is valid. OTOH, all things are probably not equal. In particular, it's likely that oil importers will offset some or all of the income effect by borrowing.
Further, if prices are not controlled, then substitutes like EVs will be competitive in both importing countries and exporting countries. Even rich people don't like to overpay (heck, rich people are often the people pinching pennies the hardest).
Now back to that pesky real world.
Well, that's the world in which I started talking.
Iran, Venezuela, Saudi and many other oil producers had, and I think mostly still have, the very bad habit of subsidising domestic oil consumption.
Some do, some don't. Iran, for instance, gives with price controls, and takes it back with rationing. Mexico doesn't control or subsidize prices.
export land consumer carries on partying...sales were booming in Venezuela
For a little while. OTOH, have you looked at Venezuela lately? High inflation, falling incomes, falling oil production, the highest crime rates in N & S America. Price controls and subsidies are very harmful economically. Eventually exporters will realize that, and modify price controls: we can't extrapolate in a linear fashion from current trends.
Consider a recent example--Russia banning wheat exports. Let's assume, for the sake of argument, that Russia were the sole source of wheat for the world. Would you rather live within the national border of Russia or outside its borders?
But back to oil exports; we looked at 16 net exporters showing production declines. Their net export decline rates ranged from about 2%/year to over 20%/year. The median was about 7%/year (at 7%/year, the volume of net exports falls by half in 10 years). And I have yet to find an example of an oil exporting country where their production decline rate has exceeded their net export decline rate for an extended period of time.
If the ELM concept is wrong, find me some examples of net oil export decline rates being above production decline rates on a long term sustained basis. As WHT might say, show me some numbers.
Here is my complaint: I keep getting qualitative arguments against a quantitative model that is basically 100% supported by real life case histories.
From the point of view of oil importing country, the math is inescapable--almost certainly a long term accelerating rate of decline in global net exports. And then we have the "Chindia" factor.
I have no argument with ELM model, and its outputs, only with the significance of it. I think it would be far more valuable to expand the concept worldwide..... (I know, so why don't I do it? LOL.)
A model of oil exports with such an assumption could be called The Fantasy Land Model of oil exports and its output would thus be consistent with the GIGO dataset.
In the real world, most of the volume of exported oil is traded on the basis of long term supply volume contracts. The true spot markets, which determine the fluctuating price used in the pricing formulas for almost everybody, are tiny relative to total global production. If demand of 5m bpd suddenly appeared tomorrow on the spot markets, it could not be filled. Do you really think that the Saudis or Canadians would tell the Americans "tough, we don't have any oil to sell you today, we are sold out, please check again tomorrow?"
China produces 3.9m barrels of oil per day, but needs more, so Sinopec is out on an epic resource grab, building joint venture refineries in the countries of oil producers, and paying a huge premium for a share in the Brazilian oil sands venture to quote only things that happened in the last weeks. So in the real world China, which produces 3.9 mbpd of its own oil, appears to be panicking that it won't have enough to power the growth that keeps the country stable and the elite in power. Yet in the Fantasy Land Model, a trader with deep pockets could show up tomorrow at the Great Hall of the People in Beijing, have some tea with good old Wen, and shake hands to ship off China's future production to the high bidding customers in the trader's Rolodex, leaving the Chinese economy running on fumes. It ain't gonna happen, of course. As westexas said, look at what Russia did to grain exports when it had a bad harvest.
The world's production of oil is not sold on the open market to the highest bidder as a first approximation. About 40m bpd is consumed where it is produced (in some cases they export it to be refined and import back the finished product, but the result is the same). Of the rest, most of it is more or less spoken for in long term contracts and other arrangements. Oil is a strategic commodity and great powers aren't dumb about that sort of thing.
ELM is not a proposal to replace production models. It is a way of thinking about the future of oil imports. These happen to be important to the ever-growing list of 173 countries dependent upon them.
This is all I will ever agree about: ELM is a fancy name for the idea that exports decline faster than consumption. A linear regression used for extrapolation does exist, but you can't do any more than that. The meat of the ELM description is so thin that I guess that am the only one that is brave enough to show the complete mathematical expression of the "model":
dPc/dt > dPe/dt
Everything discussed beyond this inequality is beyond the ability of the model to account for. It can't say how much faster exports decline than consumption, or even whether this universally holds. It is just an empirical observation that describes the inequality for the current moment.
When that inequality holds, the model is right. When the inequality doesn't hold, the model is wrong until the inequality starts to hold again, then it is right again. So it didn't seem to work when dP/dt=dPc/dt=dPe/dt=0 as global production hit peak, but that is OK. That is the nature of a heuristic. It will eventually apply and we can only watch how strong the effect will be.
Your inequality misses the mark in that it does not describe the important insight of ELM. The interesting comparison with real world implications is not between (rates of change of) exports and consumption, but between exports and production.
The relevant inequality which should keep oil importers awake at night is that after a production peak, net exports (defined as production less consumption) decline faster than production, because (a) the producer will consume some of the oil and (b) a fortiori because consumption tends to grow with population (which is generally growing) and with economic development which is greased by the oil windfall provided by the positive net exports.
Even in a global recession, which some here say is caused by peak oil in the first place, oil exporters will not feel much of a recession because the money keeps rolling in, whereas importers hit by a credit crunch, who used to fund their oil habit with debt, have no choice but to cut back oil consumption, as the data in fact shows. There is no structural mechanism to significantly arrest consumption growth in exporters post a production peak, to an extent sufficient to reverse the net export decline, until it's way too late for the world economy.
Although much of ELM appears mathematically trivial to scientifically literate persons such as you (as the derisory tone of your comment shows) in the real political economy one has to prove the mathematically trivial in such a way that stakeholders will understand and take action. See my Feynman post above for the importance of using means other than black box models to teach an important truth to a wider audience.
I am derisive because for people to actually use this stuff in any serious kind of analysis, you actually have to treat it mathematically. But to try to get someone to actually offer up the right formality is like pulling teeth.
OK, so now you admit that ELM is when "after a production peak, net exports (defined as production less consumption) decline faster than production " which is:
dPe/dt < dP/dt
yet as you say
dPe/dt = dP/dt - dPc/dt
which results by the definition of P=Pe+Pc.
Insert this back into the first inequality and you get:
dP/dt - dPc/dt < dP/dt
the two dP/dt terms cancel and you are left with
-dPc/dt < 0
or
dPc/dt > 0
which states that internal consumption is always increasing according to ELM. Very interesting.
Yet, this is just a heuristic, because internal consumption can also reach a peak. Which is one reason why people have a problem with ELM. It is a second order observation on the stronger first order effect of total production declining after the peak.
Well, mathematical formulation is nice as long as one doesn't miss something while writing it up. Net exports can still decline appreciably faster than production (in % terms) if consumption is declining at a slower rate than production is. The rate of the net export decline (%) relative to the rate of the production decline (%) depends on how high the consumption / production fraction was at peak. This has all been stated by westexas many times in the expositions of the original ELM.
Here is a made up example to demonstrate it numerically. At peak, say production is 100, consumption is 66. Production is falling by 4% straight line, consumption is falling by 3% straight line. This results in net exports falling by approximately 6% straight line.
Year: P, C, E
Year 0: 100, 66, 34
Year 1: 96, 64, 32
Year 2: 92, 62, 30
Year 3: 88, 60, 28
Meaning, we can have the basic ELM effects (net exports falling faster than production, net exports falling to zero before production falls to zero) even with a 3% declining consumption in this made up example, so you should revise your conclusion in the comment above about ELM requiring that consumption should always increase. It doesn't require that.
One might say hold on, this is good, production fell by 4 units but net exports fell by only 2 units. BUT net exports will be zero in 14 years from now, even though production will go on for another 22 years from now.
Now all that was theoretical because empirically we noted that almost all exporters are growing their consumption. I don't need to run numbers for that to show you how much sooner we hit zero exports vs zero production, you can click the links at the bottom of the article to reread the original ELM articles.
Anyway, may I suggest something, WHT? How about you set aside your mathematical modeling hat for half an hour, and read the post again as if you were reading a history book. After all, 90% of the post is about stuff that actually happened and about what that stuff means.
All I know is that you can't do math by anecdotes unless there is some math behind it. That provides an underpinning of some logical consistency. So when you throw up numbers like that you are expecting the audience to do the pattern matching process in their heads. In reality, you should present the equations and then throw up the numbers so that readers could plug the numbers into the equations and see how it works for themselves.
I must be two steps ahead of everyone. I try to keep people focussed on simple calculus that they can work out on their own, but my own work is stretching the limits to incorporate uncertainty and non-deterministic aspects.
This is the calculus:
dP/dt = dPe/dt + dPc/dt
(these are the proportional draw-downs)
dP/dt = -0.04*P
dPc/dt = -0.03*Pc
dPe/dt = -0.06*Pe
(plug these in)
-0.04*P = -0.06*Pe - 0.03*Pc
but
P=100
Pc=66
-4 = -0.06*Pe - 1.98
Pe=33.67
but
P = Pc + Pe
100 = 66 + 33.67 => close enough?
which gets back to
dPc/dt = -0.03*Pc = -1.98
dPe/dt = -0.06*Pe = -2.02
which says that
dPc/dt > dPe/dt
-1.98 > -2.02
but only barely !!! It is likely that these are not equal simply because we lost some significant figures.
It also says that
dP/dt = dPe/dt + dPc/dt = -4
so that this example can't be at peak when it started !
Yet you said it was at peak.
Calculus and algebra don't lie. I hate that I have to do this, because I will get called on something if I did something wrong. But no one else seems to want to lift a finger, so that's that and there you go.
If demand of 5m bpd suddenly appeared tomorrow on the spot markets, it could not be filled.
And spot prices would soar.
Do you really think that the Saudis or Canadians would tell the Americans "tough, we don't have any oil to sell you today, we are sold out, please check again tomorrow?"
Not at all: they'd charge the soaring spot price, and the Americans would pay it. But, those buyers would pass that price on to consumers in the US, many of whom would choose to drive less, or carpool, or buy Priuses/Leafs/Volts, etc. As consumption in the US fell, that would free up product for other countries.
In effect, as long as these long-term contracts are priced at the spot price, they don't remove these transactions from the world market, they just guarantee that the parties will have access to the market.
So, price signals would act to make supply equal to demand. Except in countries where prices were controlled and subsidized, which takes us back to my original proposition: this is less about exporter/importer status and more about price controls.
Now, it would be interesting to test the hypothesis that importer status is important independent of national domestic pricing strategies. It wouldn't be hard, and I think we'd see that Mexico and Canada (and perhaps Iran) are showing slower domestic growth despite their exporter status, and KSA and China showed greater growth (with price controls in common).
I agree that the persistent price signal caused by ever-declining net exports will encourage long term substitution out of oil in importers. But one cannot assume that this will be a smooth or easy process or that the market will "clear" in the neoclassical sense. Many factors will conspire to stop that from happening:
1. As I said, oil is a strategic commodity, and all sorts of non monetary back room deals will be happening as quid pro quo, more so as the net export squeeze intensifies.
2. As I understand it, the formula for the price used in Saudi long term supply contracts has an additional variable - a discount or premium to the market determined basis price, and that number is also changed from time to time by the Saudis with no explanation. From what I recall, when market prices rise too much the discount tends to be increased, and vice versa.
3. Not to mention that the political temptation to subsidise domestic consumption probably rises as the square of the soaring spot price!
If the market isn't free to find the price at which it clears, your economics textbook will tell you what happens next - either a glut or a shortage. Something tells me that gluts of net oil exports are not in our future.
long term substitution out of oil in importers. But one cannot assume that this will be a smooth or easy process or that the market will "clear" in the neoclassical sense.
I agree. First, there will be barriers to proper pricing, and 2nd, market responses depend on the quirks of individual, corporate and national responses. For example, why did Nissan (and some other car companies) respond to PO-Lite with an agressive EV program, while some other companies are making token efforts? The personality of the CEO?
OTOH, market pressures are powerful, and will become increasing hard to resist.
all sorts of non monetary back room deals will be happening as quid pro quo, more so as the net export squeeze intensifies
Could you give some examples? So far, I haven't seen anything dramatic of that sort.
the formula for the price used in Saudi long term supply contracts has an additional variable - a discount or premium to the market determined basis price
From what I've seen, this is applied variably to sales to different regions, not across the board. If you (or anyone) have more info, it would be fascinating to see.
the political temptation to subsidise domestic consumption probably rises as the square of the soaring spot price!
Sure. For instance, at the peak of prices in the last several years Mexico did apply a temporary cap. OTOH, as the differential between the market and controlled price rises, the countervailing pressures will rise. The cost of national subsidies will rise: this caused some price controls to crack in the last several years -IIRC Indonesia, Pakistan, Iran, India and others had very serious problems in this area. Countries that hide the subsidy in state-controlled companies, like KSA, will find that the market distortions are getting greater: lost income, inadequate supply responses (for instance, KSA controls domestic nat gas prices, and as a result has domestic shortages of NG!). Venezuela is a good example: domestic subsidies are eating their investment budget for exploration and drilling, causing consumption increases and production declines and killing net exports!
If the market isn't free to find the price at which it clears
The problem here is that part of the market is free, and part isn't. This harms both areas: prices are too high in the uncontrolled part, causing obvious damage, but also accelerating the transition away from oil (which is not what exporters want). The damage in the controlled zone is subtler, but very serious: over consumption of marginal value; under production; swollen state budgets for subsidies that crowd out more valuable things, etc.
As net exports fall, price controls and subsidies will be under pressure. If net exports become very small, those subsidies will become obviously unaffordable in countries which rely primarily on oil revenues. Some countries, like Venezuela, may have to crash before they can rebuild, because of the political problems involved in raising prices. Others will likely be somewhat more flexible as the writing on the wall becomes clear, as we have seen with the elimination or easing of price controls in countries like China and India.