| South America Enters the LNG World | The Oil Drum | Review of the Western Wind and Solar Integration Study (WWSIS) by NREL and GE Energy |
U.K. Natural Gas – An Early December 2010 Status Report
Posted by Rune Likvern on December 3, 2010 - 10:49am
The early arrival of unseasonal cold weather in the U.K. has increased demand for natural gas for heating which has called for heavy withdrawals of natural gas from storage and resulted in headlines like Could Britain’s gas stocks run out this winter?.
In this post I will present some recent developments in the gas supply statistics for the U.K.
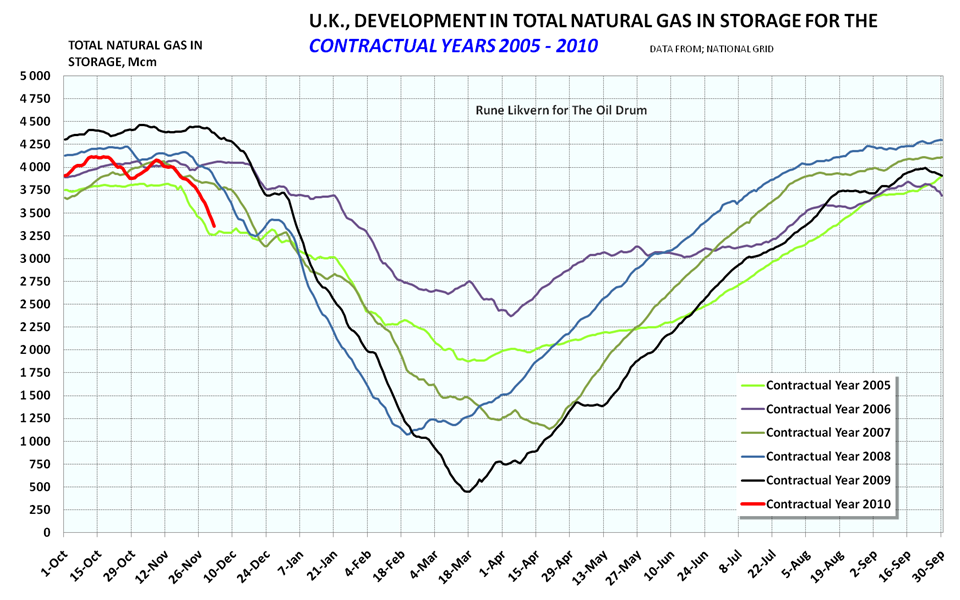
The diagram shows development in total working natural gas in U.K. storage for the contractual years 2005 – 2010 as of December 2nd.
More below the fold.
DISCLAIMER: The author holds no positions in the oil/energy market that may be affected by the content of this post.
Several factors will continue to shape the demand for natural gas from storage this winter, such as;
- Decline of U.K. indigenous supplies. National Grid in their “Winter Outlook Report 2010/11” expects this decline to be around 9 % relative to last winter. During December - February last heating season U.K. indigenous marketable natural gas supplies averaged around 160 Mcm/d. A 9 % decline translates into an average decline of around 15 Mcm/d for the same period this heating season.
- Another reason for supply concern was that Statoil was not able to produce as much gas as anticipated at the Ormen Lange field offshore Norway. "We were granted a lower production permit", said Bjørnson. How or if this affects Norwegian natural gas deliveries to U.K. this winter is unclear.
- Ruhm gas field is shut down due to EU sanctions on Iran since an Iranian company is a partner in Rhum. Ruhm produced around 6 Mcm/d in the first half of 2010.
- Growth in LNG imports
- The supply situation for Continental Europe (Flows in the Interconnector between Bacton and Zeebrugge.)
- Developments in LNG demand from the Atlantic and Pacific basins.
- And last but not least……..the weather, which has just seen a week on unseasonal very cold weather that is set to continue.
Use of natural gas storage facilities adds flexibility to the supply system.
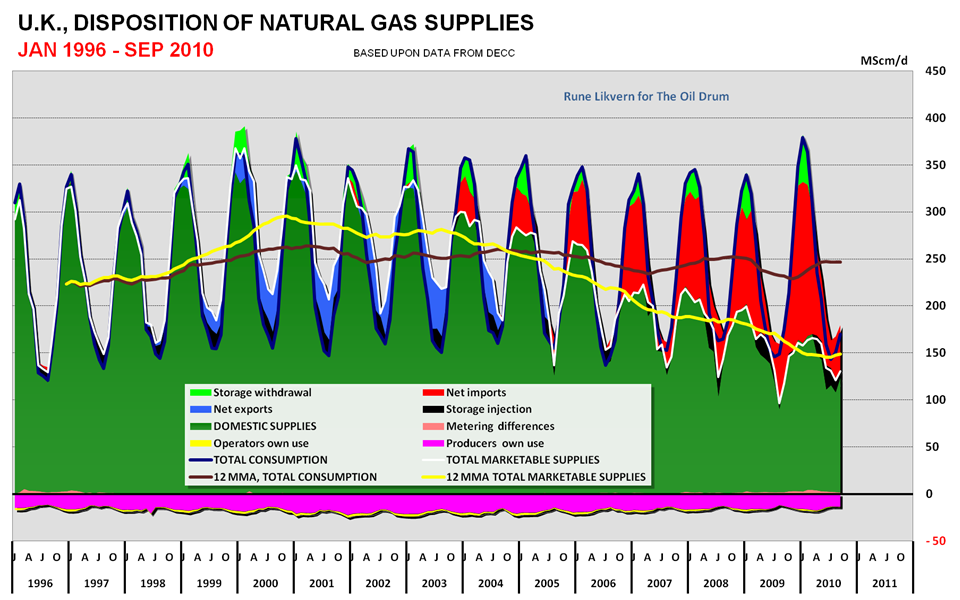
Figure 01: The diagram shows the structure of UK natural gas supplies from January 1996 and as of September 2010.
The dark red line in the diagram above shows how UK demand for natural gas declined due to the economic slowdown in 2009 and how demand recently has rebounded. UK demand is increasingly being met by pipelined imports from Norway and Continental Europe and in recent years by rapidly growing LNG (Liquefied Natural Gas) imports.
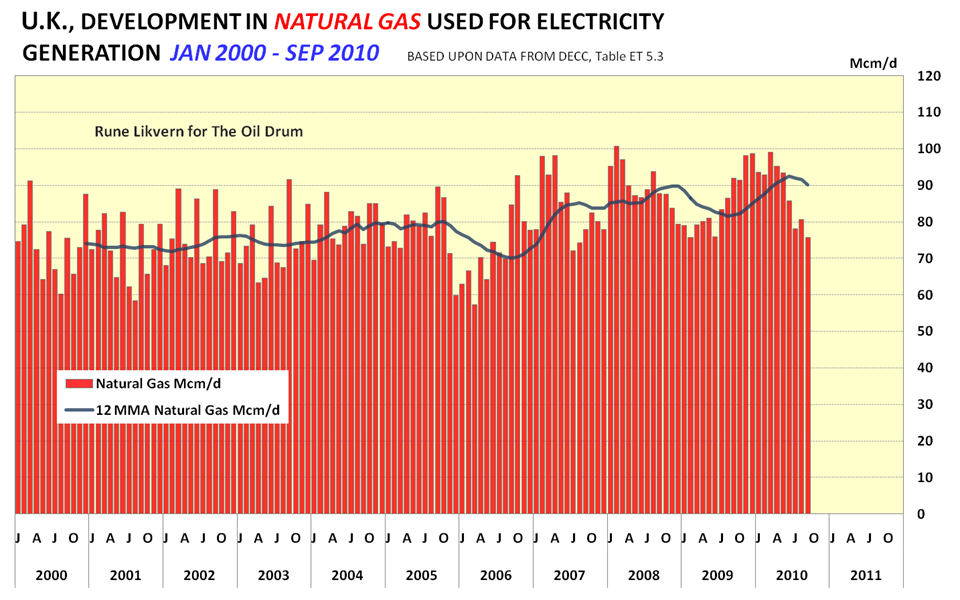
Figure 02: The diagram shows development in natural gas used for electricity generation in U.K. from January 2000 and as of September 2010.
Most of the recent years growth in UK natural gas consumption has been led by natural gas used for electricity generation. In 2000 around 34 % of UK's electricity production was based on natural gas. This has since grown to 43 %, burning around 37 % of UK's natural gas consumption.
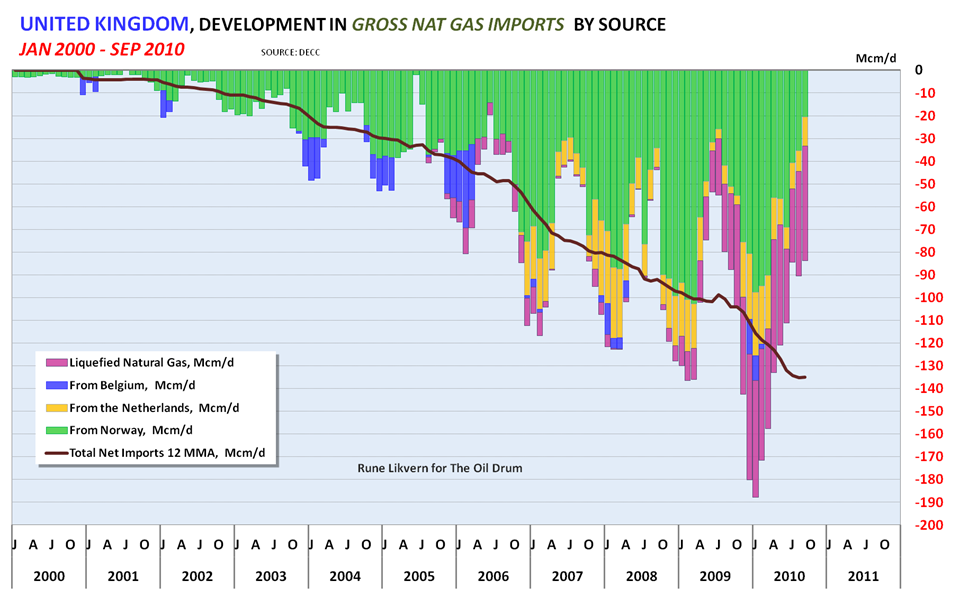
Figure 03: The diagram shows development in UK gross natural gas imports by type and source from January 2000 and as of September 2010. Belgium is not an exporter for natural gas, but a transit country for other natural gas exporters.
Presently around 40 % of U.K. natural gas consumption is met by imports.
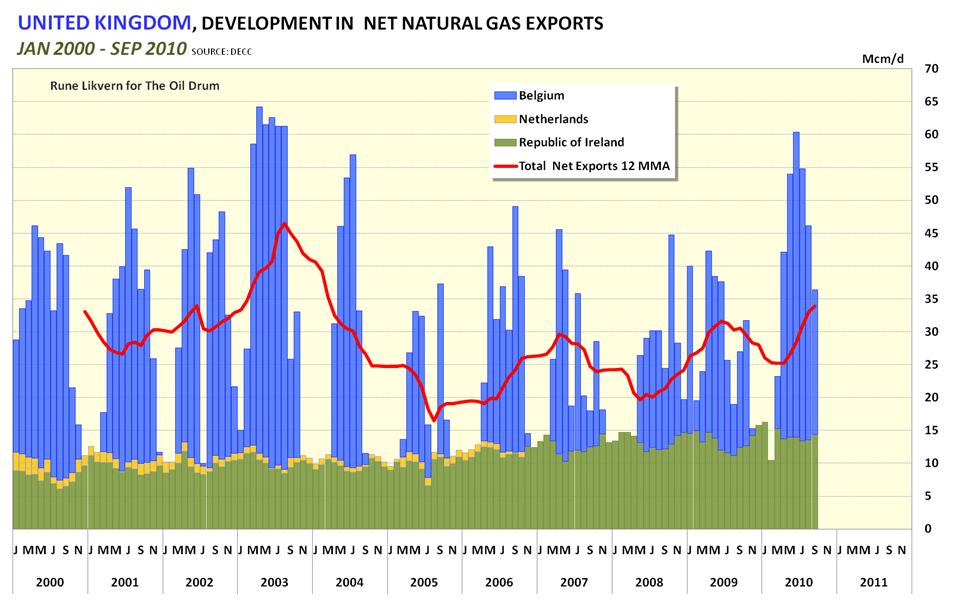
Figure 04: The diagram shows development in U.K. net natural gas exports by destination from January 2000 and as of September 2010.
As U.K. has been a net importer of natural gas it has also become established as a European hub for exports of natural gas. These exports are subject to seasonal variations as illustrated in the graph above.
With the recent growth in U.K. receiving capacities for LNG, natural gas exports to Continental Europe have increased. This is believed to be due to the price differential between the U.S. and the U.K. market. The U.S. market is presently well supplied due to unconventional gas (also shale gas) production, and with this the U.K. market has become more profitable than the U.S. market for sellers/shippers of LNG.
U.S. unconventional gas may thus now be attributed to help bring down LNG prices in the Atlantic basin which also has made it possible for buyers on Continental Europe to buy slots at the U.K. LNG receiving facilities and thus get some supplies of cheaper natural gas compared to suppliers of pipelined gas like Norway and Russia.
If LNG will remain a “cheap” alternative for natural gas in the Atlantic basin throughout this winter also very much depends on developments in LNG demand from the Pacific basin (China, Japan and South Korea to name a few). A strong demand for LNG from the Pacific basin may move U.K. natural gas pricing away from U.S. market pricing towards oil priced indexed natural gas prices. As of now natural gas (dayahead) trades around 60 p/therm (which is around $9,50/MMBtu). Presently the U.K. LNG receiving facilities have a total send out capacity of around 130 Mcm/d.
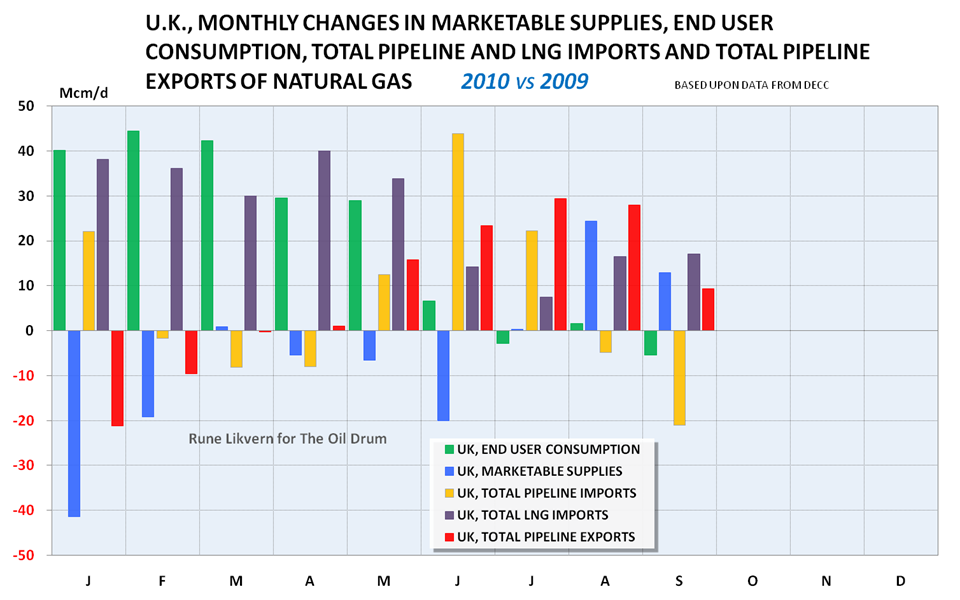
Figure 05: The diagram shows changes from 2009 to 2010 in U.K end user natural gas consumption, marketable supplies, total pipeline imports and exports and LNG imports.
Over the years the U.K. trends are declining indigenous supplies, growing consumption (now driven primarily by natural gas used for electricity generation as coal fired electricity generation will be retired) and as of this summer growing secondary exports of LNG to Continental Europe.
The chart below shows the flows through the Interconnector (Bacton - Zeebrugge for the contractual years 2008 - 2010).
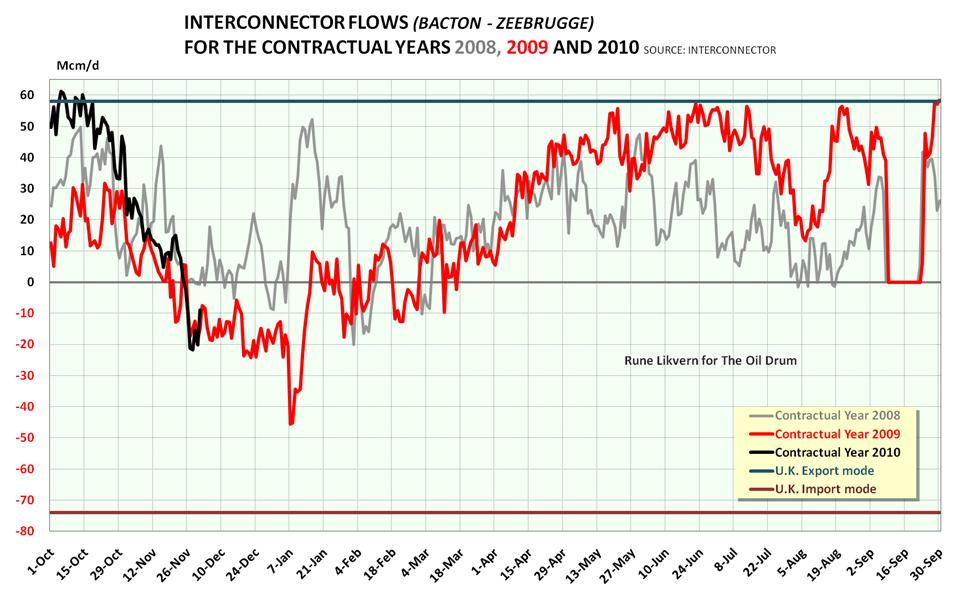
Figure 06: The diagram shows flows in the Interconnector between Bacton and Zeebrugge for the contractual years 2008 - 2010. Positive value is flow from U.K. to Belgium.
The U.K. storage system has 3 classes of storage facilities: LRS (Long Range Storage), MRS (Medium Range Storage) and SRS (Short Range Storage). Simultaneous operation of these facilities may add 120 + Mcm/d to the supply.
Figure 07: The diagram shows development in total working natural gas in U.K. storage for the contractual years 2005 - 2010. The thicker red line shows status for contractual year 2010.
For the contractual year 2010 (which started October 1st 2010 and ends October 1st 2011) increased use of storage withdrawals have been used to balance demand.
As of December 2nd there was a total of 1 020 Mcm or 23 % less natural gas in U.K. storage relative to the same date in 2009. Last heating season (2009) ended with a total of 470 Mcm natural gas in storage.
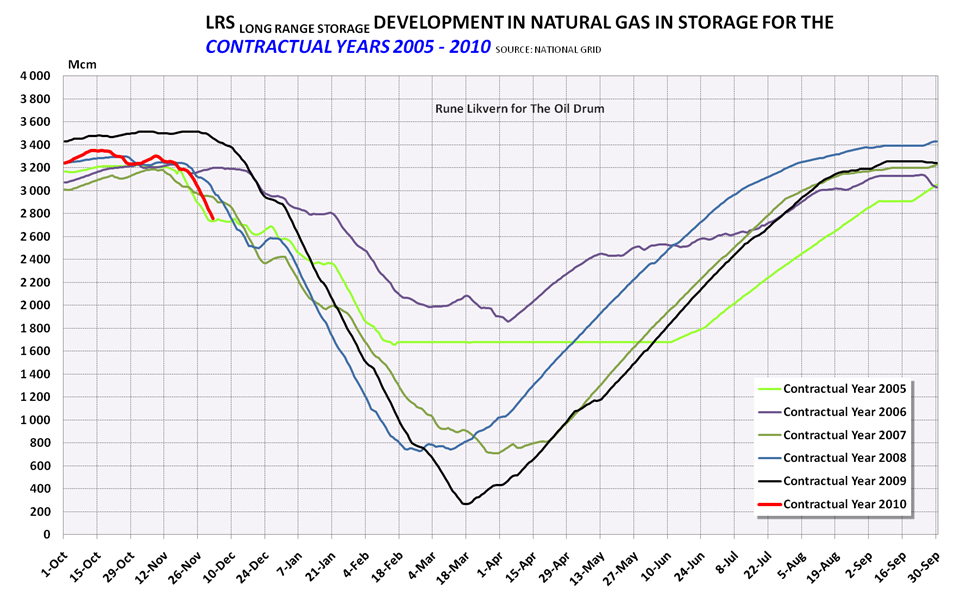
Figure 08: The diagram shows developments for natural gas in storage in LRS (Long Range Storage) for the contractual years 2005 - 2010.
Last heating season had a low of around 240 Mcm natural gas in LRS (Rough). During this refilling season storage levels ended below last year.
As of December 2nd there was a total of 700 Mcm or 20 % less natural gas in LRS relative to same date last year.
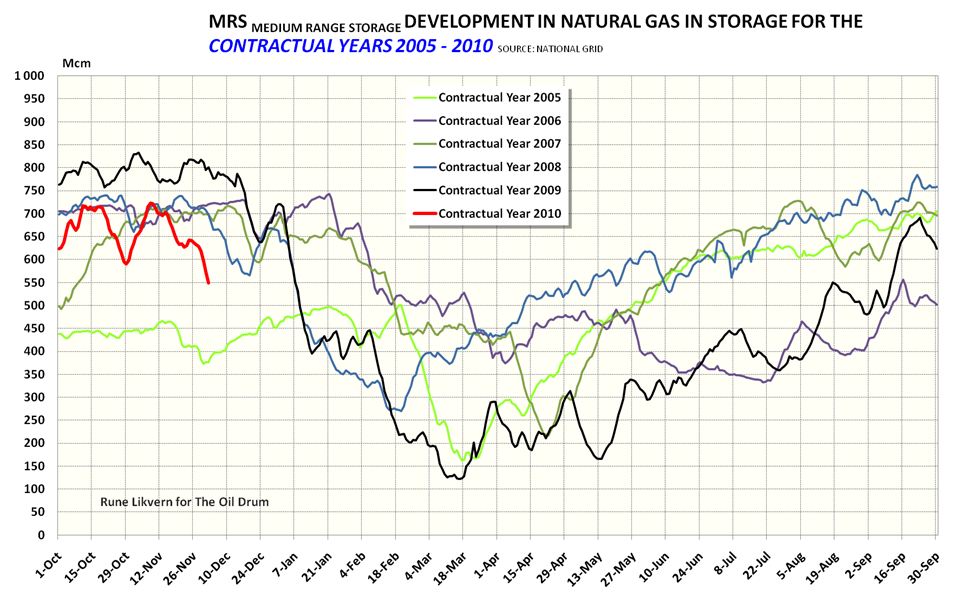
Figure 09: The diagram shows developments for natural gas in storage in MRS (Medium Range Storage) for the contractual years 2005 - 2010.
MRS reached a total level of 120 Mcm natural gas in storage as a low last heating season. Total levels for MRS have also stayed below last year's.
As of December 2nd there was a total of 250 Mcm or 31 % less natural gas in MRS relative to same date last year.
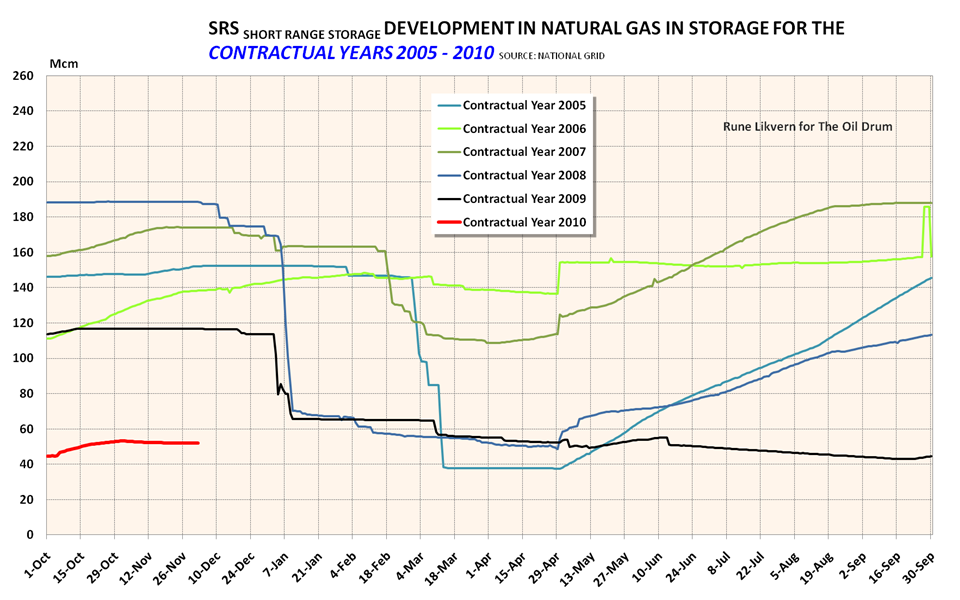
Figure 10: The diagram shows developments for natural gas in storage in SRS (Short Range Storage) for the contractual years 2005 - 2010.
SRS has not reached previous year’s levels. How this may affect a GBA’ (Gas Balancing Alert) remains unclear.
As of now it is of course impossible to forecast if present U.K. natural gas in storage will be adequate throughout this heating season. Gas demand and also storage withdrawals are very much influenced by weather and plans for later this winter now call for more use of coal and less natural gas for electricity generation.
I will revisit this subject later this winter to update on the situation as it unfolds.
Contact
- Content: editors at theoildrum dot com
- Tech support: support at theoildrum dot com
License

This work is licensed under a Creative Commons Attribution-Share Alike 3.0 United States License.
Interesting. Thanks for a great article. Have you seen this Deloitte analysis? Adds a little to flesh out the PTB long-term view.
http://www.psg.deloitte.com/resources/GasStorageInfrastrata_20100909.pdf
Ben (wood-fired since last winter, PV-powered very shortly)
Hello and thanks for the link.
Interesting presentation.
More storage capacity (Mcm) will not be of much use if the gas to fill/refill it is not available during the refilling season.
Assuming an addition to present storage volumes of 10 000 Mcm (10 Bcm) would require an estimated increase in imports in the summer months of around 50 Mcm/d on average. (This assuming refilling from April through October, 7 months and giving allowance for some downtime of storage facilities due to annual maintenance, so say 200 days of effective refilling).
When designing for storage capacities there are a multiple of factors to consider.
Storage would be designed given consideration to expected development in indigenous supplies, imports, imports relative share of consumption, how much flexibility (swing) could be designed into the production facilities and delivery systems (pipelines), regularity of the supplies.
What are the forecast developments to peak demand? (Should natural gas increasingly be used as back up for wind power?)
Should storage be designed as a percentage of annual demand?
Etc.
Hi Rune, a good article.
I monitor the LRS on a daily basis - things I note are once gas starts to come out of storage it more or less carries on at the same rate for the rest of the winter ... so extrapolating this year's data at the same rate as last year's usage we are out of LRS about mid Feb!
I don't normally monitor MRS and SRS but as of today, at max depletion rates (which is pretty close to what we tend to get) we have:
66 days of LRS
14 days of MRS
1.9 days of SRS
BTW, I think there is a reason the National Grid have stopped publishing this data graphically any more - they don't want the public to easily find out what's going on.
Looks like it may get even colder next week!
I noticed they'd stopped publishing the graphical data on the 15th November too... interesting.
Where did you get the data to reconstruct it from? I tried the storage section of the data explorer http://marketinformation.natgrid.co.uk/gas/DataItemExplorer.aspx, but got weird results that didn't tally with the above. They've managed to obscure the real data from me so far!!
Thanks
Andy
Where do you monitor these data? Would be nice to know.
Hello,
I get my data from;
http://marketinformation.natgrid.co.uk/gas/DataItemExplorer.aspx
and
http://marketinformation.natgrid.co.uk/gas/frmPrevalingView.aspx
It was quite annoying that the National Grid stopped publishing the graphs in the excel format, maybe they figured that most journalist wouldn't know how to extract the data.
Getting the data out of the Explorer can be a pain but this is how I do it.
Go to the DataItemExplorer website above.
Go into Storage and select the Stock Level check box.
Check the latest values box.
Select the date range required.
Download the data in CSV format to open in Excel.
Create a pivot table.
The data is in GWh, to convert to MCM divide by 10.833
With storage well down for the time of year, and a cold winter looking increasingly likely, the resilience of UK NG supply will depend on three things
1. No significant system failures. A few years ago the long range storage was off-line for most of the winter. Fortunately it was mild. Last year, imports from Norway were reduced by a frozen gas pipe - just when we needed it most.
2. Increasing the use of our remaining coal and nuclear power stations. This is only a short term solution as several are scheduled to be decommissioned and no new ones are being built as yet. Someone reported on TOD a few days ago, that UK coal stocks were also lower than usual. Anyone got a link? We import the majority of our coal.
3. The LNG infrastructure. Accord to here, http://marketinformation.natgrid.co.uk/gas/frmPrevalingView.aspx
we could store an extra 150 mcm of gas in the LNG terminals. That would be a help, if the cold continues, but the key is how fast we can import and process the LNG through the winter. If other imports dried up, could LNG be ramped up to
the needed flow rates? We would have to pay market prices of course, currently about 65p a them.
[edit]
This morning, we are supplying gas a flow rates well above that required for an emergency 'gas balancing alert'. But no alert has been called. What are the implications?
Call up "Prevailing View" at http://marketinformation.natgrid.co.uk/gas/frmPrevalingView.aspx
Then click on "Likelihood to Interrupt" at bottom left. Notice
All of these should normally be "low"
NSL - Network Sensitive Load
NTS - National Transmission System Specific.
In other words although a GBA has not been called there is a high probability that certain customers on interruptible contracts will be cut off. In fact this has already happened but not been reported according to grid data. From Report Explorer http://marketinformation.natgrid.co.uk/gas/ReportExplorer.aspx (click on Daily Summary Report (DSR) )
This shows that actual customers have been cut off the last few days but with no official GBA and no reporting in the press.
NSL - network sensitive load. It's not that unusual for these sites to be interrupted (not 'cut off') occasionally over peak demand periods in the winter. Non NSL sites less so, but these are all sites on interruptible contracts - so they pay less, but agree to stop using gas if requested - as has happened this week.
But as the chart shows, a lot of "Non - Network Sensitive Loads" were interrupted yesterday.
The GBA trigger level refers to demand, not supply. Having said that demand has ticked above the trigger several times this week, and grid haven't issued an alert - think there'd need to be a BIG demand jump or some sort of supply problem for them to do so.
Well yes, they haven't called an alert but they have cut supply to customers. I wonder if these "customers" might mainly be gas fired power stations - which might fit in with the fact we've being supplying more electricity from coal than from gas in the last few days?
see above reply. None of the sites will be CCGTs - these are almost all on firm supply, and even if not, National Grid gas are the same company as NGC power - they're well aware of the consequences of interuppting large power stations.
Depends on when and for how long they are interrupted. If it's a balancing act you can back off gas generation at times during the day if the capacity is available to meet demands at that time from other fuels. Last year IIRC supplies were cut to certain power stations - but yes I'm sure they will be well aware of the consequences of doing so.
All we know is that nearly 5 GWh of supply was "interrupted" yesterday - we don't know where but that's quite a chunk.
For reference in the last 24 hours UK electrical generation
I work trading prompt nbp gas - so am obviously a bit restricted in what I can say, but none of the interrupptions were due to a lack of gas on a national scale. these are all local issues that arise due to the limited capacities of the NTS in terms of distributing gas when demand is high. No power stations had supplies cut, this winter or last, the most that happened is generators took a commercial decision to reduce load based on theclean spread (gas/electricity). Grid will use the price signal as a first option, and yestersay they SOLD (this reduces the price of gas - used because there was TOO MUCH supply and wanted to encourage suppliers to turn down)
Any comments on the 20% price jump in the last two weeks?
Used to attempt to balance supply with increased demand?
Only the obvious - it got cold, demand went up, prices did similar to get storage on to balance. See the blip up of SMP-buy on the 30th, that's grid buying. The blip down of SMP-sell on the 2nd is them selling. In the absence of action by grid SMP buy/sell are a set value above/below SAP.
How does that compare with the current price for European traded gas? Is this a sufficient price to reliably attract imports? If we do run out of gas in storage one winter it will be difficult to explain to the population why we had pipelines in export mode for parts of the winter (not forgetting the gas effectively exported to France as electricity) - in other words I am not sure I have confidence in the leave it to "price" alone to balance everything. To me the UK supply charts look scarier every winter.
Btw, I can't find a reference off-hand but I seem to recall that supply was cut to at least one facility generating electricity and intimately connected to LNG importation last year. I know that sounds bizarre but that's why it sticks in my head. That's what I meant by "certain" stations but I presume any "cock-up" was rectified. But perhaps I just read/saw a mistaken media report.
In Norway there is an identical discussion going on at the moment - only regarding electricity - due to exploding el_prices as of late.
Populace ask; Why the heck did we lower out already shallow hydro reservoirs this summer/fall to export "our now dearly needed electricity" ? further ... what about the rest of the winter?
The El_Guru answers ; Because we are in an open market and production has to stay open to satisfy it's needs ! Market prices goes where it has to, in order to balance supply and demand.
Norwegian hydro-reservoirs are at only 60% of capacity (now) this year, where at this time median is almost 90% - go figure. / http://www.theoildrum.com/node/7124#comment-744791 )
Late winter will be very interesting in Norway- a few nuke outtakes in Sweden and our lights will start to flicker.
Hello Undertow,
My reaction to the price curve you embedded are similar to those above.
We are witnessing the market rationing supplies.
Crude oil (Brent spot) is now trading around $90/Bbl ~ £57/Bbl ~ 100 p/therm.
During the recent 10 years natural gas at NBP has traded in the range of 50 - 85 % (annual average of the recent 10 years has been around 65 %) of crude oil on a heating value basis.
For European Union natural gas has traded in the range of 60 - 108 % (average of 75 %) of crude oil for the same period.
At Henry Hub (US) natural gas is now trading around $4,25 /MMBtu which is around 27 p/therm.
This suggests that U.K. natural gas prices now are moving closer to the pricing of an oil indexed basis. This is how most of Norwegian and Russian natural gas deliveries are priced (oil indexed).
I have seen mention that in recent days some natural gas based electricity generation temporarily switched to liquid fuels. This suggests that U.K. natural gas prices could move closer to parity with oil prices (based on heating value) if there is a natural gas supply crunch in U.K later this winter.
To the best of my knowledge we have very little capability to switch to liquid fuel for generation as we built all these gas fired stations without dual fuel capability. What has happened in recent days seems to be a switch to coal. In the last 24 hours 42.4% of our grid electricity came from coal and 37.4% from gas. Just 0.1% came from oil.
That said there are many private oil fired generators for large organisations that can be called upon at grid request to lower grid demand. I'm not sure there's anyway to monitor that. I did notice, during a grid "insufficient margin" a couple of years ago, that the generators were running at a major British Telecom site when I walked past it. No way to know whether that was a coincidence or something widespread at the time though. It may have been happening over the last few days as well for all I know.
I presume they have to routinely check backup generators anyway, so doing it during a load balancing time is very cost effective.
The diagram shows development in total working natural gas in U.K. storage for the contractual years 2005 – 2010 as of December 2nd.
One caution about using such storage graphs, is that storage is designed to run close to Zero at the lowest point.
If you do have large margins, then you spent too much on storage.
Storage is also replenished, do not confuse it with supply; what it gives is a insurance against supply disruptions, and by buying early, insulates somewhat against price peaks.
Has anyone implied that storage not can be withdrawn close to zero (and perhaps below)?
True, but that is only known after the fact.
So how should adequate storage capacity be determined in advance?
That explains why storage this year was not brought up to the same levels as last year.
Everyone was waiting for the price to go up before more gas was to be put into storage.
UK, 20th to 21st century history : from coal to nuclear to oil and natural gas to wind and solar to WOOD ??!
( 2nd december 2010 : http://www.bloomberg.com/news/2010-12-03/coal-s-surge-coaxes-u-k-utiliti... )
Wood, windmills and water wheels?
Wood, windmills and water wheels?
Britain switched from wood fuel to coal in the sixteenth century because it ran short of wood. I don't think the wood supply situation has improved since the sixteenth century. It's still a small island with a lot of people and not many forests.
The British invented the steam engine during the eighteenth century because all the available water power had been developed. Again, I don't think the water power situation has improved since the eighteenth century.
And, while Britain has never had many windmills, I think that was mainly because the wind power potential was small in relation to its population. Windmills take up a lot of space, and Britain doesn't have much space per person. I don't think that has changed, either.
In other words, I don't think that these ideas are the solution to Britain's declining North Sea oil and gas production.
I think that Euan was being a tad sarcastic.
Windmills take up a lot less space than woods. That said, the UK is planting more woodland, but as an environmental act, not as a serious power source. The steam engine was originally a water pumping engine, to pump water out of coal mines. Coal was originally burned for heat and iron smelting, not driving machinery. Windmills were for water pumping or grain milling. They were built where they were needed. Factories were powered by water wheels or muscle power. They were built near water power.
Hydro power is limited , but we did not max out until about 50 years ago. We have more wind power per unit area than most of Europe, and we are expanding rapidly. Mostly offshore. The technology is still rapidly improving.
Solar potential is limited, not enough sunshine. as is biofuel. Tidal power has some potential. Geothermal potential limited in the UK. Not enough hot rocks.
This is a useful reference www.withouthotair.com
This will help
http://www.bbc.co.uk/news/business-11909048
1 GWs worth of HVDC in the form of BritNed https://www.britned.com/Pages/default.aspx was layed earlier this year and will go online in early 2011.
The really long term smart move would be to run a cable to Iceland / Norway and use their geothermal and hydro resources.
In a so called ”normal year” Norway now produces 120 - 130 TWh of electricity from hydropower. In years where the water reservoirs are lower than "normal" due to less than “normal” precipitation, Norway imports electricity produced from coal and/or nuclear from some of their neighbors. The grid now allows for power exchanges between Norway, Sweden, Denmark, Russia and possibly also Finland, Germany and Netherlands.
In 2009 Norway sold and delivered 23 +Bcm of natural gas to U.K. (this is around 25 % of the Norwegian natural gas exports for 2009).
Perhaps an even smarter long term move would be to find ways to consume less energy (improving insulation of houses etc.) and using energy more efficiently.
Some years ago was the right time to implement such a strategy.
The future will anyway involve less use of energy due to rationing imposed by geological/physical constraints.
Norway, Sweden Finland and the Copenhagen area of Denmark has a syncronized AC grid with strong interconnect between the countries. Finland has a high capacity DC import link from Russia and a low capacity DC interconnect with Estonia. Western Denmark has strong DC links with Norway, a fairly large one with Sweden and soon one with eastern Denmark. Norway has a DC link with Holland. Western Denmark has strong AC links with germany, tha copenhagen area has a DC link with Germany and Sweden also has DC links with Germany and Poland.
Grid strenghtening is ongoing in a large scale in Finland, Sweden and Norway and new interconnects are being built between the countries. The next major addition to this electricity free trading area is to be the Baltic countries with a new DC link Sweden - Lithuania and a second one Finland - Estonia. New ones are proposed to Germany but electricity trading with Germany is hindered by congestion in their grid
All of the nordic countries are reinwesting their electricity production and are adding more non fossil fuel capaciy. I expect us to become electricity exporters.
It is weird that UK did not follow thru with building a large DC link to Norway. They are perhaps unable to fund such investments? There were even free capacity in a major cable plant in Sweden about a year ago but then were the financial crisis in fast flux.
Electricity from biomass is a short term solution since low quality wood is worth more as raw material for fuel and synthesis of chemicals and then can the waste heat be used for district heating and perhaps some electricity.
But this only works out well with lots of wood per capita, its a large scale solution for Sweden, not UK and we ought to get most of our electricity from nuclear, wind and hydro power.
... And it is a long term problem, perhaps considering that soil fertility in UK would require NOW that biomass to restore life for a future resilience and to return to a pre-agriculture equilibrium (where a return is possible). Making some kWh in a second from woodchips or puttin wood remains up to impoverished soils for natural self-fertility process to begin or better let trees live where they are now?
UK imports at present about 70% of all the wood it uses for all purposes.
We have not much more than 6M hectares of useful arable (ploughable) land, which means about 10 persons per hectare, or 4 per acre.We have more grass, some of which could convert to short rotation wood coppice; pitiful really.
Biomass for any type of serious fuel use means imports for the UK. (A bit like our current situation for coal, and increasingly for oil and NG?) There are several power stations in the planning procedure designed to burn imported vegetable palm oil (for electricity; we have minimal District Heating).
God Save the Queen and the devil take the tropical forests.
Didn't Sweden run short of biomass from its slow-growing forests when it was a big smelter and exporter of iron and copper at the end of the 17thC? "Food, War and Crisis". Janken Myrdal. in "Rethinking Environmental History"; 2007, Eds. Hornberg et al
Correct, there were fairly large almost clear cut areas around the pre industrial age industries in Sweden where trees were made into charcoal. The environmental effects were limited by the logistics of sail ships and the coal sledges used during winter. A much larger area were influenced with railways and industrialisation creating the capital needed for floating timber by river and mass manufacturing sharp hand saws.
This trend were reversed in the late 1800:s by a large replanting effort and these laws has held since then, he who cuts down a forest has to establish a new forest. It does not matter if it takes 90 years to regrow giving a net present day value of zero for the replanting effort.
Forestry has now become very mechanized and we have an extremely large network of gravel roads making it very easy to access most forests with ordinary lorries and cars.
There are official statistics for forest growth and the forestry policy is regulated for long term preservation and growth of this national and mostly privately owned asset. This regulation is older then modern environmentalism and has become a social norm.
Thanks Magnus
Is there a theoretical number for the average yearly growth of wood from the total area of forest that could be harvested over the long term (photosynthetic productivity recorded as new wood per hectare per year, x hectares of accessible forest)?
I noticed to my surprise a little while ago, an interest in Sweden in short rotation coppice (willow?). I found that surprising because of the large forest hinterland. Has anything developed from the coppice trial venture?
phil
There are efforts made to calculate the potential but it is probably hopeless to get an authorative figure.
Willow is cultivated on surplus farmland and has been part of an effort to lower the excess food production and get a fuel crop that mostly is used for district heating. Its development has been stagnating since the areas planted are not large enough to give a good market for planting and harvestng entrepreneurs with specilized equipment. Industrial hemp has the same kind of problem.
There are willow fields near the sewage treatment plant in my home town that are fertilized with treated sewage water to use the nutrients and avoid eutrophification. This crop also accumulates heavy metals, especially cadmium and that is realy good for rehbilitating fields but it makes it harder to use the ash.
The highest figure I know of is for Eucalyptus grandis in Brazil, where specially tended clone plantations can grow 37 tonnes/hectare/year of dry timber. Plus about the same again in branches, stumps, roots and leaves, if you could find an economic use for these.
Unfortunately in colder climates the growth rates are much lower. Conifer-growers in Ireland can expect around 20 cu.m./hectare/year, but that's only 8 tonnes/hectare/year of dry timber. In Scotland we average significantly less. In Sweden the growth rates are only around 6 cu.m./hectare/year - that's why their forests take 90 years to regrow after replanting. Growth rates throughout Northern Europe are slowly increasing, as a side-effect of global warming: see for instance Europe Forest Institute Proceedings No.27 (Download from http://www.efi.int/portal/virtual_library/publications/proceedings/ .)
For some obscure reason, a lot of people wax lyrical about coppicing & keep trying to reintroduce the practice. Evidently Sweden has such people too. Any serious farmer or forester will tell you it's commercial insanity to take good farmland and grow willow on it for firewood, unless there are colossal subsidies.
A few days ago I had heard about the cold weather, and my immediate thoughts were to these diaries in past years.
I suppose it is too early to say - a warmer stretch for a few weeks could ease concerns, of course. But if it doesn't warm up there could be trouble.
A very good free weather forecast website ("ilmeteo.it") has bad news for LONDON (UK) wheather in the newt days, and the rest of Great Britain will be also frosted almost until 11th december.
LONDON WEAThER FORECAST
FRI 3.12 fog -9 °C -2 °C
SAT 4.12 rain/snow +1 °C +3 °C
SUN 5.12 rain/snow +0 °C +3 °C
MON 6.12 fog -5 °C +0 °C
TUE 7.12 sunny -7 °C +0 °C
WED 8.12 snow -6 °C +0 °C
THU 9.12 snow -7 °C -1 °C
Aren't food supplies starting to be an issue in some areas?
Not that I have heard. Distribution of almost everything has been disrupted in some areas, including petrol. But the areas affected are relatively localised. We soft Southerners moan about an inch of snow (all we have had in Cambridge) were as in the Scottish highlands anything less than a foot wouldn't even raise comment.
The only surprise is that anybody is surprised. We are ill adapted to cold weather and we do not learn, or have the money to adapt.
Ha! Speak for yerself!
The dray didn't turn up to my local and we had no ale last night. Had to have fizzy lager instead. Bloody outrageous. I blame it on the government.
In Scotland they had to exempt truck drivers from EU hours regs, so that they had enough time to deliver food to stores.
That's about as close as anything's come to food shortages AFAIK
Not so much food supplies but shovels are certainly in short supply. At a local branch of B&Q (like your Home Depot) yesterday I found an entire row empty, Plenty of pitch-forks but they don't work too well on snow :-)
The government has also just temporarily relaxed maximum working hours for certain truck drivers to ensure that vital supplies are not held up because all the legal hours have been used up by drivers stuck in their cabs not going anywhere.
I think not, but it requires deeper investigation.
Does anyone know the round trip efficiency of each form of storage? We think of renewables as needing to be load balanced, but in some sense that is because we have already solved the load balancing issues of other forms of power generation. I am curious to know the energy cost of our current load balancing arrangements.
Jon, a very good question. In the UK pumped storage is the main game in town and is reported here to have 75% efficiency. This link leads to a mine of information on Scottish energy, compiled by the AEA, it strikes me as being quality.
http://www.scotland.gov.uk/Publications/2006/01/19092748/6
Rune, thanks for this excellent posting. I'd like to add something from Entsoe's (Eu
ropean Network of Transmission System Operators for Electricity) recent Winter Outlook 2010/2011, which is based on the information collected from the national grid operators (page 70):
The report also mentions that during cold periods France might need electricity exports from the UK.
Ahh a great status report Rune -thx.
In particular fig 02 is revealing a sobering "Ring ring, it's 7 AM"-moment for the UK. 6 years in as an importer and their ratio for import-to-consumption is already at 4/10 ... or that indigenous production has dropped to a 60% share. The UK is really hitting "a just in time" experience these days regarding NG.
You probably got the latest news on those Norwegian sea "wannabe" NG fields Gro / Dalsnuten, yeah..? That now proven dry NG field was overly hyped to be on par with (...deep breath...) Ormen Lange (!)
This news also hit home over at the Norwegian Petroleum Directorate- urging them to reconsider Ultimate NG in place on the Norwegian Continental-shelf.
Fig 08 speaks for itself. Brrrrrr
Side topic-
Just for information - regarding the new locations of searching for oil/NG in Norwegian waters.The now confirmed dry Dalsnuten field is located 410 km out in the ocean or the distance from London to Scotland.It was supposed to be serviced from Sandnessjoen, sounds like some sort of groundbreaking to me. .
For purpose of illustration, the displayed operating fields of Norne and Asgaard (blue dots) represent about average distance for offshore fields in Norway today. So there.
THE NEW REALITY ON FUTURE NORWEGIAN PETRO SUPPLIES: FAR OUT THERE .....
Google maps show a change on the sea floor just about where Norne, Victoria and Åsgard are located. The sea is a deeper to the west of these three fields.
If i do not have got things totally wrong the sedimentary rock on the sea floor to the west of Norway have been formed by then ice ages come and go by material washed away from mainland Norway. Then looking at google maps I got the impression that there could be sedimentary rock all the way between UK and Norway but further to the north where is just a thin area close to the shore with a thick layer of sedimentary rock. There is an area a bit further to the west there Dalsnuten, Snefrid, Haldang, Luba, Obelix, Gro and Stetind is located but no sedimentary rock around this area this far out at sea. This area seems to be the last large unexplored area to the west of Norway that could be expected to hold any hydrocarbons.
Then looking at google maps it seems that there is a very large area north of Norway between mainland Norway and Svalbard. If hydrocarbons could not be found between Norway and Svalbard I expect hydrocarbon production in Norway to decline fast.
Any comments from anyone with real knowledge about geology and actually geology in the North sea in particular would be apprieciated.
karlnick - without going into any geological details , I can add this.
A- The Fillet Mignon , thus far, regarding Norwegian petroleum has been south of Alesund on that map and all the way to UK waters. The North sea.
B- The portion shown in this map has (so far) not lived up to expectations, far from actually. But there are a few producing areas here
C- The upper portion of this map Lofoten ( Harstad/Bodo area) is "the next big thing" if you listen to Statoil and the Norwegian oil-mob. That area apparently has "preferable fossil geo-rocks"- The only problem is the area is tiny as a stamp - the continental-shelf her is slightly larger than coffee-table ... but also the spawning grounds for the North Atlantic cod fisheries.
It's a political hornets nest and closed until further notice.
D- In the high north , between mainland and Svalbard there has been disappointing drilling efforts for a couple of decades already, only resulting in two fields Snohvit (NG) and Goliat (oil/NG , but yet to start production). Thus far, very disappointing.
What was the weather like in 05?
Mididoctors,
See here: http://www.bbc.co.uk/weather/ukweather/year_review/2005_review.shtml
cheers
Thanks for the post.
For those following the impacts of cold weather in the UK the following site may be of use to augment (and extend) forcasts:
http://www.cpc.noaa.gov/products/precip/CWlink/daily_ao_index/ao_index_e...
It's the Ao index projection page. The AO index measures a pressure pattern called the Arctic Oscillation. In the Winter when the AO goes negative the UK gets cold blocking high weather systems.
The black trace shows what the AO has actually done. The red lines show the projections from the 11 Global Forcast System ensemble members. If the ensemble members diverge that shows increasing uncertainty. At present they are well grouped which indicates the current cold weather is likely to remain low until at least 10 Dec. After which they diverge, however only one ensemble member shows positive AO, the rest continue negative with a negative Ao after 10 Dec. Thus the current blocking high pressure and associated cold weather is likely to continue for at least the next 10 days.
This is pretty accurate for the UK (I follow it daily), but I don't know for sure how it tallies with weather in the rest of Europe or the US.
http://www.express.co.uk/posts/view/215510/Britain-is-freezing-to-death
BRITAIN IS FREEZING TO DEATH
Sadly, this is not surprising. They were warned.
As has been pointed out in the drumbeat The Daily Express is, these days, a sensationalist tabloid which loves to scare a certain segment of middle class readers to death (and they soak it up). Owned by Richard Desmond who made all his money from pornography with titles such as "Asian Babes".
Yes it is cold and in some places things are bad but not as bad as the Daily Express would have it.
Given the reports of "Respiratory tract infections, England and Wales, laboratory 2009" here http://www.hpa.org.uk/hpr/archives/Infections/2009/respiratory09.htm ...
I can easily say that winter seasons are more and more exposing Great Britain to a higher risk of influenza and cold-related virus infections and deaths. Even if the winter excess death tolls seem to be only lightly going up (http://www.heartland.org/environmentandclimate-news.org/article/26712/Wi...).
"Fuel poverty" is rising, not because BNP says it and not because EDL boys are saying it. And it's not because there are too much muslims in the UK. Simply: badly built houses in the 20th century and high prices of energy (declining of energy production per capita).
Don't know if this is already a "dead thread", given that the (excellent) article was posted some days ago. However, for thise in the UK looking for an off-grid solution to heating, try here: http://www.newformenergy.com/hybrid-solar-solution
Yes, I do work for the company, and, yes, it's not a cheap solution... however with income from Feed In Tariff and Renewable Heat Incentive (plus avoided electricity and gas/heating oil costs) it does have a great payback profile.
Is not 'off-grid' and 'Feed In Tariff' a contradiction?
NAOM
Yes, in theory; no, in practice. FIT is payable for off-grid applications.
I was referring to "off-grid" for heat purposes, rather than electricity. So "off-grid" was being used in conjunction with Renewable Heat Incentive.
The point I was trying to make was that there are applications that can reduce wholly or in large part one's reliance on gas or heating oil for heating and hot water.
Thank you for clarifying. Cooling cells would be useful here, to keep efficiency up, but would produce too much heat as it would only be used for hot water and not room heating. Much of the heat would have to be dumped :(
NAOM
Combine the above technology with adsorption chiller for cooling....