Tech Talk - the second tier states
Posted by Heading Out on February 20, 2011 - 5:58am
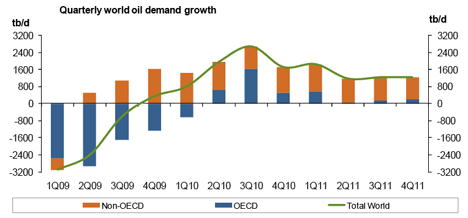
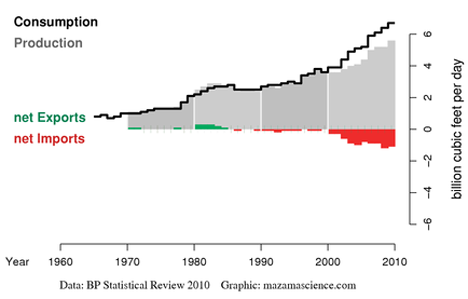
The current series of Tech Talks is aimed at discussing, in gradually increasing detail, where we are, and will be getting our oil and natural gas from over the next two decades. It is relatively easy to do a little hand-waving and say, as for example the BP review did, that Russia and Saudi Arabia are expected to continue to provide 12% each of the world’s oil supply through 2030. It becomes a little more difficult to see that future if one accepts the rest of the BP argument that global supply will rise to over 102 mbd, requiring both Russia and Saudi Arabia to produce at about 12 mbd each through that time frame. It is a little easier to check the validity of the projections if the totals are broken down into smaller pieces, and then examined by looking at both current and projected production from the different countries that supply significant amounts of oil and natural gas, not forgetting the increasing amount that each country is setting aside for its own consumption. We can also check on how that demand is growing. For example gains in the global economy has caused OPEC, in their February 2011 Monthly Oil Market Report (MOMR), to increase their projection of oil demand in 2011, anticipating a rise of 1.4 mbd to average 87.7 mbd.
While the key questions are often focused on countries such as Russia and Saudi Arabia, however, it is in the second tier that more evident changes may be seen. And as a reminder, we are reviewing the countries that were listed by the EIA as the top world oil producers, initially in 2008.
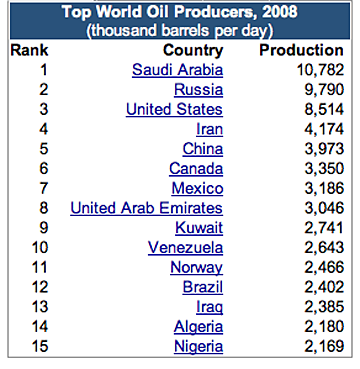
And so we will begin today with a look at the case of Mexico, which ranked 7th in overall oil production, at 3.186 mbd, in 2008, is illustrative of the need to examine future projections with a little caution.
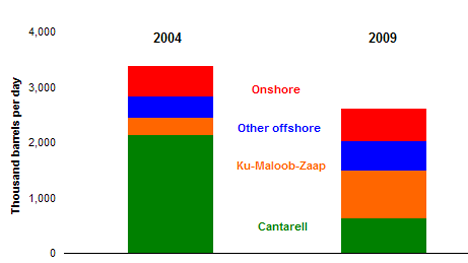
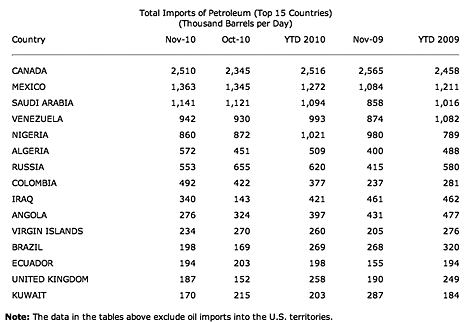
Between those two dates Mexico’s overall production peaked, and started into decline. In December 2010 it produced an average 2.57 mbd of crude. The giant Cantarell field, which at peak production reached 2.12 mbd, fell below 500 kbd last May. Mexico, remains one of the two largest importers of crude to the United States (the other being Canada), but may well become an importer of crude by 2015. Which leaves one wondering where the US might make up that 1 .3 mbd?
Mexico consumed internally an average of 2.08 mbd in 2009. One reason to start with Mexico, which has now fallen to 8th, and to use it as an example is that if we go back to 2007, Sam Foucher at TOD was pointing to the predictions of both the EIA and IEA which foresaw Mexico maintaining production of around 4 mbd in 2010. His projection, that Mexican production would drop by 30% from the 2004 figure by 2012, i.e. to 2.59 mbd turns out to be much closer to reality. (Though as with some of these numbers one needs to be sure that apples are being compared with apples, since there are different values depending on whether NGLs are included in the totals. OPEC, for example, is still reporting that Mexico is producing at 2.9 mbd ). Mexico produces some 7 bcf of natural gas, but uses this internally, and more, so that it is an importer of natural gas, and likely to increasingly be so.
Moving from the troubled conditions in Mexico, the next country down the 2008 list was the United Arab Emirates, which in 2008 had averaged a production of 3.046 mbd. Remembering the decline in demand in 2009, it is not surprising that their output (as part of OPEC) fell in 2009 to average 2.795 mbd, OPEC reports that they produced some 2.35 mbd of crude in December 2010. There was an additional production of NGLs and condensate to give a total liquids production averaging 2.81 mbd in 2010. Consumption within the country has been steadily rising (435 kbd in 2009), and as a result, net exports have been declining.
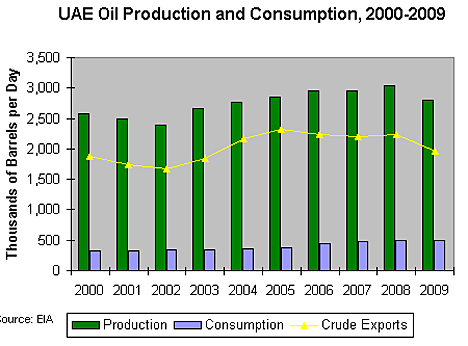
The UAE are one of the OPEC partners who can and do adjust oil flow to balance the market, and can thus potentially help with coming shortages elsewhere. However the UAE anticipates being able to increase oil production to 3.5 mbd,, though not before 2018. One way of achieving this is through extended reach drilling, and the hope of thus being able to increase the ORR to 70%. Current production capability is estimated at 2.7 mbd.
The UAE at present largely exports to Japan, South Korea and Thailand.
The UAE has the seventh largest reserves of natural gas (at 214 Tcf ) However in 2007 domestic demand surpassed production. Part of the reason for this is that the UAE injects the natural gas into oil bearing formations to improve oil recovery. The demand is partly seasonal, with the use of air conditioning driving summer use to over 7 bcf. Up to 3 bcf of this is imported in the summer from Qatar, with only 4.5 bcf being produced by the UAE. While production is to be increased there is also the likelihood that greater supply will substantially further increase domestic consumption, so that the UAE are unlikely to be exporting in the near future.
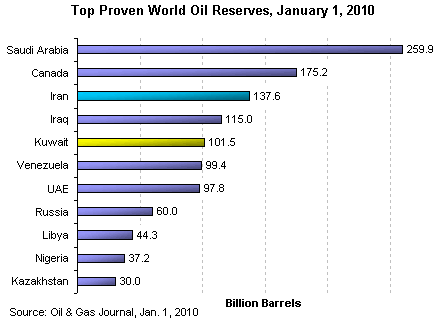
In much the same way as with UAE, Kuwait, as a member of OPEC has been controlling its production levels to ensure that prices stay “stable.” Back in 2008 Kuwait was producing 2.74 mbd and was 9th in the production stakes. It also has the second largest oilfield in the world, the Greater Burgan, after Ghawar in Saudi Arabia.. The EIA consider that it has the fifth largest oil reserves.
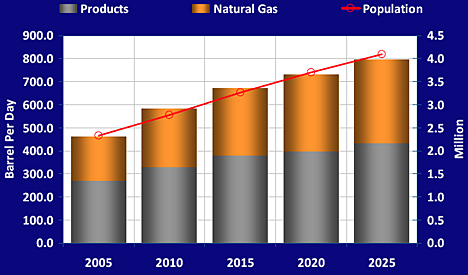
In January 2011 OPEC reported that Kuwait was producing 2.35 mbd, virtually all of which was exported. This in the month when OPEC production returned to the levels of December 2008. Last March Abdulaziz Alattar gave a talk on Kuwaiti oil strategies. The Kuwaiti goal is to reach a production capacity of 3.5 mbd by 2015, and to raise this to 4 mbd by 2020 and maintain it at that level. Concurrently they wish to raise the production of natural gas to 1.2 bcf/day by 2015, which will reduce the amount of natural gas that they currently flare off. In order to achieve this goal they will need to improve EOR capabilities and make the required investment in them. It should be noted that they recognize a difference between capability and actual production. And further they recognize that an increasing percentage of their production will be consumed internally.
It was interesting to see this table of relative exploration and production costs, which was being used to encourage investment help in meeting Kuwaiti goals.
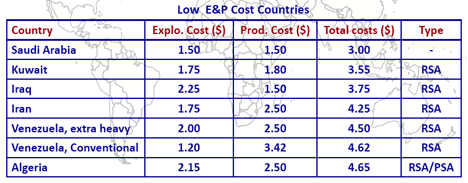
Natural gas increases are needed as much to provide for the domestic market as any other reason, as the plot above shows. For, at the moment Kuwait imports half the natural gas that it consumes. Additional supplies are needed to meet water and electricity needs, and so, instead of largely relying on the gas recovered from oil operations there is a new emphasis on producing natural gas directly.
The next country down the list is Venezuela, but having posted on that country at some length recently, I think I will call a halt on the discussion for the evening.
Contact
- Content: editors at theoildrum dot com
- Tech support: support at theoildrum dot com
License

This work is licensed under a Creative Commons Attribution-Share Alike 3.0 United States License.
Nice report but any discussion of energy that uses EIA statistics regarding reserves--and by reserves I mean any oil or gas that can actually be produced in any meaningful amounts--makes that discussion meaningless.
I understand your reservations about trusting EIA reserve numbers, which are largely in step with OPEC's claimed reserves, mostly grossly inflated. However, the relative reserve numbers are probably not far off, meaning that KSA has three times as large a reserve as Kuwait.
Also, the reserves are very much dependant on the price of oil. If oil could sell for $300/barrel today and into the foreseeable future, then the KSA reserves may be near 200 billion barrels. However, the economy of the US and the rest of the OECD countires cannot tolerate $10 to $12/gallon gasoline, jet fuel, diesel fuel. Thus the economically recoverable oil reserves are more like half of claimed ampounts, IMO.
The response of conventional Texas & North Sea crude + condensate production (horizontal scales), to rising oil prices (vertical scales) has been interesting. Note that these two regions accounted for about 9% of total cumulative crude oil production through 2005.
And then we have the Saudi net export response (horizontal scale) to six straight years of rising annual oil prices (vertical scale):
I understand the effect of price increase on KSA production, as prices trippled from 2003 to 2008 the production first increased, then dropped back to 2003 levels. So maybe they cannot increase their exports much beyond current levels, especially with domestic use increasing. Perhaps continuing increased prices will be necessary for KSA to maintain close to this export level of 8.5 Million bpd. So if the price is $300 per barrel by 2016 (three times today's level), then Saudi's ARAMCO can still export 8.5 mbpd, but the average US driver would be spending 1/4 of his weekly pay on fuel. I don't think the US economy will withstand $8-9/gal gasoline.
I have great respect for the work of Sam Foucher and Jeffery Brown but I don't think these graphs demonstrate that Saudi production is on a path to copy the history of Texas and/or the North Sea.
We would have to see what consumption patterns and economic performance looked like during the times compared and try to understand how much of the export decreases are associated with economic and political events. Further, there can be a pretty big lead time between increases in demand, or discovery, and production.
All of these factors need to be considered before concluding that Saudi Arabia can or cannot meet any projected demand at any aparticular price.
(I hope that a little doubt doesn't paint me as a cornucopian!)
Of course, there is always "Occam's Razor." I guess I would turn the argument around. Given the following data, why should we assume that the Saudis are able to net export, at will, several million more barrels of oil?
But in any case, from the point of view of importing countries, intent is largely irrelevant, since the cumulative shortfall between what the Saudis would have net exported at the 2005 annual rate and what they actually net exported from 2006 to 2010 inclusive is in excess of two billion barrels of oil.
Saudi Net Oil Exports Versus Annual US Oil Prices
2002-2010 (EIA, Total Liquids)
Rising Net Oil Exports (relative to 2002) In Response to Rising Oil Prices:
2002: 7.1 mbpd & $26
2003: 8.3 mbpd & $31
2004: 8.6 mbpd & $42
2005: 9.1 mbpd & $57
Declining Net Oil Exports (relative to 2005) In Response to Rising Oil Prices*
2006: 8.4 mbpd & $66
2007: 8.0 mbpd & $72
2008: 8.4 mbpd & $100
2009: 7.3 mbpd & $62
2010: 7.4** mbpd & $79
*All post-2005 annual oil prices have exceeded the 2005 average, and four of the five years showed year over year increases.
**Estimated
For what it's worth we posted the following Texas (black) & Saudi (C+C) chart in early 2006, using Saudi data through 2005, lining up Saudi Arabia in 2005 with Texas in 1972. The actual 2006 to 2010 (est.) Saudi data are shown:
http://i1095.photobucket.com/albums/i475/westexas/Slide10.jpg
jj – Like you have a little doubt also that the future KSA decline profile may match that of Texas. But I wonder if they are being too optimistic. From what I’ve seen the population growth rate in the KSA exceeds what we had back in the day. And we also had considerable percentage of our energy supplied by domestic hydro and coal…the KSA doesn’t have that option.
But the most important distinction IMHO is our independent small producer segment of which the KSA has exactly zero. The NOC’s have a well established history of not functioning well on the small scale. Current KSA wells average thousands of bbls oil per day. The average U.S. well, thanks to a myriad of small companies, averages less than 10 bopd. And what does this get us: folks forget that the U.S. is still one of the largest oil producers in the well. In fact, last time I noted the numbers we still produce a little more than half of the KSA’s current output. As the KSA wells decline I’ll be very surprised if they apply sufficient manpower/resources to maintain what they would consider marginal production.
Again, mine is just a qualitative view…not quantitative. I’m just too lazy to put that much work into it as our star contributors are willing to do. But I think I might win on some logic points.
"Unleaded petrol yesterday hit a record £5.86 a gallon while diesel was also in uncharted territory at £6.10 a gallon, or 134p a litre."
http://www.dailymail.co.uk/news/article-1358152/The-great-filling-statio...
Doing the conversion, 5.86 pounds = $9.52. So Great Britain and much of Europe is almost at the $10 level now.
you often see comments by US posters that OECD economies can't sustain themselves with gas prices at $10/gal or so and then the reply 'hey we already pay about that' much from Europeans.
Sorry those two big oceans around us can act as blinders.
This chart might help though it's getting dated
US gas is just under $2.50/gallon on this chart. Oil was about $65/barrel.
$10/gal US gas is about $2.65/litre but only about $.10/litre is tax. That leaves $2.55/litre wholesale and distribution--nearly 5x the /litre price on this chart, and even more handlily just an even $2/litre more than on this chart.
So if I haven't totally lost you by now:
the UK is paying about $1.65/litre on this chart add $2/litre to that and zola when a Yank say $10/gal for himself he means $3.65/litre for a Brit. Give or take some. I'll let you convert to pounds ?- )
Our avg,\. pump price is just under $3.20 now maybe 30% higher than on this chart. For my projection to be accurate you avg. gas should be at $8.10/gal.
Well my tools are crude (an envelope laying on the screen) the charts is coarse. If you are already at $10/gal for gas you are closer to 60% above the $1.65/litre on this 2006 picture. Well anyway you maybe get an idea when a Yank says $10/gal it is more like $15-20/gal for you.
The UK have the option of reducing tax if the oil price continues to rise. This is already being talked about by govmnt as a kind of price moderator to maintain a level of affordability within the economy.
Whether it actually happens is of course another question given the addictive nature of our govmnts tax-take. But it is an option.
TW
Yes, that is a very real option, but the revenue likely cannot be foregone that easily, especially if govt programs for weatherization and the like start to generate a real hunger for funds. Its a rock and a hard spot there. Well spent energy conservation money can pay the great dividends--if you can find somewhere to get the money besides of course the printing press.
Still you have adjusted to higher petrol price some already--the US with its very low gas tax really hasn't made much adjustment at all.
Luke
I like the chart. It make comparitive prices much easier to follow.
There is a problem however in using it to extrapolate to higher crude prices. You need to differentiate if the tax impost is flat or proportional.
In Australia we pay a flat $0.38 per litre and a variable 10% tax at the pump. I am sure that this is not the case in other countries where the base tax rate is also dependant on the variable crude price.
Thanks, I did wonder about that. The whole idea was to have something for people to base a ballpark figure on when trying to understand what an American means by $10/gal. Anybody with a tax similar to Australia's would just have to a do a little extra figuring. The chart came from theVictoria Transport Institute. I would have put that in last night but I had just grabbed the chart from an old post of mine and didn't remember where it came from.
Not much info on how it was obtained but it is simple to read and gives a rough approximation of the situation in 2006 anyhow. Just figure that the US tax is per gal (an avg of state taxes + fed). I'm guessing no local sales taxes were included, but there is really no way of knowing.
Assuming some order can be restored to Iraq, it would appear that Iraq could increase their production quite a bit. In addition, the Canadian oil sands production continues to increase. If Brasil can raise/develop production to the level they claim they can, I would think that increased production from those countries could offset the loss of production from others.
"Assuming some order can be restored to Iraq, it would appear that Iraq could increase their production quite a bit...."
I recall a US estimate (2003) of Iraq's possible oil production being around 5 million barrels per day, and that was to be their expected output three or four years after the US
invasion. Now the government of Iraq claims that before 2020 the production will be 12 million barrels per day, a statement which is mostly just posturing to attract investment.
I do beleive that the true production limit of Iraq will be close to the original estimate, maybe close to 6 million bpd. But if their economy grows and the government wishes to keep the populace from revolting, the price of oil products for Iraq's people will have to remain very low and thus domestic consumption will rise. The additional oil production beyond today's 2.7 million bpd will not all reach the export market, perhaps just half of that 2.3 to 3.3 million bpd increase will be available for Chindia to gobble up.
While it appears that Iraq may show a year over year increase in net oil exports in 2011, their 2009 net exports and probably 2010 net exports were down, versus 2008.
Canada has shown a very slow rate of increase in net oil exports since the late Nineties (their increase from 1998 to 2009 was not even sufficient to offset the decline in Texas crude oil production over the same time frame). Combined net exports from Canada + Venezuela fell by about one million barrels per day from 1998 to 2009 (BP)
BP data (focusing solely on petroleum liquids) shows that Brazil is still a net oil importer.
Try to remember that a lot of the increases that you describe are already needed just to make up for the loss of production in older fields, and that the older fields on average are a lot bigger than anything found in the last three or four decades.
But it is not enough to maintain production at current levels since demand is rapidly increasing, particularly in China and India.
In just about any discussion or presentation on the world's outlook for Oil & Gas production it's unusual to see Brazil mentioned. Given the ginormous subsalt finds Brazil has made since 2007 off its SE Atlantic coast I find this puzzling. After all, Petrobras talks boldly of doubling its current production - well in excess of 2 mbd - in a 2015/2020 time-frame and I understand Petrobras' yearly capex budget is already by far the largest of any O&G company on Earth. I'm sure the technology challenges Brazil faces in successfully exploiting these fields safely at such ultra-deep water depths must be daunting but with proven country reserves on this scale (15 billion barrels sounds conservative to me) I'm unable to fathom why Brazil's future contribution as the fourth or largest oil producer rarely seems to get any significant mention. It'll be interesting to learn from the wise at TOD why this is so.
If I am rightly informed Brazils subsalt formations is about the hardest in the world to drill. An important issue is the salt formations that are very difficult to do seismics on, a problem I am told just recently was solved. If you don'thave an X on the map where the oil is, you can't start palnning to drill. Wildcatting here is risky since the cost of one hole is very high, so you are gonna wait for the data.
Anyway; as I understand it these oil formations are among the last one we will ever go after; it is just that hard. Maybe someone else have the details.
Jedi - I'm far from an expert on Bz DW but I have seen some prospects. Unlike drilling though 10,000' to 20,000' of salt in the GOM DW as well as imaging seismic though the same, the Bz DW salt is only several 100' think. It's also a normal pressure section that doesn't require the multiple (and very expensive) csg stings and high mud weights (I was a pore pressure analyist on some Bz DW driling) the geopressure GOM DW wells do. The water depth and complete lack of pipeline infastructure does make Bz DW more complicated/expensive. Additionally the Bz DW formations are very porous and permeable.
But having said that seismic interpretaion is seldom very easy. But the structural geology isn't any more comlicated then what they were drilling in west Texas 50 years ago. And the seismic quality today is several magnitudes better than what they had back then...if they had any seismic at all.
daibak - I'll answer for myself and not the rest of TOD. I actually worked on a DW Brazil field for a short bit. They certainly have proved up a huge volume of oil. Addtionally the geology is actually relatively simple. Much easier than the DW GOM IMHO.
But I don't tend to pay much attention to the amount of future production anyone offers. It may be as much or even more than published projections. But having been involved in the development of DW GOM fields I'm familiar with the complexities as well as the time lags involved. DW Brazil has an addition hurdle: pipelining the production to shore is not an option. It has to be accumulated in the field and then tankered to shore. Not impossible, of course. Just more complicated.
But what I haven't seen is any documented projection of the time line that will be required to bring the various proved discoveries into production. In the end PO is not about how much oil remains to be produced but when and at what rate will new discoveries add to global production. For all I know DW Brazil may eventually ramp up global production rates significantly. Or perhaps won't come on quickly enough to replace the depletion of existing fields. I just don't know. But I haven't seen anyone else offer a documented answer either.
Rockman & Jedi, thanks for your comments. It's a bit what I've suspected that one needs to separate the political hype (Lula convinced most all of Brazil's population, say 190m, that "Subsalt Brazil 2015 = Saudi Arabia 2010" to get his hand-picked ex-Minister of Energy & Mines, Dilma Roussef elected president in 2010) and what's about to happen deep under the ocean about 200 miles offshore. It's going to be an interesting E&P development to watch considering the amount of money being thrown at it.
Brazil is missing from this post because I am doing these a few at a time, and working down the list, given at the top. I usually like to keep these posts fairly short, hence only a few countries are listed at one time. But Brazil, which is moving up the ladder, has been covered in next weeks section. (As are Norway, Iraq and Algeria).
Nice Dream !!
The Houston Chronicle today offers readers "The world's next oil boom"
http://www.chron.com/disp/story.mpl/business/energy/7438454.html
showing it's not only Brazilians who hold such high dreams about these subsalt finds.
As for me, I prefer to side with Rockman's more experienced and balanced view that it's still a toss whether Petrobras' efforts will be a global game-changer because of the lengthy time lag required to achieve full, safe production from these giant new fields. I look forward to HO's input.
Considering the differences between the realities of countries already in depletion and the crazy forecasts of the others especially UAE and koweit one can only realize the tremendous mess we are in and this being right now
Following are the production, consumption and net export charts for the (2005) top five* net oil exporters that I presented at the 2007 ASPO-USA conference, showing the actual data through 2006 and Sam Foucher's projections. The dashed lines represent Sam's estimated 95% probability boundaries (95% probability that the post-2006 values would fall between the dashed lines). The actual 2007, 2008 and 2009 data points are highlighted with circles (BP). Sam's best case scenario is that by the end of 2014, these countries will have shipped about half of their combined post-2005 CNE (Cumulative Net Exports).
*Saudi Arabia, Russia, Norway, Iran and UAE (about half of global net oil exports)
Here are the observed rates of change for production, consumption and net exports for 16 net oil exporters showing multiyear production declines, relative to a prior production peak, which may or may not be a final production peak (some countries, e.g. Colombia, are showing increasing production, but as of 2009 they were still below a prior peak). The peak production year used for the calculations is shown in parentheses by the country. (Data: BP + Minor EIA input).
In 2004, Mexico was consuming 51% of their total petroleum liquids production. From 2004 to 2009, production fell at 5.0%/year, while consumption increased at 0.8%/year, resulting in a five year net export decline rate of 13.9%/year. In simple percentage terms, a 22% decline in production and a small increase in consumption resulted in a 50% decline in net oil exports. Net Export Math marches on while the world remains almost totally oblivious.
Note that the data show one country, Equatorial Guinea, with a consumption decline rate in excess of the production decline rate, but this is because their consumption basically rounds off to zero (falling from 1,100 bpd to 780 bpd). For countries with more meaningful levels of consumption, given a production decline, unless they cut their consumption at the same rate as, or at a rate faster than, the rate of decline in production, then the net export decline rate will exceed the production decline rate, and the net export decline rate will accelerate with time.
Note that the Rule of 72 works both ways, up and down. At a 5%/year decline rate, the volume of net exports fall by 50% in 14 years. At a 10%/year decline rate, net exports fall by 50% in 7 years, and so on.
Since net exports do not follow an exponential decay model (if it did it could never reach zero) it is inappropriate to use the rule of 72 to make any sort of prediction of the future net exports.
I agree that the Rule of 72 understates the magnitude of net export declines going forward, but it is of course accurate looking back at historical declines, such as those shown on the chart.
Surely a severe decline in net exports will reduce consumption in countries that rely on revenue from those exports to boost their economy, e.g. most of the ME? Won't this act as a kind of negative feedback that the ELM needs to take into account?
Not saying ELM is wrong but it seems a bit simplistic to assume economies dependent on oil revenues can continue to grow without that revenue.
TW
I always ask people to find examples of oil exporting countries, with meaningful levels of consumption and given an ongoing production decline, cutting their consumption enough to keep their net export decline rate at the same rate as or at a lower rate than, the rate of decline in production. Consider Denmark on the above chart. They have cut their consumption, but it was not enough to keep the net export decline rate from exceeding the production decline rate.
Given a production decline, unless an oil exporting country cuts their consumption at the same rate as, or at a rate faster than, the rate of decline in production, then it is a mathematical certainty that their net export decline rate will exceed the production decline rate, and the net export decline rate will accelerate with time.
Fair point WT but we've not yet had an oil exporting country go to zero exports that is almost totally reliant on oil revenue to sustain growth. Which is the case for many of the Arab states. For countries such as Denmark, and even the UK, oil export revenue was a nice to have but still only a relatively minor part of the economy. So the drying up of that revenue was never likely to crimp consumption growth except at the margin. On a larger scale the same is of course true for the US (debt and gradual decline arguments aside of course!).
So I still think it is hard to predict what will happen when one of the heavily oil revenue-dependent OPEC memebers exports decline dramatically. Basically we've not been there yet. Probably not long to wait though.
TW
Of course, we did have a founding member of OPEC, Indonesia, slip into net importer status:
http://energybulletin.net/stories/2011-02-21/egypt-classic-case-rapid-ne...
Yes but Indonesia is not a desert Nation that was totally dependent on oil revenue to support its consumption. Think about the position countries such as KSA, Kuwait and UAE were in before oil was discovered and compare that to taday. Pretty much all their gdp is now dependent on oil revenue, from the import of food to all the myriad consumer goods including those that run on oil. If they don't maintain their oil exports then how will they buy the stuff to grow consumption?
Clearly exports will eventually fall with production but I'm not convinced this will be excacerbated by continued incresaes in local consumption. If anything I can see that consumption dropping as imports fall with faling oil revenue. IMO it's more complex than some of the simpler equations suggest.
Of course revolutions make things more complex still!
Guess we'll see.
TW
You also have to look at cash flow in the desert nations. I have suggested that we will see Phase One and Phase Two net export declines. In Phase One, the cash flow from declining net exports will be stable to increasing (because of generally rising oil prices), while in Phase Two, generally rising oil prices won't be able to offset the decline in the volume of net exports.
Also, note that the bulk of post-peak CNE (Cumulative Net Exports) are shipped early in the decline period.
In any case, an oil exporting country has to cut their consumption at the same rate or at a faster rate than the production decline rate, otherwise "Net Export Math" kicks in.
And for those how don't understand how EG consumption appears to defying logic it's really very simple: the dictator of EG is slowly killing off the population that has no value in his opinion. BTW...that's the great majority of the country's 500,000 citizens. He's doing this by withholding basic human needs: food and medical care. Very effective method: I've seen the near skeletal bodies sitting on the side of the road as I was transported from the airport to ExxonMobil's compound. But the good news is that the U.S. and EU are receiving the bulk of the oil that would otherwise be wasted on the local population.
Many speculate about the nature of the world when PO hits high gear. Perhaps EG will be the future model. After all, starving a population costs nothing. And if the population decides this isn't acceptable...well...a bullet to the back of the head is still a fairly cheap fix.
Oh..BTW...last week one of our State Dept talking heads described EG's El Presidente as "one of the good guys". Easy to be a friend of the U.S. these days: just keep sending us your oil and we'll overlook those silly human rights violation. Aftr all, it just BAU.
This is where the issue of food makes a difference in oil exports. If a country's cost for imported food is rising, then to keep that population from revolting (more likely in Muslim countries than Christian countries IMO), the government will keep the domestic price for energy from rising. And low priced gas, kerosene and diesel mean increased domestic consumption by the population for personal, industrial and agricultural uses. Thus, oil exports will gradually decline in countries where production is stagnant or increasing a small amount and a large part of the food is imported. This applies to several OPEC countries. ELM taken one step further when considering rising food prices.
It have been tried before and works great.
http://www.wolfetonesofficialsite.com/famine.htm
Just have to figure out a way to be in the upper class ...
It looks like ASPO predicted the Mexico decline fairly accurately back in 2003. Looking at the ratio of current production level to peak, they predicted in the range of 75% of peak by now.
From 2003: http://www.peakoil.net/Newsletter/NL35/Newsletter35.html
I also have more analysis in The Oil ConunDrum, with Mexico compared to other regions both in production and also in reservoir size distribution.
This is another very good snapshot of oil production by OPEC, which our US government says we will be relying on for increased oil production. Nice work H O.
One footnote that should be added to the cost of E&P for middle east oil is the US expenditure for protecting shipping lanes and the war in Iraq. The US now spends at least $200 billion of its nearly $800 billion defense budget in this oil production area of the world, with nearly $100 billion per year in Iraq alone. If these costs are allocated to the annual production of OPEC' middle east producers (around 9 billion barrel per year), the E & P cost rises to at least $26/barrel. So, the US is becoming an increasingly poor country ($15 trillion government debt now) in the effort to keep the middle east oil flowing and the world price relatively low.
"if one accepts the rest of the BP argument that global supply will rise to over 102 mbd"
I for one, who am willing to accept huge technical improvements in oil recovery over the next 2 decades, cannot accept that.
But, I for one, who never likes making a prediction, will make one: Oil DEMAND will NEVER be 102 mbd, never.
The oil age is over. We are now in the process of figuring out how to wind it down without causing excessive disruption to the vested interests and infrastructure built up around it.
RC
Interesting--it does seem it would be in BP's interest to project continuing growth in demand for oil, it is what they sell.
The oil age is over.
Oil consumption went up by 2.5 million barrels a day last year, hardly working out how to use less oil. At this rate we will be using 102 mbd in 6 years or 8 years if you hope for only 1.8 million barrel day increase.
U.S. Sold 12 million vehicles last years, how many were hybrid, how many were electric?
China sold 18 million vehicles last year, up over 20% in one year, by 2015 they hope to have a million electric cars on the roads, trouble is, they will be selling around 25 million vehicles by then.
http://green.autoblog.com/2010/08/25/study-china-to-gain-top-spot-in-ele...
They will be using 14/15 million barrels a day by 2015 and OPEC countries are increasing consumption nearly as rapidly.
You are right we will never use 102 mbd but it will be supply constrained and not demand constrained.
It has been projected that total human population will increase from today’s 7 billion to over 9 billion within the next two to three-and-a-half decades. And most of the increase is happening in areas that are starting from a relatively low standard of living, where the people want the same improvements that we in the west have had for a long time. We can already see increased energy use in some of these emerging areas (e.g., China, India, ME), not only on a cumulative basis, but even on a per capita basis. So there are areas where oil use will likely increase at a rate even faster than the population increase. And it wouldn’t be surprising to see the same trend in other emerging areas, especially the ones that can produce oil locally – Brasil and West Africa come to mind.
Modern communication has made it clear to the people in these emerging areas that they don’t have it as well as the west, and that has created a strong desire to improve living standards. When you put it all together – significantly increasing human population, and most of the increase happening in places that want to elevate living standards on a per capita basis, I don’t see how there can be any result other than a significant increase in usage of ALL energy sources, with oil being the most highly prized source of all. Of course there are big caveats that could reverse the trend - massive worldwide economic collapse, global epidemic that kills off a lot of people, climate catastrophe, etc. But I don’t see the gradual ramp up of windmills, electric cars and solar panels as being significant enough to stem the massive demand for oil that will be created by more and more mouths to feed and higher expectations for each mouth.
From Seeking Alpha,
http://static.seekingalpha.com/uploads/2008/2/15/oil.jpg
Recall that the above flattening was before the 2008 financial crisis/panic/whatever. Oil consumption was already slipping worldwide.
The above oil consumption is also based on the worst generation of "legacy vehicles" from the roaring 1990's as new vehicle sales in the developed world had already began to slide. The technical improvements in vehicle drivetrains and the return of the customer to smaller vehicles had not really yet began. I can now buy a hybrid in almost any make of car I choose, and 41 miles per gallon in a relatively luxurious automobile is easily achieved now.
Oil is essentially a motor fuel, i.e., the vast majority of oil consumped goes out the tailpipe of motor vehicles. The technical advance in reducing the oil consumption of vehicles is only at the front end of development and already the advances are huge.
The first generation of the vehicles sold in China and India will be the worst in terms of energy efficiency. Already they are developing and planning whole ranges of hybrid and electric vehicles, including buses and trucks. The battery technology is moving now at...what word woould fit? Whiplash speed, breakneck speed, whatevery word you care to use describing a pace of development that is almost disorientating. We are in a whole new world in terms of energy efficiency development but it is coming into the marketplace so seamlessly few will even notice it. The goal for the auto makers is to make it "transparent", so seamless the customer does not feel the pain. They are achieving it.
RC
Interesting graph, and yes I’m aware of the improvement in GDP-per-unit of oil. But the fact is that absolute oil use increased during the time range of your graph, and it took a semi-depression in the US, Western Europe and other OECD economies to reduce consumption. After one year of deeply depressed economies – the trend line went right back up again and doesn’t show any signs of letting up.
Look, I’m not discounting the likelihood of modern technology (battery technology, EV’s renewables, etc.) to add efficiency to the use of oil. I EXPECT that to happen. It’s just that efficiency in the use of a resource doesn’t always lead to less overall use. In the case of oil, I expect it will simply enable higher priced oil sources to get exploited and, paradoxically, more volume to enter the market. In other words, the efficiency benefits gained through technology will be overwhelmed by the sheer magnitude of bigger populations with bigger aspirations figuring out how to exploit more oil for a better life. Nobody can say with certainty if the upper limit will be 102Mbpd or some other number. But I suspect the limit will be set by geologic constraints, other constraints imposed by nature or else a collapse of the financial system, not by technology that allows the population of the world to keep expanding without bound, all the new billions to drive around in EV’s and overall oil use to decrease.
RC
Global total liquids consumption has gone up from 76 mbd to 86 mbd from 2002 to 2010.
http://www.eia.gov/cfapps/ipdbproject/iedindex3.cfm?tid=50&pid=53&aid=1&...
Hybrid vehicles are made but hardly anyone is buying them, as they are still expensive relative to ICE vehicles. Hardly see any on roads of UK.
The U.K. consumes 1.6 mbd and produces about 1.4 mbd and production is falling on average 100,000 bld per year.
If our consumption would fall in line with production, of the 3 million new cars sold, half or them would need to be fully electric and the rest hybrid.
In the states if every single new car was fully electric it would take 10 years to get your consumption down to your production levels.
This is why in the Hirsch report, they said 20 years was needed to transition through peak oil without any adverse economic consequences.
http://en.wikipedia.org/wiki/Hirsch_report#Mitigation
Yes, I have read the Hirsch report about five times, it is very astute, and a remarkably clear headed research document.
The Hirsch report was written in 2005, which means we are already past 25% of the transition time Hirsch described if oil had peaked that year (which it obviously didn't, (because as you say oil consumption rose by 10 million barrels per day out to 2010) and again, this rise was with a hyper fast growth rate in India and China (can they really sustain those kind of growth rates for even another half decade?) and the fattest, heaviest legacy vehicles, wehicles which seem almost primitive by todays standards. We are in for some fascinating readjustments.
RC
Most vehicles sold in China are made in partnership with the biggest car companies in the world.
Toyota, Ford, GM, VW, Fiat, etc. They are up to date technology, otherwise they will loss out against the competition.
The growth rate in china over the last 4 years in vehicle sales was about 25%, I have used to lowest forecast I found, which is 10% for the next 5 years.
The best selling vehicle in the States last year was the ford F-150, you really think these are more fuel efficient compared to legacy vehicles?
Average new F-150 will still be on the road in 10 years time, by that time peak oil EXPORTS will be having a marked impact on fuel prices.
This is why your statement that oil consumption had already started to fall is simply wrong and the consumption figures for last year show that quite clearly.
We are in for some fascinating readjustments.
Yes, stagnation and hyperinflation will produce some fascinating readjustments, just like in Egypt and Libya only worse.
Think it cannot happen?
Germany and Italy cafe society turned into the chaos of Egypt and Libya after the 1920s boom went bust.
Careful what you wish for!
I’ve been to China several times in the past year, and my unscientific, seat-of-the-pants observation is that the average car you see on the road there is somewhat newer and significantly smaller than what you see on roads around most US cities. The Chinese are smart people, and I have no doubt they will pursue even more fuel efficient vehicles in the future as technology moves forward. But efficiency gains achieved there will likely be overwhelmed by the sheer volume of new cars coming into the fleet. This oildrum post last year discusses the likelihood of different oil use trends as China motorizes its society.
http://www.theoildrum.com/node/6699
There have been previous posts (couldn’t find them with a quick search) that show previous expansions of oil use in Asian countries, when GDP-per-capita gets to a point where the people are wealthy enough to drive economic expansion via internal demand. Both Korea and Japan went through long economic expansions where the living standards rose and energy use increased as a result. This is over and above the motorization issue in the article above. And this same goal of rapidly rising living standards and increased access to the energy that fuels it is what people are striving for in countries all over the Earth where population is dramatically rising.
Efficiency gains through technology advancements will be both significant and necessary, but my hunch is that they won’t be sufficient to offset the overwhelming demographic evolution that is happening all over the world. Two billion new people in the next 20 to 30 years, and most of them wanting - demanding - the same lifestyle that we have. Oil use will indeed hit some upper limit and probably soon. But it won’t be because some clever new technology extends the BAU lifestyle of Western societies to all the billions of new humans being born in Asia, Africa and South America. It'll happen because the system hits some limit of physical and/or financial constraints.
I agree, efficiency could reduce oil consumption in developed countries, replacing big engine cars with smaller ones over time.
China on the other hand will continue to use more, because no matter how efficient the cars are they are additional cars on the roads, using extra fuel.
Even at the lowest rate of increase in vehicle sales predicted, China will be using 13mbd by 2015 and 17mbd by 2020.
We could use alot less oil, but it takes time to build railways, trains etc, more than just a few years.
http://english.aljazeera.net/news/africa/2011/02/201122131439291589.html
Members of an army unit known as the "Thunderbolt" squad had brought wounded comrades to the hospital, he said. The soldiers said they had defected to the cause of the protesters and had fought and defeated Gaddafi's elite guards.
They are now saying that they have overpowered the Praetorian Guard and that they have joined the people's revolt," another man at the hospital, lawyer Mohamed al-Mana, told Reuters by telephone.
http://tonto.eia.doe.gov/countries/country-data.cfm?fips=LY#undefined
Retrospective review of development indices of West-Siberian greatest fields
http://www.burneft.ru/archive/issues/2010-07-08/17
This is a typo - it should say exporters. Mexico and Canada are major exporters of crude to the US, although Mexico may reverse that position.
On a technical note, it may remain a large exporter of crude to the US while importing more refined products than the crude it exported technically could supply, making it a net energy importer of petroleum products. But I don't want to get into geopolitics (which is the direction I'm heading), I mainly just want to point out the wording that was obviously contrary to the intention of the author.