| Why are WTI and Brent Oil Prices so Different? | The Oil Drum | ASPO Conference 27-29 April Brussels, Belgium |
North African gas supplies to the European gas market
Posted by Euan Mearns on February 23, 2011 - 12:36pm
With civil and bloody unrest spreading across North Africa and The Middle East, it is once again appropriate to look at the dependency of Europe upon imports of gas from North Africa. With the North Sea in decline and Norway struggling to meet supply forecasts, Europe is becoming increasingly reliant upon gas imported from Russia, Africa and The Middle East. Below the fold is a post originally run in December 2007 called 'The European Gas Market'. It is a little out of date but still serves to illustrate the main suppliers and importers of natural gas from North Africa.
OECD European gas production looks set to peak in 2008. After that, falling production combined with rising demand will see OECD European gas imports wanting to rise from current 197 BCM per annum to 442 BCM per annum by 2020. Where will this gas come from and how will rising European imports affect N America and the rest of the world?
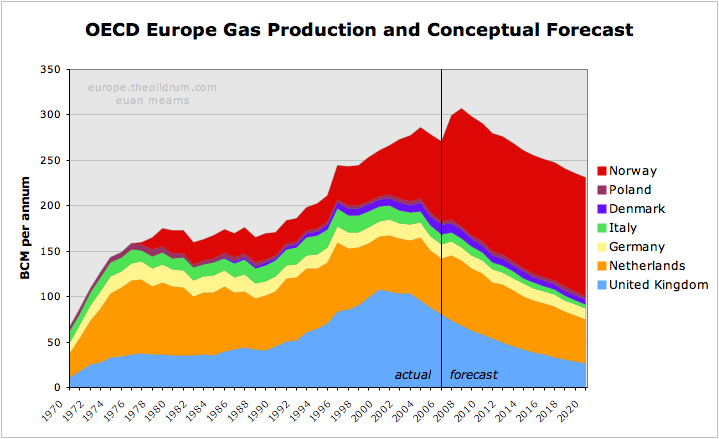
Figure 1 OECD Europe gas production and conceptual forecast. Click all charts to enlarge
Executive summary
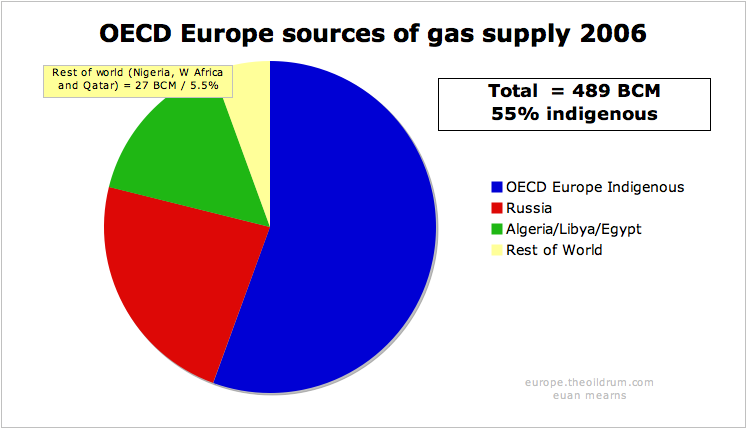
- As of 2006, OECD Europe produced 55% of its own natural gas with the majority of gas imports coming from Russia and Algeria.
- OECD Europe has three main gas producers - Norway, The UK and The Netherlands. Norwegian gas production is undergoing a major expansion, but this is forecast to halt at 130 BCM per annum next year for political resource conservation reasons. UK and Dutch gas production are in decline, and combined OECD Europe indigenous gas production looks set to peak in 2008.
- Gas consumption has been rising at 2.6% per annum since 1980 and there are a number of reasons to suggest that rising demand for gas will continue into the future unless it is checked by high price or shortages of supply.
- It is believed that Russia will do what she can to maintain gas exports to OECD Europe. But with their three biggest gas fields - Yamburg, Urengoy and Medvezhye - in decline, maintaining supplies from second tier assets will be a major challenge. In order to maintain supplies to the OECD Europe, supplies may have to be cut to other countries.
- Algeria, Egypt and Libya will all see expansion of gas production in the years ahead, but will also experience growth in indigenous consumption, especially in Egypt. Gas exports from these North African states are forecast to peak in 2015. They may provide an additional 33 BCM of exported gas to the European market.
- OECD Europe gas imports are forecast to grow from current 197 BCM per annum to 442 BCM per annum by 2020 - if we see business as usual growth in demand and consumption. Where will this additional 245 BCM come from? Some may come from N Africa and some from West Africa and Qatar. It seems unlikely that an increase in imports on this scale will be possible and that high price and shortage will ration supply. This market driven outcome may hit the poorer nations hardest and one may suspect this may have a destabalising effect.
Introduction
This post will provide a production forecast for Europe's main gas producers (the UK, The Netherlands and Norway); it will examine existing import patterns in Europe's main gas consumers (Germany, Italy and France) and the ability of gas exporters to meet growing OECD European demand - Egypt, Libya, Algeria, and in particular Russia. This article was initiated as part of study of UK gas security. The UK faces rapidly falling gas production and an equally rapid expansion of imports and the key question for the UK is where will this gas come from? This will be dealt with in a separate post.
There are a number of ways to divide Europe for economic analysis. I have chosen to break out data for European states that are members of the OECD. This includes the important oil and gas producer Norway, which is not a member of the European Union (EU) but excludes the Baltic States, Romania and Bulgaria which are EU members but have not yet joined the OECD.

Figure 2 Map of the European Union.
Turkey is a member of the OECD but lies mainly outside of Europe and is not included in this study. Turkey is a major importer of gas, especially from Russia.
Data sources and gas units
Throughout this article I have used data from the 2007 BP Statistical Review of World Energy. I have also used billion cubic metres (BCM) as the standard unit for gas measurement. According to BP, 1 BCM is equivalent to:
35.3 billion cubic feet (BCF)
0.73 million tonnes of liquified natural gas (LNG)
36.0 trillion British Thermal Units (BTU)
6.29 million barrels oil equivalent (BOE)
Gas production forecast
OECD Europe gas production is dominated by three countries - the UK, The Netherlands and Norway, with lesser but significant quantities produced by Denmark, Italy, Poland and Germany.
Figure 3 OECD Europe gas production and conceptual forecast.
The UK
The changing face of gas production in the UK lies at the heart of Europe's emerging gas problem. In 2003, the UK was a net exporter of gas to Europe but with peak production in 2000 and production now falling at 8.7% per annum it had become a net importer by 2004. The challenge facing the UK gas industry will be the subject of a detailed post.
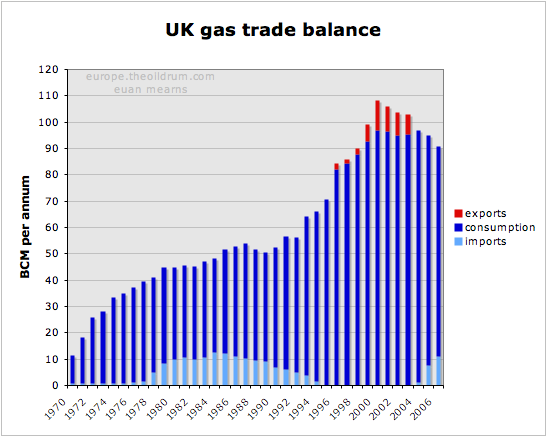
Figure 4 UK gas production and consumption history
The UK forecast is based simply on extrapolating the 8.7% decline to 2020 by which time production is forecast to be 26 BCM per annum. At peak in 2000, the UK produced 108 BCM per annum and in the space of 20 years the UK will have gone from net exporter to a major importer, being dependent upon imports of over 80 BCM per annum.
This view on decline of UK gas production is shared by the UK BERR (Department for Business and Enterprise Regulatory Reform - formerly the DTI). See for example Figure 5.2 in this report.
The Netherlands
The Netherlands is home to OECD Europe's largest gas field. Discovered before WWII, the full extent of the Slochteren Field did not become apparent until the post-war years. It was the discovery of this field in the Permian Rotliegendes sandstone that sparked the exploration for gas and then oil in the North Sea.

Figure 5 Europe's largest gas fields. Data for Slochteren from Rembrandt Koppelaar. Troll and Ormen Lange from the NPD.
Slochteren lies onshore in the Groningen area of northern Holland and dwarfs the giant Norwegian gas fields of Troll and Ormen Lange. Further fields were found around Slochteren in the on-shore and off-shore areas.
Slochteren was never produced flat out and the Dutch government has laterally set a production cap on the field. In the period 2006 to 2015 this cap is set at 425 BCM over the 10 year period. NAM (the Shell - Exxon operating consortium) can optimise production over this time frame but strictly within this overall limit. The production cap on Slochteren has resulted in a long drawn out production plateau analagous to that seen in the Saudi super giant oil fileds - a very enlightened production strategy on behalf of the Dutch government.
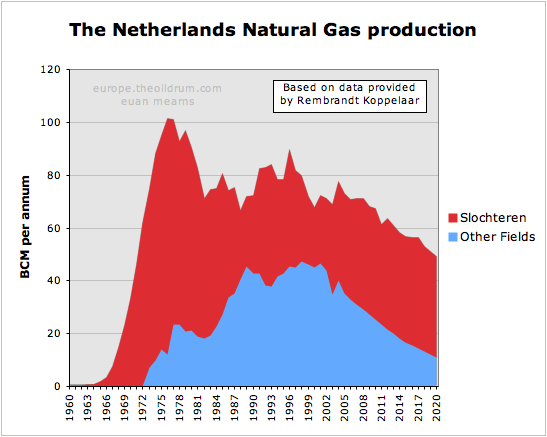
Figure 6 Dutch gas production and forecast based on data provided by Rembrandt Koppelaar. The smaller offshore fields are showing a decline similar to the UK. Note that the volumes here are substantially larger than quoted by BP (see Figure 7). Rembrandt suggested this could be due to adjustment by BP for the energy content of the gas.
The other fields were not subject to regulation and are now in decline in similar manner to the UK gas fields. According to Rembrandt, Slochteren will also begin to decline naturally after 2015 and the bottom line is that Dutch gas production is now in an irreversible decline phase.
The forecast for the Netherlands is based on data kindly supplied by Rembrandt. This has smaller fields declining at a similar rate to the UK, while Slochteren has a somewhat lower decline rate.
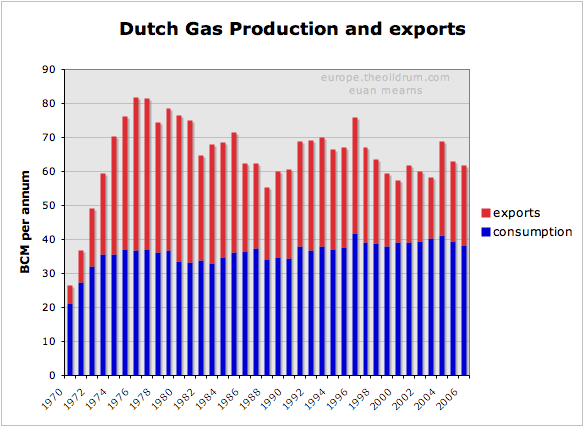
Figure 7 History of Dutch gas production and exports.
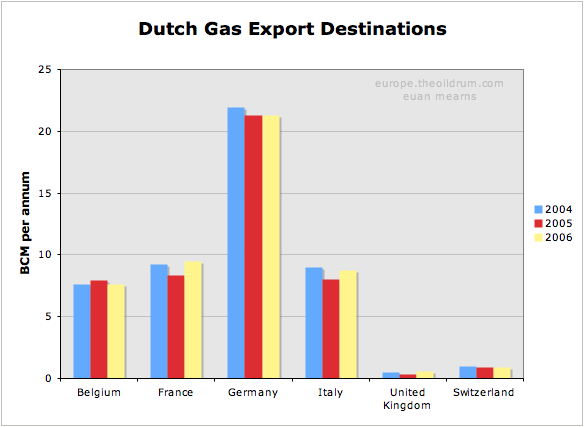
Figure 8 Destinations of Dutch gas exports. Note that the Dutch import gas from Russia and Norway for re-export.
It can be seen that Dutch gas exports have been declining irregularly since the late 1970s and that some day post 2020, the Dutch may become an importer of natural gas.
Norway
Norwegian gas production has expanded rapidly in recent years, mainly the result of the Troll Field development. This expansion is set to go on for another couple of years, but then I suspect the expansionary phase will come to a halt.
In 2006 Norway produced 87.6 BCM of gas. Since then the Langeled pipeline that connects the Ormen Lange Field to Easington in England (and also to continental Europe) has been completed. The capacity of Langeled is about 20 BCM per annum. Furthermore, the development of the Snøhvit Field in North Norway with an LNG train provides Norway with an additional 5.7 BCM capacity.
The Norwegian export pipeline system is reported to have a capacity of 120 BCM per annum. With domestic consumption running at 4.5 BCM and LNG production at 5.7 BCM, future Norwegian production is forecast to run at 130 BCM per annum.
With Europe becoming ever more thirsty for gas, there was a plan to expand production in the Troll Field by 20 BCM per annum. Most significantly, this consent was refused by the Norwegian parliament. Hence Norway is in a position of having ample reserves to sustain a short term production boost, but instead seems to be choosing the path of restrained production which will favour an extended plateau at lower than maximum possible production levels.
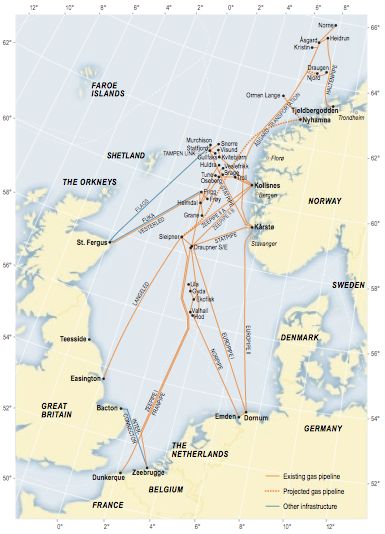
Figure 9 Norwegian gas infrastructure.
The map of the Norwegian gas pipeline export system shows where Norwegian gas enters the UK and Continental Europe. The UK imported gas from Norway during the 1970s and 1980s where gas from the Frigg Field was piped to Scotland via the Vesterled pipeline. Since then the UK has had no need for Norwegian gas - until recently where a massive expansion of import capacity has been built. The Vesterled pipeline is now connected to the Norwegian gas transmission network and has been one route into the UK for Norwegian gas in recent years. There are, however, two new pipeline systems. The already mentioned Langeled pipeline that connects the UK to Ormen Lange via the Sleipner hub. And the Tampen Link that connects Statfjord and other mature fields in the Tampen Spur area to the UK operated FLAGS pipeline system. FLAGS transports associated gas from the northern UK fields to St Fergus in Scotland and since that UK gas production is now in decline, the Tampen Link will fill that surplus capacity - for a while at least.
Five other pipelines make landfall in continental Europe at 4 import terminals. Three pipelines feed two terminals in North Germany. And one pipeline lands at Zeebrugge in Belgium and one at Dunkirk in France. These entry points are connected to a broader European gas transmission system which pipes Norwegian gas as far as Spain, Austria, the Czech Republic and Poland.
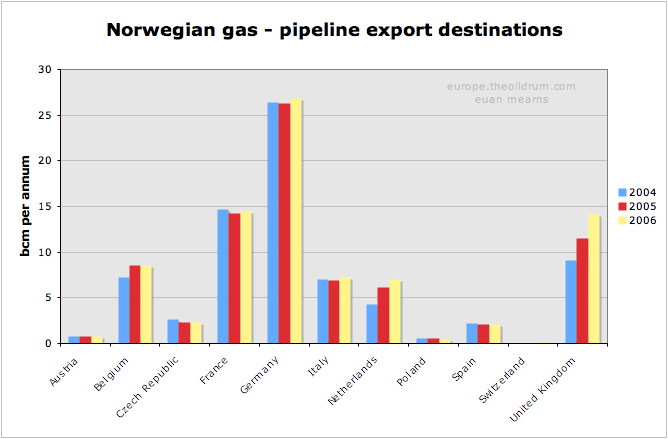
Figure 10 Export destinations for Norwegian gas. Up until 2006, all Norwegian exports were via pipelines to Europe. In 2007, Norway opened its first LNG train and it will be interesting to see where these LNG exports end up.
It can be seen that Germany is by far the largest importer of Norwegian gas, followed by France, Belgium, the UK and Italy. One curiosity in this data is that the Netherlands are shown as a net importer of Norwegian gas. I can but speculate that The Netherlands are importing Norwegian gas to meet export contracts whilst conserving their own gas reserves.
Demand and import patterns
Natural gas consumption within OECD Europe has grown on average at 2.6% per annum since 1980. Back in 1965, Europe consumed less than 25 BCM per annum and this grew to over 470 BCM per annum by 2005, fuelled by North Sea gas. Higher prices and shortage of Russian supply saw consumption fall in 2006.
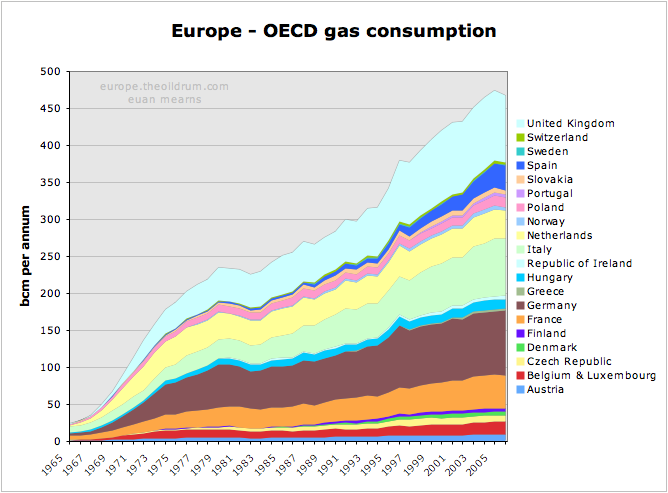
Figure 11 Forty years of gas binge in OECD Europe.
Where next for European Natural gas demand? Will the past trend continue, or will high price curtail demand? This is impossible to answer, but there are a number political, demographic and resource factors consistent with demand continuing to grow unchecked.
- Growing prosperity in former Eastern European states leading to growth in energy consumption.
- Migration from East to West placing greater strain on infrastructure and energy use in the West.
- Migration from Northern to Southern Europe leading to greater prosperity in the latter and ever increasing energy needs - see for example gas consumption data for Spain.
- Climate policies which as a quick fix continues to drive gas power generation forward as a more efficient and CO2 friendly means of generating electricity.
- Pending shortages in oil supplies may lead to substitution by natural gas in automobiles.
If demand for natural gas continues to grow then source of supply and the security of that source is highly relevant. The following section shows the main sources of supply for Europe's main consumers (excluding the UK). One thing all gas import strategies have in common is diversity of supply.
Germany
Germany has some significant and stable indigenous gas production, but is heavily dependent upon The Netherlands, Norway and Russia for pipeline imports. With Dutch gas production in decline, Germany will presumably be looking to increase supplies from elsewhere.
The cornerstone of the German strategy is the Baltic pipeline that will assure supplies of Russian gas direct to Germany that will by-pass former Soviet republics and East European states.
Without LNG, the German strategy seems constrained, since falling UK and Dutch production will place greater demand on Norwegian and Russian gas from several other states.
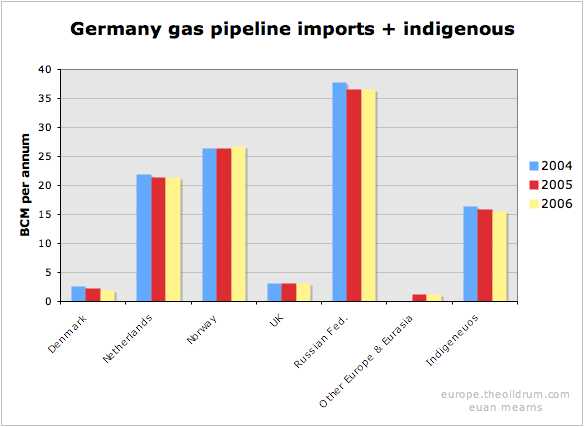
Figure 12 The import sources of gas to Germany.
France
France is unique among major European gas consumers with no indigenous gas production. France produces no oil and only a little coal - hence their reliance upon nuclear energy for power generation.
Like Germany, France relies heavily upon Dutch, Norwegian and Russian gas pipeline imports. France also has a mature LNG import trade with significant imports from north and west Africa.


Figures 13 & 14 The import sources of gas to France.
Italy
Italy has significant but falling indigenous gas production. It also has a highly diversified gas importation infrastructure born in part from its geographic location. Italy imports gas from Norway, The Netherlands and Russia but is also linked to Algeria and more recently Libya by pipeline.
Italy also imports small amounts of LNG, mainly from Algeria. Note how there were significant imports from Nigeria in 2004 - but then nothing. It seems these cargoes may have switched to France in 2005 / 06.
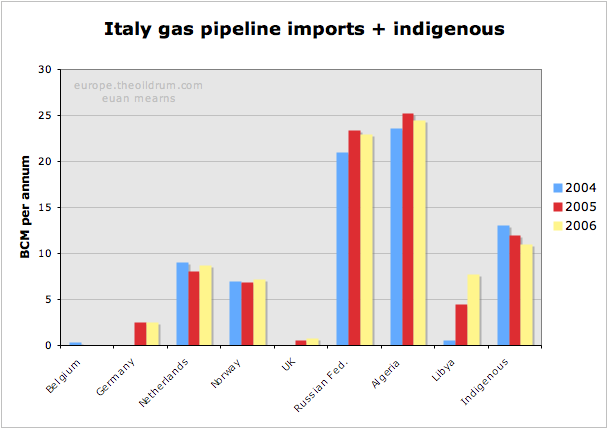

Figures 15 & 16 The import sources of gas to Italy.
Current and future sources of supply
The chart shows that Russia and Algeria are by far the most important sources of imported gas to OECD Europe. This raises the questions of whether or not these countries will be able to maintain or increase future supplies and if not, where will Europe's growing thirst for gas be met in the future?
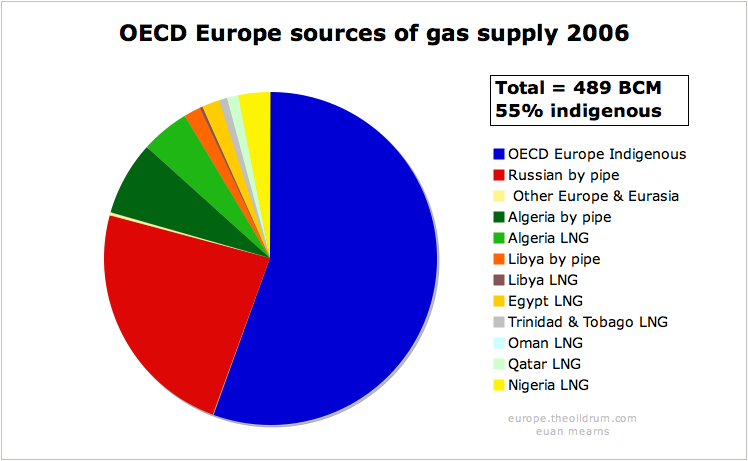
Figure 17 Sources of gas in OECD Europe in 2006.
Russia
Russian gas production had an interim peak in 1991, and with the fall of the Soviet Union went into decline for a number of years. Since 1997, production has begun to rise again and a new high was reached in 2006 of over 600 BCM per annum. The $60K question is where next for Russian gas production? This question is just as important as the future direction of Saudi oil production.

Figure 18 Russian gas production, consumption and exports.

Figure 19 Destinations of Russian gas exports
Russia exports less than one third of its gas production. The majority of exports are to OECD Europe, though a significant amount still goes to former republics. But the amount going to Ukraine, Belarus and Moldova is not documented in the BP statistics, and is presumably included with Russian consumption data. The structure of Russian gas production makes exports vulnerable to any down turn in production and / or increase in domestic consumption. Russian gas exports have been essentially static since 1990, and with the largest fields in decline (see below) it seems unlikely that Russia could at this stage raise production to meet the rising import requirements of OECD Europe.
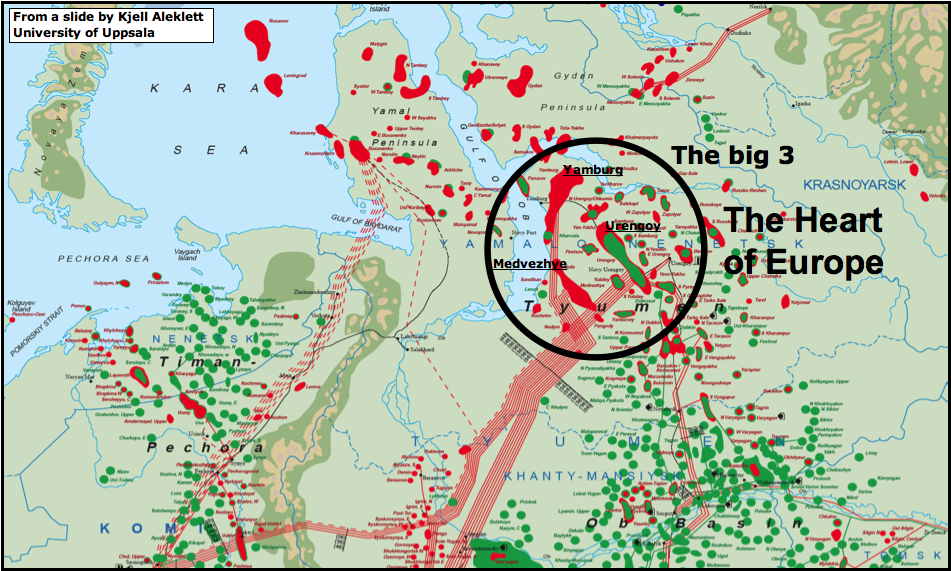
Figure 20 Map showing the west Siberian gas fields of Russia. The three giant fields of Yamburg, Urengoy and Medvezhye have historically provided the bulk of Russia's gas. All three are now in decline (see below). Much of Russia's remaining potential lies in this area, particularly on the Yamal peninsula, to the left of the circle. The map is borrowed from a presentation by Kjell Aleklett.
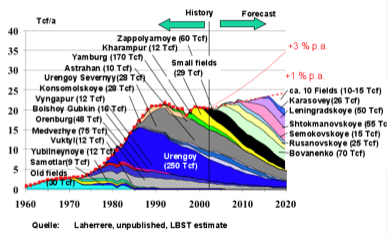
Figure 21 Russian gas production forecast by Jean Laherrere showing how second tier fields may compensate for decline in the three giants - Yamburg, Urengoy and Medvezhye.
Historically, more than 50% of Russian gas production has come from 3 giant fields - Urengoy, Yamburg and Medvezhye. This excellent chart (unpublished) from Laherrere shows that all three of these core producers are in decline. Since Russia has relied upon these three supergiants for core production they now have an inventory of second tier giant fields to develop that may compensate for the decline from The Big 3, as shown on Laherrere's chart.
The challenges for Gazprom are immense. Bovanenko lies on the Yamal peninsula below permafrost. It is at the end of proposed piplelines shown as dashed red lines on the map above. Shtockman lies out of helicopter range in the Barents Sea. Recent reports suggest that the Russians want to use a floating nuclear reactor to power the production platform.

Figure 22 Russian gas production scenarios by Jean Laherrere. WEO forecasts show rising consumption matching rising production with flat exports of around 200 BCM per annum.
This new chart from Laherrere 2007 shows a peak in Russian gas production about 8 years from now with unconstrained production which is unlikely to happen. Instead, constrained production as indicated by the slowly rising WEO 2006 forecast matched by rising consumption will give rise to relatively flat gas exports forward to 2020. So it seems likely that Russia will be able to maintain gas exports but will unlikely be able to increase exports to compensate for falling OECD Europe production.
A critical geo-political question, however, is how these exports are distributed in future? The Sakahlin projects will see East Siberian gas entering the Asian markets for the first time. Furthermore, the Baltic Gas Pipeline will witness a new prioritisation of gas energy security in Germany and western Europe.
The Baltic Gas Pipeline, which is under construction under a joint venture between Gazprom and German companies BASF and E.ON, will deliver 27.5 BCM per annum direct to Germany in the first instance with the option to rise to 55 BCM. All of OECD Europe's gas from Russia currently has to cross The Ukraine and then either Slovakia or Poland in order to reach the main destinations of Germany, Italy and France. As we saw in the winter of 2005 / 6, Russia struggled to meet all commitments given extreme cold weather at home and cut gas supplies to some unfavoured former Soviet enclaves. The spat with Ukraine at that time highlighted how dependent OECD Europe was on the goodwill of the Ukrainians and the Baltic Pipeline circumvents that problem, providing gas security to Germany at least.
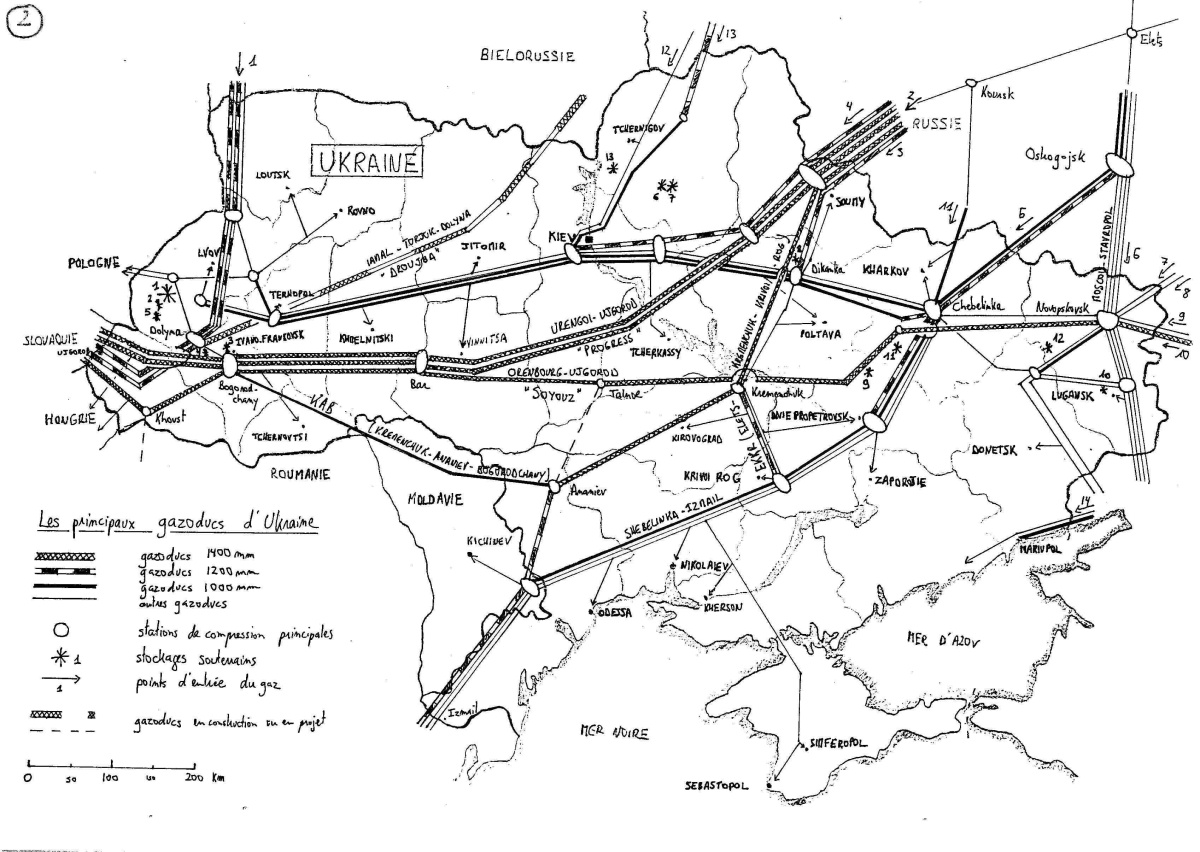
Figure 23 Map of pipelines in Ukraine that carry Russian gas to western Europe via Poland and Slovakia. From Ukraine vs Russia: Tales of pipelines and dependence by Jerome a Paris
The Baltic pipeline will be fed primarly by gas from a new field. The Yuzhno-Russkoye field, which recently started production, is located in the same area as Urengoy, is included in Laherrere's chart and is one of the new fields that will offset decline from The Big 3. This new export capacity, therefore, does not necessarily represent new productive capacity but merely a more secure route for Russian gas into the OECD.
OECD Europe currently receives 115 BCM per annum from Russia, so the Baltic pipeline may eventually secure almost half of those deliveries. However, should OECD Europe face gas shortages, it is those countries at the end of the pipeline that will still be most vulnerable. Some interesting negotiations may lie ahead.
In summary, it is exceedingly difficult to predict how reliable Russian gas exports to OECD Europe will be in future. It seems most likely that Russia will maintain current production levels of 600 BCM per annum until 2020. However, increasing domestic consumption, and exports to East Asia may see gas exports to the west declining. Germany will be in the strongest position to secure supplies. If the remaining supplies are rationed by ability to pay then some of the poorer eastern European states may suffer.
Algeria
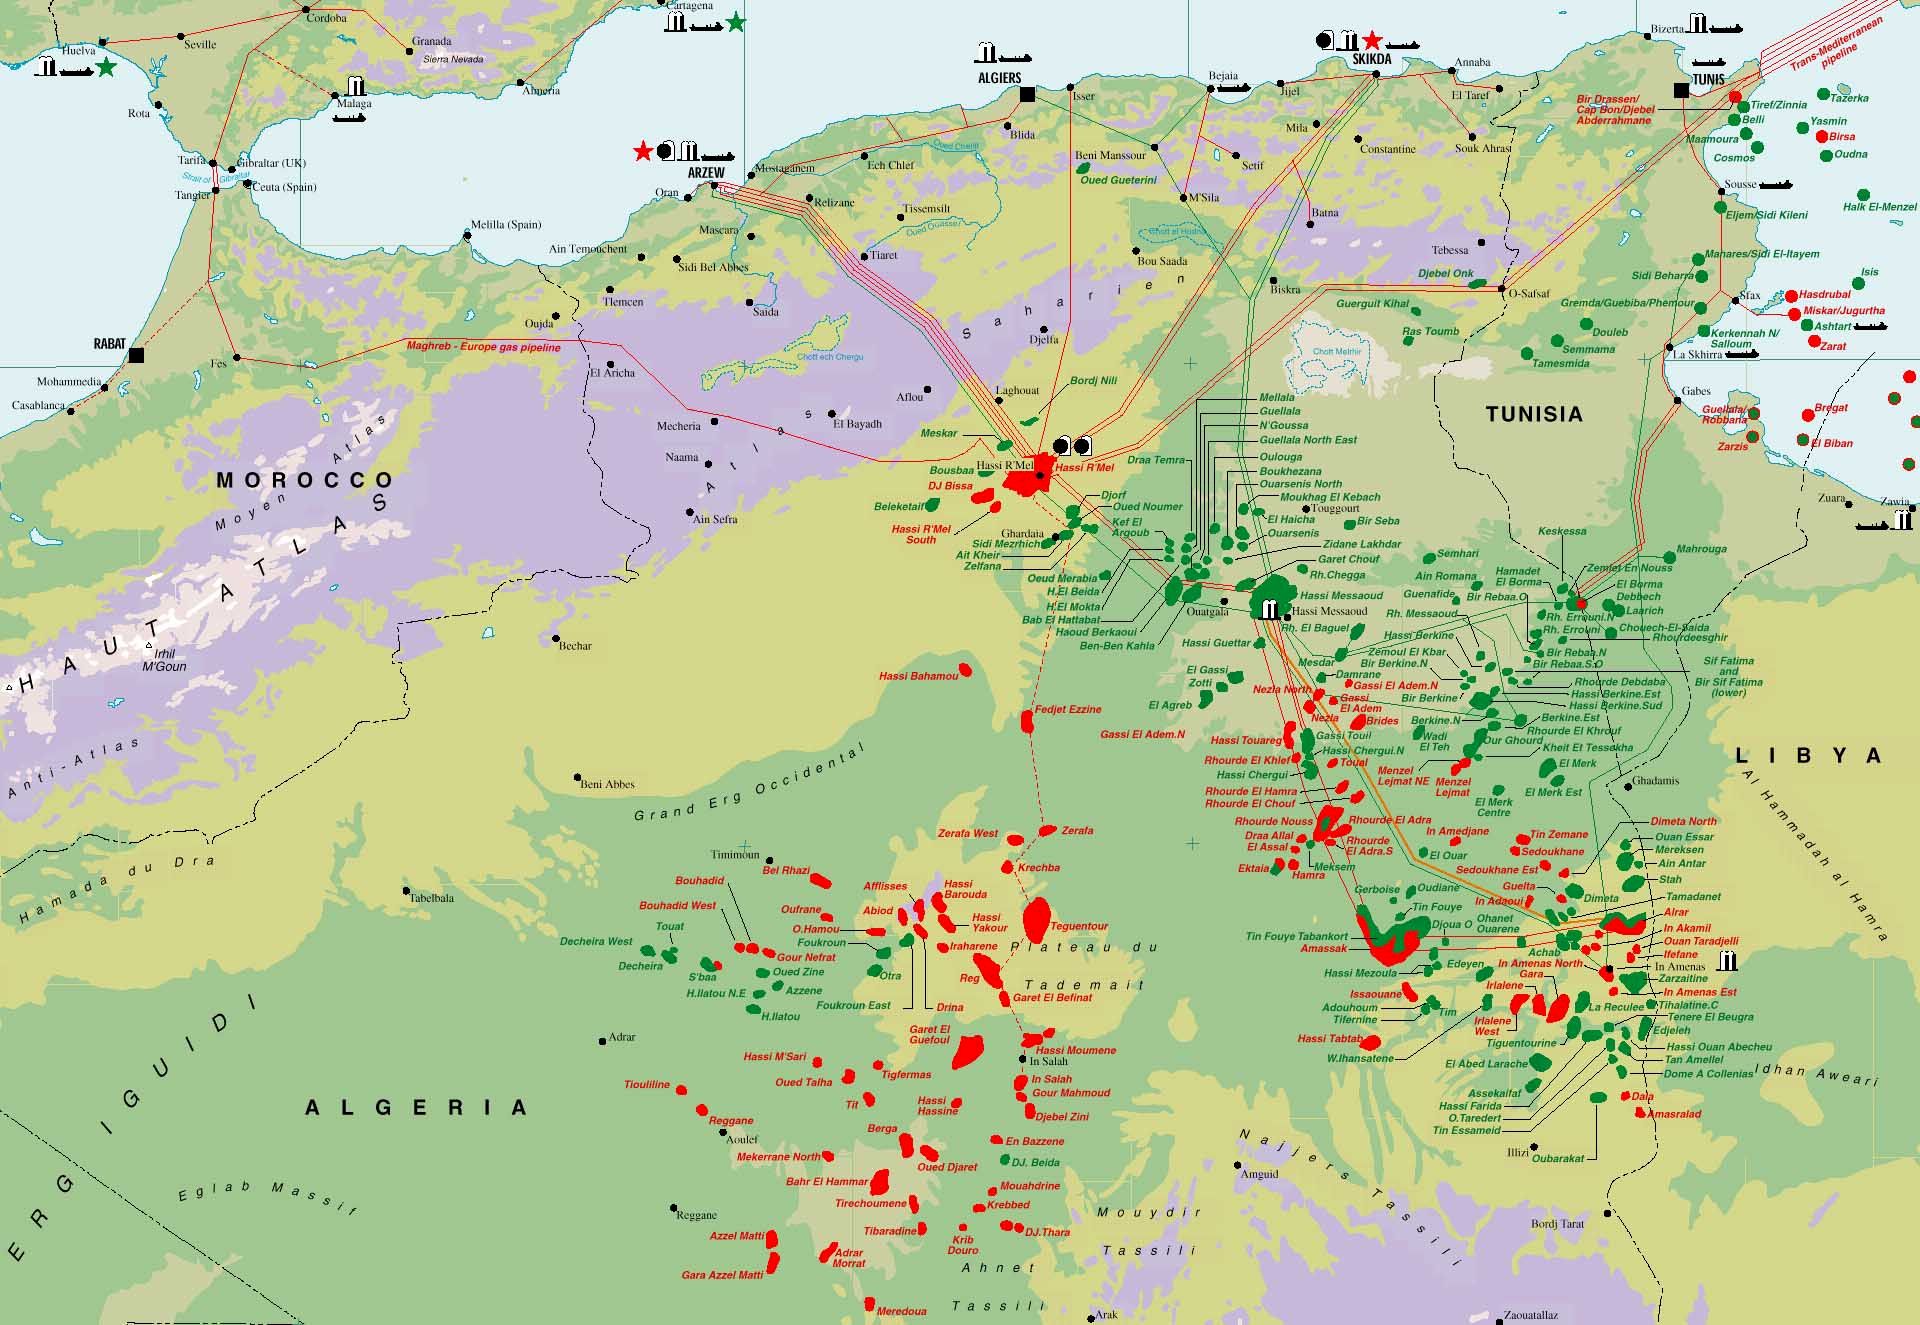
Figure 24 Map of oil and gas infrastructure in Algeria. Europe is fortunate to have gas rich North Africa lying off its southern shores.
According to the BP Statistical Review, Algeria has 4.5 TCM remaining gas reserves placing it number 8 in the world. Accordng to the analysis of Jean Laherrere, Algeria has 4TCM gas reserves remaining, which is in fair agreement with the BP figure. It is fortunate for Europe that Algeria lies close to the southern border of the continent allowing Algerian gas to be piped into Italy and Spain. There is also a significant trade in LNG between Algeria and Europe.
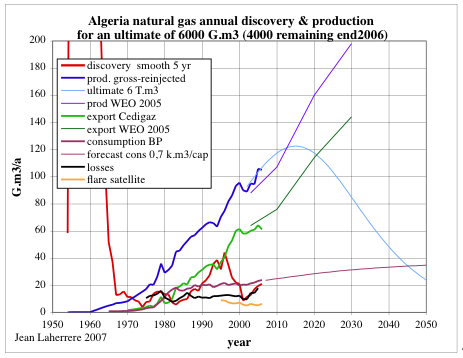
Figure 25 Discovery and production gas models for Algeria by Jean Laherrere.
Laherrere provides a more detailed picture of gas production than can be compiled from the BP data. The main difference is production reported gross of re-injected gas. An unconstrained production peak some 17 BCM per annum higher than today's production is shown around 2015.
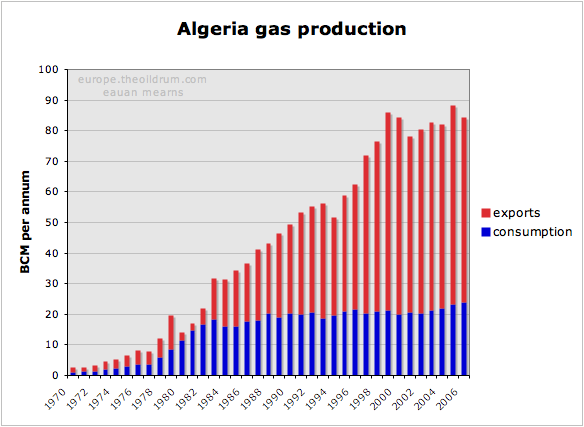
Figure 26 Algeria gas production, consumption and exports. Production and exports have not risen since 1999.
Algerian production grew steadily until 1999 but has since stagnated. There was a new discovery cycle during the 1990s and it is this that may provide impetus for some new production growth. Algerian consumptin is growing slowly and this will consume a portion of new production. New gas export capacity is estimated roughly to be 12 BCM per annum by 2012.
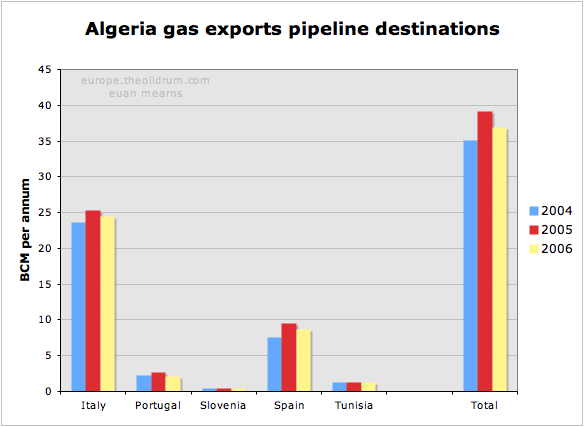
Figure 27 Destinations for Algerian pipeline gas exports.
Algeria exports about 37 BCM per annum by pipeline but is also active in LNG production with LNG exports of 25BCM in 2006. Most of the LNG was exported to Europe (and Turkey) with only small quantities going further afield. Europe is a short trip for an LNG tanker from North Africa, and in terms of tanker utilisation I suspect it will continue to be more profitable to deliver N African LNG to Europe than further afield.
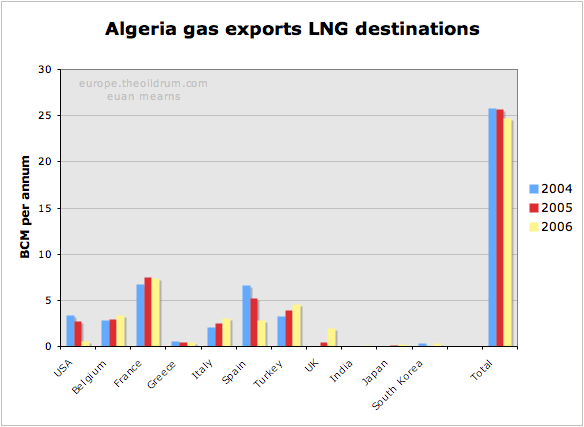
Figure 28 Destinations for Algerian LNG gas exports.
The IEA 2005 energy outlook had this to say:
Algeria is the third-largest exporter of natural gas in the world. Exports are expected to increase as pipeline and LNG projects are brought on line. Gas exports were 64 bcm in 2003 and are expected to climb to 76 bcm in 2010 and reach 144 bcm by 2030.
The IEA target for 2010 looks marginally optimistic and their target for 2030 is a reserves busting feat as indicated on Laherrere's chart (Figure 25).
Libya and Egypt
Both Libya and Egypt have seen rapid expansion of their gas production and exports in recent years. This is set to continue at a slower pace for a number of years according to these forecast models from Jean Laherrere. Growing population and domestic gas consumption in Egypt looks set to outstrip production growth and Egypt may cease to be a gas exporter beyond 2025.

Figure 29 Gas discovery and production models for Libya by Jean Laherrere.

Figure 30 Gas discovery and production models for Egypt by Jean Laherrere. In the export model (Figure 31) I have used the "slow" production model for Egypt.
Combining the three production models of Laherrere from Algeria, Egypt and Libya provides this picture of gas exports from N Africa peaking at around 120 BCM per annum in 2015. That represents a 33 BCM per annum growth from current export levels.
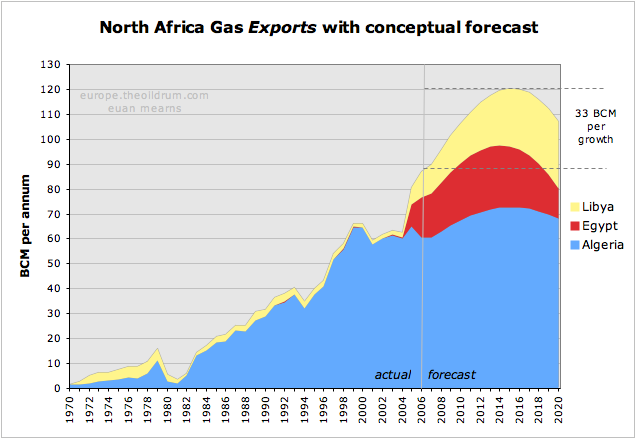
Figure 31 Gas export model for N Africa showing expansion of production and exports in the years ahead but with a conceptual export peak around 2015.
OECD Europe gas security
With OECD Europe indigenous gas production set to decline and good reasons for believing that demand for natural gas will continue to expand in the future, OECD Europe faces the prospect of importing ever larger amounts of gas (LNG) from ever more remote parts of the world. Current imports are running at 197 BCM per annum and the BAU scenario shown below shows imports burgeoning to 442 BCM by 2020. Where will this additional 245 BCM come from?
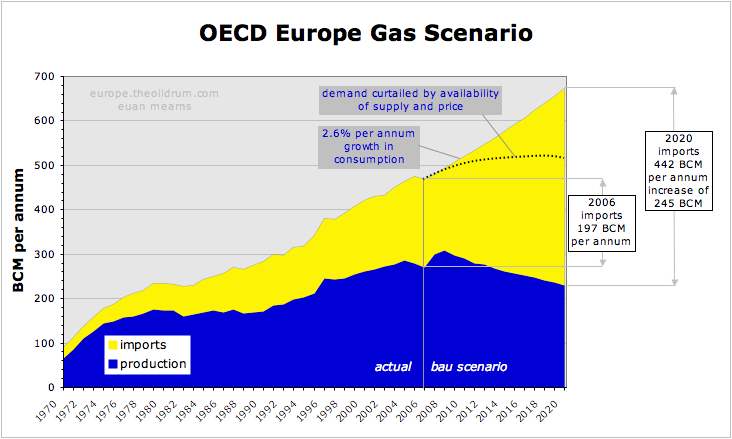
Figure 32 Gas scenarios for OECD Europe summarising the indigenous supply forecasts and demand forecasts from the preceding sections. With the BAU demand scenario, imports will need to grow from current 197 BCM per annum to projected 442 BCM per annum by 2020 - an increase of 245 BCM per annum. It is doubtful that this quantity of gas may be sourced from African and Middle East markets. It is therefore considered more likely that high price and supply shortages will curtail demand for gas. It is conceivable that conservation, more efficient energy use and substitution with alternative sources of electricity may fill the gap left by declining gas supplies.
This is near impossible to answer with certainty. My feeling is that Russia will strive to meet current commitments which will result in their gas exports neither increasing nor decreasing in the 2020 time frame. N Africa will see strong growth in production that will be offset by strong growth in their domestic consumption. Up to 33 BCM of new supply may come from N Africa and it seems reasonable to assume that the majority of that gas will come to Europe. That leaves 212 BCM to source from else where and will inevitably entail a massive expansion of LNG export and import infrastructure beyond that which already exists. In the period 2010 to 2020 Europe will face fierce competition for LNG supplies from the mature markets of Japan, South Korea and Taiwan and growing competition from new markets for LNG in the USA and most likely also in China.
In 2006, the total global LNG trade was 211 BCM and so we are talking about doubling that by 2020 to satisfy OECD European needs alone. The main sources of new supply will be West Africa (Nigeria), Qatar and Iran. Since Qatar has declared a moratorium on new LNG projects forward to 2011 it is a major challenge for these three countries alone to meet global demand growth.
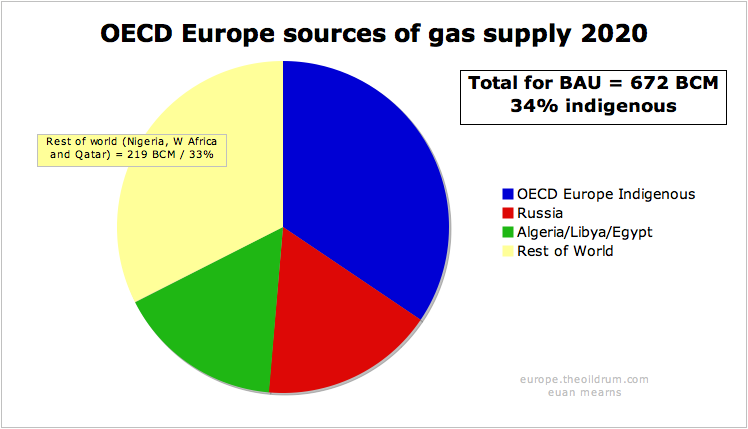
Figures 33 & 34 The changing face of gas security in OECD Europe. With a BAU demand scenario, OECD Europe will face importing ever growing quantities of LNG from remote sources around the globe.
The crux of this whole issue is how growing demand for gas is managed. The UK, and other OECD governments seem intent on allowing market forces to determine the outcome. I would be the first to admit that the dynamics of supply and demand in the European gas trade has so many dimensions that trying to regulate and plan this trade is not simple. But on the other hand, allowing market forces, national economic strength, and price to determine who gets and who doesn't get the available energy may have disasterous and unforeseen outcomes. A scenario where the former Soviet Republics and then the east European states and perhaps Turkey are left in the cold whilst western Europe uses historic strengths to secure itself energy supplies may have unpleasant outcomes flowing from a newly destabilised former Soviet bloc. Energy poverty throughout the poorer parts of Western Europe may also have undesirable consequences for the warm middle and upper classes.
The main message of this post, therefore, is to call upon the politicians of the OECD in Europe to show some rare leadership, and to recognise that massive energy conservation, and expansion of sensible alternative energy schemes, offer a better alternative to the polarisation that is likely to result from allowing market forces to determine the outcome of energy decline.
Acknowledgement I am indebted to Jean Laherrere who upon my request sent his most recent work on gas resources in countries relevant to the European market. Many of the charts come from a paper titled "Etat des reserves de gaz des pays exportateurs vers l’Europe" presented at Club de Nice Energie et geopolitique 29 nov. - 1er dec. 2007.
Contact
- Content: editors at theoildrum dot com
- Tech support: support at theoildrum dot com
License

This work is licensed under a Creative Commons Attribution-Share Alike 3.0 United States License.
This is a phantastic post. But our focus is now on:
Libyan gas supplies to Italy halted amid turmoil
Libyan natural gas supplies to its former colonial overlord Italy were halted on Tuesday amid turmoil in the North African state as Rome braced for an expected wave of migrants from Libyan shores.
http://au.finance.yahoo.com/news/Libyan-gas-supplies-Italy-afp-168485651...
Threat to oil supplies,too:
24/2/2011
Libya exports 7% of crude from Mediterranean and Middle East
http://www.crudeoilpeak.com/?p=2633
Fantastic post and collection.
Especially interesting with the fast depletion of the Dutch fields.
Thanks :-)
And1
Thank you Euan Mearns for your efforts, but does anybody have any up to date charts? It would be fascinating to see them alongside the projections post 2007 as well as getting a better understanding as to where we are now.
Would have liked to update the charts but its actually a big job to compile the country specific distributions from the BP data. I doubt the general picture will have changed much with Italy, Spain, Portugal, France and Turkey the main destinations for North African gas and Algeria is by far the most important exporter.
Should trouble on the scale of Libya spread to Algeria then things will become a whole lot worse. But I think Gaddafi is a rather special case in these N African regimes. I suspect this will become a long drawn out crisis since the underlying problem is population size and structure, social organisation and the cost of food. Regime change may address social structures but it is difficult to see how that may tackle the other structural problems.
A wave of insurgencies will tend towards more redistribution of power and wealth to lower classes.
This is already visible : Saoud has promised billions in social programs, the Somalian leader has promised not to stand for re-election, 'in order to allow for greater participation'. I expect to see more such developments, around the world.
An increase in people power will be beneficial to the people involved. It remains to be seen, wether such a development would be better or worse for those who depend on their fossil fuels.
It remains to be seen, wether anyone manages to muddle through the hard times a'coming without losing his/her decency.
Would have liked to update the charts but its actually a big job to compile the country specific distributions from the BP data
I can hardly imagine--it was certainly worth recycling this post. Do you have any idea how long it took you to compose it originally? Thanks for all the time and effort.
Can't remember, but somewhere between 2 and 4 weeks.
"But I think Gaddafi is a rather special case in these N African regimes." yes and no, in common with Tunisia and Egypt he has been in power for many years (in fact the majority of the mainly young population have only known one leader), his family has acquired great wealth whilst the majority are poor and the succession is another person from his family. Differently Libya is composed of several tribes (as is e.g. Yemen), IMHO this is why the eastern half of the country was faster to split and why some parts of the army (and mercenaries) were prepared to shoot their countrymen.
Where's next, who knows but this could spread outside the Arab world e.g. North Korea fits the same criteria.
Agree, regime change will not change the overall poverty.
The 2020 pie seems off on ROW.
You have 219 bcm or 7.7 Tcf of gas coming from Qatar, West Africa and Nigeria.
There are no pipelines so this would be LNG.
Right now Europe gets about 47.7 bcm or 1.5 Tcf of LNG.
Most LNG goes to Japan, Korea, Taiwan.
I would guess Qatari gas will go to India.
The whole world tanker fleet is ~ 25 mcm of LNG moving ~6 Tcf.
Aren't most LNG tankers are built in Asia?
http://tiny.cc/0nsmx
Best thing would be Barent Sea gas by pipeline to the EU.
Projections based on increases in MENA gas to Europe look optimistic.
Better to put your faith in coal.
Coal has the same volumetric energy density as LNG and is a lot safer to handle.
http://en.wikipedia.org/wiki/Energy_density
I think the point I was making is that gas supplies were unlikely there to meet a bau type growth in gas consumption and so something would have to be done to reduce demand for FF.
I don't know what the answers are. At the moment I'd say too much focus on renewables alone without sufficient focus on large scale electricity storage where pumped hydro is the only show in town. And not enough serious attention on nuclear.
Hate to think what oil and gas will cost in a few years when global liquid fuels have peaked.
http://www.eia.gov/cfapps/ipdbproject/iedindex3.cfm?tid=50&pid=53&aid=1&...
Nov 2010 well above high of 2008
But surely the point is that new FF sources must be found.
I say this realizing that GW is a clear and present danger and that renewables are not going to fill such a huge gap.
This is why I argue for CCS, for North Sea undersea UCG and even for reopening deep coal mines in the UK with 155 million tons of reserves on the books.
http://tiny.cc/7rdr9
Nuclear does make some sense for the UK in the long run but really you need to move your electricity mix of back toward coal which started with the infamous Iron Maiden.
http://www.iea.org/stats/pdf_graphs/GBELEC.pdf
http://www.iea.org/stats/pdf_graphs/GBBSFC.pdf
http://www.iea.org/stats/pdf_graphs/GBTPES.pdf
The downside is you have secure supplies of coal and bury the CO2 in the North Sea gaining an estimated 3 Gb in EOR.
http://www.sciencedaily.com/releases/2010/10/101013193533.htm
If CCS produces more oil that is good, otherwise why should we pay the cost when China uses 3,500 million tonnes a years and we use 50 million.
http://www.instituteforenergyresearch.org/2010/12/02/global-carbon-dioxi...
This cost sends more jobs somewhere else, we already have 4-5 million unemployed, if you count them all.
The EEC want us to close down more coal fired power stations, do the Green lobby think the CO2 stays over China?
This BAU thing?
has any body joined the dots and calculated the minimum growth in consumption(ff consumption) to keep meeting the interests payments of the sovereign debt crisis ?
I simply can not see this "demand" being meet. what points in supply limitations will trigger the various "failure modes" in the economy?
ok that is a massive and somewhat naive question which could just be rephrased as "what is going to happen" but it is essentially the question we have failed to answer...what exactly is the connection between energy and the economy?
the way I see it is an inability to grow=defaults and or financial breakdown and systemic collapse but that is hardly a detailed answer compared to the metrics presented here....
there is a huge jump in fuzziness when we move from the technical models to the real world "meaning"
197 BCM per annum to 442 BCM per annum by 2020
10 years? no way is that going to happen
the end.