| What is “our” oil doing in their economy? — Saudi oil consumption trends | The Oil Drum | Fukushima Open Thread Fri 4/11 |
Tech Talk - the top 30 oil producers, a review
Posted by Heading Out on April 10, 2011 - 1:18pm
These posts have been going through the EIA list of the top oil producers in the world, over the past few weeks, I thought I might just review them collectively, but briefly, before starting to look at individual countries and oilfields. Even the posts that I have written recently have become out of date with new information (Russia increased production again in February by 20 kbd over January reaching 10.23 mbd) and then fell back to 10.2 mbd in March but at this stage, rather than focusing on such details, I am trying to generate a sense of the overall picture. It should also be recognized that I am just grabbing a snapshot of data, rather than the more detailed studies that look at the longer term, which folk such as Rembrandt, Rune and Euan provide. The simplest way to do this is to place my current estimates of production for the top 30 oil producers that I have reviewed in this series against the EIA estimate of their production in 2009.
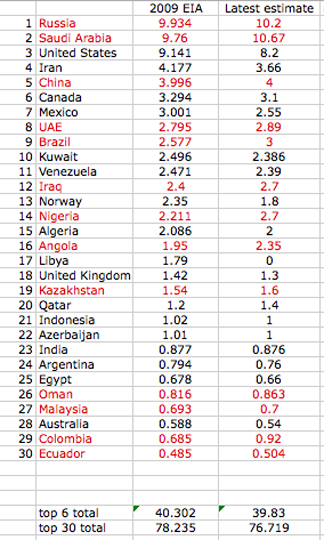
It is significant to note that while Saudi Arabia was producing 8.05 mbd of crude in 2009, this has risen to 8.869 mbd on average for February as the Kingdom increased production to match the shortfalls in oil exports from Libya, inter alia. (With roughly 1.8 mbd in “other liquids” this takes total KSA production to 10.67 mbd and moves it back to the top of the League. However those numbers were from the March MOMR, which reports on February, In that report Libya was still being recorded as producing around 1.3 mbd). It is now reported that overall OPEC was not able to match the Libyan decline in March, falling about 350 kbd short, while KSA production has now reached 9 mbd, (10.8 including other liquids).
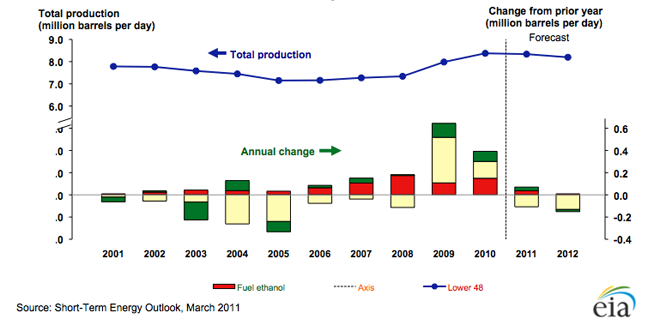
Contrary to President Obama’s recent remarks the EIA are anticipating a decline in US crude oil and liquids production over the next two years, part of which has been blamed on the change in GOM regulations. As a result it would be optimistic to anticipate much more than a US production of 8.3 mbd (and the EIA project it will be down to 8.2 mbd next year). It is unlikely that US production will increase beyond that point.
With China, Iran, and Canada holding relatively steady in the short term, this gives an updated total of 39.83 mbd for the top six, which is about 1.4 mbd higher than when I wrote the initial post back in February, but 500 kbd below the EIA estimate for their 2009 production. (While Russia and the KSA increased, the USA and Iran declined). Of these it is likely that only the KSA can continue to increase production much more.
In the second tier, Mexican production continues to fall, and was down to 2.556 mbd in February, with reports that it will now be an oil importer well before 2020. Exports have already fallen to 1.23 mbd, which does not bode well for customers. The United Arab Emirates (UAE) have, like the KSA, increased production to help out, though so far this has only been up to 2.394 mbd from 2.3 mbd for most of last year. (They also produce roughly another 500 kbd of other liquid fuels). By 2020 they should be able to produce up to 3.5 mbd. And in similar vein Kuwait, now producing at 2.368 mbd, up from 2,3 mbd. Kuwaiti plans are to reach 3.5 mbd by 2015, and be at 4 mbd by 2020.
The current political turmoil has even persuaded Venezuela to increase production, with OPEC reporting levels of 2.39 mbd for February, a gain of around 100 kbd. Though how long that is sustained depends on the success of the many investors that have been persuaded to invest in the Venezuelan oil sands.
In the third group Norway is declining, being now at just over 2 mbd, and even though it has just announced a major new discovery that will not come on line for at least 5 – 10 years, in the meanwhile, production will continue to fall. Norway needs more discoveries similar to this, however, to be able to sustain production levels extending into the future, since without them production will collapse.
Brazil was touted, by President Obama in his remarks about the Energy Blueprint last week, though the increasing volumes of oil that they will produce remain foreign to the United States, and though they will likely increase production up to around 4 mbd by 2020, rising domestic consumption may well take much of that increase.
Which brings us into the states that has some political turmoil. Iraq has been able to bring production back to around 2.64 mbd (according to OPEC) with the hope of reaching 3 mbd by the end of this year. At the moment about 1.2 mbd of this is exported. One of the great questions of the decade is just how close to a projected 10 mbd by 2020 that Iraq will be able to get. Sadly the continuing conflicts there, though reduced in scale, make it difficult for me to see much beyond 5 mbd by 2020.
Nigeria, which has had its own internal conflicts for some time, is going to the polls as I write this, and the expected winner is planning to overhaul the oil industry. However, if stability continues, then it might be possible to resurrect some of the older fields and perhaps increase overall production by some 350 kbd.
Algeria, which has had some turmoil, but may emerge from the ongoing protests without much change, is producing around 2 mbd of liquids. That has not changed as OPEC has moved to match the decline in volumes from Libya and other countries facing protests, and may reflect the current maximum that the country can produce. In the stability stakes I suspect that Algeria may survive without much change, although the plot I put up from Energy Export Databrowser does suggest that production may have peaked.
Angola is currently producing 1.7 mbd but may add some 650 kbd this year, for a total of 2.35 mbd. And that brings us to Libya, where the increased fighting, particularly over the oil refinery town of Ras Lanuf, makes it increasingly unlikely that the 1.7 mbd which came from Libya will be available again soon.
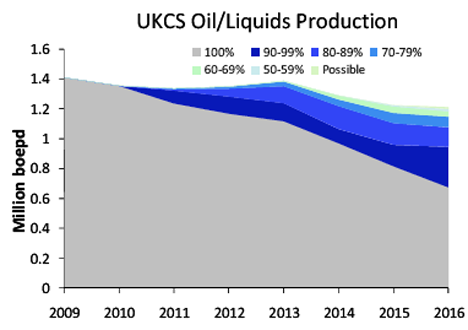
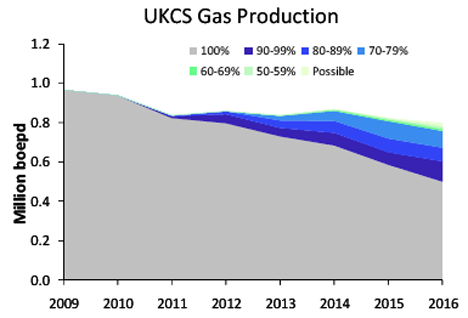
The United Kingdom is in significant decline, but recent moves to further tax the oil industry have made it possible that the decline may steepen. This because the new taxes proposed will likely reduce the profitability of the field developments proposed, discouraging their development. Recently production has run at 1.35 mbd of liquids, which is scheduled to drop to 1.3 mbd this year, and 0.94 mbdoe of natural gas, anticipated to fall to 0.85 mbdoe this year. The criticality of investment is shown in the projected production over the next 5 years, with the different colors showing the likelihood of success. Note that the grey of current production is declining at about 10%.
Moving to the next tier down, Kazakhstan is now at 1.6 mbd and slowly increasing production toward a target of 3 mbd by 2020. Qatar is running at 1.4 mbd, but with almost 0.6 mbd of that in NGL. Indonesia is producing right around 1 mbd and may maintain that in the short term. It is being challenged in rank by Azerbaijan which has just incremented up to 1 mbd, a volume that is expected to continue to rise until it reaches about 1.25 mbd in 2014.
The tier that lies below 1 mbd starts with India, which is currently holding a production of around 878 kbd, and having to import increasing amounts of oil to meet demand. Given that the country also subsidizes the price, this is becoming an increasingly expensive consideration for the government. India is followed by Argentina, which is post peak and declined to 0.76 mbd most recently. Egypt is similarly declining, now to 660 kbd, but as one of the early nations to change under the most recent protests, and with the situation still somewhat fluid, it is difficult to predict how much the country will have both for itself, and for external customers, a year from now.
Oman will likely weather the current storms, and is also increasing oil production, to the point that it is moving up to pass India, with an Omani production of 863 kbd, some of which is tied to NGL production.
In the final four that produce more than 500 kbd Malaysia is barely maintaining production at 700 kbd, while Australia has fallen from 588 kbd to 540 kbd. Both are now being passed in production by Colombia, one of the “hotter” places for development at the moment, with production rising to possibly 920 kbd this year. Ecuador, which closes out the top 30, has recently increased production from 485 to 504 kbd.
That completes the top 30, and accounts for some 76.7 mbd of production. Those same countries back in 2009 were reported by the EIA as producing some 79.23 mbd of oil. Remember that world demand is anticipated to increase by somewhere between 1.4 and 1.6 mbd this year, and that of this list of 30 only 13 increased production, and the rest declined and the concern for the future becomes thus more clearly defined. (The difference between the two totals is partially explained by the loss in Libyan oil - we will see within the month how well OPEC covers that).
But it is not the overall production from the world that can be estimated that accurately, but by looking at individual countries and, in some cases, individual oilfields that we can get some better sense of what is to come. So the next step will be looking at these nations in more detail, in the weeks ahead.
Contact
- Content: editors at theoildrum dot com
- Tech support: support at theoildrum dot com
License

This work is licensed under a Creative Commons Attribution-Share Alike 3.0 United States License.
I always have problems with this "hedging of bets" approach to estimating future oil production. TPTB decided to use adjectives like probable and possible in addition to proven to generate a huge spread in outcomes, and thus minimize the risk they are proven wrong.
In some of the graphs for UK above we see percentages indicating the possibilities of outcomes. In modeling, I can guarantee that you always have a "most likely" outcome no matter how you slice it. The "less likely" outcomes are the outcomes on either side of this value.
To put it in to a different context, there will be a 100% chance that we will have at least 0" of rain where I live today. The other possibilities fall off from this but it is virtually useless for most people to reason with. So weathermen will give the "most likely" amount of rain for today and if you wanted more info you can get a variance out of this or ask for how skewed or asymmetric the prediction is on either side of the most likely value. You can argue about their predictions, but at least the weather forecasters have a spine and place some confidence behind their model.
So I don't understand why the reluctance to just give the most likely outcome and then give error bands around this prediction. This is not the rule of course. For example, Westexas will show his projected curves with the most likely outcome and error bars around it. Yet invariably, the bureaucrats and heavily invested oil types always seem to cloak their estimates to best obscure their eventual accountability. And that is precisely the rationale: no one in a position of power wants to be held accountable in case they are wrong.
So the challenge to someone is to generate the "most likely" outcome from the UK Continental Shelf (UKCS) data shown in the figures above. IMO, this separates the hope from best estimate of reality. YMMV.
Just a minor clarification. It's Sam Foucher's modeling, e.g., actual production, consumption and net export data for the (2005) top five net oil exporters through 2006, along with Sam's post-2006 projections are shown below (dashed lines are Sam's calculated 95% confidence intervals). Alternatively, the dashed lines could be viewed as low case and high case, with the solid line being the middle case. Actual 2007, 2008 and 2009 data points are shown with circles.
http://i1095.photobucket.com/albums/i475/westexas/Slide1-3.jpg
OMG! Something tells me you could extrapolate the human population onto that one as well....
When do you think the point of capitulation for those in denial will be? My guess no later than 2013, yeah I know 12-12-12 but there must be a psychological tipping point.
It's an interesting question. Of course, I frequently use the "Sixth Sense" analogy, i.e., for most of us our auto centric suburban way of life is dead, but most of us don't know it yet, and we only see what we want to see. But for anyone willing to see, the numbers are there, especially the decline in "Available Net Oil Exports," i.e., Global Net Exports not consumed by Chindia. Here are recent numbers for Available Net Exports:
http://i1095.photobucket.com/albums/i475/westexas/Slide3-1.jpg
2005: 40.8 mbpd
2006: 40.5
2007: 39.1
2008: 38.6
2009: 35.5
I suspect that Available Net Exports will be down to 27 to 30 mbpd by 2015.
The trend is clear from your data. Like you say it is there if you care to look. The emotional stair step descent - Several of my customers are referring to the current (lower)level of economic activity as the 'new normal'. I have heard this term on the rise as well. I expect another, lower level, of the 'new normal' soon.
I have heard many frightening stories from my 'good' customers. Good meaning prudent, many years in business, didn't over expand, etc.. They are seeing a sharp drop in sales in the last 6 months. They were cautious and only brought in what they sold the year before and it isn't moving. This current drop has me the most concerned because I see no reason for economic improvement and all have become very vocal about 'supposed economic recovery' they hear about constantly on the MSM with sharp disbelief in their voices.
"Knowing" they are being lied to is probably the first step in shedding the denial. I suspect a full blown crisis/panic of some sort is coming as collective denial disappears.
BTW, I'm working on an article on "ELM, The Prequel," which looks at Net Export Math both on the upslope and downslope. Based on the ELM, the rate of increase in net exports tends to exceed the rate of increase in production on the upslope, but then on the production downslope, the rate of decline in net exports tends to exceed the rate of decline in production.
Looking at the (2005) top 33 net oil exporters, the 2002 to 2005 rate of increase in production was 4.5%/year, but net exports increased at 5.1%./year. The Available Net Export (ANE) trend is also interesting. Here are 2002, 2005 and 2008 numbers for ANE (Global Net Exports not consumed by Chindia):
2002: 34.8 mbpd
2005: 40.8
2008: 38.6
ANE increased at 5.3%/year from 2002 to 2005, but then fell at 1.8%/year from 2005 to 2008. Of course, we saw six straight years of year over year increases in annual oil prices from 2002 to 2008. If ANE had kept increasing at the 2002 to 2005 rate, then in 2008, ANE would have been 47.8 mbpd. IMO, this provides pretty strong evidence that the Available Net Export shock to the system was a key trigger for the financial meltdown in the US.
I would tend to agree on the trigger aspect. The unsustainable debt was/is a teetering house of cards. I think oil prices will continue to help push it over, oil has a physical reality that cannot be increased through fractional reserve lending. Whether or not we have debt deflation or hyperinflation oil will be more expensive. You have of course figured it out already - ELP, 'move to the non discretionary side of the economy'. Our economy based on selling items we don't make to people who have to borrow to buy them is basically over with. The economy scares me, there are so many non essential occupations. Even 'good' jobs like plumbers, electricians, carpenters need growth to maintain full employment, there isn't going to be the economic activity like we had in the past.
It is interesting to look forward, so few do, or want to if the news isn't good. I'm trying to put a happy face on it. I enjoy the reduced air traffic over my house, the noise irritates me. My wife however rushes out to watch planes.....we are married go figure.
Do you just get used to the idea of using such huge volumes like 'mbpd'? A million barrels per day, that's just an amazing number. The equipment needed to handle such volumes- daily??
I can 'visualize' my water well output at 22 gpm that is a little over 4 - 5 gallon buckets.
Regarding volumes, I think that one of the best ways to describe global production is that just in George Bush's first four year term, the world consumed about 10% of all the crude oil that had ever been consumed, through 2008.
The way that HL works, every plateau that extends peak by about 4 years will increase the "apparent" URR by 10%
If the URR is actually fixed, then the eventual decline will turn out more severe.
But isn't that what it should do? - referring to your first line. URR 'could' be fixed until technology find's a way to get the harder stuff and then the numbers can and must change. That URR will ultimately become a hard and fast number, while ultimately true, will happen sometime in the future when we have the benefit of 20/20 hindsight.
I don't mean to sound argumentative but rather in agreement.
I think your last sentence is the one that should concern everyone. When we reach that vague point where the ramifications of depletion, the limits of technology, the lack of financial ability, or some other factor acts to set URR firmly, then I would tend to agree the down slope will be faster.
I fear that my young adult children will see the most severe changes.
I think the URR should then include a different "grade" of oil, such as found in tar sands, and then identify this as URR'=URRts. Scare quotes on "grade" because it may be the same grade but it takes more resources to extract, something never contemplated in the original analysis. Otherwise the modeling will always be in terms of Trust Me Technology Will Save Us.
Quite correct on separating tar sands, maybe others, hardly crude oil imho either.
I think westexas is trying to impress upon another subtle point. its addressing the notion that technology or new oil discoveries or whatever will save us from the ultimate peak (for long). Its just that to sustain the current growth trajectory the burden of finding 'new' oil (either through discovery or better extraction) will be progressively bigger. Another way of looking at that is every new find will extend BAU for smaller periods of time before the impending decline. Kinda like looking at the stock price in logarithmic scale instead of linear scale.
This will be held true until the economy finds another way to grow besides oil (energy source) then that 'thing' will become the 'limit to growth'. A sign of that shift happening would be when oil prices jump above $200 or $250 or whatever but the economic growth projections won't falter. so far I don't see it.
Should read, ". . . the world consumed about 10% of all the crude oil that had ever been consumed, through 2004."
Web – I’m not sure if this adds clarity but this is how the terms translate to me as well to the rest of the oil patch. But there may be a complete disconnect between our view and the reporting agencies/NOC’s.
Proves reserves: this volume is never attained. Not once in many hundreds of reservoir studies over the last 36 years have I seen this happen. Maybe close…within 5-10% or so. Worse case examples I’ve “proven” reserve estimates miss by 80-90%. I’ve also seen more than on dry hole drilled into mapped “proven” reserves.
Probable reserves: just a very rough guess but I would say on average only 30-50% is ever realized. I’ve seen more dry holes drilled into “probable” reserves than I can remember.
Possible reserves: Very rarely have I seen such reserves actually found let alone produced. To be generous maybe 10% show up. Often these “possible” reserves are never drilled because a company would rather keep them in this category than drill and prove they don’t exist. Makes the books look better. I have had dozens of dilling proposals rejected for just such a stated reason.
I've suspected this to be. Thanks for confirming.
And yet, this complaint somehow calls to mind Schrödinger's cat, because I find myself in a superposition state of understanding it and not understanding it.
For the simple case of radiative and fluid dynamics, i.e. weather, it seems that no matter how much decorative numerology the intellectual descendants of Old Probabilities, spectators all at their computer screens, might indulge in, they only give "probability" for tomorrow's rainfall. They commit themselves to nothing at all; there's no "accountability"; they cannot be shown to be "wrong", nor for that matter can they be shown to be "right". Tomorrow's rainfall will measure on the gauge as a definite number subject to the accuracy of the gauge. It will never, ever manifest itself as a "probability" "distribution", so today's "forecast" of tomorrow's "probability" can never, ever be proved right or wrong, or otherwise tested. That is, tomorrow's rainfall "cat" will turn out either "dead" or "alive" - never a superposition state of both. It will never even 'exist on the same plane' as the "forecast".
And even should a "longer run" after-the-fact aggregation of those "probability" "distributions" subjectively seem way off, they can always blame it on El Niño, or on the Atlantic Oscillation, or maybe even on too many wicked people driving automobiles or otherwise having the gall to live out their lives. Thus it happens that when we start digging, we can readily find at least five or six different vague weather "forecasts" for the same locality, based on different "models" yielding different "probability" "distributions". Since they all differ, only one can be "right"; in reality none will be "right"; not one will be a distribution for the probability of any event, such as tomorrow's rainfall, occurring in the real world (it may or may not be connected to bits inside the computer, and that's all); and not one will have more than a little connection to any coherent mathematical concept of probability linked to any real-world physical event, which is why I insist on all the scare-quotes.
The key post is (appropriately) studded with the word, "political". "Political", unlike "weather" cannot usefully and simply be described by a simple coupled set of partial differential equations, or by any known equations at all. So I'm not really sure how fancy numerological lipstick [e.g. "error bars" (error relative to what, and testable how?), or "entropy" (of what item, of what relevance, and measured how?), or whatever] could possibly hide the fact that it's still a political pig - or at least it's political enough to make any error bars even more useless than they so often are with the far simpler and yet somehow fruitless task of giving a verdict on tomorrow's picnic in time for the guests to forego useless travel. And thus I'm not really sure what more I would ask for, or what more you're asking for.
The main realization that comes out of weather forecasts is that even though they are never precisely accurate, enough come out on both the high side and the low side to effectively balance out. Bayes rule has a lot to do with this of course, since the forecasts are continuously updated with recent knowledge and the average, i.e. the most likely, seems to work out well.
Yet, that doesn't seem to be the case with the oil projections. They try their hardest to make sure that no one can get a most likely forecast that will balance out the possible high-balled and low-balled predictions. Read what Rockman wrote and you get the idea that it is a lot about instilling hope.
Yup, Rock is probably right about that.
However, the deal with weather forecasts is that for the phrase "enough come out on both the high side and the low side to effectively balance out" to make any sense at all, its subject must be a substantial collection of weather forecasts for (one hopes) different times and places. But we only have one world and one timeline as the possible subject for oil forecasts, so a phrase like that is simply inapplicable. Of course, in an alternate reality where we had a large ensemble of other earths upon which to apply and test our chosen oil forecasting methodology, it would be a different story.
So it still seems that asking for probabilistic error bars would be asking for something devoid of any conceivable operational or other meaning. With a sample of one, there's no possibility to test or validate them, for the same reason there's no way ever to test the probabilistic weasel-wording of the "forecast" for the time and place of tomorrow's picnic. Neither can ever be made wrong (or right), so anything goes. And that seems to imply there's no way (in either case) to obtain the "accountability" you were seeking.
[I suppose we could delve into "hindcasting" a set of short oil-market time frames as a workaround, but, to continue with the weather analogy, methodologies that hindcast nicely but are virtually useless ("have no skill") for forecasting are well-known (such as the April hurricane-season forecasts.) So it would likely be a bootless exercise, though no one could ever say for sure one way or the other.]
Not true. There are enough reservoirs collected over time for us to do a good job. This is all a set up for the analysis I did in The Oil Conundrum.com. There is absolutely no doubt that a comprehensive Bayesian analysis of past data will give us a most likely outcome, and I skewer the provable, probable, and possible babble at the same time.
That whole thing about only having one earth to experiment with has some truth to it but it is still just an excuse by the week-kneed to not do the analysis. I classify it as a failure of the imagination.
The USA produced 9.141 million barrels per day in 2009? Of what? According the same EIA source there was 5.36 mbd of US crude oil production in 2009.
Since I have not heard much about US tar sands production and shale oil is theoretical, this leaves ethanol and various gas condensates. This is *not* oil aka petroleum and putting it on the same list with Russia and Saudi Arabia is pure political BS.
Agreed!
If you go to the EIA Table on the US Daily supply you can see that, for example in January, the crude produced was 5.483 mbd; the NGLs etc were 2.022 mbd, which gives 7.504 mbd, and then there are 957 kbd of renewables and the rest is, I think made up with "refinery gains." There is a simpler table in the EIA pantheon somewhere, but I just don't know where I last saw it.
HO,
Maybe I'm reading your table of the top 30 oil producers wrong, but it seems that Qatar should also be in red.
Please help me understand how United States can be close to 1970 levels.
Here is a detailed data table showing 60 years of US petroleum only data (no biofuels apparently, although there is an "adjustments" column that mentions biofuels, I think mainly for products supplied purposes), from 1949 to 2009:
http://www.eia.doe.gov/emeu/aer/pdf/pages/sec5_5.pdf
I think the numbers are for total liquid fuels produced instead of just conventional crude+condensate.
That's still seems like a lot of non-crude liquid. I wonder if they are including the oil equivalent for NG production?
No but they are counting NGL's (see above).
Thanks HO...makes sense as long as we can distinguish between "oil" and "liquids". English is a precise language. LOL
According to the EIA, US crude oil production in 2009 averaged 5.361 million barrels per day.
I don't see how they got to 9.141 million barrels per day even if they added lease condensate, NGLs, and ethanol to the crude oil volumes. It's basically overstating the true volumes by 70%. It must be a real apples plus oranges plus passionfruit plus kumquats calculation.
Canadian production for 2009 is higher than it should be, too, but not to the same extent.
I hope that a new standard at TOD would mandate everyone to immediately do a conversion of all the oil statistics to balancing them out for energy intensity(or efficiency, whatever word you want to use), because piling NGL's or biofuels on top of crude oil without any adjustment is simply a fraud. It's like comparing the wages of the year 2000 and 2010 without taking inflation into account.
Yet, somehow, it's standard procedure when it's done on these issues, to our detriment.
Rune Likvern did balanace these sources of energy in a post of his not too long ago:
(NGL's to the rescue?)
In this graph he adjusted NGL's and ethanol, since they about 60-70 % of what he calls 'volumetric energy'(or heat energy) of cruide oil.
(And here is his adapted graph.)
If you look at the image, it's hard not to see how little difference they make, if any at all.
How about converting to Hummer miles? :)
Sorry, I'm getting a little silly. This feels similar to that laugh you get when your house is flooded and there is nothing to do, then someone cracks a joke.
The daily quantity of US Oil Production is an amount that I was once certain had peaked at roughly 10 mbd in the early 1970's and had now fallen to less than 6 mbd (if not below 5 mbd). See the EIA numbers in the top row at the following link:
http://www.eia.doe.gov/dnav/pet/pet_crd_crpdn_adc_mbblpd_a.htm
But in recent months I've been seeing numbers for US oil production over 9 mbd! - such as in the EIA table at the beginning of this article (US production for 2009). This is essentially 90% of the US daily output at its all time peak. Therefore, suggesting that no big decline has occurred in US oil production over the past 40 years (less than a 10% decline anyway)!
I do realize that definitions of what constitutes "oil production" can vary, and also that US production has increased slightly over the last few years. But can these account for an apparent 50% increase in US oil production (from 6 mbd to 9 mbd)?
j - There is no confusion in the oil patch nor the various state reporting agences as well as the feds. The regulatory agencies are the only source for production data for the EIA. "Oil" is crude oil...not NGL nor refinery gains. The EIA is free to confuse the issue as much as they want.
I found an EIA link which shows "both" US Oil Production totals for 2009 on the same page (after the webpage opens, click to expand the first bullet item for PETROLEUM):
http://www.eia.doe.gov/countries/country-data.cfm?fips=US
One is labeled as U.S. CRUDE OIL PRODUCTION at 5.36 Mbbl/day, and the other is labeled as U.S. TOTAL OIL PRODUCTION at 9.14 Mbbl/day (an exact match with the table at the top of this TOD article) with all numbers given for 2009.
So this implies that in 2009 the U.S. produced 3.78 Mbbl/day of NGL's + REFINERY GAINS?? That seems like a relatively massive amount (more than the total national oil production for all but a handful of countries)...?
I have read that the EIA generally includes "LEASE CONDENSATES" in their totals for "Crude Oil", but not NGL's. Perhaps the 9.14 Mbbl/day also includes "bio-fuels" such as corn-derived ethanol, vegetable oil-based bio-diesel, etc? - even though ethanol is not oil-based in any sense AFAIK.
Thanks to ROCKMAN and 'Pitt the Elder' for your replies!
On the EIA site linked, it clearly states that to get to the 9.14 figure includes....
"Production of crude oil (including lease condensate), natural gas plant liquids, and other liquids, and refinery processing gain"
If "and other liquids" includes ethanol,biofuels etc, and "refinery gains" includes those refineries using imported crude, then there is a lot of double counting going on. In other words clear smoke and mirror accounting.
Plus an 8.3% increase on crude production in one year. Something strange is going on.
Are you sure your table is comparing comparable numbers?
For the US, the table shows 9.1Mb/d for 2009 and 8.2Mb/d for the estimate, but the graph (and its EIA dataset) shows 8.0Mb/d for 2009 and 8.2-8.4Mb/d for 2010-2012.
One's saying production dropped by 10%, the other's saying it rose; those aren't consistent with each other, so one of them's got to be a mistake. Since the graph has a single data set directly attached to it and the table does not, it's highly likely that the graph is correct, and that US liquid fuel production has not dropped by 10% in the last two years.
That's not to say your basic point is or is not wrong; I'm just interested in tightening up the supporting argument.
Why isn't the US raising its third world level gas tax ?
Too passionate about committing total economic suicide ? Or what ?
fig 1: American passion for total economic suicide, exhibit A
The federal gas tax isn't being raised because after the US "won" the Cold War, it no longer had to respond to external threats, and the country's essential worldview (sole superpower, endless cheap oil, taxes always too high, X-tian nation, etc.) froze because there was nothing that could forced it to respond changing reality. It's groupthink on a continent-wide scale. And I'm afraid we're going to be stuck in our rut until something catastrophic happens and the country is forced to respond to reality again. The September 11 attacks could have been used to force some positive changes. Instead, Bush told us that everything would be okay if we just went shopping. And we did, and nothing fundamental changed.
Now, obviously there are many individuals who understand reality has changed since 1987, and who have responses both good and bad to current conditions. But the country as a whole is stuck. A good example of this is how the phrase "foreign oil" always enters the discussion about oil and energy policy. The reality is that the country needs to reduce it's consumption of oil, period, with no qualifications. But politicians keep using the phrase "foreign oil" because they know that the country can't handle being told the truth.
Because (US) politicians lead by opinion poll.
Rgds
WeekendPeak
Point taken. But the FORD truck example is slightly unfair, by not mentioning that this was only a "concept" (non-production) truck shown by FORD back in 2006 (pre $4+ gasoline days). And if it had gone into production, the engine design was actually rather interesting: a V-10 engine with the ability to run your choice of 3 different fuels: gasoline, E85 or Hydrogen!
http://trucks.about.com/od/fordconceptvehicles/ig/Ford-Super-Chief-Conce...
http://trucks.about.com/od/fordconceptvehicles/ig/Ford-Super-Chief-Conce...
"by not mentioning that this was only a "concept" (non-production) truck shown by FORD back in 2006 (pre $4+ gasoline days). "
But apparently it is still (ok two years ago) being considered for 2013 :
http://www.gadgetking.com/2010/03/01/2013-ford-f250-super-chief-tri-flex...
http://ashleyfordsales.com/_blog/Ashley_Ford_Blog/post/2013_Ford_F-250_Pickup_-_WOW!/
As to hydrogen, amazing that this thing is still being discussed ...
Hi, you have forgotten to give Qatar a red color on the first figure. Good article.