NGL to the Rescue, Revisited (Part 1/2)
Posted by Rune Likvern on January 28, 2011 - 10:59am
DISCLAIMER: The author holds no positions in the oil/energy market that may be affected by the content of this post.
This is the first of two posts where I present a closer look at NGLs. In this first post I will present a closer look at volumetric energy (heat) content for some hydrocarbons in liquid state and the wetness factor for natural gas. Later I will present a closer look at the conditions that need to be met to make the IEA’s NGL projections happen. In the posts I have adhered to the IEA’s definition of NGLs as far as the actual data has allowed.
The International Energy Agency (IEA) projects in its World Energy Outlook for 2010 (WEO 2010) New Policies scenario (NP) that the Natural Gas Liquids (NGLs) portion of total world volumetric liquid energy supplies will grow from 13% in 2009 to 19% in 2035.
The WEO 2010 forecasts that more than 50% of the growth in world volumetric liquid energy supplies will come from NGLs. More than 90% of the growth in NGLs is forecast to come from OPEC.
- NGLs have around 60 - 70% of the volumetric energy (heat) content of crude oil.
The above fact seems to get lost in debates about liquid energy supplies.
- The wetness factor of natural gas needs to develop according to expectations derived from the IEA WEO 2010.
- Growth in world production of natural gas needs to closely match the forecast.
IEA WEO 2010 definition of natural gas liquids:
Natural gas liquids (NGLs) are the liquid or liquefied hydrocarbons produced in the manufacture, purification, and stabilization of natural gas. These are the portions of natural gas which are recovered as liquids in separators, field facilities, or gas processing plants. NGLs include but are not limited to ethane, propane, butane, pentane, natural gasoline, and condensates.
About two years ago I posted IEA WEO 2008 - NGLs to the Rescue which challenged the IEA’s forecast on future NGL production.
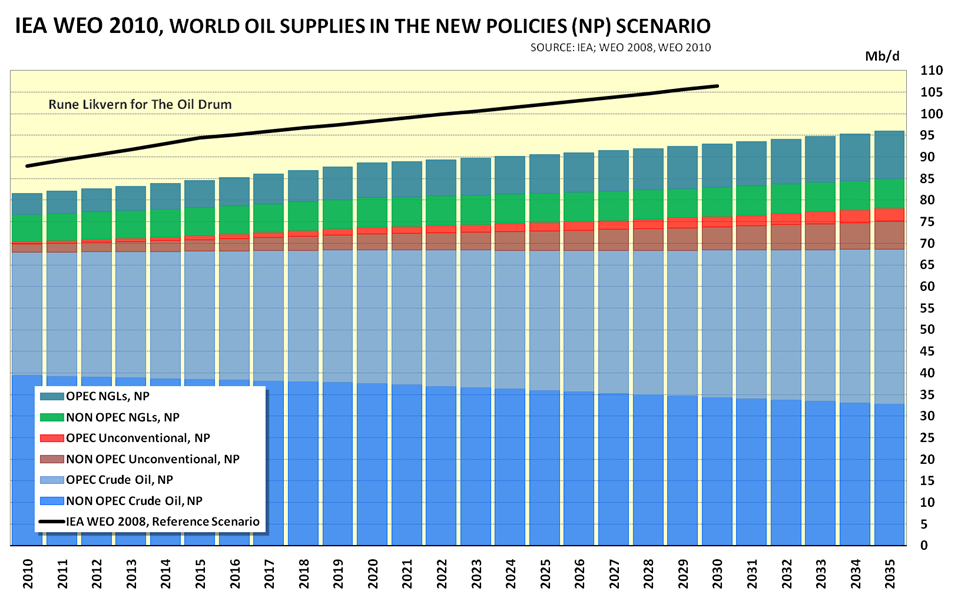
Relative to the IEA WEOs from some years back, the IEA has revised down future demand for liquid energy. The diagram above also shows the forecast from the Reference Scenario (RF) in the IEA WEO 2008.
The forecast from the IEA also acknowledges a future decline in non-OPEC crude oil supplies and globally a flat supply of crude oil towards 2035 and a strong growth in unconventional oil supplies.
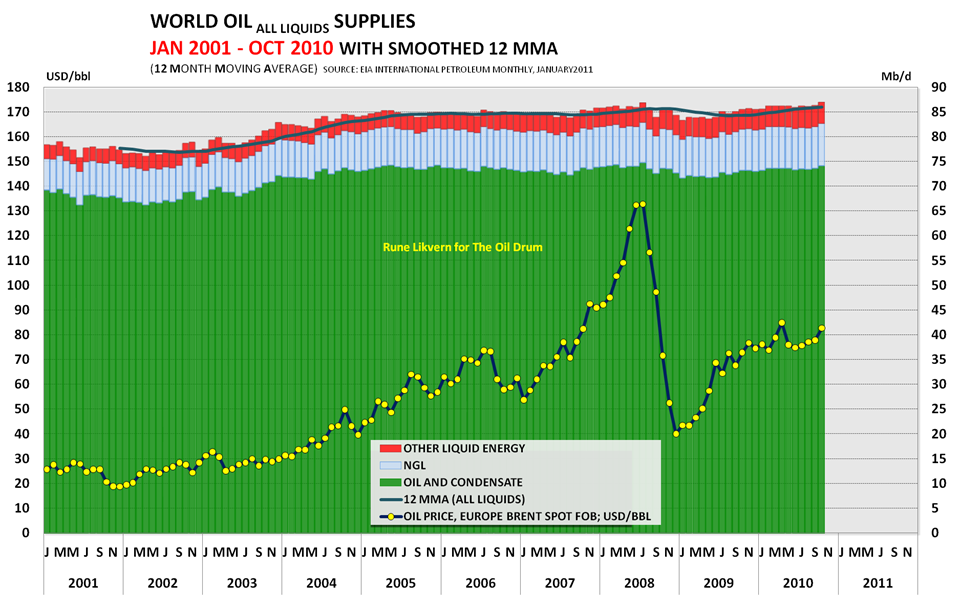
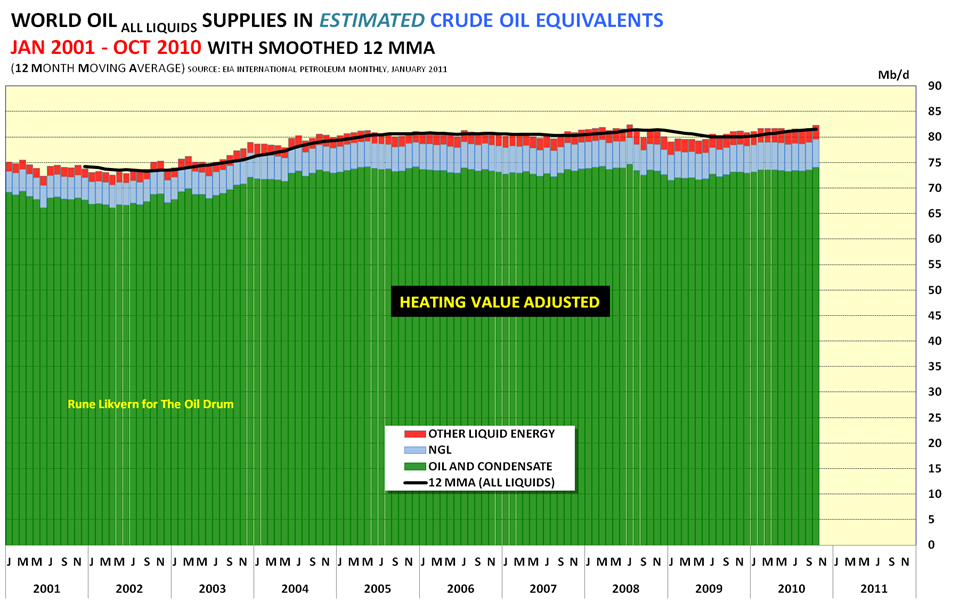
The graph above shows the world’s supplies of liquid energy as reported by the EIA. Figure 6 shows how these supplies would appear as NGLs and other liquid energy supplies converted to crude oil equivalents, i.e. heating value adjusted.
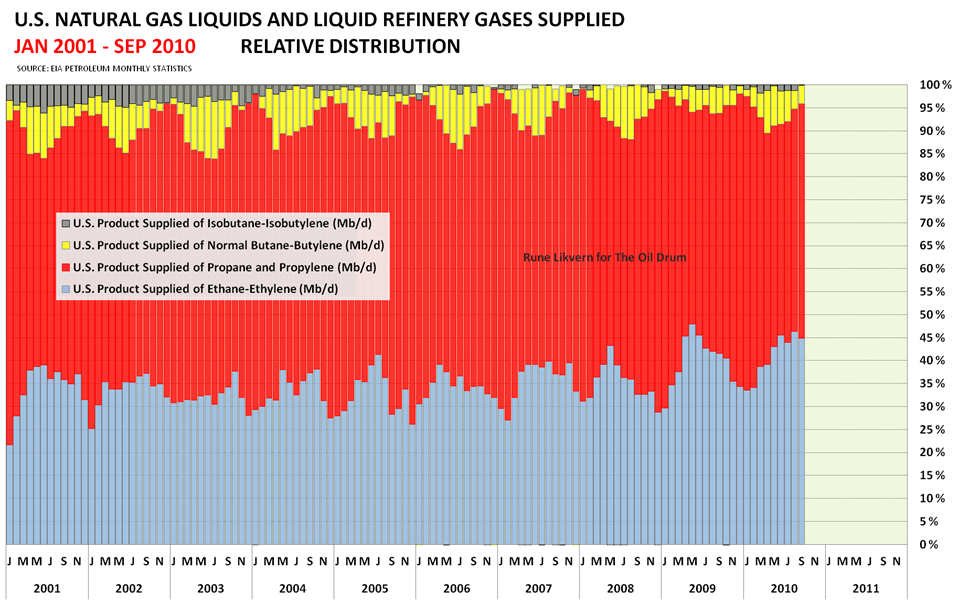
The graph also illustrates that with time the supplies of butanes have declined while there has been a growth in ethane. Ethane is primarily used as petrochemical feedstock, i.e. non-energy use.
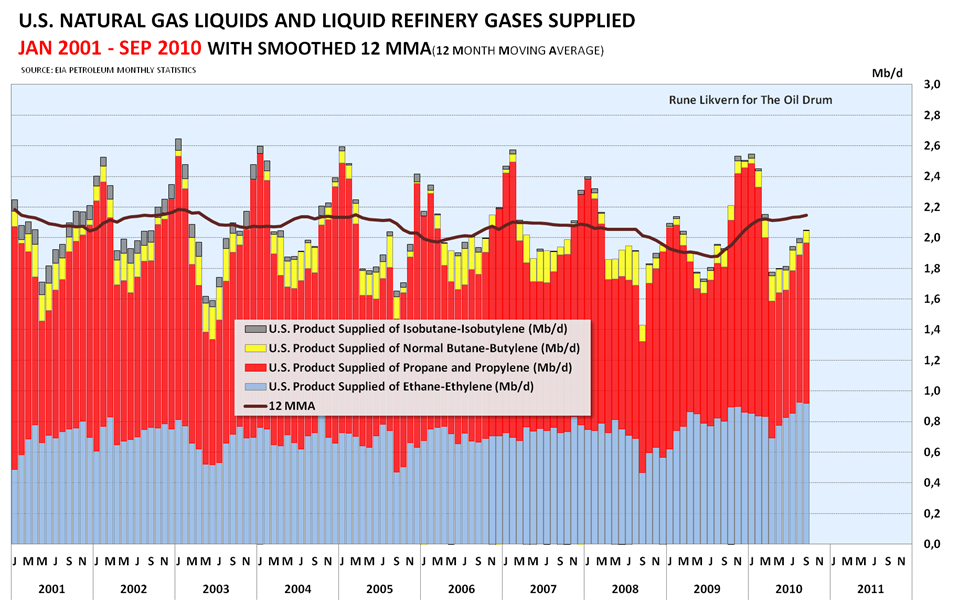
What can be perceived from the above diagram is that the “average bbl” of NGLs in the U.S. shows a declining heating value through time.
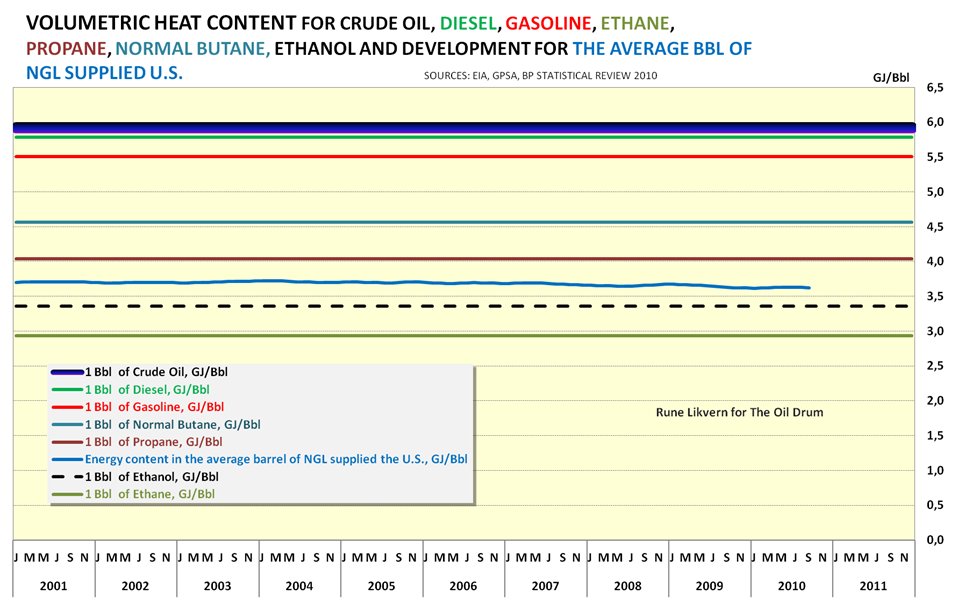
NOTE: Crude oils have a wider spread than depicted in the above diagram and the shown span in volumetric heating value is chosen for reasons of clarity.
The diagram also illustrates that as the number of carbon and hydrogen atoms declines, so does the volumetric heat content.
Refinery gains are mostly a form of double counting energy. The refining of crude oil involves breaking the long HC chains down to shorter chains and in this process, the resulting products have less volumetric heating content than crude oil and yield a higher volume.
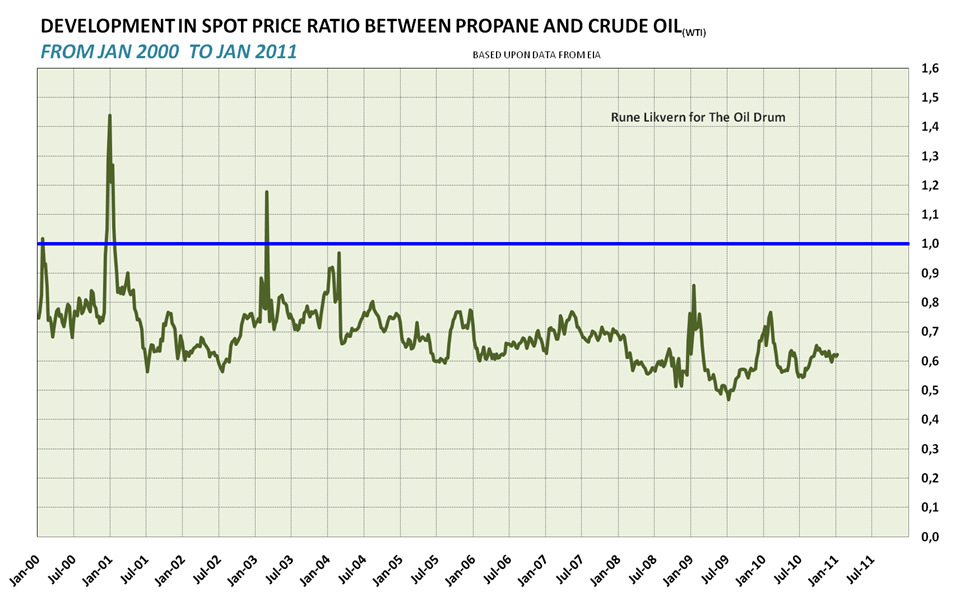
Some of the NGLs fetch a price relative to crude oil that reflects their volumetric energy content. This is illustrated below for propane.
One parameter that normally describes the development of gas fields is the wetness factor. Natural gas is a mixture of several light hydrocarbons, and specifications from customers and pipeline operators require that these are maintained beneath a specified limit to avoid the formation of liquid droplets during normal operating conditions. The heavier hydrocarbons that are extracted from the gas stream are commonly referred to as NGLs.
The wetness factor describes the relationship between sales gas and NGLs and how it develops over time. The more NGLs that a fixed volume of produced gas yields at standard conditions, the wetter it is considered. With time, the produced gas will normally become increasingly drier.
The owners of gas fields will normally search to develop the wetter fields first as these fields generate additional income from the NGLs. This is what is presently driving some of the shale developments in the U.S. as the operators go after what they refer to as the “sweet spots”.
As NGLs and condensates are not part of the OPEC quota system, this also gives OPEC members an incentive to extract these liquids to generate additional income.
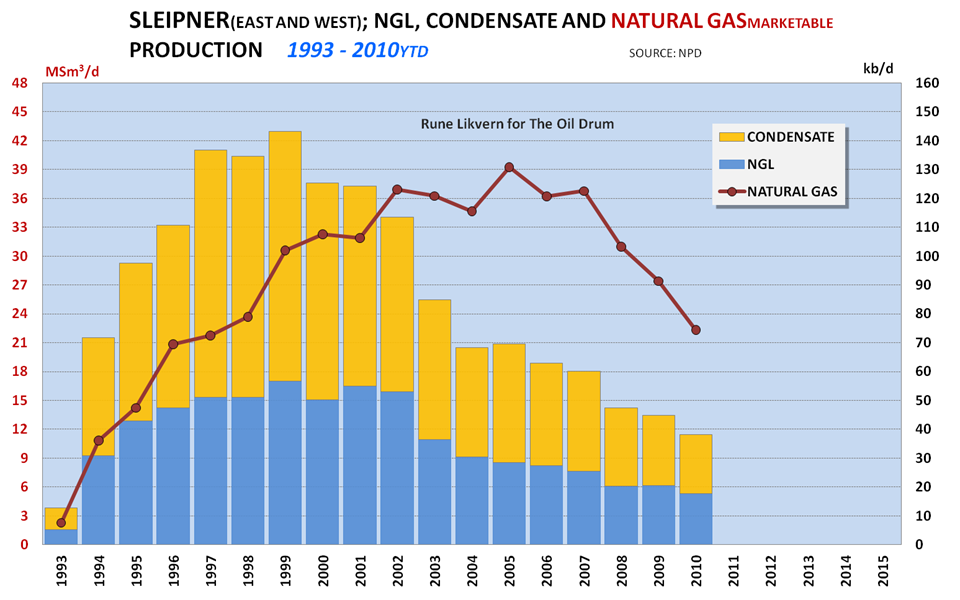
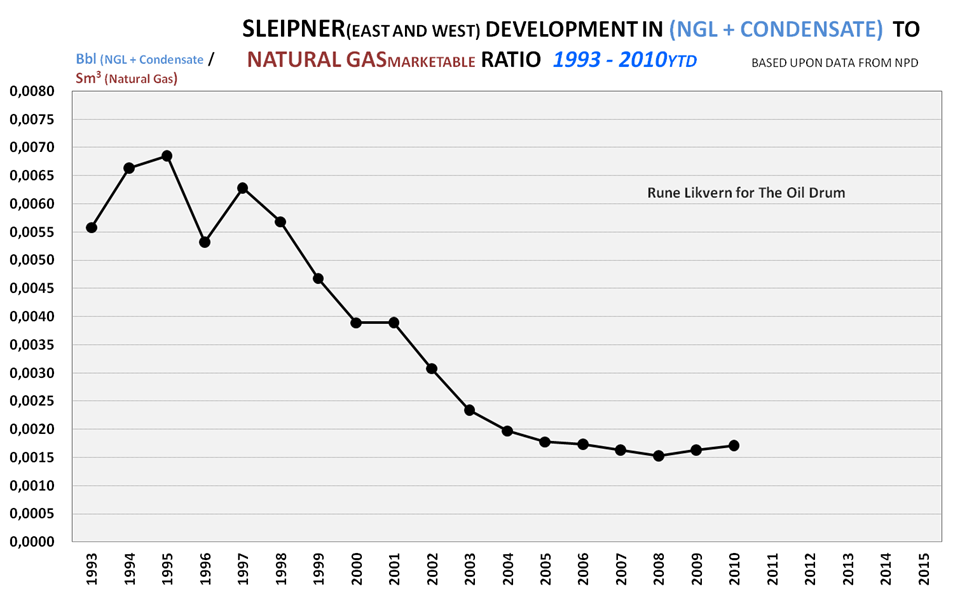
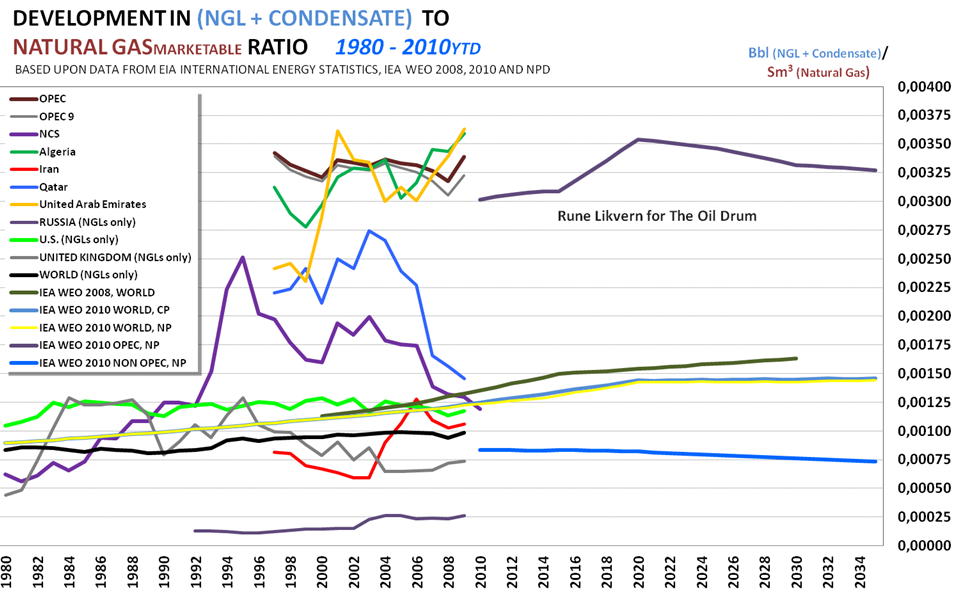
Development of the wetness factor for the Sleipner area serves as an illustration on how the wetness factor normally develops for a field.
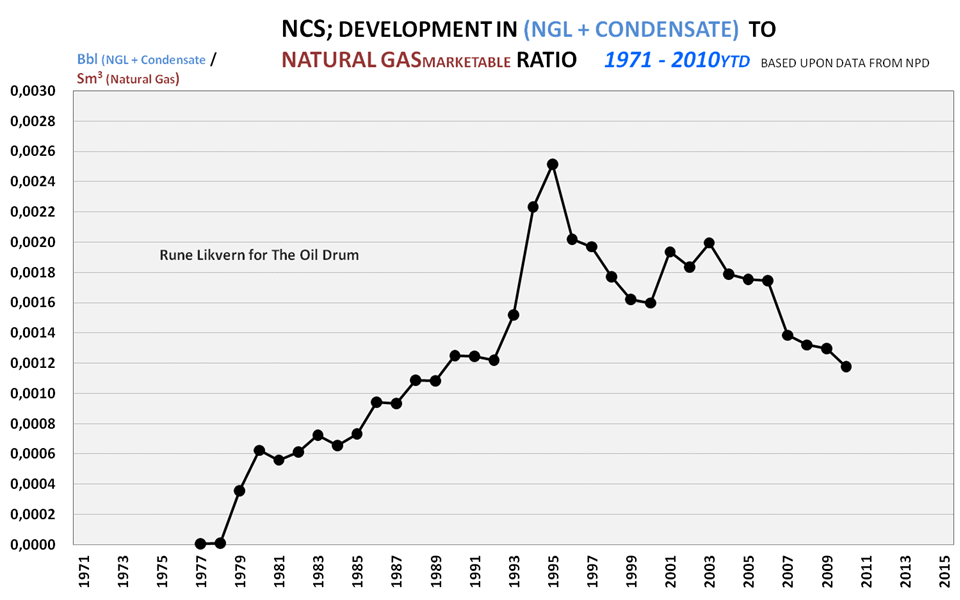
The chart above illustrates that the wetness factor for a region ascends towards a peak and then declines. It is now expected that the wetness factor for the NCS will generally continue to decline in the years ahead.
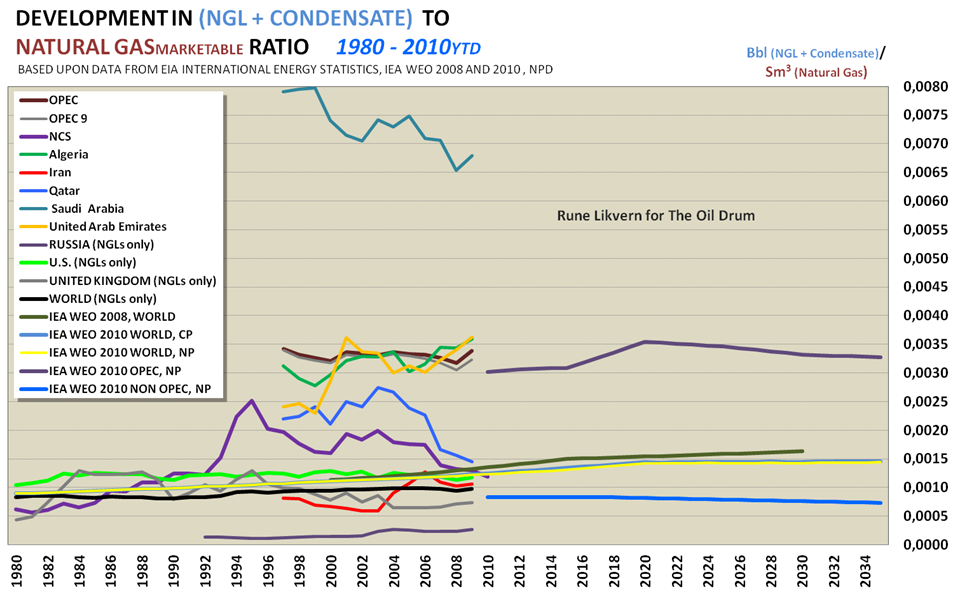
The diagram illustrates that the IEA expects the wetness factor for the world to grow in the years ahead. This is led by growth from OPEC while recognizing that the wetness factor will decline for non-OPEC countries in the years ahead.
Looking at recent developments, the wetness factor for Saudi Arabia has declined. The developments for Iran (South Pars) and Qatar (North Field) where the wetness factor has recently declined should be of particular interest.
Iran and Qatar held around 60% of OPEC’s proven natural gas reserves as of the end of 2009. These two countries are projected by the IEA to grow their natural gas production more than 100% towards 2035 and produce around 40% of OPEC’s natural gas.
Russia has what is considered a dry gas, reflected by the wetness factor.
As shown in this post, the wetness factor may wobble around and generally decline with time. It is still a little early to draw any firm conclusions about the wetness factor’s future development. However, if the wetness factor shows a general future decline this will impact the future supplies of NGLs.
In the second post about NGLs, I will present a closer look at natural gas production and reserves, and present the IEA’s forecast on natural gas production from OPEC, as these countries are forecast to have the strongest growth in future world NGL supplies.
SOURCES:
[1] BP STATISTICAL REVIEW OF WORLD ENERGY 2010
[2] IEA WEO 2006, 2007, 2008, 2009 and 2010
[3] EIA, INTERNATIONAL ENERGY STATISTICS
[4] EIA, INTERNATIONAL PETROLEUM MONTHLY
[5] GPSA, Engineering Data Book, SI units
[6] NPD, ACTUAL PRODUCTION DATA FOR NCS
Contact
- Content: editors at theoildrum dot com
- Tech support: support at theoildrum dot com
License

This work is licensed under a Creative Commons Attribution-Share Alike 3.0 United States License.
sleipner needs gas cycling.
Sleipner has used and uses? gas cycling.
wiki says that sleipner is used as a ccs project:
http://en.wikipedia.org/wiki/Sleipner_gas_field
other references state that the co2 is injected into an aquifer. i don't know anything about it except what my cursory search turned up.
The gas from Sleipner West contains around 10 % CO2 (by volume) which needs to be taken down below 2,5 % due to transport and buyers specifications.
The separated CO2 (from Sleipner West gas) is injected back into an aquifer (the Utsira formation).
If the CO2 had been released to the atmosphere it would have been subject to a Norwegian CO2 tax.
yeah, on a broader scale the world has never come to grips with the need to cycle gas in gas/condensate reservoirs. historically, companies have favored maximizing pv at the expense of maximizing recovery.
Rune - First, thanks for using the moving average approach. It's so much easier to see trends developing when volatility is muted. For everyone else here's a quick primer as to why we see more NGL's from current and future exploration efforts in the U.S. Simply most of the remaining viable prospects are deeper because the shallow was developed long ago. But due to the temperature window deeper means more NG and less oil as a rule. And deep drilling costs don't escalate in a linear manner. A 16,000' can cost 3 to 5 times as much as an 8,000' hole. Thus one has to keep a good success rate to make a reasonable profit. And deep NG exploration has become heavily dependent upon one aspect of 3d seismic data: under some circumstance we can see a direct indication of NG on the seismic. The simplistic term is "bright spot". Not all bright spots are NG reservoirs but the success can be as high as 80% in some trends.
So that's the scenario: most opportunities left are NG reservoirs that can be found more reliable with the seismic tools we have. But there's one more hedge available: NGL (or condensate as we tend to call them in the oil patch). Some trends are clearly dry NG and others have exceptionally high yields = 200 to 300 bbls per million cubic feet of NG. My exploration efforts, as well as many others, focus on these high yield trends. I'll drill any good dry NG prospect but those aren't the focus. But here's the problem with projecting NGL growth: there's a huge prejudice towards developing those reservoirs today. And like all resources they have a limit. As we develop high yield fields we'll eventually be forced to focus on the dry NG fields because that's all that left. So eventually global yields could show a very drastic reversal.
Additionally there have been many fields in the ME discovered decades ago with huge NG volumes containing significant amounts of NGL's. But a lack of market for this NG left many fields untouched. With the increased demand for LNG many of the fields are seeing production expansions that also result in a surge of NGL's. But these effort are tapping an inventory that been known for quit a while. Just focusing on the numbers might lead one to think we've suddenly developed new NGL trends. Not so much...as the old fields are depleted I doubt we'll see a sustainable replacement effort. Thus for a number of reasons we may see a surge in NGL production which could give a false hope that this is new long term source of liquid hydrocarbons IMHO.
The items that definitely contribute to creative accounting of the oil production include:
1. NGL's
2. Oil sands
3. Shale oil
The extra-creative accounting items are:
1. Biofuels
2. Coal derivatives
The first three seem to grow at a rate that somewhat obscures the decline in conventional crude that started in the last decade.
The last two ("all liquids") when applied suggest that production levels are creeping upward.
The intricacies of this accounting makes for a very interesting discussion IMO.
ROCKMAN,
Thank you!
My feeling (and experience) tells me you describe the situation very precisely.
NGL is a tough subject to describe and…………….. to forecast future supplies of.
ROCKMAN, the conclusion on further reading your comment must be that those untouched fields are relatively small. Almost a comparable situation with the oilfields in the ME it seems.
Han - I don't have any hard numbers for all the fields but recall one field one that had 300 - 400 millions bbls of recoverable NGL. So collectively they might add up. But max deliverability may still be a problem: there's a limit to how much NG they can liquify daily so that will limit NGL production. Also, those LNG trains are very expensive. Many began construction when NG prices were anticipated to be much higher. So we might not see a continued expansion of those fields until we burn off the current NG glut.
Excellent presentation Rune
Recommend adding world population and GDP to your graph to show the steady divergence between these primary demand drivers and the available liquid fuels.
Department of Economic and Social Affairs, Population Division
Note particularly the consequences on price of Non-OPEC peaking in 2005, and OPEC stopping increases in production in 2005.
Thanks!
That is an interesting idea, and could also illustrate that energy intensity ($$$ GDP created per unit of energy input) is declining which could be interpreted as energy is being used more efficiently.
To me what you describe shows that fundamentals (supply/demand balance) played a role in the run up in oil prices (starting in 2004) and that supplies responded poorly to the growth in oil price tells an interesting story.
Rune, Hopefully in Part 2 you can show the overall NGL production trends.
Ace had posted this curve back in 2007. You can see an increase in production that I am trying to verify.
from http://www.theoildrum.com/node/2620
WHT,
In the second part about NGL I will present some forecasts on natural gas production with a focus on OPEC as OPEC is expected to show the strongest growth in world NGL supplies. The natural gas reserves are there and what remains to see is if the market develops as expected and if the investments will materialize.
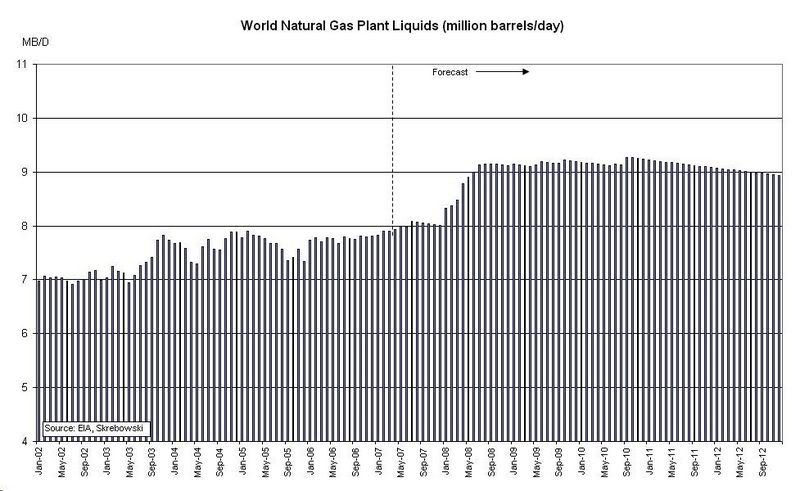
The diagram above shows development in EIA reported NGL supplies (exclusive of condensates) from January 2001 and as of October 2010.
Figure 12 is interesting.
Your world average of .00015 bbl/m3 = .000043 bbl/cf
would mean 104 Tcf/yr of natural gas would produce 12.25 mbpd of NGL.
Fig 6 shows 5 mbpd boe for NGL, so NGL averages 40% the volumetric energy density(5/12.25)? That looks low as Fig 5 average has an energy density of ~60% of crude.
Right now OPEC is not a big producer of natural gas.
The top 10 gas producers produce 70% of the world's natural gas
and OPEC countries Iran, Algeria and Saudi Arabia only 13% of that 70%.
It's hard to see how they will produce a lot of NGL.
http://en.wikipedia.org/wiki/Natural_gas_by_country
Hello,
Admittedly the graph (Figure 12) is somewhat crowded. The thick black line shows the development in "World wetness" factor using NGL data from EIA and natural gas production data from BP Statistical Review 2010, and for 2009 this "wetness" factor has been estimated to 0,00098 Bbl/Scm.
In Figure 6, NGL (from Figure 2) is converted to crude oil equivalent using a conversion 1 Bbl NGL ~ 0,64 Bbl crude oil.
Figure 2 shows the volumetric supplies of NGL.
Rockman, or anybody knowledgeable:
It is my impression that first class state of the art siesmic exploration is VERY costly.
Is this because the technology is patented, or because of a shortage of skilled personell, or capital equipment, or actual operating expenses such as leasing a ship for the quipment, or all of the above?
Can we expect the price of siesmic exploration to come down anytine soon due to expiring patents and so forth?
Mac – 3d seismic costs...sort of a bouncing ball. Everyone has patents but that's not a cost factor. It's just some very expensive equipment and well paid hands. Price comes and goes with demand. These days demand is down but, then again, crews are being shut down. But here’s a rough measure: acquisition cost can run around $45,000 per sqr miles = $4.5 million for a typical 100 square shoot. But you have to acquire landowner permits to shoot…add 10 – 15 %. Then processing runs another 15%+. And shoot in the swamplands of S. La. and costs can easily double…but that’s where some of the biggest prospects exists.
But to some degree the costs aren’t too important. Many companies won’t even review a prospect if there’s no 3d. And there are many trends being explored where zero drilling would happen if there were no 3d. Consider our typical deep NG/condensate dry hole cost is around $6 million. So maybe your $6.5 million 3d generates 4 big prospects with 40 bcf each. Nets you around $80 million per discovery. But you not too good so only a 50% success rate. So you net $160 million after spending $6 million X 4 + $2 million X 2 (completion costs) + $6 million (seismic) + $2 million (lease costs) = $36 million. Not a bad effort…maybe a 20% rate of return.
But here’s the problem: you ain’t got the seed money let alone the drilling dollars. The oil/NG price crash put a lot of prospect generators out of the game. Many had only their inventory to live off but there are almost no buyers with drilling $’s. And that’s where Rockman et al swoop in with our fat checkbook to take advantage of their misfortune. We bought deals for a third or less than what they were selling for a few years earlier. And on top of that we let thee generators pick up the lunch check.
See...folks are right: we are evil…even to our own. LOL. But seriously there are wells that will be drilled without any seismic. But the really big prospects, like Deep Water GOM or deep onshore won’t happen w/o 3d. We have a “crude response” to many prospect peddlers:”If you ain’t got 3d you ain’t got sh*t.” But it does average out in the long run: when times are really good the prospect generators screw us buyers to the wall.
Yes...all of us are evil.
Completely off topic, but I would like to get this message to WebHubbleTelescope, so please forgive me.
To: WebHubbleTelescope
Re: The Oil Conundrum
I have just finished perusing Vol 1 (9 hours of heavy going) and have a few comments/observations.
First let me note that I am mathematically challenged. I can follow your arguments but could not, myself, begin to develop the mathematics that they imply and that you have developed. I accept 100%, on faith, that your math is valid.
Your dispersive model seems to be based on the rule that finds are randomly related to size. Is the model weakened if this is not the case? It seems intuitively clear that in early days finds are related to ease of finding, eg – seeps evident at the surface near populated centers as in 1850s Pa. Then as knowledge develops, at some level, larger fields in any given prospect will be found early simply by random drilling. As exploration technology becomes more sophisticated, at any given level of technology, larger deposits will be more detectable in eg seismic squiggles. Also, as the pay-off is more certain, the larger finds will be developed earliest. Of course as technology develops, hitherto unfindable large deposits will be found, but as a general rule, early will be weighted to large. Taking this a step further, the need for better technology to find implies more difficulty in exploiting, and ultimately, as in very deep water, low limits on production rate. Perhaps the rule should be that the most produceable (or maybe the highest EROEI) are found earliest.
Your discussion refers to the concept of “stocks and flows” without ever using that terminology, but for me, the terminology is useful. We may yet find a black swan in the form of a very deep water and deep in the crust Ghawar, thus greatly enhancing the stock, but doing almost nothing to help the flow. If it were possible to incorporate a “flow” factor into the model it should be more predictive, but also more pessimistic. You use a flow factor based on the size of the remaining reserve (if I understood correctly). In the inherently low flow cases (most “unconventional”), flow will have little or nothing to do with the size of the reserve, and surely cannot be increased to create a plateau and delay a decline.
Reserve growth is an issue I dealt with in my failed petition to have the USGS withdraw their 2000 report. Based mainly on Ivanhoe, and somewhat on Laherrere, early declaration of resources were inflated to ensure financing, but early estimates of reserves were conservative both because of technology limitations and to keep some contingency reserves in the back-pocket to be declared in bad years to keep shareholders happy. Then we had the SEC introduce a requirement that only 1P (proven) reserves could be used in the USA. As technology improved, early determination of likely reserves became more accurate, and as fields were developed proven reserves grew toward an accurate initial 2P (proven +probable) estimate. All of these developments ensured that reserve growth would be high and that for early finds, reserve growth would continue for many years. However better initial estimates also ensured that in later years reserve growth would be lower, and would go on for fewer years. You also discuss gravity drainage as a factor contributing to reserve growth, which again, was true for early developments. However it was surely factored in to later estimates a priori, and is non-applicable to water driven and horizontal well recovery.
Laherrere says that outside the USA declared reserves were usually 2P. If so net reserve growth over many finds would be zero as for any find reductions would be as likely as growth. He also noted that in the FSU 3P estimates were claimed as reserves, at least in some cases, and for some time period, ensuring reserve shrink. For all of these reasons, extrapolating USA reserve growth (including growth of early finds) to the world is simply invalid, and would considerably inflate likely reserves and thus result in a more optimistic peak, both in magnitude and time.
You show the lack of plateaus in North Sea production. Probably a significant contributor was a lack of reserve growth.
No few people feel that the OPEC reserve growth, likely driven by quota considerations, was all vapor and should be discounted. At least for KSA I would guess that it was more likely declaring the reserves previously kept in the back pocket by the pre-nationalization oil companies. Maybe ½ of the sudden, perhaps quota driven, declarations were real.
Regarding keeping the production rate relative to remaining reserves – what would be the impact on the model results of keeping the production rate constant regardless of remaining reserves, as seems to be the case for KSA, especially with horizontal drilling. At least for KSA, acting as swing producer for decades, the “greed” factor breaks down.
The concept of creating a plateau by upping the production rate factor at the beginning of a decline is quite elegant. However I was confused by your Fig 17-1 with an 8 year plateau and Fig 17-8 with a 20 year plateau. Can you clarify what your thinking is here?
On your page 345 (355 on the sidebar) I could not at all understand the loss of cumulative reserves during a recession. Could you clarify?
What happens to the model output if most production follows a rate limited plateau, but say 10% hits TOP due to horizontal drilling?
Finally, I was struck by Box’s quote that “all models are wrong, but some are useful” and Hagen’s quote that “you people are asking the wrong questions”, combined with your observation that markets are difficult to model. Completely off topic but the whole and only basis for AGW is wrong questions, modeling difficulty, and models. It is very likely in this case that the models are not only wrong but, worse than not being useful, are counterproductive. I would like to send you some ideas on that subject, but not via this forum. If you are interested please send me your e-mail address to murrayv@msn.com.
Hi Murray, what you wrote might be amazing but I find it unreadable due to the lack of white space between paragraphs. Too dense.
Please consider using more (free!) white space!
Thanks.
Apologies. I typed it in "Word" and then did a cut&paste and all of the spacing disappeared. On reflection, I may have turned on word-wrap in the copy menu some time back, and that may be the culprit.
Murray, WHT's email is posted on his TOD profile.
Very good questions Murray !
Two parts as background. There is a dispersive aggregation model that explains why fields have such a wide range in size. The dispersive discovery model explains how we find those fields, and that the order does not really depend on size, and is random as you inferred, which is contrary to conventional wisdom. This strengthens the argument because it puts a conservative and optimistic bound on still finding large fields. So for the cornucopians, they can still wish away that large fields will be found, yet they will be less likely to find these then the smaller fields, which in turn are being found at a diminishing rate. This is also supported by the data, see Figure 8.2, where the order of the largest fields appears almost completely random. Sam Foucher made this graph and it is an eye-opener because people just assume differently. My analogy to this is that it is just as difficult to find a needle in a stadium-sized haystack than it is to find a crowbar, even though the crowbar is thousands of times the volume. And then with technology advancements, it becomes essentially equally easy to find either, you just have to complete a thorough search.
Stocks and flows is covered by the Oil Shock model. No one to my knowledge has ever tried doing this before so I had to make up my own terminology based on probability flow rates. I do try to separate the various stocks so that my last estimates of global production only included crude, as I knew the pesky lower-grade forms of liquid would start to emerge. This has happened recently as you see LNG fractions increasing from Rune's data in this thread.
I had seen that but I can't remember if I referenced your work. You had valid concerns.
I captured this with discussions on North Sea and FSU reserve growth analysis, so you are entirely correct.
Probably true.
This is another very conservative estimate that I make, which contributes to longer tails on the decline curve, and is also borne out by the empirical data. Certainly keeping the rate constant will drop it off faster, but I really wanted to show that even the most optimistic scenarios do not give us much extra wiggle-room. KSA may be different but the data is not available so I erred on the conservative/optimistic side.
Come again because 17-1 is not a figure showing a plateau. Fig 17-8 is a plateau caused by upping the extraction rate globally. One can also do this on individual reservoirs.
We still use oil during a recession so our reserves still deplete, though not as fast. Nothing earth-shattering here but it needs to be stated.
It has to start dropping if other places can't make up for it.
I realize I can get into trouble when I wander into areas of opinion. That's why I left the occasional quote in there, so as to report how other people think about these things.
Very good questions and it indicates that you could actually follow many of the arguments, so thanks. Email at the bottom of the blog.
WHT - Thanks for the responses.
It should be 17-7 and 17-8.
Am I ok to conclude overall that your 2008 peak is an optimistic case, and that more optimistic developments won't shift it more than a couple of years? If so, does that imply that the realistic case is a peak, or a start of the plateau a few years earlier, like 2005? If yes how long should we expect the plateau to last in the likely and optimistic cases based on your modelling?
It seems to me that your model(s) confirm what we believe we are seeing in the real world, ie they put in deep doubt other projections like peak on the 2030s. Is that the final message? Somehow I failed to find a conclusive message.
It is an optimistic model with the 2008 crude peak.
I don't have a conclusive message because I realize that I am but one person, albeit, one who may have just happened to find the essential math behind understanding the problem. Yet, until we can get a few more people help vet the analysis, it doesn't make sense for me to close the case -- I would still think that people would like to check the work.
For example, can you imagine if we had some better discovery data? We would even have better future extrapolations if we were to re-analyze. With science, there is always room for improvement.
One more observation - from Fig 8-4:
10 of almost 80 giants discovered pre 1930, 50 of near 80 giants found 1930 to 1965, <20 of near 80 giants found 1965 to maybe 2010.If we consider that reasonably scientific exploration didn't start before 1920, then we have >50 0f near 80 giants found in the first half of the real exploration period, with the least developed technology, and <20 of near 80 found in the second half of the exploration period with steadily advancing technology. I'd have to conclude that early is heavily weighted to largest. It is far from random. So back to my question - what effect does that have on the model?
I noted that the figure 8-4 is from unknown origins and Robelius actually has some better data.
If you take 1960 as the peak discovery date and you look before and after 1960 (instead of 1965) you will see it is more balanced. This also does not consider the fact that big reservoirs might still be found in the future, which is a problem with looking at censored data.
Being statistically significant is a big part of making strong claims. Robelius gives the number as 62% which is hard to make statistically significant in comparison to 50%, which is the completely random order. I am not going to look at the data and draw pessimistic conclusions which could also come about from random fluctuations, which is the whole idea of being statistically significant. We still could get a large reservoir and this could move the balance back to 50%; that is the essential characteristic of "fat-tail" statistics.
Brilliant post, Rune!
I liked it all. NGL is an area which is more complex and harder to analyse due to the high amount of reserves available around the world.
Posts like these, heavy in data and light in speculation, is what makes this site a place worth visiting on a regular basis.
I also liked your "heat-adjusted"(for a lack of a better word/phrase) graph on total liquids production, added with the smoothing effect of MMA.
I hope you can post(or perhaps reply in this thread) your prediction for overall Peak Oil and what the upper limit will be in terms of production of all liquids(adjusted for energy intensity), if only very briefly if you can.
My comment, which for variation is light on data and heavy on speculation, is that NGL and CNG will effectively extend the era of "happy motoring" (as Kunstler puts it) for several decades at least. That's rather sad in many ways, but does mean I can live out my life (now aged 52) without having to worry too much about a severe economic collapse.
You can hear this being confirmed to Jim Puplava, peak oil proponent, who sounds rather disappointed, in this podcast from last week: Update on Energy with Marin Katusa
My new chief concern is climate change, which is creeping up on us like a murderer in the night.
"happy motoring" on CNG? I doubt it...except indirectly. You can fuel electric generation and then power electric cars, but you have to keep in mind that's not one but two infrastructures to build, more or less from the ground up at this point. Perhaps things will stagger along sporadically for awhile longer than otherwise, but it won't be "happily", in any contemporary sense of the word.
My view on this that have developed over time is that when we realy starts to see the oil decline, we will turn to any energy source avilable. It will not be enough to save our economy or our life style, but due to the higher CO2 intensity, we will at least manage to keep up the GHG emissions.
You are clearly unaware that some countries power most of their vehicle fleets on CNG already.
From wikipedia:
I'm well aware, actually, being "in the business" for 23 years now. I worked on some NG conversions back in the 80's. Nevertheless, I doubt that we have the resources in the US to convert much of our fleet, nor the resources to build the supply chain, nor the resources to convert the fleet to electric, nor to build the whole supply infrastructure for that. It will likely be done in some way on some scale, but not for the majority.
You doubt that Americans have the resources to convert their cars to run on CNG? You have to be kidding! Just a small part of the defense budget could do it. Silly stuff.
Money is a different thing from resources.
WAsn't there some stink a few years ago about the state of Arizona giving huge rebates for conversions to CNG? I recall stories about people taking their gas guzzling F-350s in, getting a miniscule CNG tank and a check worth a large chunk of the truck's purchase price. Rumors were that the CNG tanks were subsequently removed. Dunno if this was a real problem, but made the conversion sound pretty easy.
Sounds more like LPG than CNG. LPG uses small tanks, not so CNG.
I listened to the Puplava interview but came away with a different feeling.
I had no feeling that Jim was disappointed but rather a feeling that Marin Katusa was ignoring basic facts about energy density differences (nicely graphed in the lead article), the extra energy costs of infrastructure development (cars on natural gas, LNG facilities, NGLs-to-octane plants, adapting the grid for new electric demand, making a zillion batteries), continuing costs for maintaining existing infrastructure for the existing fleet, and the continuing depletion of high-energy density crude. Marin was all bent out of shape because 'the big bad guvmint' forced Vancouver to put in a bike lane that was clogging up his beautiful traffic flow! He saw no point in trying to persuade people not to buy mini-tanks.
I don't listen to regular media at all, so when I hear 'regular media' cheerleading like this, it really cements my Zen-like 'acceptance' stage of peak oil understanding (the initial realization for me was in 2002 during the run-up to the Iraq war).
I think the *only* thing that will stop humans is food, just like with other animals. It won't happen for 15 or 20 years, so perhaps that's good enough for Mamba (I'm a few years older than him/her). It won't be fair. It won't be predictable in detail. It will work overall. The fact that it will come to this given how far language has allowed us to advance beyond animals is beyond tragic.
Even as an agnostic, I find it hard to say anything but 'Amen'.
Especially on the last part.
A writer named Boulder proposed three rules describing the limiting factors of any given population:
First rule: populations increase to limits imposed by the resources they depend on, increasing until the depletion of resources causes such misery that increase no longer occurs.
Second rule: if some new resource or more efficient way of using existing resources relieves this misery, the population will respond by increasing to a size sufficient to deplete the new resource condition and again be limited by misery.
Third rule : only if some condition other than misery is found to limit population will misery cease to be the limiting factor.
So far, language has only allowed us to cooperatively develop efficiencies, pushing the "second rule" out to an amazing extent. I imagine it will also allow us to communicate and record, to a much greater extent than any other species ever, the realities of the miseries we come to at the end of growth.
Mamba, I see no tight connection between the happy motoring model and availability of NGLs and CNG. And as for being able to live out your next 3 or 4 decades without economic collapse because of the abundance or scarcity of non oil based transportation, again, where is the connection? The amount of unsustainable debt generated and facilitated in part by cheap hydrocarbons along with the non productive financialization of the economy with wealth and power concentration in an ever shrinking subset of world society is IMHO where the risk of economic decline or collapse lies. Teasing out one factor and using it as a predictor is a fool's errand. As oil goes, so goes asphalt and concrete. Happy motoring on smooth road surfaces will be gone soon replaced by adventuresome motoring on gravel and dirt roads. There isn't and wont be the capital to rebuild the highway bridge/ infrastructure at its current build out capacity. The sad fact is that the US is broke and continuing to hope that there will be some way to keep happy motoring alive by a switch to non oil based car and truck transport is a delusion.It simply uses too much energy. Only rail and water transport has a future and virtually no one besides Kunstler has remarked on this. The collapse of the auto/truck-only oil based transport model could happen very quickly. If we wait to lay track until the mobs take to the streets in Riyadh, it will be too late.
And not aerial ropeways?
I love the aerial ropeways! It put such a smile on my face and made me proud to be a human! (probably the horse was not as happy about them)
It seems to me the lighter NGLs may not contribute much to happy motoring if they end up in cigarette lighters and barbecue propane tanks. Presumably GTL Fischer Tropsch methods are needed to turn short chain gas molecules into room temperature liquids like petrol.
The Gorgon gas field project will require major CO2 removal via zeolite sieve of about 3.5 million tonnes a year representing about 15% of the raw gas. It will be pumped into a saline aquifer below Barrow Island, Western Australia. By the end of the project some 120 Mt of CO2 will hopefully be locked away. No matter since the Australian government has said it will cover the cost of any leakages. Gorgon will produce condensate but they don't seem to know how many barrels it will be
http://en.wikipedia.org/wiki/Gorgon_gas_project
chevron is tight lipped on condensate content. apache has issued pr's that indicate about 10 bc/mmcf from their ip's. this appears to be a lean gas/condensate accumulation. this accumulation probably doesn't qualify as a gas cycling candidate. if the 10 bc/mmcf is accurate, recovery will be < 10 bc/mmcf. even lean gas/ condensate reservoirs will see a drying up (of produced condensate) as pressure depletes.
I appreciate all the good information, Rune. One thing that bugs me: all energy figures are given in terms of gross energy, as is normal. It's net energy that counts. Somehow, we need to get to showing net energy by taking cost into account. Except for the energy sectors, the world's economy runs on net energy.
In other words, to get a better picture of what is really happening to supply, gross energy should be discounted according to the EROI at the time produced.