| Tradable Energy Quotas: A policy framework for peak oil and climate change | The Oil Drum | NGL to the Rescue, Revisited (Part 1/2) |
The BP Energy Outlook to 2030 - a review
Posted by Heading Out on January 26, 2011 - 11:25am
There is a significant reliance, among those who write on fossil fuels, on the statistics that BP annually compile on global energy production. For example it provides underlying information for Energy Export Databrowser, as well as many of the posts at The Oil Drum. And so when BP just released their forecast for energy for the next 20 years (Energy Outlook 2030) it is worth having a look at to see what they predict. Bear in mind that this is only one company prediction, yet nevertheless it is an influential one.
The report is very briefly summarized in the introductory speech by Bob Dudley, the Chief Executive, who chose the following highlights:
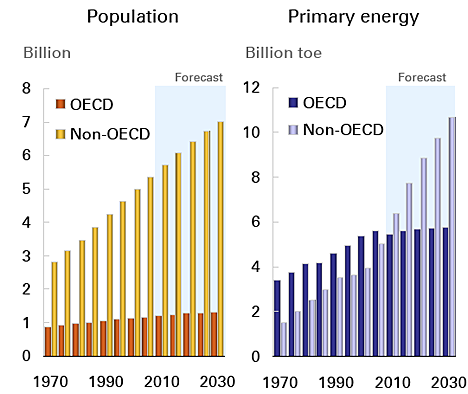
- Global energy growth will average 1.7%, but will be generated by non-OECD nations, while demand from OECD will remain relatively stable.
- Oil supply will grow at around 1% per year, with major increases in supply coming from OPEC, particularly Saudi Arabia and Iraq.
- Coal use will grow at an average of 1.2% per year, largely through demand for power from non-OECD nations.
- Natural gas will be increasingly used as a power source, with demand growing at 2.1% per year.
- Renewable energy sources will continue to be favored, with growth being at around 8% per year, and with demand for biofuels tripling over the two decades.
- Deepwater production of oil will rise from 7% of the global demand to 9% by 2020.
Those were the initial highlights, and there is slightly more detailed summary at the BP website. Since the booklet that summarizes the data is some 30 pages long, but uses a considerable number of graphics to show the projections, let me borrow some of these to summarize what I see as some of the critical points (and I will add a few editorial comments as I go).
The review (which is the first of its type that BP has released) recognizes that the face of energy consumption is changing. As the world population continues to grow, the shift in energy intensive industries to the developing countries has shifted the locations where demand will grow. Since industrialization also increases the energy use by their populations, there is a compounding rise in their energy use.
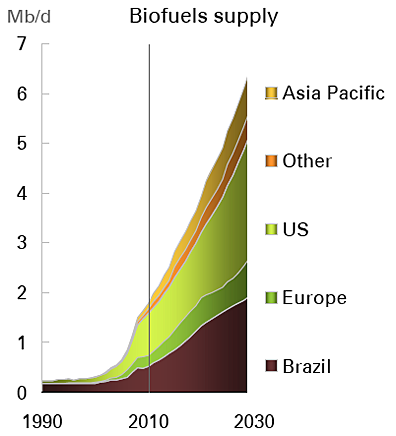
What is more interesting to me is how they see how this energy will be supplied. The overall projection is shown in this chart:
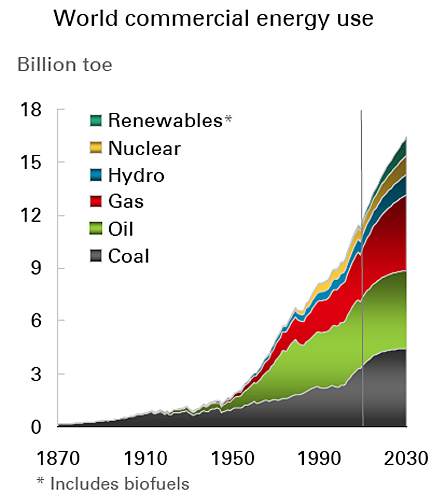
The fastest growing of these segments is that of renewables (which includes biofuels). This can be seen more explicitly in this graph from the report:
The growing impact of renewable energy production will affect both electricity generation, and transportation (the latter mainly through biofuel growth).
Looking specifically at the different fuel sources, the report anticipates that oil growth, will be some 16.5 mbd over 20 years, but that this will have to also compensate for about 4.5 mbd of declines in non-OPEC producers. Non-OPEC will, however, see an increase in overall production, the gains coming from about 2 mbd of increased production from oil sands (with the assumption that this is Canadian, since it is not credited to OPEC, of which Venezuela is a member), from the FSU, and from a significant increase in biofuels, only some of which is anticipated to come from the sugar-based ethanol of Brazil.
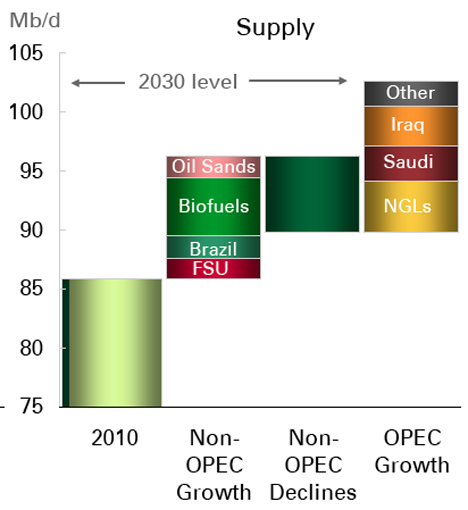
In looking at the above chart it is important to recognize the distinction between the FSU and Russia itself, since that country may well start into a decline in production within the year. The increased production will come from places such as Azerbaijan and Kazakhstan.
The second point is that relating to biofuels, where BP note that renewables currently provide 3% of liquid fuel for transport, but that this is expected to rise to 9%. (Within the next 20 years increased rail, electric, hybrid and CNG are not expected to make a material contribution, though CNG use is expected to be about 2%). The concern with biofuel production is that it is virtually all anticipated to come from ethanol. And, as we have just seen with the closure of the Range Fuels plant in Georgia this week, the commercial viability of cellulosic ethanol has yet to be established, challenging not only the BP view of the future, but also that of others. The practicality of further increase in corn ethanol production in the United States is doubtful, giving the rising cost of the raw feed stock (corn). However this is the projection, and increasingly BP expects that biofuels will meet increases in liquid fuel demand (rising to meeting 60% of the growth by 2030). There is, however, an allocation of 1 mbd for increases in refinery gains (which I have discussed earlier) and from natural gas and coal, which perhaps gives some indication of their opinion of this latter effort.
It is the dramatic increase in transport demand, particularly in Asia, that will drive the increased demand for liquids, China alone is expected to pass the United States in oil consumption within this time frame. To further supply that growth, NGL increases of more than 4 mbd from OPEC, and crude oil production growth mainly from Saudi Arabia and Iraq is projected. (In this regard it should be noted that a year ago BP were anticipating that Iraq might be producing 10 mbd by 2020 – the current more realistic target is 5.5 mbd by 2030. And while Iraq has stated it may be able to reach 12.5 mbd by 2017, the condition of the infrastructure in the country, among other issues, would suggest that BP are now more likely correct). Whether Saudi Arabia will rise to the challenge of producing (and likely more critically exporting) at the levels BP projects, given the current age and production history of its main fields is a question, since recent pronouncements from that country suggest a more conservative production capacity of 12 mbd and a disinclination, perhaps, to produce at even that level. (BP assume that both Russia and Saudi Arabia will retain their market share of 12% over the two decades, which, with an assumed total of over 102 mbd would give them each an assumed production of over 12 mbd). To reach the Saudi target BP expect them to expand production capability after 2020.
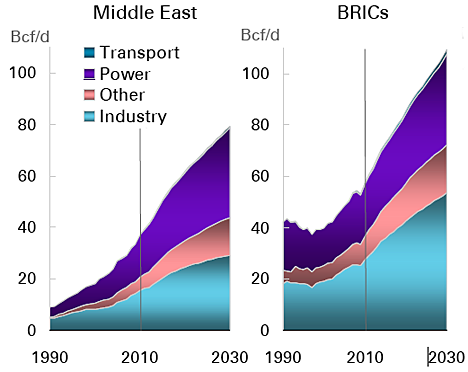
The major change in fuel use over the next two decades is expected to come in the increasing move from coal to natural gas as the primary source for electricity generation. Because of overall increases in power demand absolute demand for both fuels will increase, but increasingly the demand will shift to NG.
Thus, for example, Chinese growth in demand will rise at 7.6% pa to 43 bcf/day, though this will still only be 9% of their total energy consumption. It is the BRIC countries, which include Brazil, Russia, India and China (and now South Africa) (H/t KLR) whose overall growth in demand, with that in the Middle East, will likely prove greatest over the next two decades.
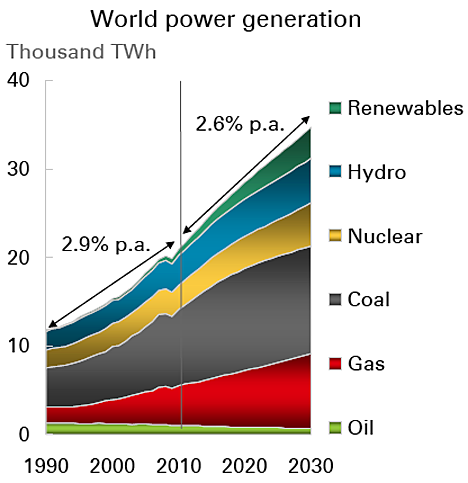
By 2030 BP project that most use of oil for power generation has been displaced, with coal and NG being the primary fossil sources. NG use will increase to about 40% of the market, outside of Europe, where it rises to 65%, given the European concern over climate change. However, in terms of the absolute market, Europe will see a much greater impact from renewable resources generating power, so that the percentage that NG provides will only rise to 24%. Over half the NG supply in North America will come from shale gas and coal bed methane (CBM), elsewhere the impact from those resources will, within this time frame, be much less. Whether or not these unconventional resources reach the 57% market supply by 2030 will likely depend on the development of at least one new technological breakthrough that lowers cost while increasing long-term yield from the wells, but that is a quite feasible assumption.
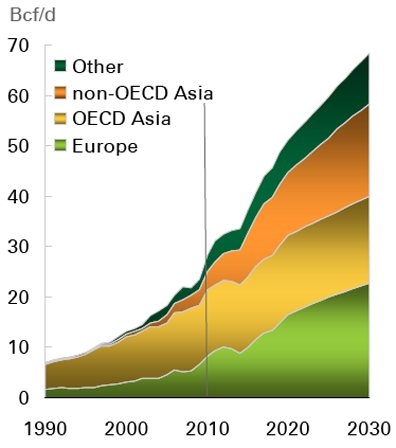
The market for LNG is anticipated to grow significantly (4.4% pa), particularly in Europe and Asia. Supply is initially seen as coming from the Middle East, but this will be followed by production from Australia which will overtake Qatar by 2020, and then African deposits will come on line providing 41% of the supply by 2030. It is interesting to note the caveat that BP introduce into this projection.
We assume that policy supports the continued rapid growth of non-fossil power generation – especially renewables, which attain a global share of 10% by 2030. Where gas is available at a competitive price, it continues to displace coal.
It is the response that China makes in changing their primary source of power as they continue to expand production, and thus energy demand, that will decide how far, and how fast the transition from coal will occur. BP anticipate that the market overall will continue to rise until just before 2030, at which time it will flatten. But whether that happens will likely depend on availability and price, of both coal, and its potential replacements. (Hence the caveat).
BP recognize that this is only a base case projection, and that there are many different factors that will likely change the final results. That is likely to be particularly true if there is an upsurge in interest in climate change legislation and regulation. I have made some comments on how accurately I think that the models have been developed, but that should not detract from the value of this particular document which, being freely downloadable, is well worth getting and saving.
Contact
- Content: editors at theoildrum dot com
- Tech support: support at theoildrum dot com
License

This work is licensed under a Creative Commons Attribution-Share Alike 3.0 United States License.
So what happens to BP when this doesn't pan out ?
"not my fault, Guv" ?
Forbin
Probably more along the lines of "no one could have seen this coming" which we heard in abundance in the aftermath of the recent financial crisis.
Except, yes, we do already know what will probably happen when the skyrocketing costs (including environmental and energy return as well as economic) of extracting all those fabulous non-renewable energy sources meets the already brittle systems of industrial civilization:
Just one example: I've seen reports that one third of the U.S. corn crop is currently being diverted to ethanol. Gee, I wonder what happens when we triple that?
Cheers,
Jerry
What it likely means is DDG-os cereal for everyone!
Very few humans eat #2 yellow dent field corn raw. Most of it is eaten after conversion to protein & long-chain fatty-acids by the world's most technologically advanced mobile cellulosic biorefinery
http://www.ddgs.umn.edu/overview.htm
Good luck on that population figure. It looks like they have projected decline to 2.5 Billion, which is the absolute upper limit of human sustainability. My post (http://www.theoildrum.com/node/7362/758669) described what could happen. Using that as a guide, decline is to 30 Million (using 1 Billion as lower limit of sustainability)! I have read analysis that shows much lower numbers, and others a possible human extinction.
Craig
Source the equations and the input data for those graphs please... (or better yet source code for a python program that creates the graphs) I would like to run my assumptions about what I've personally experienced for grain yields of Corn, Soybeans, and Sweet Sorghum (sugar + grain crop). I can feed at least a couple hundred people.. maybe even a thousand.. off 100 acres of high-productivity grain crops... As long as those people stay in the city and leave me alone to grow & deliver it once every few weeks.
There are a few places where this level of production is possible; many more would be lucky to feed 10 people due to depleted soils, salt levels, excess heat or cold, etc. I have see sustainability figures ranging from 7.5 E 10x8 to 2.5 E 10x9. This year we will pass 6.8 E 10x9. As I recall, the US and Canada are okay for current numbers, but barely so for the US. Even where you are, the chance of feeding 10 per acre is not good without a new focus on recycling human waste, as well as composing of all organics. In central Texas, the chance of one per acre is not good, as much from lack of water and excess heat as from overall soil poverty.
Craig
Very unlikely in the near/mid-term future. We are very generalistic and adaptable (for our size!), we populated the whole world even before modern technology. This is very exeptional for mamels of our size which are not cabable of flying. Even a Thermonuclear war will probably kill 95-98%, but total human extinction is very unlikely.
Overestimated! You have a very very little probability to have a total war with all weapons used at the same time, which probably will not kill more than 10% in the firts hours/days (more of them living in big cities and near the other targets). The days, months and years after that will surely kill more people because of the post-war nuclear fallout consequences on human health, livestock and vegetation. But even 95% is overextimated. In the Chernobyl disaster's area the large majority of people has no symptoms, even radioactivity levels are higher than elsewhere in the world.
Agreed, my opionion is that if you are around 50 miles away, you will definitely not be killed in the near term. So you are cabaple of having childreen. Eventually you die much earlier than normally at 50 instaed of 80, but that's quite a nother thing as "total extinction"!
You don't worry about nuclear winter? 10 years without summer will kill a lot of people. Not to mention speicies.
If we live or die is almost 100% dependant on how bad the climate gets.
The biota of planet earth are very interconnected. It is possible, but IMO not probable, that we could render ourselves extinct. That is not because of our great technology, but rather because in a few locations 'modernity' has not permeated the culture totally, and people still remember how to farm using sustainable methods, and in a few places there are still groups who hunt and gather in a rather natural fashion, using minimal tools. Even in those places, however, without retained knowledge of metalurgy, or stone tool making techniques, there could be problems.
If the worst happens, it will not be an easy world for the survivors. Preserving knowledge (and, yes, expanding it) is the key to human survival in the short to mid terms. Long term, we gotta get outta here.
Craig
It would be nice if TOD regulars were to create a comparable set of projections.
For oil production, given that the area under the production curve will equal the area under the discovery curve, if you know:
then you can make a pretty good guess when production will peak.
We've all seen the "growing gap" graph from ASPO, I've overlaid a rough approximation of my take on the Hubbert full cycle analysis on top:
Up until the oil shocks of the 70's world production was on track to follow the "ideal" curve which would have peaked in the 1995 time frame at 40GB/yr. By the time Campbell and Laherrère published their Sci. Am. article in the late 90's it was clear that the production curve would be much flatter, not peaking until the 2010 time frame, and at a rate closer to 30GB/yr.
Right about where we are now and, it should be noted, easily accommodating the much publicized "plateau".
Cheers,
Jerry
Nice one Jerry. Picture says a thousand words.
Well I'm assuming TOD, or it regular readers (at least individually) don't have the resources of BP, but I think this is a great idea in principal. Maybe a good first cut could be made using the various articles and comments from TOD....
Everybody else (BP, IEA, EIA) have projections that TOD readers have a lot of fun knocking - a set of evidence-based stats put together and posted by TOD might give a more cohesive counter-argument against the oil optimists?
All the resources you need are brain cells. Consider that I released the Oil ConunDRUM treatise at about the same time BP's report came out. BP's report did not go through peer review. It lacked neutral non-corporate editors. The writers of the BP report did not reveal any of their algorithms or deep analysis techniques. Who knows what's in there? Yes they have a huge base of human resources, but that could easily go to obfuscation more than anything else.
So as I add links to The Oil Conundrum on the Wikipedia Peak Oil entry, I notice they get removed within a few days. You have to ask yourself why these get removed and BP's remain?
On the flip side. Do you think they actually read the Oil ConunDRUM? Can you track visitors to your blog or GoogleDocs?
I don't know, CC. It may be a little early to tell.
All I know is that I now have more free time to show some persistence. It's a change of pace from the all-consuming book editing.
Probably because your documents are essentially unreadable. When I try to access them I give up after several minutes waiting for the first page to finish loading.
Well, you don't have to go to the bookstore, or make a special trip to the library. You just might need a speedier link or alternate computer. I would say 15 Megabytes isn't too bad for over 600 illustrations and 750 pages!
???????? .. .... no sorry this is user error only.
The first page is a cover page - so there's essentially nothing
on it bar the title. Secondly it's Google's programming that is
to blame as it doesn't really split the download into page by
page loading on demand. However why are you trying to read
it online - why not just download it ?
I suggest you look under the Google Docs logo.
You will see 'file' .. click on it and download the entire 15MB .pdf
as a single download. I've just done it using a wireless broadband
connection from 3 in the UK.
The download speed was a consistent 33 KB/per second and the
whole thing downloaded in a few minutes so whomever is hosting
the original content has more than adequate bandwidth.
It's a 750 page doc and from my first cursory glance it looks very
well put together and all the index links work perfectly which is one
of the real quick access benefits of the pdf format. I for one am
extremely grateful to the author for making it freely available.
pdf downloaded in less than one minute - looks much better as a pdf.
I must have hit a moment when a lot of other people were trying to access it, or perhaps there was some kind of filter on the connection (I was using the guest wireless networking in a hospital waiting room). But nothing else I tried accessing this morning was noticeably slow.
I'll try downloading the PDF version again. However, circulating ideas in a 750 page tome (even if it is loaded with links that work perfectly and is "only" 15 megabytes) is hardly the best way to get them widely read and accepted. BP has a 30 page summary.
I'll try downloading it again: but I certainly will not guarantee I'll read all of it.
I think one of the reasons the 'book' is so well indexed is precisely because the author does not expect that
everyone will read every word on every page. It's clearly written to cater for everyone. Those that just want a
quick primer ... no problem. For those that want indepth analysis .. no problem.
I've never read 'War and Peace' .. but then it was never going to be any good in the first place.
Too many notes Mozart.
A few days ago I wrote a brief "review" of the tome, in two parts, and I hope it will help you with delving into it deeper. Out of 750 pages, Half is about oil and half is about other applications of WHT's theory. Out of each half, 50 pages explain what is going and why. Remaining 650 are about specifics.
http://www.theoildrum.com/node/7388#comment-760988
http://www.theoildrum.com/node/7395#comment-761784
Disagree - worth every minute!
I think he was being sarcastic.
D'oh. Whoooooosh!
I have a oldish version of IE at work - Google docs doesn't work in it. Mozilla/Firefox is OK. Bloodly browser incompatablities -things seem to be getting worse and worse in these days of Ajax, revolting JScript libraries no one understands, Google Web Toolkits ...(OK, that's my winge for the day as a frustrated ex-Java web developer).
Let's just consider that 4th graph, labeled 'Supply'. The only portion that is believable on its face is Non-Opec decline. Beyond that, two words - net energy.
The biggest chunk of Non-Opec is Biofuels, largely ethanol. As ethanol has an EROEI of barely more than unity, it can essentially be erased from the graph, in terms of net energy, which is what matters to society. So there's about 5mbd of BP's 'growth' gone. Oil sands at around 8:1 EROEI are about 1/3 of current crude, so knock that bar back by 2/3rds, so from about 2mbd down to .7mbd. Brazil's ultra-deep offshore will have a very poor EROEI, so it as well will yield much less useful net energy than indicated. Probably akin to the tar sands. Let's assume Kazakstan and Azerbaijan can grow as indicated. So Non-Opec growth will be about 3mbd, rather than the 10 or so indicated. So Non-OPEC would decline by about 3mbd, instead of growing by 3-4 as shown.
Regarding OPEC Growth, NGL's have only 2/3rds the energy of crude, so knock that bar down by 1/3. Saudi growth – ask Darwinian. Iraq growth??? Other? And where's OPEC decline? Is BP saying OPEC is not subject to decline?
The absolute best scenario that I can draw even from BP's data as given, is that OPEC growth might offset Non-OPEC decline, such that we remain on the plateau. There are lots of reasons to anticipate that the 'best case' will not manifest. Jeff Vail, Stoneleigh and many others have written about various aspects of this. Then incorporate what BP itself acknowledges regarding population growth, and we have a steeply declining net per capita energy availability. As I believe Christ Martenson likes to say, the next 20 years will not look like the last 20 years.
An EROEI of about 8 will produce 7/8ths of net energy, compared with between 9/10s and 19/20ths for conventional crude.
It will reduce the net gain by about 5-10%, not 67%.
All these figures are impossible to prove, anyway.
Otherwise, I assume BP started with a target production figure and worked backwards, as do most economists...
(Yes I know there are exceptions)
EROEI of 9/10s or 19/20s (90:1 or 95:1) is what we got from crude in the days of light, sweet gushers in Texas in the 1930's. Hasn't been that high since at least 1960. The numbers I have seen for crude since the 1970's have been in the range of 12:1 to perhaps 40:1. (See Hall, Cleveland, Murphy...) As you say, hard to 'prove', but we can get in the ballpark. I used 25:1 as that current ballpark for conventional crude. So, 1 unit in, we get 25 to use. Tar sands - 1 unit in, we get 8 to use. I make that 1/3 as useful. Hence my reductions above.
@clifman: "I used 25:1 as that current ballpark for conventional crude. So, 1 unit in, we get 25 to use. Tar sands - 1 unit in, we get 8 to use. I make that 1/3 as useful. Hence my reductions above."
I don't get your reasoning. Using your numbers, every barrel of tar sands oil is actually only about 7/8 "new" oil, while every barrel of conventional oil is actually about 24/25 "new" oil. So shifting to tar sands oil only "costs" you about 2/25 of your production, or roughly 10%. I'd say that's 9/10 as useful, not 1/3.
Try this. You have a barrel of oil to invest in acquisition. Invest it in tar sands, it yields 8 barrels. Invest it in conventional crude, it yields 25 barrels. Hence one third...
Try this. You have a barrel of oil to invest in acquisition. Invest it in tar sands, it yields 8 barrels. Invest it in conventional crude, it yields 25 barrels. Hence one third...
There are a number of fatal flaws in your arguments. The first is that the EROEI ratio that is relevant is the marginal EROEI, not the average EROEI.
The marginal EROEI of a barrel equivalent of oil sands bitumen may be 8. However, if you invest an additional barrel of oil in looking for conventional oil, and you don't find an additional barrel of oil because you get a dry hole, then its marginal EROEI is zero - a lot worse than 8. This is what oilmen refer to as Geological Risk, and they have to adjust all their numbers for geological risk because if they don't, they will go bankrupt in a hurry. There is zero geological risk in the oil sands, so it's not a factor in the marginal EROEI. For conventional oil it is what they technically refer to as a SWAG - Scientific Wild-Ass Guess.
The second flaw is that crude oil and natural gas are not fungible. If your local service station runs out of gasoline, you can't fill your tank up with natural gas and continue driving. This appears in their relative pricing. At this point in time, a barrel of oil equivalent (BOE) of natural gas is worth about $24, whereas a barrel of oil is worth about $90.
So, it is worthwhile converting that BOE of gas into more usable form. A gas-to-liquids plant is feasible, but the EROEI of one is about 0.6 - for every BOE of gas you put in, you get 0.6 barrels of synthetic oil out. It is far more efficient to put it into an oil sands plant and turn that BOE of natural gas into 8 barrels of synthetic oil.
What the current price differential between natural gas and crude oil is telling us is that, adjusted for fungibility, the EROEIf of oil sands is about 8 * (90/24) = 30.
10+ Thanks for a lucid explanation.
Craig
Are you going to be consistent and erase electricity from coal which has a EROEI of about .6? How about erasing electricity from natural gas too? It also has a negative EROEI. Writing off ethanol is similarly silly.
EROEI/Net Energy is a fallacious concept that proves nothing.
Usefulness of a form of energy is more important that EROEI/Net Energy. Disregarding the attributes/usefulness of a particular form of energy and judging each only on its BTU/energy content makes no sense.
X - of course your history here as an ethanol shill is well known... That noted, what we are talking about here are energy sources. From whence can we (industrial civilization) go and 'get' useful energy from 'scratch', so to speak. Electricity is an energy form not an energy source. So comparing the conversion rate of coal to electricity is not an apt comparison to the EROEI of any given energy source. What we choose to do with energy once it's available to us - conversion into electricity, or the efficiency of engines, or of transportation systems - is important, but it's a separate issue from EROEI, which, contrary to your constant claims otherwise, is a vitally important concept that far too few understand.
Well,, that's not entirely true. Form does matter. Take oil sands, where most if not all the difference between EROI for them and for "standard" well production is in natural gas inputs. Natural gas which is a) a long way from any alternative market. b) alarmingly abundant, at least in N. America according to USGS, who place "probable US resource" at 50 years at present consumption rates and "likely US offshore hydrates existing" at 200,000 tcf or 1500 years. What else is Canada supposed to do with it's equivalent amounts?
You have a black box. You put in one barrel of crude oil in one end, and get one barrel of corn ethanol out in the other. This makes an EROEI of 1[*]. In your line of thinking, where EROEI is usless information, we obviously have 2 barels of liquid fuels now. But we truly only have one, since the first one gotconsumed in the process. What is so hard to explain?
[*] Assuming the same volume energy density, wich we all know is not the case, but I am lazy.
BP is gas-happy and have run out of ideas(Kara Sea gas?!).
They finally admit Peak Oil(or at least no more oil for BP).
The report mentions that there is a 60 year reserve of natural gas
based on current consumption with the hope of 30 more years from unconventional gas(shale/coalbed methane--likely to be serious water polluters) at current consumption rates.
IMO, the geology behind huge unconventional gas reserves is uncertain at best but this is their last bluff.
The real problem with natural gas is energy density. Even LNG has only 60% of the energy density of oil, meaning it would take 2 LNG tankers to replace 1 crude oil tanker so on a BTU basis ramping up gas is nuts.
GTL is 50% efficient so wellhead syncrude production would be wasteful.
It's too expensive to replace coal as a fuel for electricity and
too expensive to replace oil.
The solution is obviously to use natural gas to produce syncrude from unconventional oil but they are too late top profit on that.
Not to pick on BP too much, Exxon has been touting their 'controlled freeze zone' as a CO2 solution. What they don't
talk about is the fact they are selling it to the Qataris as a way off removing the sulfur insitu from their Pars gas.
IOW, most of the 'future' world reserves of gas are unburnable without the removal of high percentages of CO2 and hydrogen sulfide.
So the 'false firemen' of natural gas will NOT be riding to our rescue.
I had the Horrible Thought, that, should we get into serious-looking GW trouble, that we might start dosing jet fuel with sulfur, the better to inject (cooling) SO2 into the stratosphere.
+10
I endorse your idea.
One of the reasons we remove sulfur from oil and gas products is that it forms highly corrosive dilute sulfuric acid.
Thus you will succeed in grounding all jets everywhere in short order reducing a significant amount of GHG.
Glad you like it, but apparently it won't work the way you hope :-). Till recently (2003?) jet fuel had a fair amount of sulfur in it. Note that it's just SO2 after combustion, not (as far as I know) H2SO4. That takes time and moisture.
Speaking of NG, majorian wrote:
What? In the USA, NG has ALREADY replaced nearly all of the oil once used for electricity generation (with only a small amount of oil power generation remaining, mostly in Hawaii and Florida). While coal is still a very common fuel for electricity, it's NG that has been growing fastest in market share.
These same substances and many others must be removed from crude oil before refining into consumer products. This factor does not seem to have slowed down oil usage very much, and I suspect the same will be true for NG. Technology and equipment for such filtration already exists, is fairly mature, and it will simply be used to whatever extent is needed, up to the point of pricing NG out of the market, and we are nowhere near that NG price level today.
I suspect Hawaii is one of the least PO prepared states of the US. Overpopulated, dependant on oil for transport and thus import of suplies. And now you tell me they have oil based electricity too. I worry about those islands.
Hawaii is interesting. Geothermal potential is very high on the Big Island, but there is quite the good old boy network running the power companies and they rule with virtually no oversight.
Currently Hawaii derives near 9/10 of all the energy it uses from petroleum. An EIA overview can be found here.
Cheers,
Jerry
Fossil fuel literally *is* buried treasure. Except that we burn it up after we find it such that we keep having to find more & more. And there is only a limited amount of it and we have already collected it from the most easy to find places.
What was that war definitely NOT about?
Operation Iraqi Liberation (OIL) had nothing, nothing, to do with oil. I don't know where anyone would get that idea.
Ha ha, what a classic :-)
I saw that OIL acronym first revealed in Amy Goodman's book "The exception to the rulers" from 2004. She identified it as a rumour if you click on the link.
Web, click the link I provided. It's an archive of a White House press briefing by Ari Fleischer, March 24, 2003. Fourth sentence, "He began with Prime Minister Blair, where the two discussed the ongoing aspects of Operation Iraqi liberation." "he" = GWB.
I find that it enhances the snark, if I can source it that well.
What is BP's prediction for oil spills?
ASPO offers this
What energy levels can the Earth sustain?
Peer-reviewed
climate change
Forecasting
Fossil fuels
Publication date:
2009-03-03
First published in:
Energy Policy
Authors:
P. Moriarty, D. Honnery
Abstract:
Several official reports on future global primary energy production and use develop scenarios which suggest that the high energy growth rates of the 20th century will continue unabated until 2050 and even beyond. In this paper we examine whether any combination of fossil, nuclear, and renewable energy sources can deliver such levels of primary energy—around 1000 EJ in 2050. We find that too much emphasis has been placed on whether or not reserves in the case of fossil and nuclear energy, or technical potential in the case of renewable energy, can support the levels of energy use forecast. In contrast, our analysis stresses the crucial importance of the interaction of technical potentials for annual production with environmental factors, social, political, and economic concerns and limited time frames for implementation, in heavily constraining the real energy options for the future. Together, these constraints suggest that future energy consumption will be significantly lower than the present level.
Published in: Energy Policy, Volume 37, Issue 7, July 2009, Pages 2469-2474
Available from: ScienceDirect
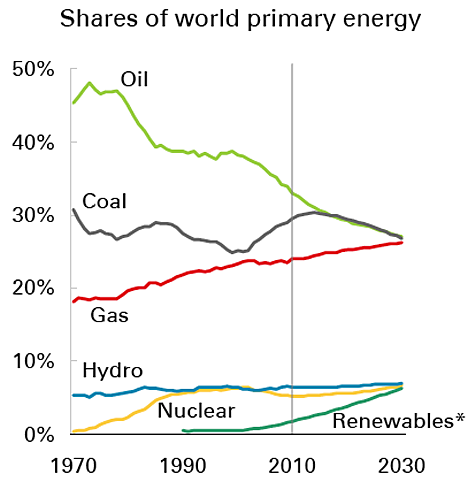
Nice to see this post but I am curious why the essential crude oil production graph was not reproduced?
Is oil as a fraction of total energy the preferred way to convey this information now?
Two conflicting numbers in the report (unless you look at the fine print footnotes).
On page 8, total production is 79,948 for 2009
On page 11, total consumption is 84,077 for 2009
Oil sands production is about 2,000,000 barrels per day and shale oil production is about 1,000,000 barrels per day. NGL production is about 9,000,000 barrels per day. Oil sands + Shale oil + NGL has roughly increased 1 + 0.5 + 2 = 3.5 million barrels since 2004.
Total production in 2004 was 80,371 million barrels/day.
So conventional crude (including oil sands and shale oil) has gone from around 73,000 MB/day to 71,000 since 2004. The increase in NGL by 2 MB/day has obscured the decrease, and the increase in oil sands and shale oil demonstrates the reliance on lower grades of oil. (EDITED)
It is interesting doing these kinds of calculations because it may reveal what kind of creative accounting is going on with the shift to lower grade forms of oil equivalent.
The upshot is that the graphs only have meaning if they are properly deconstructed.
Graph "Regional demand growth for LNG"
Why the dip around 2013/2014?
NAOM
These sorts of reports have no idea what happens when after peak oil in a particular country net exports turn into net imports.
Egypt expects to up energy subsidies, maintain food subsidies
http://thedailynewsegypt.com/economy/egypt-expects-to-up-energy-subsidie...
I have put a graph with production, consumption and imports here:
http://www.crudeoilpeak.com/?page_id=2517
Please, look at the history of corn prices, production, and the weather conditions before you make such claims. We have had high corn prices this year because of weather in the US and Argentina, limiting production. Farmers are piling into planting more corn for next year because of the high price predictions.
It used to be relatively simple to figure out corn supply/demand.. Now it's intimately connected with oil price.. so as long as oil is high, there will be demand driving ethanol production.
Regardless of what the price does though, I expect there will continually be a 4% per year "moore's law for agriculture" increase in yields, using pretty much the same inputs.... Therefore there will be more corn available for ethanol in 5 & 10 years... and this is where the 30% of the crop that's currently being used came from.
Sure, the conventional wisdom is the price of corn will go up, but if the economy dives again and reduces demand for meat, that corn will cheaply go into ethanol. But it's way to intertwined and complicated to accurately predict.... That being said, you can expect continued increases in corn production per acre, and continued increases in conversion rates of bushels of corn to gallons of ethanol. Between those two, there is plenty of room for the growth BP predicts with no changes in acreage, or the cellulosic biomass boondogles.
I expect there will continually be a 4% per year "moore's law for agriculture" increase in yields, using pretty much the same inputs.... Therefore there will be more corn available for ethanol in 5 & 10 years... and this is where the 30% of the crop that's currently being used came from.
Moore's Law doesn't apply to agriculture, it only applies to computer hardware.
The basic law that applies to agricultural production is Malthus' Law .
Unfortunately people routinely cite Moore's Law when they need to find some excuse to be overoptimistic, but it is inapplicable to most parts of the economy. Farmers are not growing integrated circuits, they are growing grain.
Expect to see more food riots in countries with exponential growth rates, because their food supply from advanced agricultural countries is going to be turned into fuel alcohol. Poor people will starve so rich people can continue to drive.
Moores law is even more complicated. As time goes on,it gets slightly harder to push all those semi-conductors into an all smaller surface. For this reasn, the constant in Moores law is gradually growing. What used to be 18 months is now 24. I don't think we will ever see an end to Moores law, only that the time constant keeps growing more and more. The end to circutoptimization will be when the cost of developing even tighter circuits will be higher than the gain of using them. Follows pretty much the same maths as PO. No surprise, since space is a non renewable comodity as well.
There is a fundamental limit to Moores Law. You can't have electrical pathways that are half an atom wide. Well not for very long anyway.
The current limits are based around the size of components that can be etched by the given wavelength of light.
Manufacturing gets tricky when you get past the ultra-violet laser stage for photolithography.
Exxon has also published its long term energy outlook until 2030, I find this comment from Bill Colton, Exxon vice president of Corporate Strategic Planning, quite amazing:
link:
http://finance.yahoo.com/news/Exxon-Global-gasoline-demand-apf-516122184...
Regards,
Nawar
Hi Nawar,
This is one of the main reasons that PO is not generally recognized as a real problem. Here is a bright line - either the majority of us TOD folks are completely misinformed/deluded OR BP/Exxon/MSM/PTB are misinformed/deluded or perhaps even deliberately lying. There really is no middle ground. Either we start the 20 yr transition countdown (per DOE) to mitigate very serious consequences of FF decline or we bask in the glory of (per Dick Cheney) our "energy intensive lifestyle" for decades to come. Happy motoring and all you can eat! Just need a bit more efficiency for our beloved cars.
I really hope the heavyweights on this board address this Exxon prediction with serious thoughts. There really ought to be some "Letters to the Editor" over this.
dave - Reading his statement ("industry to have 5 million to 6 million barrels per day of excess capacity throughout the next twenty years.") again I can see how he would defend the statement and win the argument with some folks. When he says "industry" he really means the oil producers. And what oil producers have excess production capacity today (let's not worry about 20 years out)? It's not ExxonMobil, Chevron, Shell Oil, etc. In fact, IMHO, if you want to see this guy turn into a muttering fool ask him this in a press conference:"So ExxonMobil and the other oil companies are withholding production today and thus driving up the price of oil?"
Every oil company on the planet is producing every drop of oil they can today. Except for those companies which are national oil companies owned by OPEC nations. Of course only some of these NOC's have excess capacity. And let's set the debate aside for the moment regarding how large this excess capacity is and how long it will last. The way to turn his statement back on him is to point out that any excess capacity will have little effect on supply/demand if this excess capacity is controlled by govts that won't necessarily make decisions based upon free market principles. He's dishonestly offering a vision that ExxonMobil et al will have the ability to bring excess capacity to bear if it's needed. In fact, none of these companies have the ability to bring one shut in bbl of oil to the market today let alone 20 years from now.
Yes, Rockman, that's right. When he says, "industry", he means Saudi Aramco, Iraq National Oil Company, National Iranian Oil Company, Petroleos de Venezuela, etc... ExxonMobile sure doesn't have any surplus oil capacity.
It's very misleading and intended to give the impression that ExxonMobile has more oil than it really has. That's flirting with the edges of stock exchange rules. In reality, ExxonMobile would have to buy any extra oil it needs from othe big national oil companies, most of which are subject to OPEC quotas. So, in effect, OPEC dictates how much gasoline ExxonMobile can deliver.
It's also misleading because, of the national oil companies I mentioned, only Saudi Aramco has much spare capacity it can bring on-line on short notice. The rest would have to drill a lot of new wells and build a lot of new production facilities, something they're not very good at. And we're not completely sure that Saudi Aramco could deliver the extra oil it claims it can produce. They sure dropped the ball in 2008.
Hey! Has everyone forgotten that 50 years is in the lifetime of my grandchildren? Even my children, now that you think about it.
What is all this BAU crap of continuing to waste it all!?!?
Furthermore, and considering the earlier comment about methyl hydrates lasting 1500 yr, by the time all those FFs are burned up, the earth will be uninhabited due to AGW.
Corporate mentality (if that is not an oxymoron) is strange. Somehow the executives and BODs seem to think that they will keep going after all the people are dead, and the planet is fried (they and their families included)! OMG!
Jeez!!! Let's keep our eyes on the ball, eh? That pretty blue and white one?
Craig
Craig - sadly that's not quit right IMHO. The few board members I've shared drinks with don't think much about that far into the future. Their time horizone doesn't stretch out beyond the point they can exercise their stock options. It's not so much that they don't care about the long term future or expect it to be better than many of us believe. It's just not their priority.
I recomend waching the movie "Cube" from 1997. One of the guys trapped in the cube (I forgot his name) explains to the doctor (who is a conspiracy theorist) why the cube was built. That explanation is very enlightening.
Either we start the 20 yr transition countdown (per DOE) to mitigate very serious consequences of FF decline or we bask in the glory of (per Dick Cheney) our "energy intensive lifestyle" for decades to come.
Too late. We have already finished the 20 year transition countdown and finished basking in Dick Cheney's energy intensive lifestyle. I'm sure, for the people who believed it would never end, it was a lot of fun. I hope these people remembered it fondly as their bank (or the bank who bought their bank after it went bankrupt) foreclosed on their house and towed their SUV away.
This is what happens when the decline begins. It is almost imperceptible at first, so gradual than many people don't realize what is happening, but after a while it will get more serious. How serious it is for you depends on how well prepared you are for it.
N - And he has thus given us all the reason we need to run out and load whatever we have left in our 401k's with ExxonMobil stock. No problem.
'Course it might be interesting to ask him what level he projects "economic demand" to be at at that time. He could be absolutely correct about 5 mmbpd excess capacity if his model involves a 50% demand reduction due to economic collapse worldwide...