| The OPEC Monthly Oil Market report for June | The Oil Drum | Tech Talk - The Oil that Lies Offshore California |
The EIA - JODI divergence Part 2
Posted by Euan Mearns on June 16, 2011 - 8:00am
This is a follow up to the post by Sam Foucher of 23rd May noting that global crude oil plus condensate (C+C) production reported by the Energy Information Agency of Washington (EIA) had begun to diverge from same data reported by the Joint Oil Data Initiative (JODI) to the point that EIA data was now about 3.8 million barrels per day (mmbpd) higher than JODI. EIA data show strongly growing global oil production reaching new peaks in excess of those reached in 2005 and 2008, whilst JODI data do not and are more consistent with a continuation of the bumpy plateau reached in 2006. Why is this important? There are a number of issues at stake. First, the EIA data give the impression that high price has fed into an increase in global production capacity whilst the JODI data do not. The EIA data give the impression of strong growth in the global economy feeding into higher demand for and production of oil whilst the JODI data do not. Finally the cause of the divergence raises questions about reporting standards and why these should vary. It is this last point that is the focus of this post.
This post is joint with Sam Foucher and the data mining and analysis made by long term TOD commenters Darwinian (Ron Paterson) and Web Hubble Telescope (WHT) are also acknowledged.
Background
Reliable statistics are an important part of political economy, be it unemployment, GDP, borrowing, money supply, inflation or energy production and consumption. Accurate understanding about what is going on is essential for appropriate policy response. However, governments have also learned that gathering and reporting statistics can reveal certain inconvenient truths and so may suddenly stop reporting, as the US government did with money supply data when it began to run out of control, or to change the way statistics are compiled or reported as the UK government does with unemployment and inflation data.
As an aside to the main story, it is noted that at a time when scarcity of cheap energy is threatening to topple the global economy, the EIA of Washington has decided to discontinue compiling and reporting international oil production statistics, citing budget cuts as the reason.
The provenance of the international EIA statistics is not clear. Dr Foucher surmised that they purchased data from IHS Energy who also happen to own Cambridge Energy Research Associates (CERA) headed up by Daniel Yergin, long time critic of the concept and significance of peak oil. The JODI data are collected by direct reporting by national governments to JODI.
The divergence
In the last thread, Web Hubble Telescope identified the countries showing the greatest divergence between EIA and JODI in the period since 2008. Most, but not all of these countries show EIA data higher than JODI. Saudi Arabia, Iran, Qatar, Algeria, Angola and Canada showed the largest positive divergence (Figure 1). Russia and Venezuela showed a negative divergence (EIA lower than JODI). Other countries like the UAE, Kuwait, China, the USA, the UK and Norway show relatively good, unbiased agreement between EIA and JODI throughout the period of analysis that starts in January 2002 and ends in January 2011 (Figure 2). This is the crux of the matter. How is it that this latter group, that includes two Middle East OPEC producers, are able to maintain a consistent reporting standard throughout the 10 year period whilst the former group that includes saudi Arabia cannot? As discussed below, it turns out that divergence for Russia and Canada may be explained by bona fide differences in data selection. But the divergence in the OPEC countries are problematic to explain.
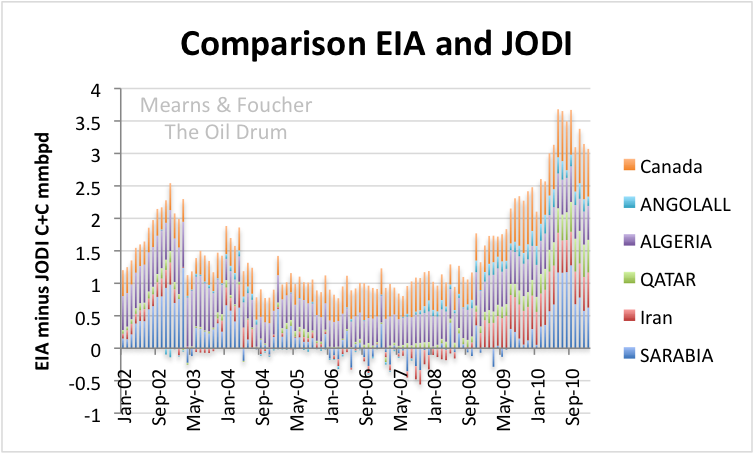
Figure 1 Countries showing the largest positive bias between EIA and Jodi. These countries have tended to always show a positive bias but since 2008 this has grown from +1 mmbpd to +3.5 mmbpd. In 2002 - 2004 a similar phenomenon existed. A detailed look at the data suggests there may be different explanations for different countries.
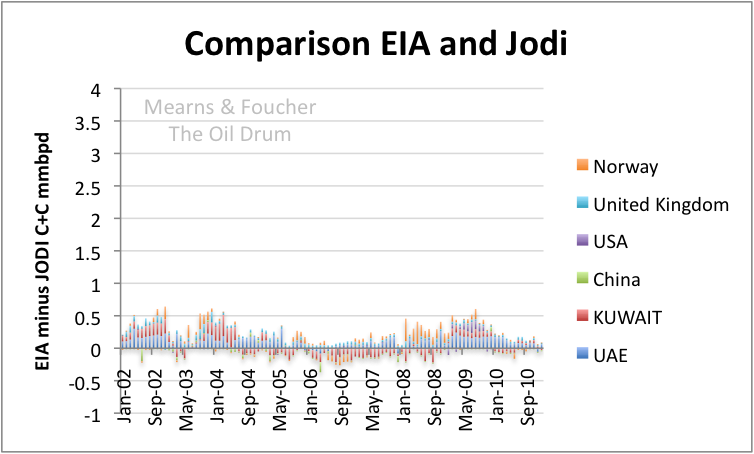
Figure 2 Norway, UK, USA, China, Kuwait and UAE (not chosen at random) show good agreement between EIA and JODI with small biases distributed both positive and negative.
Russia
In the period Jan 2002 to around Dec 2004, the EIA and JODI data for Russia are in perfect agreement (Figure 3). But then there is a step change divergence that appears to be linked to JODI stepping up. It is possible that JODI decided to incorporate a new category of production from Russian reports while the EIA did not. Or that the Russians for some unknown reason began reporting different figures to the EIA (or their agents) and to JODI. It would be preferable if this large 500,000 bpd discrepancy did not exist, but it has nothing to do with the post 2008 divergence that is the subject of this post.
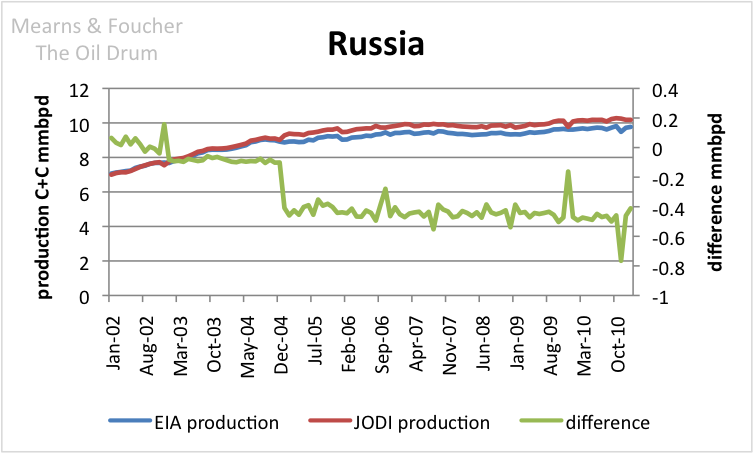
Figure 3 Unlike most countries, JODI data for Russia is biased toward higher numbers since 2004.
Canada
Canada provides an interesting case study since the National Energy Board (NEB) publishes detailed oil production statistics providing a means of comparison with the EIA and JODI data. Canadian production is compounded by the tar sands and two categories of output from the tar sands are reported by NEB. The first is synthetic crude oil which is upgraded bitumen and a second category called non-upgraded bitumen which apparently is exported to USA for upgrading and refining. From about 2005 their is reasonable agreement between EIA and total Canadian production and between JODI and total production less non-upgraded bitumen, JODI electing to not count bitumen as crude oil seems a plausible explanation. Which approach is best is open to debate. This accounts for >700,000 bpd of the discrepancy between EIA and JODI data and part of the post 2008 divergence.
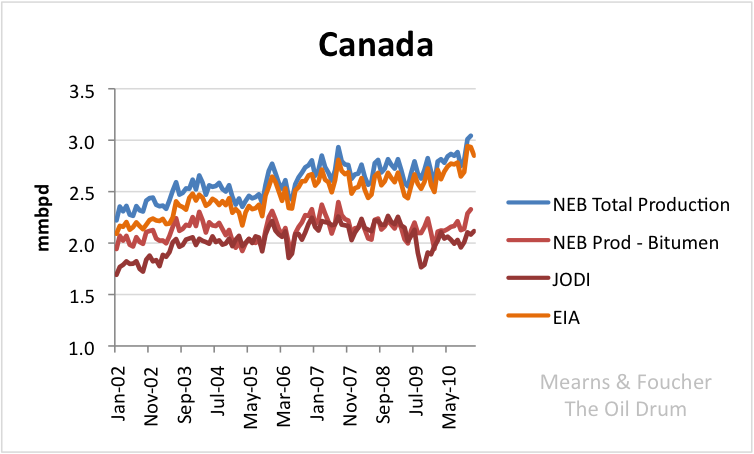
Figure 4 NEB data for Canada agrees best with the EIA data. NEB data minus non-upgraded bitumen matches the JODI data. Thus the significant bias between EIA and JODI in this case may be due to different categories being included. Canada is responsible for a significant part of the overall bias but is not implicated in the post 2008 divergence
Saudi Arabia
From 2004 to 2009, the EIA and JODI data show very good agreement for Saudi Arabia, showing that for a prolonged period in the recent past the Saudis reported more or less same numbers to EIA and JODI and that these agencies managed to report these numbers accurately. But since Jan 2010, the two data sets began to diverge to a maximum over 1 million bpd in June - Sep 2010. A similar kind of discrepancy appears in the pre 2004 data. The divergence may not appear to be much, but added to similar from other OPEC countries shown in Figure 1 the cumulative effect is highly significant for global oil production statistics.
Which of the data sets are correct? Did Saudi production rise during 2010 as shown by the EIA or did it stay flat as shown by JODI? Did the Saudis (Iranians, Algerians and Angolans) for some reason start reporting different numbers to the EIA and JODI? Or did the EIA or JODI start to select data differently for some reason unknown to us?
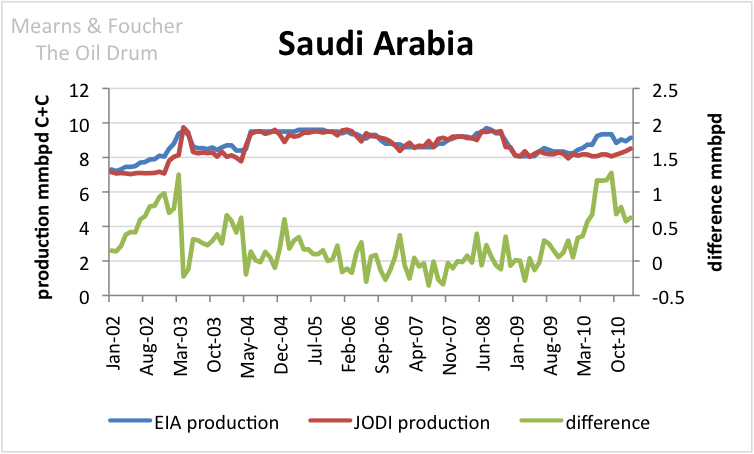
Figure 5 From 2004 to 2009 the EIA and JODI data for Saudi Arabia were in good agreement (difference on right hand scale) but since then have diverged accounting for >1 mmbpd bias by 2010. A similar divergence existed during 2002 / 3.
Note added 16th June
Saudi Arabia 2010 average daily production for C+C:
EIA = 8.90 mmbpd
JODI = 8.17 mmbpd
BP = 8.47 mmbpdThe EIA and JODI numbers are simple unweighted averages of the monthly figures. BP reports C+C+NGL (10.01 mmbpd) from which NGL data reported by the IEA (1.534 mmbpd) have been deducted. The BP number is near mid may between the EIA and JODI and doesn't really help clarify the situation. See also this instructive comment by dcoyne78 from the comments thread.
Concluding thoughts
This exercise has cast some light on what lies behind the EIA - JODI divergence, highlighting that different explanations, some innocent enough, may exist for Canada, Russia and the Middle East OPEC countries. It is the latter that are most enigmatic and will remain a mystery until some official source clarifies the situation. If EIA or JODI staff are reading, emails clarifying what might be going on would be welcome.
It is possible that we are becoming overly obsessed with statistics and data. But on the other hand, it should be a relatively straight forward task for countries to report the same numbers to the various agencies. Since national governments are supposedly reporting directly to JODI and the origin of the EIA numbers are still not clear, I will choose to give greater weight to the former. Doing so suggests that the 2006 crude oil plus condensate ± natural gas liquids peaks in global production still stand and that the recent production peaks from EIA data are a mirage. Printing electronic money doesn't use much energy.
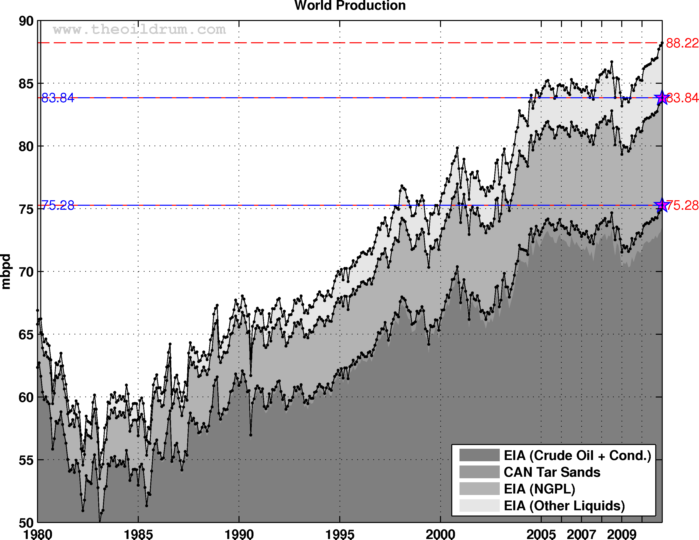
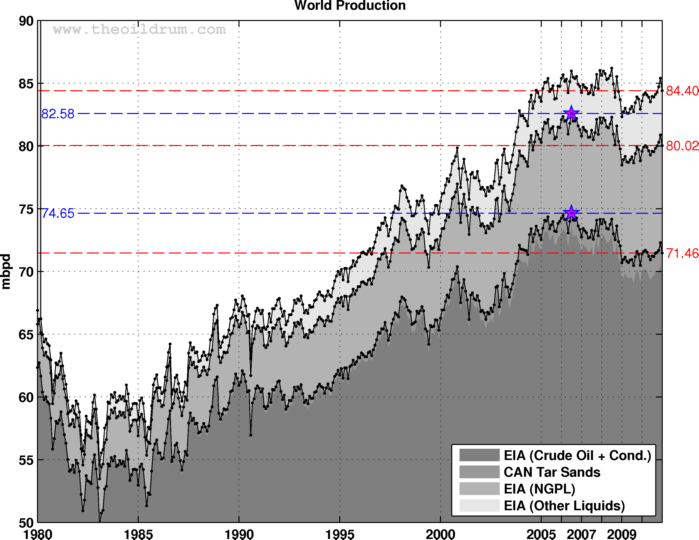
At request of commenter Dohboi. EIA data in top chart. Bottom chart uses mainly JODI data post 2005. The EIA data are reaching new peaks while the JODI data are range bound in the bumpy plateau. data from Sam's original post.
Contact
- Content: editors at theoildrum dot com
- Tech support: support at theoildrum dot com
License

This work is licensed under a Creative Commons Attribution-Share Alike 3.0 United States License.
I'm afraid this discrepancy, along with other evidence of data tampering, makes the timing of PO much more tricky to determine. Any theory needs to have some ability to trust the data that goes into it, or all conclusions based on said data must be suspect.
If the data is suspect then we simply look at other things.
http://www.ubmaviation.com/Press-Office/2011/05/03/559/global-airline-gr...
Massive increase in aviation.
Massive global increase in vehicle sales. Global vehicle miles driven.
Shipping levels back up.
If this is four years post peak, words fail, no wonder nobody takes peak oil seriously.
The aviation article you linked showed the increase in 'seats'. As an example, there could be more economy and less club class 'chairs' on a refitted plane or a replacement one and that would use no more fuel with more seats? Two US large cars could be replaced with 5 Tata Nanos in India and use no more fuel. US cars are definitely down in number!
It isn't reasonable to link the total crude oil supply directly to activity such as miles or seats
There was also a recession starting a few years ago and flight routes were cut back heavily so it seems likely they can increase too 'on last year' without being an increase since four years ago
The production data is the best bet for working out the production even if it is flawed
The cars sold in China are not Tata's I can assure you.
If you do not believe the figures what do you think China daily oil consumption is?
Seats full or empty take fuel, and if people bothered to do some research they would know passenger numbers are higher than 2008 highs. Aviation co2 levels are the highest ever, that takes planes flying more miles.
http://www.executivetravelmagazine.com/blogs/air-travel-news/2011/2/4/wo...
No I realise the Tatas are in India, that was a slip of the brain... I even thought it as I typed it Thank you for pointing that out
I think the article you point to says that some of the increase in passengers was due to increasing the fill factor on the planes. And I have certainly seen that club class routes have been converted to all economy and that gets more seats in. You would have been better really to use your CO2 figure as a guide. Thats more scientific data
I still think it is a mistake to try and work out oil production from end products. You need a clear definition to get a clear argument
Oh, by the way. I don't mean to sound as if I believe in some peak oil date. My interest is the use of a finite resource at a large rate and building a society on that and what happens when a decline sets in. All the related issues of alternative technology. Are you a 'date' person with a scenario in mind?
I do get your point that vehicle miles are not definitive, but taking everything together including oil price, increased production of bio fuels, efficiency, etc that I believe the EIA figures to be about right.
If the JODI numbers were right then world vehicles miles would be far lower as efficiency gains has been very small over the last 4/5 years. If you look at the top selling cars I think you would agree.
http://autos.aol.com/gallery/best-selling-cars/
This article confirms other information I have read.
http://earlywarn.blogspot.com/2011/05/us-fleet-fuel-economy.html
The main bio fuel producers are Brazil and the USA, the massive increase(1 mbd) in US production over the last few years has enabled imports to go down with little effect on miles traveled.
http://www.ethanolrfa.org/pages/statistics#B
http://www.iea.org/techno/essentials2.pdf
You also have to look at the increase in vehicles using Propane and butane, this is why total liquids production is more relevant than just oil.
http://www.post-carbon-living.com/Substitute_LPG_Car.htm
http://www.carazoo.com/article/2801200901/Top-5-LPG-Cars-in-India
Pushed for an approximate time frame for total liquids decline I would say 2013 to 2016.
I did bother to do some research. I couldn't afford the several thousand dollars for the IATA database, but I did find some revealing graphs here: http://www.iata.org/pressroom/Documents/environnment-june-2011.pdf
If you look at page 7, you will note that CO2 emissions are at 2005 levels and below those of 2008 (eyeballing, but still better than anything you've provided). Of course, lower CO2 levels do NOT necessarily mean less miles flown or fewer passengers, as fuel efficiency continues the dramatic improvement of the past two decades (see page 4).
Thank you for the link
I'm not sure why'd you'd expect any different. A 20 mpg car being driven 15000 miles per year can be replaced by four 40mpg cars being driven only 7500 miles a year. Or by six 40mpg cars being driven 5000 miles a years. Looking at the decline in US sales, we can see a lot of that is happening. Over the past 4 years, the US has "lost" 20 million new vehicles sold, compared to the previous 4 years. Mainly because those cars are inefficient. So they were replaced with 80 million more modest cars like the tata nano in India and China. We could easily see global auto sales break 100 million units a year. But that wouldnt tell us much.
I do not disagree that US consumption has fallen, what I am not doing which some people here do is pick and chose the data they want so they do not have to say they were wrong about peak in 2006.
The entire data set makes sense when you read articles as to which countries are using more oil and which are using less.
Anyone who thinks global oil production could fall for 4 years and still have only $110 barrel oil is going to be for a big shock when it really starts to fall.
Well we do not have data for world consumption to 2010 but We do have OECD consumption through February of 2011. As you can see OECD consumption, 12 month average, has fallen by 3.71 million barrels per day since 2005. I think that says all that needs to be said. Sure China and India have increased their consumption but not by 3.71 million barrels per day, not by a long shot.
EIA international Energy Statistics OECD Consumption.
OECD Consumption in thousands of barrels per day.
Ron P.
Concerning data quality and miles flown and seats filled by airlines, some other factors to keep in mind are the promotions used to keep those airliners filled with passengers, the now concentrated efforts by many airlines to fill all seats with stand-by passengers and last-minute upgrade offers to business and first class at steep discounts using computer check-ins. Yet another aspect is many of those flying are internet aware and have read blogs like this one or similar, can add 2 + 2, and realize that they'd better get their traveling done now before it is too late to do so.
"Sure China and India have increased their consumption but not by 3.71 million barrels per day, not by a long shot."
For once you are right, but non OECD are more than India and China.
http://en.wikipedia.org/wiki/Organisation_for_Economic_Co-operation_and_...
When you add in OPEC and the rest of the non OECD the increase is far higher.
http://www.energybulletin.net/stories/2011-04-08/what-%E2%80%9Cour%E2%80...
Saudi alone has gone from 1.7mbd to 2.5mbd in that time.
I am glad to see you are using EIA data, now use the other half which proves what I am saying is correct.
JODI data shows Chinese demand up 3,623 kb/d Jan '05-Jan '11 all on its own.
Its a very interesting chart Ron, especially the way that OECD consumption is flattening. Broad picture is a squeeze 06 to 08, crash and a very limp bounce. In effect OECD has gone down a gear and someone else is nicking our cheap oil:-(
OECD is not homogenous. Some big economies doing OK - Australia, Canada, Germany? Others doing badly - Spain, Mexico, Japan? Others limping sideways on green - US, UK?
I'm a dilettante here but for the sake of clear communication, I offer this:
EIA (Energy Information Administration) not "Energy Information Agency" http://www.eia.gov/
IEA (International Energy Agency) http://www.iea.org/
IEA (Institute of Ecomonic Affairs) right-wing, strict Austrian school economics
I keep them straight this way:
- the administration in Washington, D.C.
- the agency in Paris
- the institute in London
"Anyone who thinks global oil production could fall for 4 years and still have only $110 barrel oil is going to be for a big shock when it really starts to fall."
Look, I'm suspicious of the data, too. But I have no idea which way it is actually skewed. You seem to be sure that you do know as a certainty.
We have actually seen the price per barrel go much higher than $110, of course.
And then, as we all learned, "demand destruction" kicks in. That will likely be the pattern going forward. It is just that no one knows at exactly what price the next round of demand destruction will hit.
So, yeah, we could be on a bumpy plateau for a long time, or even sliding down the slope on the other side, and that doesn't mean the price will go up to infinity. It just means that fewer people who used to be able to afford a gallon of gas will be in a position to pay whatever price it is being sold at, since they won't have any income.
Price is actually a rather hollow measure for all but the most wealthy who will always be able to pay the price for whatever they really want.
For the rest of us, the actual price will become more and more irrelevant, since more and more won't be able to afford it at any price. We need a measure that might be called "affordability." That is going down the tubes for many people for gas, and will continue to do so, as far as I can see, whatever the rather empty measure of its price is.
If price escalate in a flat supply scenario, as I use to say, consumption moves from rich to poor consumers, since they do more usefull stuff with the fuel and we rich people just play for fun with it. In a high price enviornment, we tend to cut down on non-essensials, and price moves will make sure all oil gets sold. hence, consumption moves from rich to poor in every oil price shock from 2008 and forward.
I can't speak for the US, but in the UK just about the only thing we do 'for fun' with oil is fly away on cheap holidays.
Most people drive cars that are less efficient than they could be, but status symbol cars are as likely to be very efficient diesels as they are to be 3 litre or more petrol engines.
In this country , 2 litres is a big car engine.
I should have replied to that statement in my post with the OECD consumption graph but I overlooked it. The word "fall" is relative. As you can see oil supply to OECD countries has fallen by 7.4 percent in just over 5 years. And price has almost doubled over that period of time. I would say that's about right. However just considering supply and price is only half the story.
The economy is the part you seem to be leaving out of the equation. In spite of being in the teeth of the worse recession since the 1930s oil has still risen dramatically. But it could very easily drop to under $50 a barrel... again. If we slide into a deep depression predicted by many, the oil supply could drop to half and the price could drop just as fast.
The oil price of oil cannot be divorced from the state of the economy. Some people seem to think that there is a sliding scale, the less oil the higher the price. Nothing could be further from the truth. People without any income will not buy very much gasoline or other petroleum products regardless of the price.
Ron P.
India is not in the teeth of a recession.
http://www.tradingeconomics.com/india/gdp-growth
China is not in any recession..
http://www.tradingeconomics.com/china/gdp-growth
Brazil
http://www.businessweek.com/ap/financialnews/D9LNQDTO0.htm
Oil is vital and is in pesticides, plastics transport of food and goods, you got to ask yourself a question who will pay more the Indian and Chinese farmer for the diesel to irrigate his crops or the person going for a drive on the Skyline driveway in Virginia.(as beautiful as it is)
We will as long as the rest of the world accepts our terribly overdrawn credit card.
Like a spoiled brat kid charging her lifestyle on her dad's credit card, the party will not stop until the shopkeepers say "declined".
Her dad (our congressmen) do not have the guts to put an end to it.
Things will get nasty fast when the world's shopkeepers have to do what dad should have done.
China's "growth" is not as real as you seem to believe. First, the alleged GDP growth must be offset against reported inflation of nearly 6%. This means that real growth, if it exists, must be in the range of 3%, not 9%. Further, China is building empty cities for which there is no demand. They have built, torn down, and rebuilt entire freeways, to give the illusion of GDP growth. Every week another NASDAQ stock is declared fraudulent and trading is halted and every time, these are Chinese stocks.
The Chinese economic "miracle" is more mirage than not. There is economic progress being made in China but it is not the massive engine of growth that many appear to believe. And if you do believe in it, I strongly urge you to invest everything you've got in that amazing growth machine. Come back here and tell me how that works out over the next 5 years.
India's situation is similar. Again, this is not to deny progress being made there but there is massive distortion there as well. These facts are all widely and readily available to any serious student of the economy or serious investor. Investing in China or India is definitely NOT an easy money game, which you seem to imply by pointing to their "growth". Wading through the frauds, the government distortions, and finding the actual gems in China and India takes a great deal of information.
Finally, you fail to account for the widely acknowledged hand of the Federal Reserve in propping up the markets since 2009. The Fed's own balance sheet has exploded from a few hundred billion dollars to well over 2 trillion dollars. The Fed has loaned easy money far and wide, especially to foreign banks, as revealed by the latest Fed documents that have been released. This easy money has been plowed back into commodities by essentially insolvent financial institutions seeking to reap a windfall in order to replace the capital lost from years of malinvestment and outright fraudulent practices here and in Europe.
In short, your view of the economy appears highly suspect, badly misinformed, and undeservedly optimistic when viewed against actual facts.
If your analysis of actual oil data is as horrendous as your analysis of current economic conditions, then I'd place absolutely zero faith in anything you have to say.
To the extent that the Fed is supporting demand in the US economy by way of its efforts to pull and push cash out of millionaires' mattresses and corporate cupboards, the Fed could be seen to be having some small effect on the price of oil.
But mostly Bernanke is right: the price represents what the market can bear at a time when supply is constrained and worldwide demand for oil is holding.
Oil is everywhere being used more efficiently. It is transporting people and goods by all modes more efficiently. No where is this more true than in air transport. But the efficiency gains are also apparent in waterborne and land travel. Truck transport, rail transport and car transport are all more efficient than they were before oil left its historic price behind. Every time one American decides to leave the SUV at home in favour of the family Honda Accord, and the fuel goes instead to 2 Indians in a Tata, car transport becomes more efficient.
This is what will continue to occur as the supply of liquid fuel slowly, but relentlessly, declines. I know some are expecting one or more major discontinuities because of this decline. So, some see the 2007/2008 crisis driven by this decline, and others, apparently including Jaz, think we haven't seen enough disruption to believe that liquids have peaked and begun their decline.
Personally, I believe we can go all the way down the production curve without incurring economic disaster, although strains and disruptions could well inflict severe pain on some and mild pain on many. For me, the outcome of the loss of oil supply depends on our willingness to listen to what the price is telling us and on our ability to leverage utility from elecltricity.
"The Chinese economic "miracle" is more mirage than not."
Greyzone
Is that compared with the US economy, where hundreds of billions of dollars was lent to people with no jobs to pay for wooden houses that were priced at 5 times what they were worth?
All done by dishonest mortgage lenders and unscrupulous banks under the noses of government regulators. Now all those losses are on government books and will have to be paid by tax payers over the next 40 years. Where $700 billion of GDP is military spending and where the real inflation rate is destroying peoples saving and pensions?
I think you are delusional to think that China economy is mainly a mirage, it has a large trade surplus which is growing in proportion with countries like Brazil, Russia, Iran, Angola and an extended list of others countries who buy real Chinese goods and services in return for real oil, coal, gas, tin, copper and food.
If that is a mirage than the USA with it's mickey mouse triple A rated securities could do with some Chinese mirage.
http://www.bankruptcyaction.com/USbankstats.htm
I would put it to you that in China at least people save to buy things rather than buy things then go bankrupt.
http://www.bis.org/publ/work312.pdf
So even though China has got it's problems when compared to the US financially it is relatively sound.
Is it not the case that reported GDP figures will already be inflation adjusted? Notwithstanding that, China's stock market performance is not consistent with strong commercial growth, suggesting a major part is still state funded infrastructure:
http://markets.ft.com/tearsheets/performance.asp?s=586621&ss=WSODIssue
(best to select interactive chart and max, the chart is really quite bearish)
No doubt that the FED has kept world markets afloat these last 2 years and it will be interesting to see what happens when the green gets switched off in a few weeks time. My best guess is that banks will require higher return than FED and that interest rates will rise and that money that has been pouring in (until recently) to equities and commodities will be diverted back to US treasuries. This will ease inflationary pressure whilst interest rates rise and we get a degree of system normalisation at a lower level than before.
The impact of higher interest rates on overstretched sovereign debt and consumers is the wild card. I expected all this to happen over a year ago and I think we can expect the FED to do all it can to keep the tattered balloon aloft. Obama faces re election.
Yes, Chinese GDP figures are already adjusted for inflation, so if real GDP growth is 9%, and inflation is 6%, then the money GDP growth rate would be 15%. The Chinese are moving to control inflation, though, by turning down their economic growth rate a little. They are deliberately trying to cool down their economy.
A lot of Chinese inflation results from higher food prices, and the US is one of the culprits there, driving up world corn prices by turning it into fuel ethanol.
It is questionable how long China can continue to increase its energy consumption, though, and this may be the ultimate limit on economic growth. China has now replaced the US as the world's largest energy consumer, and they can't just increase their oil consumption by 1 million barrels per day every year indefinitely. Sooner or later it has to come to a stop. However, in the short term they can continue to outbid the US and Europe for the world's oil supplies.
According to a 6 months old calculation by Richard Heinberg they are 3 years (2.5 now) away from reaching the theoretical maximum coal consumption, after there simply is not a single extra lump of coal to yank up energy production. And then we are talking China sucking up 100% of global coal export. Wich ain't gonna happen.
News from abut as long ago is Chinas leaders deliberately trying to put a limit on energy consumption. They know the roof is very near their heads.
Jedi
This is why China intend to massively increase imports of LNG, it increased 66% last year.
http://www.bloomberg.com/news/2010-10-22/china-s-lng-imports-may-more-th...
Also the completion and building of new pipelines will enable them to import huge amounts of natural gas from Turkmenistan, Iran, Kazakhstan Russia by pipeline.
http://www.rferl.org/content/TurkmenistanChina_Gas_Pipeline_To_Open/1903...
http://www.oilandgaseurasia.com/news/p/0/news/10271
In fact they have so many new sources they are driving hard deals with their suppliers and again we see China becoming the biggest trading partner of yet another country.
http://www.voanews.com/english/news/economy-and-business/China-Russia-Vo...
I think you're underestimating the amount of coal that is available to the Chinese. They have 14% of the world's coal reserves, and they border on Russia, which has 19%. They can also import large amounts of additional coal from Australia, Indonesia, and Columbia, all of which are major exporters and are capable of substantially increasing their exports.
Yes. But if you grow grow grow you will accelerate the speed on your way to the rock wall. As I understand it they now face some criticl bottlenecks such as railroad transportations capacity, harbour capacitys and the likes.
Personal note: This round of TOD comments will be the last from me for a week. I'll be off on a vaccation activity and will not come close to a computer, so expect no reply from me for a while.
what is current global energy production vs time ..all sources
that is the graph we need
I think oil futures (macro trends) are the leading indicator of oil (energy) demand. WTI and Brent tell slightly different stories right now. If Brent breaks support at 110 (current 113) then the signs are that the ship is sinking.
http://www.ft.com/home/uk
commodities link
midi, is this what you are looking for?
World energy and power supply (TWh)[15]
.... Energy....... Power
1990.. 102,569... 11,821
2000.. 117,687... 15,395
2005.. 133,602... 18,258
2008.. 143,851... 20,181
Source: IEA/OECD
from here...
http://en.wikipedia.org/wiki/World_energy_consumption
Energy by power source 2008[16]
.........TWh.... %
Oil... 48,204... 33,5%
Coal.. 38,497... 26,8%
Gas... 30,134... 20,9%
Nuclear. 8,283... 5,8%
Hydro.. 3,208... 2,2%
Other RE*..15,284...10,6%
Others... 241... 0,2%
Total...143,851... 100%
Source: IEA *`=solar, wind, geothermal and biofuels
Not quite... imagine a graph with the same time divisions used on this post . There is a degree of ragamuffin disrespect to my comment that Euan then backhanded into the long grass.. BAMMM
my point is, if you read between the line(s), was that the sub-thread had degenerated into an argument in the dark data wise..
Euan points out that at a Macro level simpler proxy indicators should be scrutinized...
The data I have stored on my integrated hard drive (my brain) says the following for the period 2005/2010:
Global net export change: -2 million b/d
Chinese import change: +2 mb/d
US import change: -3.5 mb/d
Meaning that US import losses have covered for most of Chinas increased imports and loss of GNE. Thank you USA for the oil!
The US basically sends the oil to China to kill the American jobs (which previously made the trinkets that make American life so quality). Hence we use the same amount of oil as before, but we pay the chinese $0.50 an hour to make the trinkets. The trinkets are made more cheaply (by design) so we have to buy them more often using up the efficiency gained in reducing the pay of the Chinese workers relative to the previously employed American workers.
Therefore, the markets can call that "INCREASED PRODUCTION". Seems like a stable system.
Wow! And we are all suckers for this system too.
Well, anyone who thinks that oil can be much more expensive than $100 a barrel for a long period while the EU is still rich is going to be for a sucession of small shocks every time the price fall during a huge economical crisis.
I am not sure it matters month to month what final production is reported as. We reached PO in Q3 2004; and we are still there. Production may go up a little, it may go down a little, but until we have firmly broken out of this band (5mbpd lower or higher for at least a year?) we will not able able to call definitive PO. We have always known we would see this sucker in the rear view mirror and nothing has changed. Of course the variance in the data is interesting. We also have the IEA. If JODI and the IEA agree broadly we can ignore the EIA.
"I am not sure it matters month to month what final production is reported as"
Good point. I always thought we should be presenting curves averaged over about a three or even five year period. Everyone knows that at any moment all producers in the world could go all out and produce a new false "peak," but this would presumably be unsustainable (and as I understand it, could harm longer term recovery possibilities in some cases). So, yeah the month to month and even year to year is not all that important for the big picture.
But even an accurate big picture depends on some reliable basis in dependable data.
There is no guarantee, by the way, that convergence of data between two or even three groups insures accuracies. It may make it less likely (or merely less obvious) that some kind of manipulation or inaccuracy is going on. But it does not prove it, in spite of what the lead post implies.
What IS the basis of the IEA data? Does it agree with JODI more or EIA more? If EIA, can we disregard its recent claim that CO2 emissions increased markedly over the last year?...
The other thing that gives me pause in trusting any data coming from the oil patch is the apparent intellectual dishonesty of petroleum geologists, whose professional organization, iirc, is the only established scientific body in the world to conclude (exude? delude?) that AGW doesn't exist.
If they can't get that basic and hugely important science right (and presumably can't prevent their own professional/emotional attachments from coloring their understanding of basic science), how can we trust anything else these jokers come out with (all present company excluded, of course '-))?
Surely, none of the figures for oil production can be absolutely trusted, just as the idea of oil reserves is based on, doubtless experienced, guesstimates.
Certainly cars are selling like mad in the new economies and air travel seems to have recovered, but the price of oil now hovers around $100 and we are now accepting this figure as a norm. Meanwhile the old world economies are very stressed and pushing against an energy ceiling, or so it seems. This is true of all economies of course but we are really conditioned to look at week to week material production figures and extrapolate from there.
The so called Arab spring is the result of economic stressing, just as is the land and commodity grab going on by China around the world. Many countries are suffering badly from energy and food shortage and the west is in hock up to its eyeballs to maintain a semblance of normality.
It certainly is not business as usual and I feel inclined to see energy stressing and the zig-zaggy plateau of oil production we have had for a few years now as a sign on oil supplies peaking.
The BP data base, which counts total petroleum liquids, inclusive of condensate and NGL's, appears to be more consistent with the JODI data base. Here is what the most recent BP data show for Saudi production, consumption and net exports (mbpd, total petroleum liquids):
2005: 11.1 - 2.0 = 9.1
2006: 10.9 - 2.1 = 8.8
2007: 10.4 - 2.2 = 8.2
2008: 10.8 - 2.4 = 8.4
2009: 9.9 - 2.6 = 7.3
2010: 10.0 - 2.8 = 7.2
The observed five year net export decline rate for Saudi Arabia (BP) is 4.7%/year, with four of the past five years showing year over year declines in net exports.
Didn't Sam find out that the EIA is heavily relying on IHS for production data?
Since BP is reporting C+C+NGL and EIA and JODI C+C it would be interesting if someone can find out what Saudi NGL volumes are so we can compare with EIA and JODI.
I think there was speculation that EIA was getting data from IHS - if anyone can confirm?
I enquired at UK DECC who report directly to JODI but did not know where EIA got UK production numbers from.
Here are the BP data less the EIA data for crude oil, NGL's and other liquids*
2005: 11.1 - 11.1 = 0
2006: 10.9 - 10.7 = +0.2
2007: 10.4 - 10.2 = +0.2
2008: 10.8 - 10.8 = 0
2009: 9.9 - 9.8 = +0.1
2010: 10.0 - 10.5 = -0.5
For 2005 to 2009, there was no difference, rounding to 0.1 mbpd, or BP was higher--until 2010. The average difference between BP and the EIA for 2005 to 2009 inclusive was BP up by 0.1 mbpd, and then we swing to EIA up by 0.5 mbpd in 2010.
I wonder if the EIA, because of budget cutbacks, in 2010 started relying on IHS data?
*For countries with measurable biofuels production, e.g. US & Brazil, "Other liquids" includes biofuels.
"Since BP is reporting C+C+NGL and EIA and JODI C+C it would be interesting if someone can find out what Saudi NGL volumes are so we can compare with EIA and JODI."
Hi Euan,
EIA breaks out NGL, for Saudi Arabia (in MB/D):
2000 1.01
2001 1.05
2002 1.10
2003 1.22
2004 1.31
2005 1.46
2006 1.43
2007 1.44
2008 1.43
2009 1.42
2010 1.53
Also changes in refinery processing gain and other liquids have been minor (0.023 MB/D) over the 2000 to 2010 period according to the EIA.
So we have in thousands of barrels per day:
Year BP EIA difference
2000 8483 8404 79
2001 8158 8031 127
2002 7833 7634 199
2003 8944 8775 169
2004 9328 9101 227
2005 9654 9550 104
2006 9426 9152 273
2007 9009 8722 288
2008 9412 9261 151
2009 8471 8250 221
2010 8473 8900 -427
Note the change in 2010
Hmm.. NGL's make up nearly 20% of SA "crude" production, and growing? I hadn't realized that. I'm sure another significant percentage of their exports are made up of oil redirected away from their electricity generating plants, now rapidly switching to N Gas. Those two trends don't seem likely to continue much longer though. Once they're done converting oil generation to N Gas, we should expect there to be a change in slope.
http://www.geni.org/globalenergy/library/energy-issues/saudi%20arabia/in...
By this graph, they're (2009) producing 100,000 GWh / yr electricity from oil, 80,000 from N Gas. 100,000 GWh At 6.1 Gj / bbl LHV, and 45% generating plant effic for older plants in hot dry climate, that's 360,000 bbl / day present use (2009)
That 600,000 bpd flip in 2010 is quite striking. Kind of underlines declining confidence in the EIA data. If you had time to do same for some of the other countries it would be interesting to see. Qatar and Iran are most relevant.
BP EIA JODI Worksheet. Spent an hour or so putting together BP-(EIA)NGLs, vs EIA C+C. This is Open Office ods format, btw. Can upload .xls if anyone's interested.
BP-NGL in excess of EIA for 2010:
EIA > BP:
There are still gaps in the data showing here, it's a pain to get these different sets to match up. The world as shown by EIA exceeded BP in 2004 and 2005 by 5153 and 4296 kb/d, respectively, so something's awry here - this gap closed to 19 kb/d in BP's favor in 2008. How does that work?
Tks for this. Can't open your zip file though for some reason. I think main lesson is that we can't really trust the detail of any of these data sources.
Here's an .xls version. If that doesn't work too it might be a domain issue for you, and I'll try hosting at Mediafire. Or I can email you it if you like - interesting stuff. Even the US was out -505 kb/d on the BP side in 2005 - shouldn't they have ironed out all these kinks by now?
TKS KLR, that worked fine. But I found a mistake in your spread sheet. I plotted BP C+C and EIA C+C together with date on x axis and saw that the curves are displaced relative to each other. In your BP-EIA calculation there is a 2 year displacement error with reference to the BP sheet.
As you pointed out its a lot of work getting this data alined.
Thanks for the catch. Here's a final update. Fixed a couple of other minor problems, too. Sum of countries weighted towards EIA is 2482 kb/d, vs 1060 kb/d on the BP side, for 2010. Looks like this isn't a new problem, 1984 and 1992/93 were weighted heavily towards EIA and BP, respectively. I had to excise the series for the FSU, as it's not in the EIA data; but that should be simple enough to replicate.
KLR, thanks for the effort but it is not much help. Your link gives me "Deposit Files" and ask me to log in with my password. Well, no thanks but I am not a member of that group. I am sure it is a very interesting click but I already have too many passwords to remember and am a member already of too many groups.
Sure wish you could post it to a place that does not require a password to enter, but I understand. Thanks anyway for the effort.
Ron P.
Click on the button "FREE downloading"
TKS KLR. I remember Darwinian once referring to C+C as honest to God crude oil. This picture should be quite clear:
Bottom line is that we had an inflection point in 2005. At the 2002 to 2005 rate of increase in C+C production, globally we would have been at 86 mbpd in 2010, versus the 74 mbpd that the EIA currently shows. This is of course all consistent with what Deffeyes predicted, i.e., a conventional peak between 2004 and 2008, most likely in 2005. So far, slowly rising unconventional production has not been able to keep total crude oil production on an upward slope.
Incidentally, the BP data show the following five year 2005 to 2010 simple percentage changes in Saudi production, consumption, net exports:
Production: -10%
Consumption: +40%
Net Exports: -21%
"Net Export Math" strikes again. Note that their Consumption to Production (C/P) ratio increased from 18% in 2005 to 28% in 2010. An increasing C/P ratio is why net export decline rates tend to accelerate with time*. At this rate of increase in the C/P ratio, Saudi Arabia would approach zero net oil exports around 2024, which falls at Sam's worst case projection (lower limit of 95% probability boundaries) for Saudi net oil exports:
Note that the 2009 and 2010 net export data points are falling right around his middle case projection.
It's hard to avoid a suspicion that the EIA may be trying to hide, or obfuscate, a one-fifth drop in net oil exports from the world's largest net oil exporter. Note that the BP data show that 2010 Saudi net exports (7.3 mbpd) were virtually down to the same level as 2002 net exports (7.2 mbpd).
*Assume production of 10 mbpd and consumption of 2 mbpd (C/P = 20%) and production falls by 0.5 mbpd (5%); net exports fall by 6.25%. Then let's assume production of 10 mbpd and consumption of 5 mbpd (C/P= 50%) and production again falls by 0.5 mbpd (5%); net exports fall by 10%.
Personally, I trust nothing out of Washington. An acquaintance with 14 yrs seniority in her Federal job states she often has to run projects 2-4 times to come up with the desired stats. Supervisors states we don't like these numbers. Run them this way. Long ago I learned to trust no one with an agenda.
Another issue came up with numbers drawn from production data and that from consumption data. This was highlighted by questions some TOD commenters had with BP's report but it also shows up in EIA data for the world.
Notice that the EIA has differences between Consumption and Production as well.
Consumption -- Total Petroleum Consumption
http://www.eia.gov/cfapps/ipdbproject/iedindex3.cfm?tid=5&pid=5&aid=2&ci...
Production -- Total Oil Supply
http://www.eia.gov/cfapps/ipdbproject/iedindex3.cfm?tid=5&pid=53&aid=1&c...
See the figure below. In 2003 Consumption of all liquids was 1.6 million barrels per day bigger than Production.

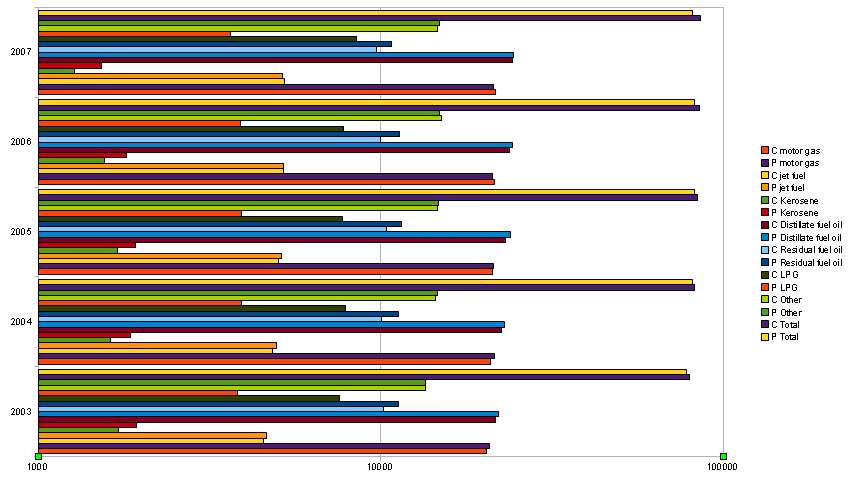
This may be due to differences in accounting of different kinds of liquids as EIA does break the categories down further.
LPG consumption is much bigger than LPG production making up most of the difference very consistently. EIA has consumption leading production in the 2000's largely due to this.
Could they have mixed up the accounting of LPG from oil fields vs LPG from natural gas fields, which may exist in different categories? In production you can keep track of the two but not during consumption?
the traders would say: price is truth. the long terms price trends cannot be disputed.
my thought is that there are four key trends affecting price
- emerging market increase in demand
- ELM and decreasing exports available
- peak oil - flatline/decline production
- the most problematic though is increasing quantity of dollars: inflation in the price
how do you tease these out? which is primary and which secondary?
Interesting claims.
If that is the case, what do you consider the turning point in price in '98 to represent. That marked the last low in price: ~$10/bbl. Some have suggested that this marked the peak in net energy produced from conventional crude globally. Since then, the increasing EROEI has meant that we are getting less total energy from the oil patch every year, so the claim goes.
Of course the peak oil available per capital globally presumably peaked further back than that. Which factor is most decisive here?
I'll make one more point--that I intended to make in my top post, but was called away--then I'll shut up before Euan tells me I'm making too many posts again ;-P
It might be a good idea to add a side by side (or one on top of the other) comparison of EIA and JODI basic graphs so people who have not been following this issue know what the heck you're talking about. I really think it would greatly strengthen an already excellent article.
I agree with your suggestion. Even for a refresher for those of us who haven't committed this to memory.
Also any speculation on where or how IHS gets it's data? I realize such info is considered proprietary, but there must be ideas, otherwise, why would many, including governments, keep buying? I guess the same could be said for BP's data set.
This is the concise version:
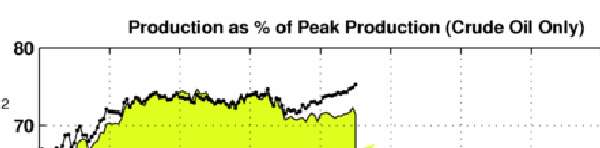
JODI (with EIA sampling) is the chartreuse color.
Its not that simple to do since JODI does not get numbers for all countries and if you recall Sam had to fill in using data from the EIA for those countries not included by JODI. These are Sam's charts from last post, top one is EIA data. Bottom is using JODI data post 2005 (even though it says EIA data). I don't have all of Sam's data and woudl need to see if he can produce the chart you want to se - I agree it would make things easier to understand.
Thanks, that makes the point quite clearly, to me anyway.
And I do appreciate all your work on this stuff, even if we do wrangle a bit on certain other issues.
Best,
Dohboi/John
The new EIA International Energy Statistics with production data for March came out a couple of days ago. They have World C+C production hitting a new high in January of 75,349 then dropping 1,852.000 barrels per day to 73,497,000 barrels per day in March. Most of that drop was Libya of course.
Ron P.
Great graph.
It strikes me that if you took the spike portion of the graph from the last 12 months or so, inverted in, and stuck it into the hole from the previous year or so, they would fit together almost perfectly and you would end up with a constant rate of 73,500.
This is exactly the point made earlier that month by month data do not really give a clear picture.
(Of course, whether any of this apparently constantly fudged data gives a truly clear picture of anything is a different question altogether.)
(OK, I said I wouldn't post again on the thread and here I am back at the first opportunity. So sue me...or preferably not!)
Even if the world production numbers are being skewed, the facts remain:
1. the amount of money leaving this country in search of oil is enormous and growing:
http://cr4re.com/charts/charts.html?Trade#category=Trade&chart=TradeDefi...
2. The actual net amount of oil coming into the U.S. is falling:
http://www.eia.gov/dnav/pet/hist/LeafHandler.ashx?n=pet&s=wttntus2&f=4
Hi all,
I do not want to divert this discussion too far afield, but the issue of determining the correct oil supply figures is part of more general sustainability issue which is the data being used to direct policy accurate enough to prevent serious or disastrous missteps (overshoot)? Without accurate data, policy will always lag years behind reality, which for peak oil, could be disasterous.
Most the effort here on TOD is directed toward trying to prove the points that
1) Affordable Oil and Natural Gas reserves are finite (many doubt this)
2) It is possible that if we don't plan ahead, we won't have enough to transition to something else.
The opponents of these concerns seem to have one basic point: Since you have not conclusively proved when peak will occur, there is no need to worry. It’s like having a back seat driver who keeps telling you your car accelerates towards a cliff, “Since you don't know how far ahead it is, there is no need start planning on when you need to slow down or turn. Just keep going until you see the edge, and worry about it then.” The idea that the industrial nations with trillions of dollars of oil-dependent infrastructure might not have enough time or affordable oil to transition to another energy source does not seem to occur to them.
The only plan "B" I've heard is that the "market" will save us all even though that has not happened yet: Real U.S. unemployment hovers around 15% to 18%, we are potentially heading for a 2nd recession, China is bulking up its navy for "Peaceful" reasons, and we send 300 hundred billion-plus heading toward 600 billion dollars to countries with individuals who use it to support global terrorism. When does the market salvation start occurring?
The key issue is that opponents of peak oil have no better statistical leg to stand on as we both have the same basic data (95% of conventional "proven" crude reserves have not been verified by an independent agency). The fact that if they had error bars on their predictions, they would be measured in multiple decades does not bother them in the least. CERA, EIA & others just present very optimistic pictures, which are taken as the "truth" by Wall Street because in the marketplace of ideas, those that support continuing to make as much money now without concern for the future or self-sacrifice do the best. I too have had bosses ask me to shade my numbers so that they comply with long-range forecasts. This problem could hide peak oil for several years, perhaps as many as 5 or more. This is not a comforting thought.
"It is difficult to get a man to understand something when his job depends on not understanding it." - Upton Sinclair
praggy - perhaps an even more simple approach is to take your tag at heart: who cares if or when there was PO or how much oil there is left to produce or if speculatiors are driving the prices up or if the KSA has excess capacity. The price of oil today IS the price of oil today. At that price is hurting all the economies (except the oil exporters) to some degree.
Of course if you don't understand what led to current conditions how can you fix them? OTOH what if there isn't a fix...this is how it is and how it will continue. But it would allow a lot of finger pointing and blame placing. But that, in and of itself, won't change conditions if, in fact, they are unchangable. No solutions...just reactions. What anyone might change, to varying degrees, is how they adjust to these circumstances.
So the whole discussion can be reduced to one chart: the price of oil. And we all know that chart will be determined by the relationship between supply and demand. Increased demand prices goes up. Global recession and demand drops: prices fall. Pretty dang simple and undebatable, in a pragmatic sense, eh?
Hi Rockman,
The problem with just looking at current oil prices is that it allows for the delusion that the market will make everything better in the future. No need to be concerned about trends or plan ahead. Just press the petal to the metal in your insular, self-centered, unenlightened world, and everything will be great! It wouldn’t be a problem if those who think this way weren't in charge, but they are. This is how they can dismiss the fact that CERA, using their predictive marketing models, said with absolute certainty that crude would not reach $100 until 2030, and then dismiss the 2008 spike and the current prices as just temporary aberrations that will subside in a little while. No reason to think that if the 2030 prediction was wrong in just 5 years by a factor of 3, that their “no peak before 2050” prediction might be in error. It seems that when the river "Denial" flows joins up with the tributary of Self-Delusion, it forms body of water of infinite width and capacity.
praggy - That was my point: the market doesn't do anything or fix anything. The market just is what the market is. And it doesn't matter what the smartest folks in the room project the future curve will look like. The curve/market doesn't care what we expect. It's a living entity that evolves in response to forces some folks think they completely understand.
So once again the conversation allows me to offer my crude thought about models like the one you point out from CERA. Modeling is like masterbation: it OK and can serve a limited purpose but shouldn't be confused with the real thing. The price of oil today is the real thing. Everything else is just a story about it IMHO.
I think that everyone that participates in this site or like me, that reads it for its entertainment and educational value believes that peak oil is upon us and the future is bleak. The numbers don't always add up, we don't know what goes on behind closed doors in Washington or Riyadh, earthquakes occur, recessions come and go, dictators get the boot, rig counts go up and down; essentially we are running out of fossil fuels and not doing enough about it, fast enough. It is not all that complicated, really. Too many people on the planet and too few resources; all you gotta do is squeeze into the fast lane of the nearest freeway at 5 o'clock and sooner or later you are gonna figure out this can't go on much longer. With all due aplogies to many, you don't have to be a scientist to figure it out. And folks ARE beginning to figure that out.
I don't get the opinion that too many people that post on this blog are in denial about peak oil and are not at least planning ahead. In any case sometimes there appears too much bantering back and forth about numbers and graphs and trends upwards and down and whats the point? as we're all singing in the same choir here. There is way too much I am smarter than you, my statistical data is better bickering on this site and its clouding the picture for first time visitors, trust me. Are we biding time on the computer trying to stay in the air conditioning or do we really want folks to know the real deal about peak oil without all the fluff?
To those contributors to the blog that speak about the subject to others, that have the occasional ear of
politicians and world leaders that CAN do something about it all, thank you. I applaud you standing up. The rest of us I think ought to take the message to whomever we can off the TOD board, leave out the end of the world jive the best we can, don't talk down to folks because you think you know more than they do (they'll listen better) and either find some more hydrocarbons like Mr. Rockman does every day or quit using so much of the oily stuff yourself.
You are right. Best we can do is spread the word, but most people (my good close friends included) do not understand Peak Oil. They think generally that the problem is speculation or big business or Arab leadership or whatever. Few understand that this is tragedy of the commons 101 REAL LIFE.
Plant a garden that covers your backyard. Fruit trees and veggies. Repair you home with found or reclaimed items. Stop buying junk from China that breaks in a few months time -- look for durable products that may cost 1.5x to 2x more but last 3x generations. I am a Made in EU/America person as much as possible. Spend money on energy savings items in your car and home. Walk/Ride your bike instead of buying a gym membership.
What else can the commoner do? You cannot get politicians to move. We are screwed.
Yes, we all worship the Rockman for his petrochemical extraction prowess. God Bless him and maybe he will send us all a can of soup when the world gets real ugly.
I talked to my uncle the other day. "We have never found as much oil before as we did last year" was one of the qoutes from that chat. And this is froma guy who gets the "we are screwed" message better than most other I know. This message is hard to pass around.
Jedi, I recently had a conversation with about 5 people on a deep water drilling rig in the GOM about oil prices and oil production and it went much like many previous conversations, badly. Many people in the oilfield (folks that do not keep up with the stats and the news) are under the impression that we have so much cheap oil that we will never have a problem in the future.
There is actually an old oilfield legend about untapped reserves in the GOM and other places in the world. I would like Rockman or anyone to explain this to me if they know how it came about. The legend states that in the 1970's and 1980's oil companies had found huge reserviors in the shallow water GOM and they capped them for futher use in the distant future. The oil companies and the US decided to use foriegn oil first and hold on to ours until later.
Now I use every type of logic and chart that I can to refute this, but it persist. Old drilling and production hands that have been retired for 20 years believe this and the legend has even trickled down to the younger guys throughout the years.
The USA should be hanging onto its reserves and not trying to drill baby drill until they are all squeezed dry. Why worry about whether the EF oil can be produced at $70 or $80 when, in a few years, you can compare it with $170 or $270. By the time oil prices have soared the USA will be dry and have to buy at the high prices instead of being able to fall back on reserves. Makes me think of a expedition that eats all its rations on the way out because they have plenty and leave none for the return trip.
NAOM
"The USA should be hanging onto its reserves and not trying to drill baby drill until they are all squeezed dry."
I'm not sure how I feel about that statement, I'm surely conflicted for many reasons.
I can tell you that in the areas that I have worked we produce every completed well as fast as possible with no regard to the commodity price or the long term damage to the reservior. Our government regardless of party in power certainly doesn't allow productive wells in Federal waters to be capped indefinitely and saved for the future. I have actually been part of drilling wells that the oil company deemed "commercially non viable" and MMS(now BOEMRE) told the operator to complete the well rather than P&A it. They want the revenue now they aren't worried about a rainy day. Then again revenue wise in America it's been raining.
What does it cost to rent a rig these days? After al you must produce money faster than you lose on the lease. I would have produced it at maximum speed my self if it was my well.
Rental cost? That depends what kind of rig your asking about. "Total daily burn rate" is the number my clients look at offshore. It could range from tens of thoussand per day on the shelf to a million or so per day in deep water.
Flowing wells fast as possible can be detrimental to the overall field productivity and eventual profitability of the well for many reasons, but they still do it.
I worked with a production operator once that used to lie to the engineers in their New Orleans office about how he was flowing the wells in the field. They kept asking for more production and he kept telling them that he wells wide open, when he was really choking them way back. He new the problems associated with drawing too hard on a formation and he needed the plaform to keep producing long enough so he could retire, while keeping that platform his home. He also didn't want to be bothered by work over crews on his platform all the time doing Slick line, electric line, coil tubing, snubbing, sand control, nitrogen, water conformance, work-over and re-completion rigs. He certainly didn't want a Plug and abandon group coming out to his second home.
He was simple cajun high school grad(maybe) with 30 years oilfield experience from South Louisiana and he new how to handle an offshore producing field when left to his own devices.
Yeah, I could see many conflicts with it myself. Trouble is that when the markets run dry what will the USA do if it has exploited everything for the short term? It may be raining now but in 50 years, well monsoon season.
NAOM
My conflict is not just, because I work in the US exploring and producing energy. I don't know how we would force oil companies to drill and explore here in order to be ready for the future needs with no production for them to profit now, then again our energy production in America could be more efficient if producers worked together to deplete fields thoroughly, rather than racing each other to the last drop. I think we do need to have as free of market as possible in order for the stripper wells to be profitable.
Yeah, and DBD pressure from the politicos isn't going to help that. I can't help thinking that all this should have been done 30 years ago and it is now too late. If the necessary energy changes had been started back then and taken seriously then the more sedate but efficient industry you talk about would have been more practical with much larger reserves left for the more critical applications.
NAOM
I believe that is the nail/head interface.
They can fudge the numbers whichever way they like for a certain period. What the EIA/IEA can't fudge for any prolonged period is the market price. We can look in the data over the past few years and see clear price signals. When we add this to known megaprojects and discovery rates, EIA production data, JODI production data, IEA data, satelite image analysis, tanker rates, Wikipedia diplomatic cable leaks, target choice in aggresive action by the West, known actions of Chinese entities to secure supply, known rig counts and public pronouncements of many retired and current oilco insiders we have pretty much the whole jigsaw.
Peak oil is real, its unfolding before our eyes, and we need our leaders to get a coherent energy policy in action fast.
Alternatively, we can have no clear policy, no action and ringside seats to the decline and eventual fall of civilization as we know it.
(Anyone else find that once you accept the reality of the reserve replacement issue (and finance implications ala Gail Tverberg), the news makes a lot more sense?)
Yair...Good morning folks, if I could squeeze in here. Rockman I and many other folks here realy appreciate your simple real life way of cutting through the B/S and telling it like it is...I think your missed your calling, you should have been a teacher (LOL).
Would you have any objection to me using some of your words of wisdom as "educational material" on another site? You inimatable dry way of putting things would have more impact as a 'copy and paste' than as a rewrite.
Material would be used strictly 'in context' but some of the acronyms would need to be altered and I would spell them out in full
Thanks, which ever way you reckon.
Scrub - Get after it buddy. Need any tech links just ask. In another life time I actually did teach for a bit. Heaven on earth for the Rockman: a room full of folks who had no choice but sit and listen to me talk for ever and ever. But turned towards the dark side for the money. And in a previous life time before that I was destined to be career military but a back injury ended that plan. So now I just have to be content gouging the public. Hey...if it wasn't me it would that other dirty lying bastard down the hallway.
Yair...thanks ROCKMAN. I appreciate that...I asked on a previous thread about using TOD comments on other sites and Leanan said it was a gray area.
I'm an internet newby, (a couple of years I think) and I had always assumed anything I put on line was in the public domain and out of my control...on a (mostly) civilised site such as this though, I can see it would be common courtesy to ask as I just did with ROCKMAN
Any folks with any comments...or objections to having comments recycled?
Cheers
Scrub - You're welcome. But I said you could use my words but I didn't say they would be free. When I have time I'll send you the address of my Blue Bell ice cream royalty account.
Like I've said before: I am one of those dirty lying bastards. Again, nothing personal...just business.
I notice EIA has new series for offshore UK/Netherlands/Germany; with these series now going back to 1994. I found this when trying to plug 2010 numbers into my existing spreadsheet. FWIW.
Hello,
Let me try to add to the confusion by comparing some EIA and IEA data.
Diagrams are clickable and opens up in a bigger version in a new window
The diagram above shows all liquids supply from OPEC from January 2010 and as of March/April 2011 as reported by EIA International Energy Statistics and IEA Oil Market (monthly) Report.
The figure above illustrates a deviation as high as 1,3 Mb/d in OPEC supply between EIA and IEA.
EIA tended to report higher supplies than IEA for the presented period.
The diagram above shows World all liquids supply from January 2010 and as of March/April 2011 as reported by EIA International Energy Statistics and IEA Oil Market (monthly) Report.
Now the role has been reversed IEA tended to show higher world supply (all liquids) than EIA.
This suggests also a deviation as high as 2 Mb/d for reported supplies from Non OPEC between IEA and EIA.
Common for EIA and IEA is that from January 2010 and as of January 2011 global supply (all liquid) increased with 3 Mb/d while the oil price increased around $30/Bbl from January 2010 and as of January 2011.
Now, if just someone can keep their finger on the print button and see to it that there is plenty of green ink around….chances are that global oil supplies will continue to grow. ;-)
Thanks for adding to confusion Rune. Your top chart has disappeared. Bottom one shows one clear thing - a sharp slow down in world economy. So you think the IEA is printing energy - I guess if they are it would be green energy:-)
Congratulations to all the detectives who have teased out the origins of the JODI/EIA discrepancies. It looks as if another thread is needed to investigate the IEA's figures. For a start is it clear how they acquire their data?
Or a decrease in production from Libya and a decrease in demand from Japan.
To those(jaz, et al) who claim we're all doomers who are unsubstantiated, this graph could be used (and re-used for that matter) each and everytime this argument arises:
Basically, spending per year to get more oil has increased up all the way to this year, yet net oil production has fallen. (The graph is taken from Douglas-Westwood's Steven Kopits presentation before U.S. Congress).
The Peak has happened. Economically? Already. Geologically? We're just about there. Either in 2010, 2011 or 2012. 2015 is the 'longshot'(IEA says there's a 10 mb/d shortfall between 2010 and 2015).
We won't know until a few years, but no more.
But every single indicator points that way. Or take this graph:
From BP.
Gregor has more on this topic:
http://gregor.us/fossil-fuels/2010-oil-story-drawing-down-the-inventories/
As I have said several times, I look at total liquids, this is because Propane and Butane are already used on a large scale as transportation fuel with no adverse economic impact.
Just looking at oil does not give an accurate picture of the economic effects of it's decline in production as other things can be substituted very easily.
http://www.drivelpg.co.uk/the_benefits.php#Fuel_Savings
Then there is compressed natural gas, which again will relieve the demand on petrol and diesel.
http://www.carsonnaturalgas.com/
I do not think a time frame for total liquids peak between 2013 and 2016 to be that unrealistic.
If those in government had my view they would be building an integrated electrified transport system. Especially in countries that import oil and do not have large amounts of natural gas.
Many people on this website said oil prices over $90 would cause a global recession within months, when I disagreed I got told I do not understand economics. Well maybe I understand more than you think, many will be surprise how high oil prices will go before causing a recession.
Mixing natural gas and oil is just plain obfuscation. Peak oil is peak oil and not peak natural gas and derived liquids. Also, natural gas is not going to extend the oil age regardless of the hype about shale and other non-conventional gas deposits. I would say the frenzy of gas to liquids production is a manifestation of declining oil availability to meet demand and not some sort of evidence of BAU ad infinitum.
d - I think you and jaz both have valid points. But, as often is the case, we get caught in the ole bind men feeling up the elephant trap. There are various different but related aspects that get mixed together. As a geologist I tend to just think about flow rates of oil. I don't think much about who is consuming what form of hydrocarbon. PO to me is all about oil production rates. Substituting NG or going to alts is part of the discussion but doesn't have much to do with the decline rates or URR from an Eagle Ford well. Good to chat about it all IMHO. Just have to keep the apple and oranges seperate.
dissident
Simply trying to point out there are many interrelated factors at work, if there were no partial substitutions available their would be no argument.
The higher prices have made some people substitute to LPG and Ethanol etc.
Over time we will see LPG which is about half the price of diesel in the UK increase in price.
http://www.lngworldnews.com/global-liquefied-natural-gas-production-to-r...
There is currently a glut of LNG world wide and anyone running a truck on the stuff is laughing.
With regard to LNG i was thinking more of Nigeria, Qatar, Russia, Australia etc.
http://www.globallnginfo.com/World%20LNG%20Plants%20&%20Terminals.pdf
The only reason LPG is cheaper in the UK than petrol is thanks to tax. There is about 50p per litre less tax on LPG than petrol. If the tax rates were the same then LPG would currently only be about 10p per litre cheaper than unleaded but you would get far fewer miles from that litre of LPG than from petrol or diesel.
Also anyone running a truck on natural gas (LNG or just compressed from a domestic supply) in the UK is supposed to pay the road fuel tax on it.
"Large scale" = approx 1.6% (numbers derived from several wiki sources, to which I turned after finding no information at the links you have provided in various posts)
Moreover, why would anyone think that using these fuels for transportation would have any adverse economic impact? It seems to me that this is a case of using fuels that were previously largely wasted (flaring) because of the increasing scarcity of better fuels derived from oil.
I'm also not convinced that you are correct to insist that 'all liquids' is the appropriate metric when considering peak oil, especially given the efficiency of LPG in uses other than transport. But if you are going to use 'all liquids', you have to adjust the barrel count by energy content and discount the oil and natural gas (since you are freely substituting ng for oil) inputs into ethanol production. In fact, in either metric (oil, all liquids) you should show totals net of oil and other liquids inputs.
The (self-selected) jury is still out regarding the assertion that high oil prices cause recessions. At this point it appears to be a hung jury. There is nonetheless an obvious association between the two phenomena. My own view is that the rate of increase in oil prices is more likely to play a role in the onset of recessions, and not the absolute level of the price.
factchecker
There are many countries where people convert their vehicles to Butane etc and do not tell anyone. So the figures are approximate at best.
My point was converting to LPG(propane/butane) is relatively painless therefore the peak of oil production is not as sever as it otherwise would have been. The higher oil prices is getting more people to use other fuels.
Now using Liquified natural gas is a different matter and is more costly, really needs new trucks to be build specifically for that purpose so they are more expensive. However running costs are less mile per mile.
http://www.roadtransport.com/blogs/big-lorry-blog/2011/01/iveco-launches...
http://gastoday.com.au/news/new_lng_plant_to_fuel_heavy-duty_vehicles/00...
The EIA data does show production of NGPL etc if you accept the figures that is.
http://www.eia.gov/cfapps/ipdbproject/iedindex3.cfm?tid=50&pid=58&aid=1&...
As to your last point I would not particularly argue with you on that but many on this site would.
You have noticed that the price of LPG has been increasing sharply? LPG at petrol stations in the UK is twice the price of 5 years ago. Butane (Calor Gas) for home heating is almost twice the price of five years ago.
LPG (Autogas) Price History
A mass scale up of LPG vehicles worldwide is not possible because the supply simply isn't there. It's probably not possible with natural gas either unless you believe the shale gas hype.
Undertow
I did not know the price increase but not surprised, where do you get your figures for tax on LPG?
Any increase in LPG will help, but with my peak in total liquids between 2013 and 2016 it would not be huge, but helpful.
The LNG situation I think could be a little more positive with increases in LNG from Nigeria.
http://www.lngworldnews.com/nigeria-brass-project-and-nlng-train-7-may-n...
Russia
http://www.lngworldnews.com/russian-lng-production-set-to-jump-over-next...
Australia
http://www.energy-daily.com/reports/Golden_age_for_Australias_LNG_999.html
and several other countries, so will have to see.
UK Fuel Duty Rates http://www.hmrc.gov.uk/budget2011/tiin6330.pdf
Unleaded 58.85p/litre
LPG 31.61p/kg = approx 16.6p per litre (using 1.9 litres LPG per kg - exact rate depends on propane/butane mix).
So that's 42p saving in tax there. Then we have to add the VAT difference. Roughly 12p VAT on a litre of LPG and 22p on a litre of petrol. So that's another 10p difference. So total tax difference per litre currently approx 52p.
As to natural gas, IMHO it is likely that world natural gas production is close to peak.
I see a lot of comments and references to "the price of oil" but what is the price of oil in real terms anyway? I mean $110 today is not the same real value as $110 say ten years ago due to all the changes in inflation, cost per income unit hour, etc..etc.. That is apart from the fact that the real cost to somebody depends on where they live in the world and their income, currency exchange rate, etc..etc..
It would seem that in the USA for example many people are losing jobs or having to take lower paid work, in China the opposite seems to apply, so what does the "oil price" mean to each person or even corporation and Govt.
Maybe if you had some kind of measurement unit for each country that took say the average income wage per hour converted to maybe the price of gold (seems to be historically very stable and convertable) and then log that against the cost of oil you would get a graph that shows the REAL increase in the cost oil which may be even higher than it seems now ??
Propane and butane are used to heat houses and cook. A little is used for transportation.
Depends where in the world you are.
NAOM
BlueTwilight
I guess it depends on your view of a little, but it is making a big difference in some countries.
http://brcgb.co.uk/about-lpg/lpg-around-the-world
"Transport Fuel
The motor-vehicle sector continues to be the fastest-growing market for LPG. Motorists account for about 42% of Australia's domestic LPG consumption and automotive use has been growing at a rate of about 17 per cent per year. This growth has been largely due to the tax-free status of LPG which results in a significant pump price differential compared to petrol. LPG vehicle conversion kits are also exempt from sales-tax."
http://www.world-petroleum.org/index.php?/Technology/liquified-petroleum...
IANGV - Alternative Fuels, CNG, LNG, NGV. Has data for download, including CNG as % of total fleet. Even countries that are vigorously adopting CNG also show gains in petroleum consumption.
From your first link, LPG Around the World:
14 million automobiles using LPG out of ~1 billion is about 1%. Both statistics qualify as a little LPG used for transportation.
Since LPG is produced from both crude oil and natural gas wells, its production has probably not peaked yet, but its ability to compensate for peak oil is rather limited. This is supported by its price. During the 1990's I purchased propane for around $1 / (U.S. gallon). In 2000 the price rose and never came down. Earlier this month it was $3.26 / (U.S. gallon). The price rose to over $4 / (U.S. gallon) last winter.