| Tech Talk - the development of a natural gas market and the GGFRP | The Oil Drum | The Link Between Peak Oil and Peak Debt – Part 1 |
Countdown to $100 oil - a date with history?
Posted by Euan Mearns on July 11, 2011 - 11:49am
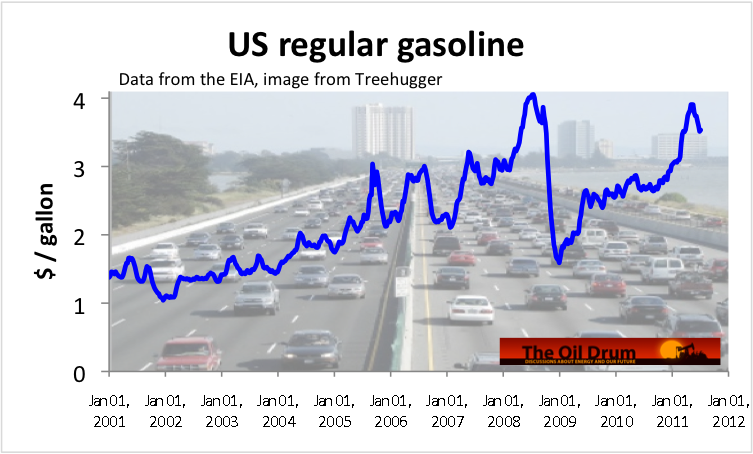
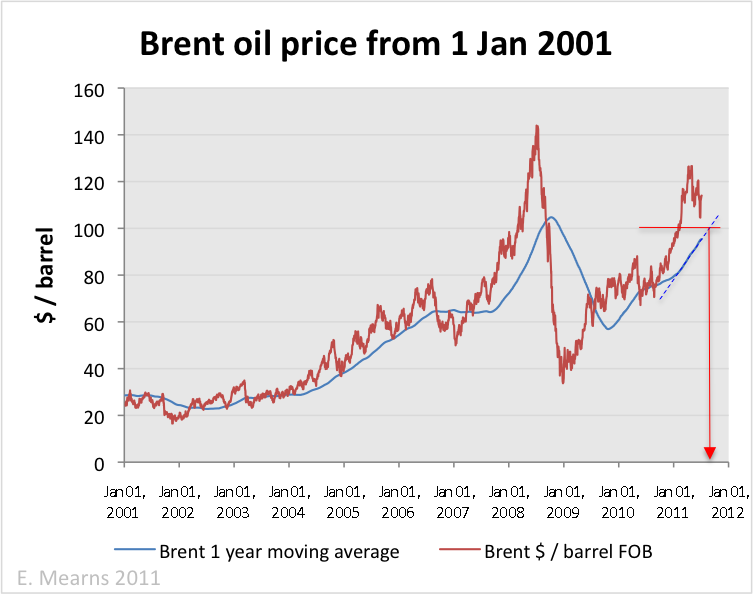
On two past occasions, the average annual oil price has hit $100 per barrel and this has been followed by recession. At time of writing (7th July) the annual average for Brent was $95.4, on course to breach $100 some time in September. Will history repeat itself? Or has the global economy grown immune to high energy prices?
A simple peak oil model
A simple model that has become popular among bearish peak oil commentators is that high oil prices, caused by growing scarcity of cheap oil, may lead to recession. As consumers spend more on gasoline and other energy services such as electricity and natural gas the amount left over to spend on iPads, wine and vacations becomes less, causing recession throughout non-energy parts of the economy. High energy prices also lead to inflation that in a monetarist world should be squashed by higher interest rates though central bankers seem all too aware now that higher interest rates and high energy prices would kill economic growth in many OECD countries and in so doing drive many major, over indebted, economies toward insolvency.
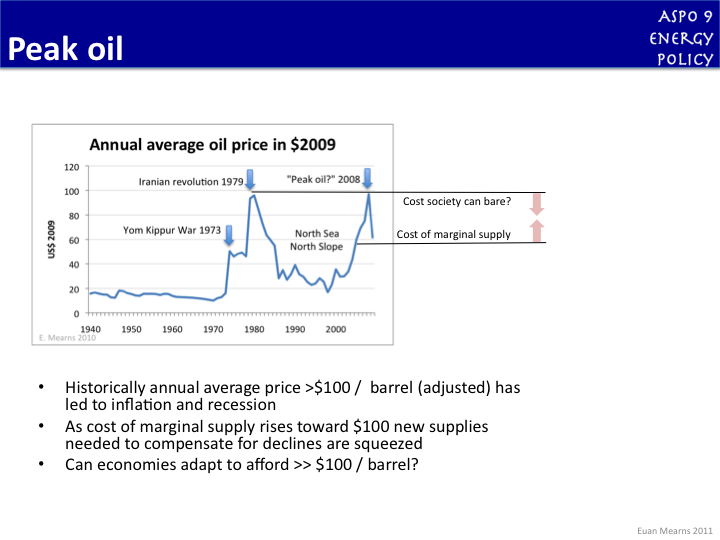
This simple model (simplistic model?) is based on only two data points in 1979 and 2008, but it looks increasingly likely to be tested again within the next two to three months as stubbornly high oil prices (Brent) drag the annual average ever higher toward that $100 mark. Hamilton (2011) observes links between oil shocks and economic downturn in each post WWII oil crisis 1956/57; 1973/74; 1978/79; 1990/91 and 2007/08.
Wider consequences
Indebted OECD countries like the UK (the USA, Spain and Italy) require strong economic growth to produce the tax revenue surplus to pay the interest on existing debts and to pay down the principal sums borrowed. Following the 2008 / 09 crash the return of strong growth that was wanted and needed has not materialised according to plan in many countries and there are just hints that the mainstream are beginning to appreciate the underlying problem, namely high energy prices. But here in lies the Catch 22. Strong economic growth, in an energy constrained world, will inevitably lead to higher energy prices, snuffing out the growth before prosperity can be delivered. Understanding the roots of the problem is the first step. Understanding how to tackle it, if it can be tackled, is a different matter. The recent move by the IEA to raid OECD strategic petroleum reserves for 18 hours worth of global oil consumption was a totally inept approach and futile attempt to tame oil prices that have been rampant ever since.
There are no simple solutions to this problem. But a good first step is to get much smarter in the way we use our remaining oil reserves and energy resources in general to deliver the energy services our economies require using vastly smaller sums of energy to do so.
The future
I have become wary of making forecasts. But as a statement of opinion I believe the world economy, and in particular certain major OECD economies, have slowed in the second quarter of 2011. Initial reports for the UK show growth stagnating at 0.1%. Respected economist and Financial Times Journalist Gavyn Davies also sees the Global Economy Still Weakening. In the UK, this will be blamed on cutting public spending and raising taxes too fast, but the reality is that we as a country continue to live well beyond our means and cannot afford to import ever larger amounts of expensive energy to power the leisure activities of our burgeoning retired population.
Stagnating growth in the UK will in great part be caused by unsustainably high oil prices that are now weakening though still strong - dragging the world economy toward the edge of the cliff. The intriguing story of high oil prices and recession is unfolding before our eyes and I will return to this subject on a regular basis in the months ahead lest anyone should say: "no one saw it coming".
Contact
- Content: editors at theoildrum dot com
- Tech support: support at theoildrum dot com
License

This work is licensed under a Creative Commons Attribution-Share Alike 3.0 United States License.
A couple of charts from UK government showing how weak economy and recovery actually is. The top chart shows that in 2 previous recessions (80/81 and 90/91) the economy had got back to pre-recession level in 3 years. On this occasion the economy has barely recovered from bottom meaning that growth related tax receipts are non-existent and the hole in spending is being plugged by raising taxes - not good for growth. The UK requires strong growth (3 to 5% per annum?) to get out of this hole, but instead it looks like it could be sliding back into recession.
http://www.statistics.gov.uk/cci/nugget.asp?id=2294
The second chart simply illustrates how weak the recovery actually is. High energy prices are tending to snuff out the recovery before it gets going.
http://www.statistics.gov.uk/cci/nugget.asp?id=192
The deficit position is described in the following links:
http://www.statistics.gov.uk/cci/nugget.asp?id=277
http://www.statistics.gov.uk/cci/nugget.asp?id=206
Euan, you said "..In the UK, this will be blamed on cutting public spending and raising taxes too fast, but the reality is that we as a country continue to live well beyond our means ..."
Taxes reduce the amount of money available to either consume or invest thus reducing GDP but this is balanced by allowing increased government spending which increases GDP, and despite all the rhetoric and wailing over cuts there has actually been an increase in government spending and borrowing. Most of the cuts are due to happen in the future. For every three pounds of taxes collected the government is spending four pounds mainly due to the spending spree from about 2003 onwards.
"...I will return to this subject on a regular basis in the months ahead lest anyone should say: "no one saw it coming"...." I look forward to these regular updates.
IMHO the big issue is the excess of debt in most developed countries, watch what's happening with Italy.
Correct!
Unfortunately the only way to continue with a debt based or ponzi scheme economy is to continue trying to grow it.
It seems that the only way this kind of an economic system can continue to grow is if it has cheap inputs of energy.
It is becoming more and more apparent that that cheap energy is no longer in the cards.
Ergo the economy is proven to be a subset of the physical world and therefore subject to natural laws.
The second law says, "there is no free lunch!" The bill for the banquet is coming due and everyone is trying to sneak out of the restaurant through the back door by pretending that they weren't at the table.
The growth and debt based economic model is pretty much dead!
That's twice today I've been told to watch Italy!
Italy and Spain must pray for a miracle
And the problem doesn't just lie "over there". While not as exposed as Europe's banks, US banks also have a piece of this rotting pie:
Bank of America's non-sovereign exposure to Italy climbed to $5.85 billion as of March 31...
As usual, Scandinavia is the better place to be in a crisis. Sweden have toxic bank exposures, but towards the Baltic nations, and they are lots smaller, small enough that we could absorb that blow should we need to.
It's all over BBC World News Business Report along with Spain.
I'm not sure how many folk *last year* told us *this year* was going to be a toughy, but as always, the so-called nay-sayers are left shrugging their shoulders.
There's limits to growth (repeated doublings). Surely that must be obvious by now, but I guess not.
Regards, Average Joe
Throw away the kenesians' unique investiment multiplier and iterate that model, and the problem will become clear.
While the private savings are invested on productive assets (with a hight multiplier), the government money is mostly spent on upkeeping, that is money other people will spend, increasing the agregated multiplier but not being multiplied per se.
While it may be worth increasing the agregated investiment multiplier a little, most of the times it simply does not compensate for a reduction on investiment. Consequently, too big governments make the economy grow slowly, or even decrease if investiment isn't enough to compensate depreciation.
Taxes shift money from some forms of consumption/investment to other forms of consumption/investment. They don't magically reduce the amount of money, that's absurd on its face.
Moreover, the notion that private savings are necessarily invested in productive assets is also absurd. One only has to look at how much private money is lost in any given bubble to see that private savings are often poorly invested in non-productive assets.
Finally, assuming you're talking about personal income tax rates, there is no correlation between GDP growth and top marginal tax rate. Elliot Spitzer put together a good chart demonstrating this fact.
In short, your post demonstrates that you do not understand the basics. I'm sorry to be somewhat combative, but I'm not used to seeing these types of fantasies on TOD, they lower the SNR.
Nowhere I claimed that taxes reduce the amount of money available. Maybe you should learn to read before going criticizing.
They are invested more often than government money. That is enough to explain why taxes have an optimum level and, if highter will be detrimental to the economy.
The reason I didn't specify the kind of taxes should be clear by the context. Since I only talked about spending and investing, it makes little difference what kind of activity is taxed. On other contexts surely there are differences, but not on that.
Again, I'd advise you to learn to read, and next time make some criticism that is actualy applicable to what I posted.
You completely ignored Spitzer's article that is entirely relevant. You're claiming that there's an optimum tax rate, but make no attempt to quantify it. I actually linked to data suggesting that top marginal tax rates don't correlate with economic growth. In other words, if there is an optimum tax rate, history suggests it could be much higher than current rates.
Moreover, it absolutely matters what kind of activity is taxed. Even in the context of spending and investing, we can and do tax both activities - of course the type of taxes matter. Stating that the type of taxes don't matter and that this is clear by context is part of the problem with your posts - you're making vague, unclear, and broad assertions which on their face seem absurd.
I've simply put different outputs from government vs. private sector at a very well accepted macroeconomical model. It is not vague, it is generic, and inherits the strenghts and weakness of that model.
On that point of view, it doesn't matter the kind of taxation. All that means is that the model is not complete, of course at the real life the kind of taxation is quite important. But, anyway the model seems to hold to some extent. Also, I'd advise against generalising data about a subset in economics (or better, test your generalisations), there are often some very unintuitive hidden relationships.
The result wasn't very good. There is ample space for criticizing it. In fact, now that I've written it, it is clear that it should be completely revised, or maybe trown away. It is also not clear at all, it is quite ok that you didn't understand it, It is quite probable I would not have understood it either if somebody else did write it. It is just not ok that you pretend to understand.
Public flows of money will necessarily follow different paths than private flows, with significantly different weighting for political and economic expediency.
I am no economist, but even I know that the velocity of money is as important as the magnitude.
I think it is a mistake to combine private debt of individuals with those of corporations and the wealthy. Individual debt tends to funnel money to banking interests to the long-term detriment of the borrower. The lender tends to accumulate value over time. I'd put money-lending just one step above taxation in terms of detrimental and perhaps unintended consequences.
I don't think you can look at investments in bubbles as being the individual's fault alone -- they're just the ones left holding the bag. You can blame the losers in a Ponzi scheme for losing all their money, but that doesn't absolve those who made out like bandits.
Presuming that "the basics" says that gov't workers and private workers are the same is patently false. They may spend money the same, but where their money comes from has far-reaching effects. You can't talk about macro econ without including group psychology in the mix.
Work hard, make something of value, and sell high should be the goal for everybody possible. Expect to pay high as well. Investing efficiently to produce multi-generational value is the only true way to raise standards of living. Trading dollars around in a daisy chain of pointless services with cuts to the bank and the taxman and each hand-off is unstable if the input flows falter. Having a lot of short, robust chains of value development is better than long, frail chains. Minimizing overhead cuts is good too.
Money is just a modicum of exchange. Taxation isn't "shifting money", but taking labor and assets from one person and giving them to another.
It's amusing that you distinguish between individuals and the wealthy. In any event, are you really arguing against home mortgages or car loans on principle? I agree that personal debt can be bad, but there are cases where it makes sense.
I never said that government and private workers are the same, but instead that breaking it down as "government" and "private" is itself wrong. Some government activity is beneficial, some private activity is not. Everybody benefits from an effective justice system and effective law enforcement. On the other hand, I'm still trying to figure out how high-frequency trading algorithms benefit the economy as a whole as opposed to only helping the small group of people allowed to do it at the expense of everyone else.
"Taking labor and essets from one person and giving them to another" is just a rephrasing of "shifting money". We've now devolved into the semantic equivalent of arguing that "pro-choice" and "pro-abortion" are different.
Euan, good post!
There is no doubt that growth in energy prices slows economic growth (for net importers of oil/energy) as expressed by GDP.
Through the last 2 - 3 decades economic growth was "supercharged" with year over year growth in total debt as illustrated for the US in the chart below.
For some economies total annual debt growth was well above 10 % of GDP!
Debt growth temporarily allowed compensating for (and also partially caused) the compounding effects from growth in energy prices and energy consumption.
As I see it, many countries are now at a (or has passed the) point where the economic participants (private, corporate, public) has reached debt saturation. The emerging slow down (and possible reversal) in debt growth will in my opinion also affect near future demand and prices for oil and other energy.
Change in debt growth will in my opinion be the dominant force for the near term economic development (GDP) and thus demand and price support for oil/energy prices.
Present high oil (and energy) prices also slows GDP development and may at some point in the near future become subject to the gravity from temporarily declining demand that feeds weaker oil/energy prices.
Structural high unemployment will both put an additional strain on the economies as output and the tax base will shrink and also reduce demand for oil/energy.
Lowered oil/energy prices could in the near future produce a false signal to the economic participants as this obscures the fact that many new discoveries (fields) now require a break-even oil price of $60 - 70/bbl to become economic.
Rune,
That is a terrific graphic. It illustrates a thought thats been bouncing around my head--that during the mid-2000s the banks had a license to effectively "print money" through securitization of assets that had no underlying value--subprime mortgages. Once the value of those securities was shown to be zero, the government had no choice but to print money to avoid a deflationary spiral and economic collapse, as your graph shows in 2008. The point is that those who castigate the Fed for printing money are aiming their fire at the wrong place. The banks created the debt in the first place; QE1 and QE2 were required to prevent that debt (and the global economy) from spiraling into oblivion.
Of course, peak oil makes this all a pointless game to a certain extent, but it remains important that we place blame where its due--it was the banks and not the govt that created our paralyzing debt-load.
Energimann - great chart, though I'm not sure I fully understand it, something seems missing. If you are charting growth, then it is clear that yoy mortgage growth stalled in 2008. What happened to it after that - did it go to zero and stop changing like Saudi oil reserves? Presumably it turned negative?
The extent to which US government has stepped into the the breach to protect the land of the free is quite clear.
CW
Cry Wolf.
What the chart is showing total year over year growth in some debt items and how big a portion of US GDP these represented for the respective years.
What is not shown in the chart is GDP growth, GDP grew most of those years.
After 2008 government increased deficit spending to take over from debt growth by private sector. Down payments, defaults and foreclosures in private sector saw to it that these sectors went “negative” as from 2008.
-Energimann
The UK is facing worse energy problems than simply the price of oil. We have moved from being energy independent to a net
importer of oil, coal, electricity and over 50% of our natural gas consumption. Oil and gas production continues to fall at about 7% a year. Our natural gas imports alone cost at spot price) over £1 billion a month. In this environment, our government has resorted to quantitative easing (printing money) and near - zero interest rates, so it is no surprise that Sterling has fallen relative to the dollar, making our energy imports even more expensive. We are cutting our natural gas and oil consumption through a mixture of increased coal burning and 'demand destruction'. Part of it is driving more fuel efficient cars, more is driving less.
We are curtailing imports of tat, due to reduced 'disposable income', but the full effects of government funding suts has yet to bite. The government is praying that the economy will pick up enough to soften the unemployment surge that cuts will cause, albeit that the new jobs will be lower wages than the old ones...
As a policy of managing depression, it could be worse. The pain is being more or less evenly felt by 90+% of the population. If this continues, the economy will continue to decline to the point were people adapt to higher energy prices by consuming less. How well they adapt depends on government policy, they are making the right noises , but are as always delivering a lot less than we need towards a low energy society.
One day, we may reach the point where we can compete again with the developing world economically, but we will be a lot poorer by then.
The 10+ not feeling the pain are the rich. They need to keeps their heads down.
The 10+ will eventually feel the pain, although not in the sense you or I feel it.You can still eat what you like and drive anything you want so long as ayou still have a few million-but maybe some of them will have to give up the jet or the yatch before too long.
Is that "tat" a typo or an acronym new to me?
My personal opinion, backed up by extensive reading, is that printing money must always have a strong inflationary effect-which might of course be counteracted or offset during a deflationary period -up to a certain extent.
I believe the money already blinked into existence is responsible for serious inflation already;apparently the powers that be are in agreement, as they appear to be very reluctant to push the stimulus button again-for the time being.
Later on, they will push it again-and again-as the overall economic situation grows ever more difficult.
Right now, we are burning the cheap stuff lying around to stay warm-the old furnuture in the attic, the lumber left over from building the deck, etc.
Later on, we will be burning the good coffee table , and sometime after that, the summer clotheing, and eventually, even the pics of the family-this of course presuming our current govts stand long enough.
In the event of a revolution, strong men might be able to create a stable currency, by forcing austerity on the population.
tat - old English expression - cheap junk. Derived from 'tatting' cheap cloth made from recycled threads and used by poor people in the 18/19th centuries to make clothes. Very poor quality. Tatty = scruffy = worn out at the edges = looks a mess.
[edit]
D'oh. I'm confusing tatty with shoddy.
mac - You got me thinking about inflation early this Monday morning. Thanks for nuthin! LOL. First, I don't put much credibility to such numbers put out by anyone especially the politicians. But in a strictly qualitative view, we have s suffered huge inflation over the last several years. And I'm not just talking about oil (which is conveniently left out of many estimates of "inflation".) But simplistically put, inflation is the erosion of purchasing power. Why are Americans unable to stimulate the economy by spending...spending that has always been the backbone of economic recovery?
How about the sub-prime mortgage meltdown for one? Literally $trillions were lost in homeowner equity as well as revenue to the mortgage industry. And what fueled this eventually burnout: $trillions suddenly appearing in the system which allowed the whole shaky structure to develop in the first place. That process clearly brought about huge inflation in housing. And now that loss of increased value has a double whammy.
Here's another easily identified source of the loss in purchasing power: losing one's job. Over the years I've noticed a rough correlation between how much money a person makes and how much they spend. Rough, of course, since folks do have a habit of spending more than they make thanks to credit cards and home equity loans. Of course, they have a good role model: our govt.
I think you get my point now. If a valid definition of inflation is the loss of purchasing power then, despite what low number some "expert" offers, we've seen tremendous inflation in the last 5 years or so. Not only for the public but for almost all of our political systems. Maybe we should go find all those WIN buttons ("Whip Inflation Now) that President Ford had made and pass them out. Yes...that's the ticket....that'll do the trick.
There's been various debates as to whether the US monetry policies will lead to signficant inflation. That's pointless IMHO: it already has. The only debate left is whether the new policies make it better or worse. But lack of purchasing power, by both people and businesses, seems rather obvious right now. The gov't efforts to incease purchasing power by dumping 100's of $billions into the system seems to support this view.
If the federal government wants to increase the purchasing power of Americans it needs to give money to Americans. Giving money (or interest free loans) to global banks and global corporations will spur invests in China or Brazil or any number of low cost countries. It will not create investments in the US. "American" companies are no longer bound to North America they are global. It is a global village so if you want to make one specific region of the world richer you have to apply the money locally.
"Of course, they have a good role model: our govt."
Rockman, if you look at Rune's graph above its clear that the private sector debt binge preceded the government's debt binge. Blaming govt doesn't fly in this case. Of course Rune's graph doesn't go back far enough to capture Reagan's debt binge so if you wanted to blame him I wouldn't utter a peep of protest.
nate - Yep...Rune's chart is really dramatic. But lets not forget it was the govt that forced mortgage companies, via laws passed by the Congress, to make all those risky loans. And who created the monies that bought into all that debt? It wasn't the private sector...they just took the debt on to their great eventual horror. And they didn't ceate those mortgages either. The financial sector and the govt were co-conspirititors in that effort. I assume you've heard of Fannie and Freddie...the owners, at last count I think, of 75% of all US mortgages. And there's some big chunks of other private debt out there: if I recal correctly there's something close to one $trillion in college loans outstanding. I found that hard to beleive but that's what the story claimed. Yes...part of the private debt binge you refer to. But debt provided (and greatly encouraged) by the govt and the lending insitutions it backed.
And President Reagan didn't create that debt...the R's and D's in Congress did. But, of course, President Reagan didn't try to stop them. And don't throw back Presdinet Reagan's changes in the tax code: fed tax revenue increased afterwards. The problem was that Congress spent that increase and a whole lot more. But for the record, I was no bigger fan for President Reagan than I am for President Obama. Different rhetoric but cut from the same bolt of cloth IMHO. Both beleivers in not only BAU but growing the system.
And besides look at your own words: private sector debt binge vs. govt debt binge. So is one excusible and not the other? The private sector was just greedy and foolish. IMHO the govt knew exactly what it was doing and the risk involved but had its primary goal, getting re-elected, setting the agenda: .
Rockman, this is obviously territory in which neither of us are experts but why should that stop us:)
"lets not forget it was the govt that forced mortgage companies, via laws passed by the Congress, to make all those risky loans."
Krugman has a persuasive case against the idea that Fannie, Freddie, and the Community Reinvestment Act had anything to do with the financial crisis. Fannie and Freddie may do a huge % of mortgages, but they do actually have some standards. Meanwhile, the banks were creating the sub-prime NINJA(No Income No Job or Assets) loans that caused the crisis.
http://krugman.blogs.nytimes.com/2010/06/03/things-everyone-in-chicago-k...
"And who created the monies that bought into all that debt? It wasn't the private sector...they just took the debt on to their great eventual horror."
I think that this confuses securities with paper money. Mortgage securities were created by the banks, chopped up into "tranches" and sold off to investors. They expected to get paid back, with interest, by the people who bought the houses. No money had to be created to allow this transaction to occur--it was an expectation of acquiring future $.
When the financial crisis hit, and it turned out that the mortgage securities were worth zero, the government had to print money and give it to the banks to keep them from going under. Now, you can blame the Fed for printing that money, but I think its more accurate to say that the banks created the debt based on ludicrous assumptions, couldn't get paid back, and then had to get the Fed to cover for their mistakes.
For a great inside view of the story of the banks, greed, and sub-prime mortgages, Michael Lewis' The Big Short is hard to top.
The thing about the Government forcing banks to make risky loans to poor people is 99% propaganda. During the housing spike the percentage of loan originations from Freddie an Fanny went way down. They and other banks joined the party (cut standards) in order to drink of the origination fees. In general the dafault rate increases with the income of the real-estate buyer, i.e. many of the bad loans were to wanna-be-rich via flipping, not to poor minorities who wanted to own a house.
A lot of memes that are convienient for one ideology or another are endlessly repeated, because repetition creates truthiness (i.e. a lot of people begin to unquestioningly believe it). Its sort of the way to create one's own truth. In this case it was designed to advance the cause of the oligarchs.
EOS - Apparently CNN has become one of those right wing extremist organizations putting out all that propaganda. Maybe Rupert owns them under able.
http://money.cnn.com/2008/01/30/real_estate/congress_subprime.fortune/
"The fact is, neither the expansion of the subprime market nor the proliferation of exotic interest-only or option-ARM mortgages would have been possible without federal laws passed in the 1980s. Says Patricia McCoy, a law professor at the University of Connecticut: "Congress never likes to blame themselves, but in this case there's no question they bear some of the responsibility." Indeed, only now is Congress talking about enacting some tougher regulations that they could and should have pushed through 10 or 20 years ago."
"Apparently CNN has become one of those right wing extremist organizations putting out all that propaganda."
Read the article you linked to. You've changed your argument. First it was that Freddie and Fannie created bad mortgages, now its that the government stopped regulating the banks in the 1980s and let the private sector create bad mortgages. Well which is it?
One thing I don't understand about the conservative argument on this. They blame the government for not regulating the banks, and then go and vote for the party that wants absolutely zero regulations on banks. So we get less regulation on banks which is, of course, more evidence to conservatives that it is the government's fault.
nate - Don't hold your breath if you think I'm going to defend the R's. I gave up the divide and conquer tactic of the R/D machine long ago. From a fiscal standpoint they play the same game despite all the misleading rhetoric. Both parties fully supported the efforts to substitute the artificial growth of the housing market for the real thing. In the end they have an identical agenda: get re-elected. And in the absence of the ability to create honest but less robust growth they went for the facade
Perhaps there has been a misunderstanding. ROCKMAN may have thought the laws referenced had to do with encouraging (in reality: not demanding) loans.
The politicians dismantled controls put in place after the great depression at the request of their corporate clients.
ACORN had nothing to do with it. They got destroyed.
The laws allowing media and news monopolies has destroyed even the possibility of rational discourse. The value of TOD to me is the current availability of a broad-spectrum view.
kal - I try not to trust my memory so I'll defer so anyone with facts. But I do recall stories that the govt REQUIRED a certain percentage of new loans to be subprime. It wasn't a suggestion but I requirement. Perhaps I'm not remembering correctly but it seems as though it was a very big story at the time.
Rockman,
While these crazy laws existed and Da Guv decided to go candy andy on the banks, Europe was doing the same thing. And China is doing it as well. The widespread coordination was enabled by one thing. EASY MONEY. Without that no one in there right mind would loan subprime to people without jobs in crumby neighborhoods.
I walked from house to house wondering where these people came up with that kind of money. We are all not brain surgeons.
I see the housing scheme as a political cover-up of the dead economy in OECD and nothing more. Banks and Guv working in synchrony together. It was hashed out ages ago as the brake applied one step past the FED raising interest rates -- maybe it was the super-secret backdoor kill switch.
Another way to see it is a resource war fought with financing instead of guns. America was trying to hoard building materials faster than Europe and faster than China until POP GOES the economy.
The deepest conspiracy would be that the Banks knew very well that this was all going to explode. It was engineered to explode. They need consumption of oil to go down among the low-lifes like myself. In order to do that you need to take the people's money away. The best way to do that is with a housing bubble after all. It worked like a charm in the Depression.
And here we are.
Rockman -- Watch http://www.youtube.com/watch?v=UC31Oudc5Bg "Subprime Banking Mess"
At about 2:30 onwards, it pretty much tells it all.
Lots of players in the Banking/housing crisis. Was it orchestrated or did it all happen organically?
I do think the whole idea that poor people caused the crisis is kind of funny logic though. Poor people were used by the banks and salespeople to collect fees.
What a beautiful get rich scheme. Your typical mafia scheme could not have been more elegant.
One needs look no further for the cause of that whole fiasco, and the present crises, than "Sen. Phil Gramm (R, Texas), Rep. Jim Leach (R, Iowa), and Rep. Thomas J. Bliley, Jr. (R, Virginia), the co-sponsors of the Gramm–Leach–Bliley Ac",
It was deliberately designed to a) allow banks, brokerage houses and insurance companies to merge (mainly in order to legalize the illegal merger of Citibank and Travelers Insurance), resulting in the emergence of several institutions "Too big to fail". b) allow generation and sale of financial derivatives "with specifically no interference by SEC, regardless of motivation".
Those three Republicans, and the Republican congress which forced it through with a sufficient majority to override a presidential veto if Clinton had tried, are basically wholly responsible for the subprime crisis and the crises of bank solvencies (banks which failed for having invested in the derivitaves - Iceland, Norway etc. etc.) which followed worldwide.
Many "commissions" have since been paid to "prove" that wasn't the problem, but they're all just part of the system.
There are perhaps two sides to this coin, but both are due to relaxed lending standards, and the severity is worsened by selective default and job loss.
The net result, more expensive housing, predominantly impacts the poor. A landlord can benefit from increases through rent increases -- a low-end renter or buyer is priced out either way. In the crash, landlords and owners alike suffer.
I think a key difference is that for the wealthy selective-default is a business decision, while for an unemployed homeowner it is another gut-punch while down.
Laxness of regulation and slanting toward big banks falls squarely at the feet of Congressional committee regulators, including the always-indignant though perpetually-involved Barney Frank.
Funny how the system works -- those who don't need lower rates are the only ones who can get them. Why don't FM and FM unilaterally cut rates for homeowners, while foreclosing speculator-owned homes? Why does all the risk today fall on the borrower, and not the lender?
Again, it's easy to say they shouldn't have borrowed so much, but to me the buyers looks like amateur marks at the poker table, being coached in turn by one shark while being fleeced by his partner.
EOS, I would say that the Government caused the housing bubble by having artificially low interest rates during the early 2000's and lets not forget the "ownership society" just to name a couple of things. Then the housing bubble allowed politicians of the early 2000's claimed victory over that recession and they got re-elected.
If it were not for low interest rates at that time, banks could have made money in other and safer ways. Now we have extremely low interest rates searching for the next bubble, so politicians of today can claim victory over this recession and get re-elected.
First they used what you say -- low interest rates -- produced by the FED. Then the economy sagged. So they tried no down payment and the nasty subprime trickery. Those mortgages are still popped. Met a gal in one that will pop in December. Yes the Banks are totally in the Black. Don't you worry about them. ;-) She's gonna walk. More power to her.
Hello (to you all)
In my view there is one interesting aspect of private sector (year over year) debt growth which I have seen little mentioned. A private person that takes upon him/herself more debt uses this debt to purchase one or several items…a home…a car…a boat….a vacation…an education etc.. which means someone in the receiving end gets paid. The persons that get paid pay taxes or have paid an import fee (if applicable) and/or other taxes on the item sold.
This illustrates that a portion of the private debt ends up with the public (federal, state etc.)…how big a portion varies amongst states and countries.
Bottom line here is that the public coffers also benefits from the private sectors ability/willingness to take upon debt.
So logically public income will decline when private sector gets into debt saturation and cannot provide for year over year debt growth…………….Did someone mention............ raise the taxes?
Yes. Deficit spending (either private or public) has a stimulative effect. Thats why despite rotten basics the aughts (early 2000's) economy was able to grow. But, having taken on an unsustainable level, both public and private sectors are not cutting back. The problem is that means lower demand from either sector. It looks like this process will be ongoing for several more years.
I think the credit expansion we have seen can be traced to the repeal of the Glass Steagall act in 1999. If so, then "the government" is to blame.
http://en.wikipedia.org/wiki/Glass–Steagall_Act
"I think the credit expansion we have seen can be traced to the repeal of the Glass Steagall act in 1999. If so, then "the government" is to blame."
Yes, years of bankster lobbying and campaign contributions finally paid off and glass-steagall was repealed. But this is not the fault of "the government". Its our fault (i.e. the public) for letting the banks take over the government and change the rules to suit themselves. When you say "it was the government's fault" conservatives twist that statement and convince Joe Q. Public that "government caused the problem, thus we need less government, vote GOP!" The GOP's only answer is to let more foxes into more henhouses.
And the Dems only answer is to build bigger hen-houses.
Liberals say we eat to much meat, and should establish cross-species sensitivity training and vegetarian meal programs for foxes and chickens alike.
Libertarians don't much care for chickens or foxes, and are content to let them work out their own issues once you sell off the coop and get out of the business.
Keynesians calmly point out that once the chickens run out you can substitute foxes.
Doomers say you should shoot eat the chickens before somebody else does.
Cornucopians say "Eat all you want, they'll make more!"
Conspiracy theorists say the fox works for the IMF and the coop was infested with bugs during manufacture in China.
Conservatives say just shoot the darn fox, but only if you agree to cut the number of chickens first.
Who says Da GUV and Da Banks are separate entities? How does a proper mafia/empire work? ;-)
I would say that OECD nations all collude with the banks and billionaires to make the laws. Saudis are in there too with the US guarding there place with its military. The whole thing was engineered years ago.
They make decisions together. It is all a game--a sideshow on TV--watching politicians go nuts about bailing out the banks. They were given a script and this is the show we are supposed to watch while the Masters continue to degrade the dollar the sneaky way through inflation and other financial tricks. The commodities are the lastest financial scheme to inflate the cost of groceries--since people need to buy food after all.
I made plum jelly from a tree in my yard for 15% of the cost of the price at the store. There is no way that price is real. Are we supposed to believe that jelly costs $4 for 10 oz. LOL.
Anyone want a jar? I'll sell it for $4 for 10 oz.
Whether or not the money vanishes with less spending is not the issue. The money is going to vanish by reduced purchasing power and the various methods to erode the finances of the citizenry will be creative but will tend to favor the rich at the end of the day. The rich will be the last to fall.
When has human history ever been different? America is not some ideal place of ethical values.
"Who says Da GUV and Da Banks are separate entities? How does a proper mafia/empire work? ;-)"
A very god point that we need to be reminded of often.
Basically, I would say that purchasing power that was sustained by cheap chinese junk during the 90s is now outweigthed by the loss of "good" paying jobs to these economies. The real problem is free trade without tariffs. In a globalized world, you will have in each country people as rich as the richest american, and as poor as the poorest indian. That's why the current situation with europe can only be solved two ways: euro as a money will either explode or europe as a whole loose some 20 to 30% standard of living. Either way, it will be a mess.
Excuse my english, it is not my native language.
The 10+ will eventually feel the pain, although not in the sense you or I feel it.You can still eat what you like and drive anything you want so long as ayou still have a few million-but maybe some of them will have to give up the jet or the yatch before too long.
Is that "tat" a typo or an acronym new to me?
My personal opinion, backed up by extensive reading, is that printing money must always have a strong inflationary effect-which might of course be counteracted or offset during a deflationary period -up to a certain extent.
I believe the money already blinked into existence is responsible for serious inflation already;apparently the powers that be are in agreement, as they appear to be very reluctant to push the stimulus button again-for the time being.
Later on, they will push it again-and again-as the overall economic situation grows ever more difficult.
Right now, we are burning the cheap stuff lying around to stay warm-the old furnuture in the attic, the lumber left over from building the deck, etc.
Later on, we will be burning the good coffee table , and sometime after that, the summer clotheing, and eventually, even the pics of the family-this of course presuming our current govts stand long enough.
In the event of a revolution, strong men might be able to create a stable currency, by forcing austerity on the population.
Tat is junk in the UK [not useful junk, just plain old junk of the worst kind]
The UK is in the same position as the US but without the massive coal deposits and self sufficiency in food. You say "compete again" if the whole world develops you are 62 million out of 7000 million. So the UK may access <1% of the worlds commodities. I think you (and the US) need first to work on being self sufficient and then worry about "competing". If I lived in the UK I would be very worried about food. The UK imports 45%(?) of its food. Without north sea oil and gas what will you use to pay for the food?
We are still a major exporter of high value engineered goods. We cater to the luxury end of the market, albeit in areas like cars and aviation which are liely to face falling sales in a PO world. However, for now, the rich are getting richer.
We import about 45% of our food by value. We could be just about self -sufficient on a calorie basis if we needed to and still had access to nitrate fertilizer and enough oil to run the machinery.
I believe food imported into the UK (in money terms) could be higher at around 60% of food consumed. (Answers to questions in House of Commons a couple of years back?)
Food imports as a percentage of calories seems a difficult number to count these days.
We have a total of about 6M hectares of arable (ploughable) land, or 4 persons per acre, of which we are just now ploughing under 4M hectares. (DEFRA gov. stats.) A lot of primary crop production goes to feed livestock (we import majority of our high protein animal feed and some of our wheat might go again to bio-ethanol this year if the wheat price goes down).
In 1939 we imported 70% of food as calories, and then about halved that during WWII by doubling fertiliser NPK & mechanised horsepower and ploughing up to maximum land. These days we get double cereal yields per hectare on best land, so even with 10M+ more people, yes, with very tight food rationing and enough NPK and diesel and maintained machinery (John Deere parts come from Texas by air), we could mostly do it, in good years.
The OECD “Thelma & Louise” Race to the Edge of the Cliff
http://www.calculatedriskblog.com/2011/07/europe-bond-yields-up-sharply-...
Europe: Bond Yields up Sharply for Italy, Greece, Ireland and Portugal
A post after a long time
Have a look at this it fits in exactly with what you are saying
http://www.economic-undertow.com/2011/06/27/dead-money/
I am obviously missing something here. Brent Crude has been above $100 since January. Just eyeballing the chart it appears that the average for 2011 should be somewhere around $115.
Ron P.
I suspect that Euan is talking about the running annual average price.
Oh, now I understand. He is talking about the running 12 month average. Yes, it most likely will be there by September.
But here is what I think is really important. I believe that it crosses the $100 mark this time it will never be below $100 again. Before high oil prices have caused recessions but retreated and we had GDP growth again. What will happen this time if prices never fall below $100 a barrel again?
Ron P.
As previously noted (and looking at calendar year averages), if the 1997 to 2009 pattern holds, the next year over year decline in average annual US spot crude oil prices will bring us down to the $120 range. My contribution to the ASPO-USA 2011 predictions post last year:
See Dave Cohen at: http://www.declineoftheempire.com/2011/07/saturday-oil-report-july-2-201...
Dave - if you're around - agree with much of what you say in your post, but my own feeling is that the top is in for the current spike. Its impossible to predict too far out, but I'm beginning to suspect lower highs and higher lows for a while = lower volatility in oil price. Agree that we love money - but unlike oil it is harder to define.
Ron,
Perhaps I misunderstood you? Or are you really saying that you believe that if the 52 week trailing moving average goes above 100 USD it will never again fall below 100 USD/BBL? Now of course it may not reach 100 US/BBL... but let's for a moment assume it does. Anyway: For the next 3-6 months or until QE3 we are VERY likely to see a very large fall in oil (and other commodity) prices. I believe we are already seeing the beginnings of the correction... The FED only printed 11 billion dollars of thin-air money last week... down from 16 the week before and I believe 25 the week before that again.... Anyway... if the trend continues, and the Fed doesn't print as much thin-air money over the next few weeks then commodities, stocks, basically anything denominated in USD are going to take a massive hit... Just wait and see!
Nordic
ps. Even though I expect prices to start falling from about now, the moving average will of course still be going up as long as the oil price is above whatever the average is now... So it will still keep going up for a little while. But maybe not as high as a 100 USD/BBL?
Ron, your comment has caused a bit of a stir. I'm with Nordic here. But I'm also wary of assuming we know what is going to happen, i.e. a carbon copy rerun of 2007 - 09. But things seem to be shaping up that way at the moment with trouble spreading to Italy and possibility of all hell breaking loose on Friday when "asset" holdings of 91 European banks are published.
E
Hi Darwinian,
I am greatly intrigued by your comment to the effect that you never expect the referred running oil price average to fall below 100 bucks again.
I presume you mean in terms of more or less "constant" money, and incidentally I agree with you.
The thing that intrigues me is that you and lots of others seem to believe that demand destruction can hold oil prices to some particular level, such as for example 125 dollars , to pull an arbitrary figure out of the air, the theory being that a contracting economy can force oil prices down below this arvbitrary level-just what the level is is not revelant to my argument. I agree that YOUR prediction of demand destruction holding prices down will PROBABLY hold true for the near future.
But I simply cannot see why it MUST hold true over the longer term.
MY argument is that it is possible for supply to fall faster than demand , with the result being that prices really could get into the two hundred dollars plus range in terms of constant money.
If for instance it comes down to feeding draft horses or feeding my diesel tractors, I can afford twenty dollar per gallon diesel fuel with plenty of room to spare.Tractors don't drink diesel on the days they stay in the equipment shed, and even my small( as tractors go) ones , which will run hard all day on ten gallons, can each outwork four teams of horses-which would incidentally require four operators , rather than just one.
Of course at that price my consumption for personal purposes would fall to maybe a gallon or so per week -I could easily get by on that much by changing my personal habits.
My basic argument is that when oil gets to be really scarce, it's utility is so high for certain essential uses that there MAY NOT be any upper limit on the price-I would gladly pay five thousand dollars for a drum of diesel tomorrow if I truly thought it would be the last drum I would ever be able to buy, seeing as I could make it last for four or five years if I only used it to plow gardens for my immediate family.
Let us remember that even the most downtrodden of peasants supported the nobility of past times-we could possibly live to see oil at two or three hundred dollars in constant money, with only a few million barrels being produced daily.
Of course such high prices would probably eventually result in large scale production of synthetic oil from coal and natural gas, and greatly increased biofuel production-but I can't really see any reason why two hundred dollar oil might not become a reality if production falls off fast, as might well happen within the next few years.
Following along my line of thinking down-thread, what if human labor to drive the horses was cheap compared to oil? Would having people tilling by hand make more sense than horses, and horses more sense than tractors, if there were no cheap outside energy to be had?
Of course, producing wood gas, ethanol, or bio-diesel for a tractor might be a more efficient than trying to feed people to act as plows, and wind-generated ammonia might be better still. But what if you had hordes of workers willing to do "slave labor" in exchange for nothing but food? What work could they gainfully do?
In the simplest form, I think population needs to be kept sufficiently small that available resources remain cheap, in order to maintain modern lifestyles. This means sustainability of a fairly high-energy life. This doesn't seem possible with 7 or 9B people.
Turning it over, a person needs to be able to obtain enough resources in a day's work to trade for food. It's a fair bet that those who work to produce energy will not go hungry. It's not clear that will be true for others. A lot of people who cannot get enough out of a day's work to buy food is not a stable situation; this is probably what the ME is going through now. The obvious options are to come up with new valuable resource these people can help produce, or get rid of a lot of people.
Nothing ever costs nothing to own. Horses cost more in production inputs per unit work (harness-makers, blacksmiths, drovers, feed, water) than diesel tractors up to a very high price of diesel. Human slaves are probably more expensive yet, witness their historical replacement from Roman era to Plantation era at any task which can be done by horses. Human slaves are better than horses at planting seedlings (sugar, rice), wielding knives for harvest of coarse crops like cane, selectively cultivating / weeding row crops, harvesting crops requiring delicate hand plucking (cotton, tea, fruits).
Its all economics, some of it very brutal but apparently not uncommon or unthinklable.
I agree with what you say. This is also part of my theory of why resessions will (and have) moved shares of oil consumption from rich to poor countries; they use it for stuff that can not be over priced (like feed your family), we use it parrtially for leisure and games.
But I have an oposition as well: As you know if you read my comments in the past I used to be a an unemployed welder, but I now have a job. I work at a central heating plant in the nearby town. Kristianstad is large enough to warant a large CHP. We have two owens, the elevator goes 8 floors up to the top. Then we have turbines for electricity, and there is a bio-gas plant in the complex too. Also there are some aditional minor plants around the town. One at the central hospital, and some in the suburbs.
Tomorrow I will work on a gas venting drum. I workbetween the motor and the drum; a piece around the center, where the motor axis goes into the drum, has rusted and need replacements. I took it down last week, and tomorrowwillgo towards preparing the hole for the new plates. Loads of work.
Bottomline is; I know how much work there is in maintainance of these large facilities. If a good fairie waved her wand over the CHP and turned everything on the plant into from-factory-new condition, I know for a fact the plant would break down in 4 years without maintainance. We need to constantly replace things all over the complex. And some of those gizmos and gadgets are quite advavced.
Is it possibleto get all the gear and supplies you need, in decent amount and in right time, in a world with say 33% less oil than now? I am very sceptical. Loads of the supplies and spare parts can only be produced in volumes. And when PO knocks on the door, volumes of everything goes down.
Now; the entire oil industry is based on processing plants like those. And they are all high maintainance. They all rely on a a working globalindustrialcomplex for supplies and spare parts. And I suspect it will not be around for as long.
Part of our predicament is we are locked by training, inclination and past practice into a 'modern' way of thinking.
We view the world through the perspective on industrial design, advertising and pop art. We hire machines to work for us and we rationalize, 'Form follows function'. The function is unemployment of those who are left outside the form.
The outcome is a conceptual framework devoid of anything but the 'appearance of efficiency' even where no efficiencies actually occur. Modernity is nothing more than a fashion. The 'economy' becomes a sort of internal critique that helps to rationalize the fashion (and is also why the 'science' of economics doesn't make any sense. It's not supposed to!)
It's also why our built environment is so dismal, why our buildings look like bunkers or boxes, why post- development 'nature' is flattened and diminished into a two- dimensional caricature of itself. Nothing matters because the 'efficiency leads to more money' idea carries all the other ideas that don't make more money before it.
Now that money is caught into the peak oil pit, the efficiency idea is into the pit as well.
Sienna ... Italy: where is the efficiency here? Who cares?
In real civilizations, there is little unemployment b/c the concept 'employment' is a piece of the industrial efficiency idea. 'Jobs' with 'paychecks' are the bribes that entrepreneur-bosses offer to the commons to allow the construction of industries and the usurpation of markets. This usurpation is what commercial manufacturing allows.
Industrial efficiency annihilated the civilizations which gave birth to the efficiency idea in the first place.
Civilizations are anti- efficient. Civilizations want to always go 'the long way around' for the 'fun of it' or for traditions rather than head straight toward some bank. We moderns do not have a civilization, we have a rat maze we pay the privilege to coarsely inhabit. Civilizations are frilly, excessive, silly, pointless, educational, refined, irrational, and backward looking toward gods, ancestors, nature or older, more developed civilizations. Civilizations accompany explosions of decorative arts that require all otherwise unoccupied hands. Hands make the necessary claim on every space which in turn demands more and more spaces to be decorated. Spaces and hands fall into balance in civilizations, of course we don't know that because there are no civilizations left for us to make comparisons with.
Modernity claims for itself the future which never arrives in the form promised by the industrialists. 'Utopia' in the form of an 'efficient civilization' never arrives, either, what appears is a series of interlocking Ponzi schemes. People don't realize that the one -- modernity -- is the hegemon over the other -- civilization. Modernity constantly promises what it feeds off of.
The ability to 'think decoratively' does not exist in modern man, who thinks of how to simplify: to cheat others in the service of money and to wage all-out war on nature. In this we are indeed truly and hopelessly doomed. Ours is a planet filled with gamblers, 'entrepreneurs' (slave-masters) and slaves; our artists are 'con-artists'.
Doesn't leave us with a whole lot to work with: we have burned every kind of creativity except the finance kind in the furnace to keep warm. Now what?
Yeah, yeah yeah, I was going to go for that but it seemed like such low-hanging fruit and also not relevant to the core issues: does peak oil cause economic crashes and what are the details?
Indebted OECD countries like the UK (the USA, Spain and Italy)
Gee, I wonder what other OECD nation is also highly indebted? Hmm...
Where could the Chinese economic miracle of power crunch and debt-up-to-their-eyeballs be heading?
Errr... China is not an OECD nation.
oops, only "lesser China" is; Greater China at this rate will never be in the OECD.
But does peak oil cause economic collapse or not and what are the details?
Your link is to the OECD relation with The People's Republic of China, which is China, mainland China, not lesser China, whatever that is. All your links dealt with mainland China. Babystrange, is it really that difficult to say, "Oh, I was mistaken"?
I think the question asked by this link is do high oil prices cause recession? And ,if they stay high can they cause collapse? We can have ruinous high oil prices whether we have reached the peak or not. And I would say yes, all the evidence, presented here and elsewhere, certainly indicates that high oil prices cause recessions. They have in the past and they are causing, or contributing to it right now. And if they get high enough, for long enough, they can cause the economy to collapse.
Ron P.
Taiwan ?
Don't hear much about that place these days.
I think I'm right in saying that the US is legally bound to protect Taiwan from Chinese aggression.
Best to keep Taiwan's fate out of the media, seeing as how Uncle Sam would be borrowing money from China to protect Taiwan from China - in the event of a shooting war.
Crazy old world we live in. I'm off to the pub.
Laws and treaties are only meaningful if they are enforceable.
Yup. Remember that England declared war on Germany when Germany went into Poland because England had a mutual defense pact with Poland.
But, when Germany went into Poland from the south, The Soviet Union went into Poland from the north - Remember the Molotov/Ribbentrop pact which divided Poland long before the invasion. But England did not declare war on the Soviet Union!
Even better, England had the same mutual defense pact with Finland that they had with Poland. When the Soviet Union invaded Finland who do you suppose England declared war on? That's right - Finland!
Regan was right - "Trust, but Verify"
Some really selective history in there.
James Hamilton's paper actually observes links between oil prices spikes and recessions in 10 out of 11 post World War II recessions. The quote is found on page 26 of his paper.
It is interesting that this phenomenon had been observed long ago. The WSJ article Oil Prices Start to Pinch, Stirring Concern Over Economic Impact dated June 4, 2004, talking about the connection between high oil price in 9 out of 10 recessions, was quoted by Dave Cohen in this post from October 4, 2006.
High oil prices provide people with an incentive to reduce their consumption. This doesn't work immediately, since most driving is for commuting, which has fixed distances involved and you can't just decide to drive a smaller car tomorrow. Because they cost so much, replacing a high-consumption car with a low-consumption one is only done when it is time to replace the car. Similarly, if you decide you live too far from work to afford the commuting distance, it takes time to move house or find another job nearer home.
These are the big ticket items and responding to the price signals can take years. In the meantime, most people would have no choice but to grin & bear it. For those both living & working in the right place, public transport becomes more attractive, but governments are notoriously slow at responding to an increased demand for public transport, so there will be no quick switch to that for most people who are currently commuting by car. Thus, the recession phenomenon that Euan writes of above.
Given that oil prices have been high for some years now, we should be seeing evidence of a shift in oil consumption patterns in developed countries like the UK. Has there been a mode shift towards public transport? Have car sales shifted towards lower fuel consumption models? Is there a greater number of people sacrificing dwelling size to live closer to their employment? If there is shift in this direction, it would reduce the recessionary impact of high oil prices and thus lead to a higher price point at which the economy would be thrust into recession.
In Australia, there has been a massive increase in public transport use. Services which were previously neglected by most are now bulging at the seams. Further, there has been a shift towards smaller, more fuel-efficient cars, something which is likely to be the end of the Australian car industry in the next 10 years. Trends are somewhat more complex than the impression this would create, but the effect of high oil prices can still be seen in car sales. Finally, there is an increase in medium and high density dwelling construction in the inner areas of the major cities. It has also become more difficult for developers to sell houses on estates in the outer suburbs, where commuting times and distances are high.
So, how are things going in the UK? Or the US? Any evidence of a shift which would increase the recessionary oil price point?
The UK government introduced a 'cash for clunkers' scheme which was designed to stop the car industry doing into free-fall in 2009. It did lead to a lot of private buyers trading in 10+ yo cars for (mostly) more efficient new cars. And because private buyers (about half the market in the UK) generally buy smaller, cheaper cars than business buyers, that also helped.
In addition, there is evidence that total miles driven have fallen, total fuel sales are down about 10% in the last few years. People are also driving more slowly, if the accident statistics are accurate. 2010 saw the lowest number of road deaths (below 2000) since records began in 1922.
Long distance bus companies are making good profits. As always rural bus routes are heavily subsidised and many of these are being cut. Trains are a more confused picture - but there is much talk of expanding services and building high speed lines.
All talk of building new airport runways has dropped out of the news, although no major airlines have gone broke recently, and Airbus has got a full order book for its more efficient models.
There is growing recognition of energy security as in issue among the more thoughtful citizenry, but the Dail Mail/News of the World readers are still in the stage of impotent raging denial.
In 2009 I bought a bigger, thirstier car at a big discount because I knew I would never buy that type of car so cheaply ever again. I sold it again 6 months ago for one of the most fuel efficient models on the market, more efficient than a Prius.
[edit]
Living space is at a premium in the UK and has been for decades /centuries. The population drift into the South East corner continues. Moving house is extremely expensive, and the rate of new build is tiny. We have a very static market with a small rental sector, most of it at the lower end of the market. This makes for a static workforce which is forced to commute relatively long distances to wherever they can get jobs. Only the wealthy can make the lifestyle choice between small town houses or larger out of town ones. Of course the rich few percent have both...
I think the cost of property in England is the major problem we are facing. There has been rampant speculation, and the Government appears to be doing everything it can to keep the property bubble inflated, we really haven't seen it crash yet. I work in London and rent a 1 bedroom flat, 12 months ago the rent was £950 pcm, I've had a £100 increase however the landlord could easily demand £1200 given the price of other properties in the area. Thankfully I live in walking distance to work, and the supermarket. If/when the housing market finally crashes things will get ugly.
Yep, I think so. So much debt is held in property that if property declines too much, it takes the banks with it. On the other hand, because the prices are so high, we have become a high cost economy to pay for these high prices, and so it isn't possible to grow our way out of the debt.
So we're cattle-trucked if prices fall and cattle-trucked if they stay the same. The difference being that the latter is a slower process, and TPTB can still pray for a miracle (and keep their cushy numbers a bit longer),
Peter.
I live in a one bedroom flat on the south coast in Hove. Rent is £625 per month and the flat next door (identical) is on the market for £165,000. The problem is that all these buy-to-let landlords are stuck. No one in their right mind would pay £165,000 for a tiny one-bed flat when they could rent it hastle and maintenance free for £625!! It would require a down payment of £20k and a demonstrable income of close to £40k resulting in a mortgage repayment (at near zero interest rates, lowest ever) of £850.
£625 to rent, or £850 to own, plus opportunity cost lost of the £20k down payment? Not rocket science, is it! Also, most people who are the stage of their career to earn £40k will be also looking to start families and thus won't want a one-bed flat.
The buy-to-let landlords are stuffed. They can't sell and they need the revenue to pay the mortgage off. I am more than happy to not own my flat. The landlord is obligated to give me a good period of time before chucking me out and in the mean time he has to fix the roof. Quite literally in my case as it was leaking. Also, if the washing machine or fridge blows up, it is his credit card used down Comet to buy a new one, not mine! Happy days!
It does of course matter where you live. I have a 3 bed semi in Yorkshire that i got for £90 thousand last year.
When a government tries to create affordable housing simultaneous with doing everything it can keep property prices up you know something is far wrong. The sooner they let prices normalise and restore a free market the better. It will be very ugly for a while then things will adjust to a new norm.
Couldn't agree more.
We should also bare in mind that the substantial increase in basic living costs since 2008 have, for a good many people, been almost entirely offset by the lowest ever monthly mortgage payments on variable rate loans. As soon as interest rates normalize - which could be quite suddenly - a lot of middle-class families are going to feel the impact and it ain't going to be pretty.
There is growing recognition of energy security as in issue among the more thoughtful citizenry, but the Dail Mail/News of the World readers are still in the stage of impotent raging denial.
There isn't a News of the World any more. Last Sunday was your final chance to Read All About It. I am awaiting the next Mock the Week with interest, to see what they do with their theme tune.
Any evidence of a shift which would increase the recessionary oil price point?
The fuel tax escalator broke down and then went into reverse. This will tend to make the economy more sensitive in the future.
The government is using inflation as a way of dealing with the debt. This means they don't want a recovery yet, because they want a lid on wages for another year or two of 5% price inflation. If there is a serious recovery in the UK, there is also a serious risk of an inflationary spiral. High oil prices that can be used to blame for a continuing recession actually suit the government. It can get away with inflicting more inflationary pain that way.
The UK has seen a number of changes in transport usage that reflect , at least in part, the impact of higher oil prices:
1) Current Year-on-year decline of 6.2% in new car sales
http://www.rac.co.uk/news-advice/motoring-news/post/2011/7/new-car-sales...
2) Motoring organisation (RAC) reports reduction in car usage (no absolute stats here but driver trends discussed).
http://www.rac.co.uk/press-centre/press-releases/post/2011/6/rural-drive...
3) Fuel consumption drops in 2011 Q1 - 3.7% for petrol, and 0.5% for diesel.
http://www.guardian.co.uk/money/2011/jul/08/tax-revenue-drops-as-drivers...
Elsewhere there are fairly frequent reports that public transport commuter numbers are increasing. We also have a continuing trend of people working at home, full or part-time.
So yes, the impact is that people are driving less.
"So, how are things going in the UK? Or the US? Any evidence of a shift which would increase the recessionary oil price point?"
Here in the UK in the first 3 months of 2011 motorists bought a billion litres less fuel (1 gallon = 4.5 litres) The Tax loss to the government is £637m.
So lots of demand destruction happening in the UK too.
http://www.theaa.com/motoring_advice/news/fuel-sales-down-one-billion-li...
You forgot carpooling in your short-term response options.
Fair cop, guv.
"Bare" isn't what was intended for spelling in that ASPO chart, I assume.
US motor gasoline prices peaked at $1.39/gal in March 1981; the recent counterpart was $4.14/gal in July 2008. We are 38 months out from that point, with prices at 96.14% of their peak value; 38 months out from March 1981 was January 1984, with prices at 86.46% of their peak. Prices declined much slower after the 1981 spike, too, even with a huge amount of spare capacity coming online. The gasoline price did begin to head up in 1979 post Iran revolution; note how demand immediately went through the floor:
1256 kb/d of gasoline demand was shaved off for June 1978 to June 1980. Contrast the same months 2008 to 2010, where demand actually has increased 174 kb/d. Of course this is a bit arbitary, since demand peaked before the price hit its asymptote. April 2007 to April 2011 shows a 453 kb/d decrease. Still only ca. 1/3 of what was achieved previously, in a shorter span of time too. This is low hanging fruit.
How do you characterize "low hanging fruit"? I was at a Honda dealership this weekend, and they had a Honda 600 on display. This is a very tiny car, and a Fit or a new Mini is very large by comparison.
Such cars were the result of high prices circa 1970. Another round of cheap, small cars in the 80's include Geo Metro 3-cylinder.
Today, you cannot build anything like these cars, as crash regulations would preclude them. For a highway car jousting with SUVs, pick-ups, and semis, this makes a lot of sense. From an economical perspective, it is disastrous.
On the other hand, computerized fuel injection, direct injection, and O2 sensing enable much more efficient engines. The 1970 cars had tiny inefficient engines pushing tiny cars. The 1980s had more efficient engines pushing slightly larger cars. Today, we have still more efficient engines propelling relatively large cars.
The result is that the best mileage cars of today are only marginally better than those of earlier decades, though the car itself is much nicer and larger (and not much more expensive, in constant dollars).
One obvious system-level change should be to the usage expectations of cars -- it makes no sense for one type of vehicle to address all operating modes. Long-haul freight should not be on the interstates. Local freight should be smaller trucks and low speed limits. Pickups and SUVs should be speed-limited in-town and in the 30-minute commuter zone around town. Commuter cars should be small, and trade passenger space for crush zones. Town cars should sacrifice size for utility, with lower crash standards and speed limits.
In town speed limits of 20mph for trucks/SUVs and 30mph for cars would make travel more time-consuming, but would enable smaller, lighter vehicles for town-only use. It would also push people away from driving trucks as everyday cars. At 20mph, most crashes between vehicles and bicycles, mopeds, and motor bikes become non-lethal as well.
This is of course a pipe-dream, as nobody wants to stop driving their truck or SUV 50mph to the store 2 miles away, nor to turn their 15 minute drive across town into a 30min commute.
As I'm sure you know the early gains in MPG are more easily had. The current CAFE goals will deliver about 40% of the corresponding gains from the 70s/80s, IIRC. It doesn't help to persist in using MPG when Gal/100M (or l/100km, as is used internationally) is a more relevant metric when speaking of actual fuel consumed.
The drop in product supplied back then was quite dramatic, if you read the reports coming out of the then new EIA it would be startling to see how people rushing out to buy anything but V8s led quite visibly to less gasoline being sold.
It also helped that the fleet in the US was smaller then, changes would become apparent that much faster as a result, and vehicle sales were about the same as now, too.
Back to oil prices, the 1981-1982 recession ended in Nov '82 with gasoline at 91.35% of its peak value, whereas we're now at 96.14%. Shouldn't that preclude recovery in any form? How did things pick up back then with such high prices in place? Perhaps high oil prices act as catalysts but not prime movers.
GDP is 4.7 times the size it was in 1982, but oil is only 3.5 times the cost. The 1981 recession was not just oil, but out of control interest rates and inflation and foreign debt crises. When interest rates and inflation subsided, and income tax rates were cut dramatically, consumer spending was able to pick up and drive the economy up. This was also at the start of the personal computing revolution and the introduction of the nascent internet and email.
I think you are conflating the 1979 oil crsis related to the Iranian Revolution with later events in 1981-1982.
What is the ratio of GDP to import dollars expended on oil, circa 1980 vs today? Oil dollars spent in TX or AK travel different paths than dollars spent in MX or KSA.
The balance of payments is a major part of the debt game, funneling debt into foreign hands. Sure, price of commodities is important, and so is income, but the flows across the border are very important over the long-term.
Engine efficiency went down after compression ratios were cut for the conversion to unleaded. Despite computerized fuel injection and other improvements, most of which were to comply with clean air regulations, engine efficiencies are still below the leaded gas era, but there has been some improvement in drive train efficiency.
One ounce of gold still buys 12 barrels of oil on the world market, just like it did 10, 30, 50, and 80 years ago.
The issue is the relation of the dollar to commodities since 1971, not the cost of the commodities themselves, and the amount of dollars people make in salary today.
If you make three times what you could have in 1981, the current price of gas shouldn't be an issue.
http://www.ssa.gov/oact/cola/AWI.html
Social Security shows their wage index for 2009 at three times the 1981 level. Where is the gas price crisis except in people's minds because they were used to an overly cheap price in the 1990's?
It would be good to see a chart of that.
Some other good price charts at the link.
...and more here:
Thanks for posting that chart.
The ~12-13 barrel trend line is pretty obvious. Presently, ~$120 per barrel and ~$1500 per ounce - 1:12.5
Also, gold was $35 per ounce in the, 50's, and 60's, while oil was around $2.80-$3.10 per barrel. Again, 1:12-13.
In the 1920's, $1.30-$1.90, while gold was $20.67.
Its not a strict constant, but rather a long-term consistent relationship over time during the age of motorization (post-1920).
http://www.eia.gov/dnav/pet/hist/LeafHandler.ashx?n=PET&s=F000000__3&f=A
I believe lots of financial types consider the price of gold to be the best gauge of the monied classes fear of worthless currency and paper investments such as stocks and bonds; real estate is not portable and therefore it's value depends largely on tax policy, availability of credit, and govt stability.
This makes great sense to me.
I don't expect to ever see gold very far below a thousand dollars an ounce again.
The top chart is really interesting! Thanks for posting. Is going to take some time to understand what is going on here. That big block from 86 to 98 - that was cheap oil, North sea and North Slope. Then in 05 expensive oil and cheap gold. And then on your second chart in 09 - cheap oil and "expensive" gold again but not really anomalous compared with earlier peaks. One of my very well informed cyber friends was touting $2000 and $70 by year end = 29. Sounds extreme but well within these historic limits. This relationship between energy and money and money and PMs is quite fascinating to untangle. The Normans liked land best. You got any charts on ozs per hectare?
Here is another example of gold: oil - the value of 1000 barrels of oil in gold ounces to 1950
I would call that remarkably stable over the long term.
There are quite a few other commodity charts, expressed in gold, at Nathan Lewis's site - New World Economics
I like this one for wheat - food is not really that expensive, in historical terms;
I haven't seen one for farmland, but that would be a very interesting chart!
Its really interesting. Since 1990 rising gold per oil tops and bottoms suggesting energy is steadily growing more important compared with real money which makes sense since energy is required to create real money.
The wheat chart is also very telling since the fall in the real cost of food represents the disposable income that represents industrial society as we know it / remember it.
Gold and food have both inflated quickly over the past few years -- both are really expensive.
Well, it depends on what you take as the benchmark. If you assume gold is stable in value, then money has been inflating.
As for food, well, plain old wheat is still fairly cheap. What has gotten expensive are the "value added" foods, which includes bread, and "packaged" foods.
This say more to the processing, distribution and "marketing" of food than the raw ingredients themselves.
A sack of flour, rice or potatoes is still cheap.
And, if you think the current price of 6 oz gold to buy 1000 bushels of wheat is expensive, consider this (information from here;
In ancient Greece (circa 400BC) , the price of 55lbs of wheat (close enough to a modern bushel) was 5 Drachmas. There were 25 Drachmas to a gold Daric, which weighed 8.35 grams, or 0.27 Troy ounces. So a bushel of wheat was worth 0.2x0.27=0.054 ounces of gold
So, 1000 bushels of wheat, 2500 years ago, was worth 54 ounces of gold - about the same as in the 1950's !
So what has been inflating over this time - gold, wheat, or paper money?
If all commodities are priced in part according to their labor, there maybe a shared function that results in rough equality. This only makes sense -- the same energy that runs tractors also runs excavators, and the same people harvesting by hand could pan for gold by hand. Of course there are variations over time locally and globally between the various methods and mechanisms for producing each commodity, but there is likely a shared component as well. If oil can be used to mine gold, it only makes sense that they would track in price.
On top of that, there is the notion of utility and substitution that can help level prices. If one commodity gets a little easier or harder to obtain, then substitution will naturally compensate to a degree. If gold becomes a bit more dear, then more oil can be used to produce more.
But that doesn't say that the absolute value doesn't change for both; the question then is, what isn't relative? Is it the value of humanity? How does price of gold compare to a man-week of work? Really, trouble sets in when an average man's work will buy less gold...if gold is a proxy for wheat and oil.
If wheat and ores and oil and other form of energy get harder to obtain, that says that more man-hours of work on average will be needed to obtain any given measure. Substitution may help us then run out of lots of materials quickly and at nearly the same time. Liebig's Minimum may well make the substitutions less efficient and hasten such an event.
Using this line of thinking, as more effort goes into commodity production, less labor will be available for production and services, so the service economy would shrink, though prices for such would rise. The existence of a large, cheap service industry is perhaps an indicator of cheap resources. Production would drop as well, resulting in fewer more expensive products. The existence of bulk cheap products is perhaps an indicator of cheap resources as well.
As resources deplete, we'll eventually put more and more effort into producing the most important items. Suffering then occurs when effort alone is insufficient to achieve results.
After WW I the population of horses and mules fell because of internal combustion transport. This freed up much farmland that was used to feed animals. Tractors began being mass produced after 1917. Combine harvesters started appearing in the 1930s. The green revolution with higher crop yields and chemical fertilizers began making their impact in the 1940s.
Then the human population started to grow exponentially and TSHTF!
http://www.cdrb.org/journal/2004/3/2.pdf
The absolute worst thing humanity could possibly do at this juncture is embark on a second green revolution based on genetically modified monoculture crops! Yet that is exactly what we are doing now, at the worst possible time in human history!.
The emperors are all butt naked! And people like Lipton et al can't see the forest for the trees because their salary depends on their not seeing them.
This can't end well! The 4 horsemen are already saddled up and ready to ride...
Good luck!
There will be no second green revolution; crop yields are completing an S curve. In the U.S. the annual yield increase stayed constant around 1.7 bu/ac for corn from 1941 to about 2000. Because yields were 40 bu/acre in 1940 and are 150 bu/ac now, the percent increase has been declining. Fertilizer use is already showing diminishing returns in Asia. Plant density is at maximum and the grain to stalk ratios are also maximized. High yield verities are approaching the limits of photosynthesis.
Crop yields and population growth are on a collision course.
Good info, but let's return to main topic.
Best,
K.
I find it very interesting that the worldwide birth rate began dropping roughly at the beginning of the 'Green Revolution'. Population continued to rise rapidly I think because the death rate dropped faster than the birth rate. The interesting thing is that on a family basis, women were having fewer children (The Total Fertility Rate dropped even faster in this time period). If human reproductive behavior followed the 'yeast in the petri dish' paradigm, families would have been having more children and not fewer. Good evidence that people are not yeast.
Birth rate is live births per 1000
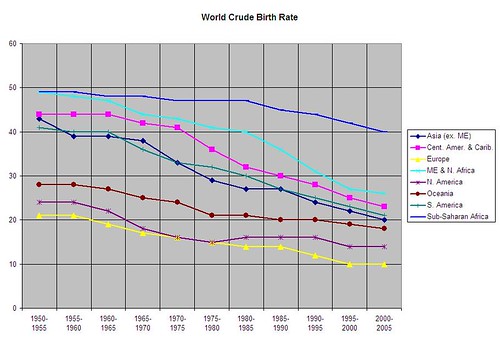
Don't just throw it out there and say we grew a brain.
There are many reasons for the declining fertility rate.
Infant mortality rate is one.
Maternal mortality rate is another.
http://en.wikipedia.org/wiki/Maternal_death
Penicillin, anti-biotics, nutrition, x-rays, immunization and general health care has steadily improved allowing more children to survive into at least young adulthood.
That was not growing a brain, it's being able to understand that a couples' offspring have an excellent chance of survival so parents can settle down do enjoy the trappings of the consumer lifstyle.
Humans are still as dumb as yeast. All the trappings of a cheap fossil fuel based world can be taken away relatively in an instant.
Correct. It wasn't growing a brain, but it is a case of using the brain with which one was born. If infant mortality rates drop, people generally and women especially see the sense in smaller families. The total fertility rate for the world is steadily dropping and may drop below replacement rate before 2020. Current projections are for the global population to max out at around 9b people in about 2050. That's still too large to be sustainable, but a century of decline at 1% per annum would cut it to about 3.3b.
I was not disputing the fact that the population growth rate is dropping.
I will dispute that humans any smarter than we were a hundred years or ten thousand years ago.
Seeing the sense in smaller families I agree with but that sense is not because of a humanitarian desire to reduce population growth, it is purely selfish.
What is happening now with population increases is NOT a collective ah ha moment when the human race decided to reduce population.
Medical advances is the primary reason but it's not the whole story as nutrition, disease control, work practices, war casualties and humanitarian aid has enabled a rise in living standards. The rise of the middle classes is another big factor.
I don't think the upper middle classes, rich and poor show the same trends. The overriding point is that cheap fossil fuels have supported the middle classes and the drop in birth rates would correspond with the percentage rise in the middle classes of India and China.
Fossil fuels have not made us smarter, in fact it's probably the opposite and what cheap energy giveth can be taken away in the blink of an eye and if cheap FF goes so does the middle classes and your dream of 9 billion people and a cornucopian expectation of a century of a gentle 1% decline. The decline will happen though but not in the pleasant way you appear to expect.
It's not polite to put words in other people's mouths. Neither ET nor I have said that people were getting more intelligent, nor that the drop in the fertility rate arises from altruism.
It's true that economic development has caused a drop in birth rates, but it doesn't follow that economic crisis will send them back up again. Look at Russia and other former Soviet republics. Their birth rates fell even more when the USSR collapsed.
Finally, I reject the label of cornucopian. I am, rather, an optimist. I believe the world will adapt to Peak Oil. It will require a massive change in society amounting to a social revolution - but we will adapt. Provided the necessary social changes occur, there will be plenty of time for the necessary gradual decrease in population.
Thanks Ablo,
Just one more comment on what is probably a dead thread (if this doesn't stretch the relevancy issue too much).
If one looks at individual country data (data from http://earthtrends.wri.org/) virtually every country in the world, regardless of religion, socio-economic status, ethnicity, etc. is showing the same trend in having smaller families (Sub-Saharan Africa was the slowest to climb on this 'bandwagon'). People have tried to find reasons for this, naturally by using correlates of one kind or another. Education level for women seems to be the best correlate (I suppose this could be construed as 'growing a brain' :-)) but nothing seems to correlate totally across the board.
Given the ubiquity of this demographic trend, it might even be possible to support a hypothesis that people are simply reacting to over-crowdedness in planning smaller families, though I'm not sure how one would gather data to support this. I suppose with modern communications media available virtually everywhere, humans everywhere on the globe might perceive the planet as overcrowded even if their immediate locale is not densely populated.
I've posted this chart (and others like it) before and almost without exception someone seems to take offense at the perceived implications, and gets defensive about their cherished notions of 'population explosion.' I'd rather examine interesting data like this with a more objective and dispassionate attitude.
/sarconol/ After all, god forbid I should post anything that might be construed as hopeful /sarconol off/
So Russia is your cherry picked great white hope.
http://www.russiablog.org/2010/01/russia-demography-report-2009.php
Simply unbelievable
Your "perception" is that there never was a population explosion.
http://en.wikipedia.org/wiki/World_population
You are correct my perception is there was and still is happening a population explosion. We are at exactly opposite poles.
There was a population explosion, but the end of the tunnel is in view, or at least light shining in from its end is visible. Once the world's Total Fertility Rate dips below 2.0, it means that only the pipeline effect will keep the population rising, and that only for a couple of decades. Certainly the 9 billion figure it will max out at is too high to be sustainable, but if we solve humanity's social problems (which can be summed up in one word as capitalism), we will have the time to manage the situation while population decreases to a sustainable level.
9B could be sustainable, or 1B could still be unsustainable, depending on our consumption patterns and environmental footprint.
More than 50% of our current environmental footprint is due to our consumption of fossil fuels. End that (which is very doable while maintaining a comfortable lifestyle), and we slash our environmental impact.
Conversely, 1B could still burn through our coal and other FFs, decimate fish and other wildlife, etc, etc, etc.
Population as an issue is an enormous red herring - extremely difficult and slow to solve compared to other things which cause our direct environmental footprint.
Dominic Frisby occasionally talks about UK house prices in terms of gold abd silver in MoneyWeek
http://www.moneyweek.com/investments/property/gold-price-and-uk-house-pr...
helped out by charts from Tom Fischer formally of Heriot-Watt University and now with the University of Wuerzburg.
The price of gas (unfortunately) is not an issue for me. It's an annoyance. It should be an issue, to encourage reduction in usage.
But I do have problems:
If we made 3x the income of 1981 then the price of gas would be 3x times higher -- or something like that.
In the early 1930s oil prices in the U.S. fell below ten cents/bbl after the discovery of the West Texas Field. Gold was $20/ ounce, so an ounce bought over 200 bbls.
I think you meant the East Texas Field, and oil did sometimes sell for cents per barrel in East Texas, because of a local glut, but the price data that I have show that the nationwide average monthly price of oil only fell to $1.39 in July, 1931 (down from $4.10 in the Summer of 1929), generally rising thereafter, until hitting $2.82 in July, 1937, before falling back to $1.68 in late 1938, and then rising again.
From the Summer of 1931 to the Summer of 1937, US monthly oil prices rose at an average rate of about 11%/year.
Here is a Thirties oil price chart, in 2008 dollars:
http://1.bp.blogspot.com/_otfwl2zc6Qc/SR7wlGrkytI/AAAAAAAAHvE/aOVvsxq_fP...
Source:
http://mjperry.blogspot.com/2008/11/oil-shock-of-1930s.html
Sorry, I meant East Texas Field. The price I gave came from Yergin's The Prize and it was local or regional, but transportation and distribution costs were higher in those days.
There's some truth in this. The cheap oil (and the ideology and oil-region wars) of the late 1980s and 1990s conditioned people to expect permanent ease in that area.
But the other reality that's happened since 1981 is The Great Divergence, which has severely undermined purchasing power for the bottom 2/3 of the society.
http://www.slate.com/id/2266025/entry/2266026
So, a constant real gas price does constitute trouble for many, if not most. And the ability to afford an automobile is, after all, widely held to be a cardinal compensation for accepting the status quo in the USA.
Personally, I also think people can vaguely sense that something like Peak Oil lurks behind the recent gasoline price trends, even though rational public discussion of the nature and meaning of Peak Oil remains strictly forbidden.
Interesting article, but just one comment: When making moving averages, cut it in the ends. If you make a graph of something with a 12 months moving average, there is no point in calculating the 12MMA for the 6 months in the begining and the end, since you do not have statistics for that period. Try to make a graph Y=X and make a MA and see what happens in the end of the selected section.
Let's cut to the chase and predict that Euan's got it about right, the next recession looms, probably this fall. Interesting that even election year politics in the US, just getting started now, cannot control this next drop. (Can't print oil, as someone recently said.) My question: do you think the world economy or the OCED economies in particular can bear another price runup?
The price is what the price is. The world will bear it. The questions are
1) what is the time scale of the feedback loop that lowers demand with increased price?
2) what dollar level will trigger the feedback loop to lower demand?
Since there has been massive inflation (or deflation of the value of the dollar) I would guess $150 is a more likely overshoot level. The feedback trigger starting at a lower level but not acting fast enough to stop the overshoot. I would guess feedback delay is six to twelve months.
The world will bear it. The price (in US dollars) of oil will track upward at +20% per year for many years. The price will bounce back and forth between a high high trend line and a low trend line separated by a factor of two. Say $75 and $150 as of 11/7/2011 (now).
So after twelve months, maybe a year from now, at $165 ($150+10%) we will decrease demand two years from now to support a price of $108. Oddly enough this seems to say more about the decline of the dollar with oil value constant.
I think you are making the wrong question here:
Demand is equal to supply. If supply reduces, so does demand; if supply increases, so does demand. There is no delay.
What you want are the more direct questions "What is the time scale of the events that reduce price because people simply can't affor the old prices?" and "What is the time scale of the events that reduce production when the price goes down?"
The first question is about how much savings people have, and how much they are willing to give away for oil. The second question is about how ring production declines.
Yes you are right. A free market set price to keep instantaneous supply equal to instantaneous demand. If demand rises relative to supply price raises. Likewise if demand falls relative to supply prices fall. People and corporations have a time scale for shifting their personal desires. It takes a while for someone to decide to sell the SUV and buy a Prius or sell the SUV and move into a city.
In fact, prices often take some time to change. (Auctions are the most important exception to that rule, but most of the economy isn't organized in the form of auctions.)But supply is always equal to demand, that is by definition.
What makes it confusing is that people thing about production and consuption. Those are distinc concepts from supply and demand. Production and consuption can indeed have different numbers, if there is some storage somewhere.
Its a "52 week" trailing moving average so I can take it bang up to date. This gives the average of the previous 52 week period. I think your comment would apply to a centered moving average?
I thought it was a cetered moving average. Never thought of making it any other way.
From a technical point of view, isn't that identical to a "centered" 52-week moving average, where the center is 26 weeks old, and the series of average values ends there? (No matter what you do, you can't avoid "end effects", you can only fiddle them - so no one can truly bring an average over time bang up to date; such an average must always be out of date.)
Conservation is good but we can not conserve our way out of oil depletion. It will give us more time and more money to make a transition that is good.
I usually like to differentiate between "conservation" - e.g. deciding to not use energy by not going on vacation, and energy efficiency, e.g. doing what you always did but using much less energy to do so, i.e. buying a more fuel efficient car, insulating your home, going on holiday on a Dream Liner.
The former (conservation) I believe is recessionary whilst the latter (efficiency) I believe may lead to growth.
Now their are additional options besides conservation and improved efficiency; total or partial replacement of oil for land transportation, especially private EV or PHEV's. This will be especially valuable for those who have no mass transit options. In 20 years we will look back and wonder why we continued to use oil for so long.
Euan, you used the "growth" word. Growth is what got us all in this fix to begin with. Growth is bad except for young animals like children and plants. Funny how it's hard to damage the planet with too much plant growth, except locally, like algae blooms and certain invasive weeds, like Miconia. Even then, it may only be in the eye of the beholder.
I guess "our problem" is we see ourselves in the midst of a large-scale biological process (overshoot) and would like to stop or at least slow the bus, but its got momentum and is difficult if not impossible to manage.
I posted this a while back and think it is worth repeating here:
I think that the oil price at which the economy stalls will increase somewhat with time as we become "used" to higher oil prices. However in no way do I think that this will be a nice smooth transition.
US consumption has fallen by 2M bpd, and all liquid production has increased. Net imports have fallen by about 1/3 from their peak, reducing roughly proportionately the impact of high prices on the US economy.
Why have oil imports fallen? Partly because of the weakness of the economy, partly because we have lost some manufacturing and this oil is coming back in product form, partly because we have burned through our corn inventories, and partly because domestic production has risen. The impact of high prices is still the same on budgets since gasoline consumption has been basically flat.
Partly because of the weakness of the economy
US GDP has recovered to where it was at the peak of oil consumption, so that's not it.
partly because we have lost some manufacturing
US manufacturing output has dropped slightly, but so has manufacturing sales - manufacturing imports haven't risen, as far as I've seen. Do you have data?
partly because we have burned through our corn inventories
Interesting. Do you have data?
The impact of high prices is still the same on budgets since gasoline consumption has been basically flat.
1st, gas consumption has fallen. 2nd, household budgets aren't the only thing that's important. If net imports have fallen, then the effect on the trade deficit is smaller - that means a different impact on someone's income.
It was 1.9% in the 1st qtr of 2011 GDP and at the peak of oil consumption? Are you sure, and if so that doesn't seem like much of a recovery. Please elaborate on the reasons you suggest for low GDP in the 1st quarter. If it wasn't the high cost of energy, then what in you opinion was it?
Your thinking of GDP growth (change from period to period) instead of the absolute level of GDP.
I'd say that the high cost of energy is certainly an important factor, but the bigger factor is the very slow recovery that is normal after a world-wide financial meltdown.
A great source for this: "This Time is Different - Eight Centuries of Financial Folly". Read it, and you'll begin to see that our current problems, while serious, are not TEOTWAWKI.
I don't believe you thinking in depth about any of these points but this is the one that is most easily refuted without starting a long debate thread about ...
I'm talking about the last several years:
Here's the gasoline in barrels per day:
2005 9,159
2006 9,253
2007 9,286
2008 8,989
2009 8,997
2010 9,034
2011 8,643
http://www.eia.gov/dnav/pet/hist/LeafHandler.ashx?n=pet&s=mgfupus2&f=a
We can see that gasoline consumption has fallen by -6.9% from it's peak in 2007, the date of peak imports.
We don't know the outcome of the 2011 economic data so using gasoline consumption on a year-to-date basis and comparing to prior years isn't valid. Also, gasoline consumption increases in the summer so you have seasonal factors to consider when using 2011 data.
I am guessing that you assumed incorrectly that gasoline consumption fell significantly since we had a significant drop in imports. Now, you are entrenched in your position instead of admitting that you didn't actually know the details.
Good point - seasonal factors are important. OK, let's look at that. If we just look at the first 4 months, we can remove that effect:
Jan Feb Mar Apr Total
2010 8,525 8,651 8,787 9,103 35,066
2011 8,412 8,648 8,750 8,762 34,572
Change -1.3% -0.0% -0.4% -3.7% -1.4%
Apply -1.4% to the full year figure:
2010 9,034.0
2011 Proj 8,906.7
and that gives us:
Peak 9286
2011 Proj 8,906.7
Change: -4.1%
So, yes, that makes a difference: that's less than the unadjusted effect, and the adjusted decline less than the overall -10% decline in oil consumption. Still, gasoline consumption has declined somewhat. Probably population has grown by 4% since then, so we're still at a decline of about -8% per person/household vs -14% for overall per capita oil consumption.
Now your original point was "The impact of high prices is still the same on budgets since gasoline consumption has been basically flat."
I'd say again: 1) that gas consumption has fallen somewhat and 2) household budgets aren't the only thing that's important. If net imports have fallen, then the effect on the trade deficit is smaller - that means a different impact on someone's income. So, what's going on? Well, other sectors are operating more efficiently which helps them and their employees and customers. Also, of course, Texas and N. Dakota are feeling mighty good about their oil exports. Heck, the Governor of Texas may run for President based on that.
Nick, we all know that GDP is a made-up number number. Inflation is overstated. By about 2-3% per year. Which is why, in reality, there has been no real recovery.
I think you mean "Inflation is understated", which would mean that GDP was overstated.
I'm familiar with those arguments, but they don't really make sense to me, especially lately. After all, it's pretty easy to see that car sales etc have gone up.
Yes, inflation numbers are adjusted for quality, substitution, etc. Don't you think inflation numbers should be adjusted for more than just simple quantities? Isn't a modern car very different from a Model-T?
"US manufacturing output has dropped slightly, but so has manufacturing sales - manufacturing imports haven't risen, as far as I've seen. Do you have data?"
http://www.politifact.com/truth-o-meter/statements/2011/jun/06/austan-go...
Keep in mind that manufacturing output is very, very different from manufacturing jobs.
The US manufactures 50% more than it did in 1980, while it probably only has 50% as many jobs - due to growth in manufacturing labor productivity.
This creates endless confusion on this topic.
I think that is a very under-appreciated point. Many people say that US manufacturing is "dead" and a "mere shadow of its former self" and this is not true. Lots of high value (often low volume) stuff is manufactured in the US - is the the high volume, low value stuff - consumer goods, mostly, that has moved offshore.
What is true is that the amount of people manufacturing employs is a mere shadow of its former self, and that is creating a lot of structural unemployment. The large numbers of medium value, reliable jobs for people without university education, have shrunk over the decades, and there hasn't really been anything to replace them. Employment in retail has gone up, but they are hardly "medium value, reliable jobs"
I would argue that typical college grads are now in that "medium value" job market, and there are too few jobs for them as well. The "service economy" does not need a huge number of high-skilled workers; it offers a large number of nearly minimum-wage jobs, which are highly dependent on those with better jobs.
The manufacturing economy didn't pay their workers well because they were high-skilled - they had unions and no competition with international low-wage manufacturing.
Well, at least one company (person) decided to pay their workers well because they thought it would benefit the company more than it cost.
http://www.nytimes.com/2006/04/04/business/worldbusiness/04iht-wages.html
I might add that this model, the employees sharing in the profits, seems to be the preferred model used by the Wall St banks.
I will concede that there was no cheap imported competition at the time - in fact Henry Ford occupied the position of cheap competition, and it worked until everyone else caught up.
I think the main effect of unions in recent decades has been to slowly strangle a lot of businesses so that you have a few left that can afford to pay union wages and conditions, but they are also rendered uncompetitive against non unionised and/or foreign companies that do not have that baggage.
this model, the employees sharing in the profits, seems to be the preferred model used by the Wall St banks.
Funny - I like Ford doing it, but don't like banks doing it. It feels like banks make too much money - I wonder if that's true, and if so, why?
It feels like banks make too much money - I wonder if that's true, and if so, why?
I am sure that half of America feels the same way.
Banks didn't make as much money back in the day when they just provided "banking services". But these days, when they make so much money by "trading" for their own account, using their depositors money to borrow against, they make lots. In effect, they have been able to do what very few other businesses can - they have decoupled their profits from the actions of their paying customers. So, as long as they can play the markets successfully, they can make lots of money. When they can't, well, they get bailed out. I think a lot of the money has come at the cost of their customers/general investors, from when they short stocks, use credit default swaps to bet against third parties, etc.
In my opinion the government needs to be very diligent about applying the tax laws to the banks, and they should bring back Glass-Steagall.
It is wrong to have the bank that is servicing you, having the ability to bet against you, for their own profit, yet this is exactly what is happening.
A good explanation of what a new version of Glass-Steagall could look like is here.
as long as they can play the markets successfully, they can make lots of money. When they can't, well, they get bailed out. I think a lot of the money has come at the cost of their customers/general investors
If they can privatize profit, and socialize risk/cost, then their money is coming from the taxpayers.
This is true to some degree. Medical devices and defense/homeland security related equipment come to mind.
However, one thing that is striking is that there have been extraordinary reductions in income and benefits for many North American industrial workers. For example, in the auto industry, there have been major concessions on pay and benefits - these often include two tier pay systems where new employees are hired at $15/hour with minimal benefits.
Aside from this, one as to be careful about defining the value of the remaining manufacturing since many components are manufactured outside of North America.
one as to be careful about defining the value of the remaining manufacturing since many components are manufactured outside of North America.
My understanding is that official manufacturing and import/export stats account for this.
Reading TOD almost two years now. I thought the discussion of affordability of oil already moved from the argument of the simple height of oil price to the ratio oil expenditures/GDP?? To express affordability in terms of gold is ofcourse interesting, but as some commenters already said, gold price seems to be in a bubble right now as well, so it seems no longer a strong reference.
I would like to mention the example of France. In France we have to import all our crude oil. It cost in 2009 about 40 billion Euros (reference below), 10% of the total costs of imports and 2% of the GDP. The annual average crude oil was about 50 dollars/barril, so if the annual average of 2011 will be 100 dollar, the French economy will have to pay twice for its oil, an extra 2% GDP, in other words it will entirely swallow the meagre 2% growth of GDP if we dont find room to pay from elsewhere.
I would be very interested to see some updated charts on the global affordability of oil expressed in oil expenses/GDP.
Menno
Le pourcentage des factures d’importation d’énergie dans les factures totales d’importation
- Facture total de pétrole et gaz de France en 2009
La facture pétrolière est de 29 milliards d’euros
La facture gazière est de 9,2 milliards d’euros
http://www.developpement-durable.gouv.fr/IMG/pdf/Ref-4.pdf
- Facture totale de tout les importations de France a 2009 : 398 milliards d’euros
Calculer la pourcentage :38/398= 9,6%
Gold is hardly in a bubble, it's just part of propaganda to prevent a panic buying and an overnight collapse in dollar prices
Oil and Gold or any major commodity have always moved together, no wonder the price of a basket of commodities valued in Gold has been roughly constant for the past 2000 years. Gold is not regarded as a hedge against inflation for no reason
Yes! The ratio Oil / GDP is a useful way to look at it. Basically, how much of your countries goods and services must you trade to purchase oil. If this ratio gets too high then it causes a recession. Morgan Downey, who wrote the excellent Oil 101, had this excellent post on the topic:
http://scarcewhales.blogspot.com/2009/07/us1000-per-barrel.html
David Murphy wrote up a good article on Net Energy which included a discussion about the economic cost of energy.
http://netenergy.theoildrum.com/node/6318
It had this very interesting chart along with a discussion about when recession might happen.
Johnathan has often pointed out that some countries import much less of thier total energy and so can afford much higher prices than countries (like the US) that import a large amount of total energy. If you compare China and the US, China has a total energy production of 1.5 billion tons of oil equivilent a year and imports 200 million tons of oil (about 13%). The US had total energy consumption of over 2 billion tons of oil equivilent, but imported over 600 tons of oil and 100 tons of nat gas (about 35%).
http://mazamascience.com/OilExport/
I think if we studies these import / domestic statistics, a model might be created that predicts which country will contract in usage going forward and who will increase.
Son and father are getting ready for a desert trip.
- "Daddy, isn't it dangerous to cross the desert with so little water?"
- "Don't worry, son. I've got a water bottle, you've got a water bottle. If you're short of water I'll sell you some, if I'm short of water you sell me some. That way we've got a free market; that's important you see."
- "But daddy, what if we both run out of water?"
- "That won't happen, son. We've got a free market, see? As we run out of water, the price we're willing to pay for water will increase. That will attract investment into private research and development to develop alternative sources of water. The increased price will make it feasible to drill for water in places where previously it was not economical to do so. Advances in technology will make it possible to plant new, refreshing oases where right now you've only got barren sand. You don't have to worry about what solution the markets will come up with; Adam Smith's invisible hand takes care of all that. As long as we've got a free market we're saved."
I'd rather take my chances with the "invisible hand" rather than depending on the iron fist any day.
The market is a useful tool in some circumstances, and not very useful in others.
The market has no foresight. It balances supply and demand on prices today, right now. This works when the future is exactly like the present. But things like a peak and decline in oil production, a river rising to cover a flood plain, a buildup of toxic chemicals: these cannot be properly handled by the market.
The market is also very poor at handling situations where there are no substitutes. A monopoly, or natural monopoly. Anything with an inelastic price response is signaling that there is poor substitution and some other mechanism will be needed to respond to the situation.
The market may also allocate capital very poorly. Once past the peak in oil production putting lots of extra capital into oil production just results in more dry / poor performing wells. High oil prices send lots of extra money to encourage more drilling. Instead, the money needs to be put into other solutions, such as efficiency or other energy supplies. Yet those other options are starved for capital because it was needed to purchase oil.
There are also many circumstances where the market is a fine mechanism.
I fear that when economics leaves the realm of science and enters ideology then we are in serious trouble.
I fear it is not a science. We are in trouble.
jon - Excellent points IMHO. Re:"Once past the peak in oil production putting lots of extra capital into oil production just results in more dry / poor performing wells. High oil prices send lots of extra money to encourage more drilling." But not just past PO: the drilling boom of the late 70's/early 80's resulting from the embargo/price spike led to one of the least profitable periods in the oil patch over the last 70 years. Though there were obviously more reserves left to develop at that time then now, the success rate and rate of return were terrible. No single event during my 36 yeasr has done as much damage to the oil patch as this high price period did. Hundreds of companies, including a Big Oil or two, were eventually destroyed as a result. The rig count topped 4,600 with a large percentage drilling prospects that had little chance of succes. If one were to just observe the added reserves and increased rates one might think otherwise. I've never seen anyone attempt to quantify the results. But abundant anecdotal evidence is avaialble. I'll offer just on simple example: the Destine Dome trend in the federal waters off the FL coast. In leases bonuses alone the industry invested over $1 billion. And that doesn't include the seismic, overhead and drilling costs. And how much was produced from the trend? Exactly ZERO bbl of oil and ZERO mcf of NG. Easy to calculate the ROR of that huge investment.
the success rate and rate of return were terrible.
But why was that?? Was the geo info bad? Were the companies irresponsible? Badly managed? Badly regulated?
I hate to jump in on Rock's answer but from what I know about those days it was a mania. Everyone thought they were JR Ewing, oil field hands jumped from company to company chasing a raise and getting it. The oilfield companies of all stripes spent money like it would never end. Lease rates were expensive, pay was over the top for the time, expense accounts and outright theft was outrageous but normal for the time. I've heard stories of oil field reps and tool pushers stealing thoussands of gallons of diesel and pipe used at drill sites for their farms. I actually used to live in a house that most of the steel the house was built with was probably borrowed from the previous owners employer.
I have heard anecdotal stories of entire land rigs being stolen one piece at a time. Don't even bring up the female salesmen (hookers).
Sounds like bad management, caused in large part by a "rush".
Sounds even more like a classic boom and bust, where companies are killed by investments that would have been poor in normal times, looked good in a high-price era, and were truly terrible in the low-price bust era that followed.
Nick - Exactly. Easy to just bump the price expectations up to justify the effort. Managers didn't worry about lossing their jobs by drilling dry holes but by not drilling enough wells. And the public/shareholders were fully on board. Herd mentality ruled the day across the bosrd. I still vividly recall one shareholder of Natomas NA (I mention in detail below) exclaiming at a stockholder meeting he was selling his stock because management was projecting oil to be only $60 by 1986 and he read a Wall Street Journal article predicting $90 oil by that time. He didn't want to own stock in a company with a management that understood the oil biz so poorly. BTW: 1986: oil = $10/bbl.
"I'll offer just on simple example: the Destine Dome trend in the federal waters off the FL coast"
Rockman I wouldn't have used this as an example although I agree with your greater point, because I thought the destin dome was hindered by the US government not allowing any more drilling to take place there, not because it wasn't a possible play that could have had commercial amounts of natural gas and oil.
I was actually working on Chevron jobs when they were fighting the Feds to pay them back for the leases or let them drill. Did I miss something? We always heard they had high H2S in that area so I never cared to go there anyway!
wildman - I agree but I wanted a very simple example. I can think back to many dozens of better cases of p*ssing away money on fantasies...too much tech explanation required. I think the feds did rebate back a good bit of those lease bonuses since drilling was never permitted area wide. Yep...they have been developing the Cretaceous along the east side of the Main Pass area. And yep: pretty sour from what I've heard.
Here's a company specific example: Natomas North America. I was Div Development Geologist. During their very short life they spent over $550 million and found $40 million in reserves. Eventually they closed the door when a $100 million bond came due and they couldn't pay $1. Near the end I refused to drill what management had declared a "development well". So they transfered it to the exploration dept and they drilled it. Not only a dry hole (with the last of the monies they had) but almost blew out (as I had predicted) endangering the lives of the drill hands. I decided to bail before they killed someone on my watch. Besides being grossly incompetent they were very corrupt. Was threatened when I started asking too many questions. Eventually I wouldn't let my two young geologists go to the drill sites and I would only show up armed. Pretty freaking dumb on my part, eh? I was young, foolish and full of myself. But I'm much better now...it's just a job...nothing personal. LOL.
Just thought of another good example: a joint venture with a pipeline company (well known for being easy to take advantage of). Drilled 18 dry holes in a row with a prospct generating company. Not one commercial completion. And did they managers with the prospect generators lose their jobs? Hell no. Two of them retired millionaires. At that time if you knew how to negotiate a deal you could make a fortune driling dry holes when someone else is paying the bills. Happened 100's of times.
A monopoly, or natural monopoly
Bingo. The transition to EVs required overcoming deep resistance from entrenched interests - perhaps the biggest was those employees of all of the car companies whose skills/careers would have become obsolete. GM didn't embrace EVs until it was close to bankruptcy.
The other market failure that you hinted at, but didn't explicitly include, is externalities, including the $trillions spend on securing oil supplies.
GM didn't embrace EVs until it was close to bankruptcy.
Well, I'm not sure that GM has really "embraced" EV's yet - they don't even have one, and I'm not sure if there are plans for one anytime soon.
When they did produce an EV, it wasn't because they were close to bankruptcy, it was because they were mandated to.
The Volt is definitely an EV: you can drive it for 200,000 miles without ever using gas, if you want to.
Now, as a practical matter you can call it a PHEV (plug-in hybrid EV), but it's an extremely important part of the transition from ICE to EV, and GM deserves full credit for that.
The real question is whether the Prius plug-in or the Volt come closer to hitting the ideal sweet spot compromise between ICE and pure EV that works best at the moment.
Well, EV with an engine, but we are splitting hairs over naming here.
You pose a good question - I think it is too early to tell.
I will also say that both are too expensive, in my opinion, to really be a large scale solution. Those who feel the need to keep driving large vehicles, will likely continue do so. And those who want economical motoring, because they need to save money, are, presently, better off buying a Kia Rio, Honda Fit, etc. The hybrids and Ev's are bought by a fairly small group of people who have enough money to buy them, and are concerned about saving money on fuel.
I think it is an even smaller group that will buy an ev, just because it is electric.
I remain of the opinion that a smaller, cheaper EV would be the way to go.
Had a funny day yesterday - in the space of ten minutes, while walking on a couple of errands, I saw;
- A Prius
A VW diesel pickup (likely 15yrs old)
-A civic hybrid
-An original Insight hybrid
-A Tesla
-A Citroen 2CV
Not a bad collection of alternative embodiements of energy efficient vehicles.
The Prius was being driven by a retired couple, the VW by self employed handyman, the civic hybrid by a soccer mom with a baby carrier in the back, the Insight by the goalie for the local hockey team, (who is 6'3"!), the Tesla by a fifty-something guy who is the town;s eco-playboy, and the 2CV by a very cute, Birkenstock wearing, lapdog carrying, 20 something woman who is that sort of eco-conscious type I call a "granola" .
There is much, much more to the decision about what car people buy than what powers it or how fuel efficient it is. I don't see the Volt, leaf or Prius appealling to that many people, as long as cars are still a reflection of your personality, rather than just a means of transport.
The US is sorely lacking in other options:
- TDI SUVs and small pick-ups
- CNG SUVs, cars, and minivans
Here, CNG is prevalent, and even refill stations are not rare. A soccer mom with a minivan or SUV or a contractor with a truck could be using fuel currently priced at about $1 per gallon. Given today's performance engines everywhere, even a dual-fuel non-turbo would work fine. A dedicated CNG would be fine too.
Given sales of GM hybrid trucks in the hundreds of units per month, you'd think somebody would trial-market a few CNG vehicles.
I agree.
The average new car in the US costs about $30k, so the PHEV Prius at $28k is right in there.
On the other hand, as a country the US hasn't really made the choice to move away from ICEs:
http://energyfaq.blogspot.com/2010/06/how-quickly-will-we-move-to-electr...
yes, the Prius is right there with the average of all new cars, but now compare it to the average of midsize/compact cars - Corolla, Civic, and smaller, and it is well above.
The average is being held up by the large cars, minivans etc - which are meaningless to someone looking to save money/fuel.
I agree the US is not even close to making any real move away from ICE's. Even hybrid technology, now over a decade old, has less market penetration than all wheel drive.
There just isn;t much change happening, other than people driving less. It needs one or all of (in decreasing order of likelihood) ;
- a big rise in fuel prices
- a big decrease in costs of hybrid/ev technology
-a strong government mandate
In the absence of these, the change is going to take a long time..
Yes.
Again, a quibble: yes, the average is held up by bigger and more expensive vehicles. But, people are buying those vehicles. The point: the Prius is affordable for the average car buyer. Further, Consumer Reports agreed that it is cost competitive with comparable pure-ICE vehicles when gas prices were lower.
I agree it would be nice to see some cheaper hybrids - I think Honda is doing that to some extent with the Insight - aiming for a more economy-minded consumer. The eco version of the Chevy Cruze looks like a pretty good option - 40MPG. Heck, if you want cheap, a 10 year old Honda Insight is the way to go: 60MPG, and probably only $5k to buy.
The thing to keep in mind, of course, is external costs (security of supply, "conventional" pollution, CO2, etc, etc). If those things weren't a problem, we wouldn't be worrying about HEV/PHEV/EREV/EVs. Heck, TOD wouldn't exist.
Your are right, the Prius is affordable for the "average" of car buyers - it is just not what they want, and efforts, to date, to change what they want, have not been successful - the % of trucks/Suv's/minivans has steadily increased over the last decade.
Same as diet soft drinks or even bottled water, are better alternatives than sugary soft drinks, and are no more expensive, but the majority of people still go for the bad stuff.
I agree a low cost hybrid is needed, that can go into compact cars and make them 60mpg+ machines - but the mfrs do not seem to be even close to that.
I think Chevrolet might just be onto a winner with the Cruze - the Eco model is apparently much better to drive than the base model, gets better mileage, etc. Chevy may bring the diesel version too.
I wrote about that here. And the lead story on the front page of that site, today, is about American Electric Power closing down their demo CO2 capture project because of continued policy uncertainty.
I disagree that the external costs are what is driving EV related developments - it is govt, and just the oil price in general - look at the hypersensitivity of the gov to pump prices. Most people don't have a clue of the external costs (military etc) and there is no serious move to do anything about CO2 - it is a case if someone does something that happens to save CO2 - like an EV - then they milk that for all its worth, but very few are doing it primarily to save CO2 - myself included.
the Prius is affordable for the "average" of car buyers - it is just not what they want
I think part of the problem is that the particular configuration isn't right for a lot of people - they need more choices. Toyota is planning to bring out a line of cars based on it. Other car makers are doing similar things to broaden the hybrid/EV lineup. That should help.
An increase in the CAFE will also help, as it will push car makers to hybridize more models.
I disagree that the external costs are what is driving EV related developments - it is govt
But why is govt pushing EVs? Because of a recognition of the cost of dependency on imports, the possibility of supply shocks, etc, etc. Those are among the external costs I'm talking about.
Most people don't have a clue of the external costs (military etc)
Which is part of the reason hybrids aren't more popular. And, of course, some people can't worry about anything beyond their own costs. Still, I know a few people who have a family member in combat who are ferociously pushing for HEV/PHEV/EVs...