The Specter of Recession
Posted by Dave Cohen on October 4, 2006 - 11:49am
Oil prices have dropped to the lowest level in six months, as markets' concerns about geopolitical instability are replaced with worries about an impending US-led economic slowdown The plunge in oil prices has hit mutual funds for $4.5bn (£2.4bn), and there are fears that more investors could fall victim to unexpected falls in energy prices...Before recently, all the fears were geopolitical in nature. Easing of those concerns—for no good reason at all—has been replaced by the specter of an American recession. Let's examine that possibility. As it turns out, the view here is that a recession—perhaps a severe one—may be more likely than not.Hedge funds and oil traders are selling their crude holdings because of fears that the US economy could slump next year, dragged down by the stalling housing market. Figures released yesterday showed US house prices falling last month for the first time in over a decade, while the inventory of unsold houses was at its highest level for 13 years. Traders are concerned that an American slowdown would drag many other major oil importers down, causing worldwide energy demand to plunge.
"Worries about US growth are an important factor," said HSBC economist John Butler. "We are concerned about the possibility of recession in the US."
[editor's note, by Prof. Goose] Please folks, don't forget to go rate this story of Dave's at reddit and digg. This is one of his best, and he put a lot of effort into it. He deserves as many eyeballs as he can get!
- The Negative Yield Curve
- The Housing Bubble
- The Oil Price Shocks Model
Paying Attention to What's Important
The work of Dr. James Hamilton figures prominently in this story. Stepping back a bit from the immediate subject—will there be a recession soon?—it is altogether clear that Hamilton's work takes the role of oil in fueling economic growth seriously, whereas other, more shortsighted analysts often try to explain it away on superficial grounds, e.g. the percentage of family gasoline expenditures in the total household budget and the like. These kinds of arguments miss the point by a wide margin. Every aspect of modern civilization owes its existence to some—usually large—extent on oil, its use as the primary feedstock for liquid transportation fuels or its many other uses for creating everyday products we take for granted—various plastics, for example, including parts of the computer on which I am typing out this story.It is inconceivable to me that any serious historical analysis of the Industrial Age since 1870 and the economic growth that has attended it would not emphasize the availability of abundant, cheap oil—regardless of past oil shocks, worries about scarcity and price volatility. Dr. Hamilton seems to appreciate this, while others do not. Hence, he writes frequently about oil and that work includes his highly recommended How to talk to an economist about peak oil.
The Negative Yield Curve
The current negative (or, inverted) yield curve is shown in Figure 1 and its significance is explained below the figure by Arturo Estrella of the Federal Reserve Bank of New York.
The curve is inverted because of the negative
spread between the short-term rates (the 3 month)
and the long-term rates (the 10 year)
Figure 1 -- Click to enlarge.
The difference between long-term and short-term interest rates ("the slope of the yield curve" or "the term spread") has borne a consistent negative relationship with subsequent real economic activity in the United States, with a lead time of about four to six quarters. The measures of the yield curve most frequently employed are based on differences between interest rates on Treasury securities of contrasting maturities, for instance, ten years minus three months. The measures of real activity for which predictive power has been found include GNP and GDP growth, growth in consumption, investment and industrial production, and economic recessions as dated by the National Bureau of Economic Research (NBER). The specific accuracy of these predictions depends on the particular measures employed, as well as on the estimation and prediction periods. However, the results are generally statistically significant and compare favorably with other variables employed as leading indicators. For instance, models that predict real GDP growth or recessions tend to explain 30 percent or more of the variation in the measure of real activity. See Estrella and Hardouvelis (1991). The yield curve has predicted essentially every U.S. recession since 1950 with only one "false" signal, which preceded the credit crunch and slowdown in production in 1967.So, a negative yield curve appears to be a robust indicator of recession. The reason for this is discussed in Historical Yield Curve from Fidelity.
People talk about interest rates going up and going down as if all rates moved together. The truth is, the rates on bonds of different maturities behave quite independently of each other with short-term rates and long-term rates often moving in opposite directions simultaneously. What's important is the overall pattern of interest-rate movement -- and what it says about the future of the economy and Wall Street. Rates are like tea leaves, only much more reliable if you know how to read them.My recommendation is that you read James Hamilton's Econbrowser posts on this subject in order to more fully understand the negative yield curve signal.Inverted Curve
At first glance an inverted yield curve seems like a paradox. Why would long-term investors settle for lower yields while short-term investors take so much less risk?The answer is that long-term investors will settle for lower yields now if they think rates -- and the economy -- are going even lower in the future. They're betting that this is their last chance to lock in rates before the bottom falls out.
- Reading the Yield Curve
- When should we worry about the yield curve?
- The yield curve and predicting recessions
- Inverted yield curve edges closer
Jonathan Wright, a brilliant research economist at the Federal Reserve Board, recently completed a very interesting paper titled The Yield Curve and Predicting Recessions. Wright's research seems to have been influential in Fed Chair Ben Bernanke's recent assessment that the current very flat yield curve does not signify a coming significant economic slowdown.Indeed, you can run Wright's model at Reckoning the Odds of Recession. A model run for today, October 2nd—based on a 10 year rate of 4.61%, a 3 month rate of 4.77% and a Federal Funds Rate (September 29th) of 5.34%—indicates a 42.9% chance of a recession in the next 4 quarters. These are the same numbers the Fed is seeing.
The Housing Bubble
Here's what The Economist had to say about the housing bubble in June of 2005 with one of their accompanying graphs, labeled Figure 2 here.

Figure 2
The worldwide rise in house prices is the biggest bubble in history. Prepare for the economic pain when it popsDespite a small bit of good news reported by Hamilton, the data trend is not looking good lately. Here's some text and data from Watching Prices Swing in Health, Housing and Stocks (New York Times, September 30th).Japan provides a nasty warning of what can happen when boom turns to bust. Japanese property prices have dropped for 14 years in a row, by 40% from their peak in 1991. Yet the rise in prices in Japan during the decade before 1991 was less than the increase over the past ten years in most of the countries that have experienced housing booms (see Figure 2). And it is surely no coincidence that Japan and Germany, the two countries where house prices have fallen for most of the past decade, have had the weakest growth in consumer spending of all developed economies over that period. Americans who believe that house prices can only go up and pose no risk to their economy would be well advised to look overseas.
- For the first time in 11 years, monthly figures showed the median price of a previously owned home falling as inventories of unsold homes rose to levels not seen in more than a decade. The National Association of Realtors said that the median price in August fell to $225,000, down 1.7 percent from August 2005. That was the first time since April 1995 that the national median price was lower than the month a year before.
- Volume fell as well as prices. The number of existing homes sold, which make up about 85 percent of all home sales, declined 0.5 percent in August from July. They had slumped in that month by 4.1 percent from June.
- At the same time, the Commerce Department said that sales of new homes rose 4.1 percent in August from July. But economists warned against reading too much into those figures because the government adjusted the July figure downward before making the comparison.
Meanwhile, the housing market has been leveling off. The Commerce Department's report Monday said spending on private home construction dropped 1.5 percent in August to a seasonally adjusted rate of $617 billion. The August decline followed an even bigger 2.1 percent July decrease and marked the fifth straight home building has fallen.As with the Law of Gravity, what goes up in a speculative price bubble must come down, being divorced from the fundamentals. Aside from the symptoms of a deflating balloon, which are growing more robust, what would the consequences be? Let's turn to The Housing Bubble Fact Sheet, a July, 2005 analysis from the Centre for Economic Policy Research (CEPR).
The generalized bubble in housing prices is comparable to the bubble in stock prices in the late 1990s. The eventual collapse of the housing bubble will have an even larger impact than the collapse of the stock bubble, since housing wealth is far more evenly distributed than stock wealth.Section 5 of the report states that "the collapse of the housing bubble will throw the economy into a recession, and quite likely a severe recession." Their verbatim analysis—it seemed pointless to try to condense it—goes like this:
- Housing construction is equal to approximately 5 percent of GDP. Construction of new homes has been going on at a near-record pace over the last few years, in response to the run-up in housing prices. Home construction could easily fall back 40 percent (this was the drop off in the 1981-82 recession), which would imply a direct loss in demand equal to 2 percentage points of GDP.
- The large wealth effect associated with the housing bubble, which has spurred a consumption boom in the last few years, will go into reverse as housing prices plummet. Research from the Federal Reserve Board shows that a dollar in additional housing wealth leads to 4 to 6 cents of annual consumption. This implies that a loss of $5 trillion in housing wealth would lead to a decline in annual consumption of between $200 billion and $300 billion. This loss in consumption is equivalent to 1.6 to 2.5 percentage points of GDP.
- Combining the 2 percentage point drop in demand due to a falloff in housing construction with the 1.6 to 2.5 percentage point drop in demand due to the reversal of the housing bubble's wealth effect leads to a falloff in demand of between 3.6 and 4.5 percentage points of GDP. If employment fell in the same proportion, this would imply the loss of between 5.0 million and 6.3 million jobs. Since the federal government is already running a large deficit, and the country is running a very large trade deficit, the government's ability to use fiscal and monetary policy to boost the economy out of the recession will be severely restricted.
Since we are trying to gauge the likelihood of a recession, the situation does not look good in either case. The housing market is very shaky.
Oh, by the way, did I forget to mention—worth reading from Resource Investor—how the dollar has been faring?

Uhmmm... That doesn't look good -- Figure 3
But there is no space in this story to talk about the longer-term decline of the dollar or the large U.S. Current Accounts and Trade deficits. Or even the rising mortgage defaults in California (August, 2006).
Lenders sent 20,752 default notices to homeowners across the Golden State, up 10.5% from 18,778 the previous quarter and up 67.2% from 12,408 in the second quarter of 2005....<rant>"This is an important trend to watch but doesn't strike us as ominous," said Marshall Prentice, DataQuick's president. "We would have to see defaults roughly double from today's level before they would begin to impact home values much."
That's right, Marshall, nothing ominous about a year-on-year 67% rise in default notices in the world's 5th largest economy, though doubling of defaults doesn't take long at that rate, does it? Nothing ominous, Marshall, unless you are the one doing the defaulting because your kid got sick and you have no health insurance, you work at Wal-Mart, you made the mistake of using credit cards for stuff you thought you needed and now you use them for food & gas, you have a recent interest-only mortgage, your house is worth less than it was last year and you are no longer able to declare bankruptcy since the Republicans changed the law—but that wouldn't be you, would it, Mr DataQuick?
</rant>
[editor's note, by Dave Cohen] I am so sorry! I just lost my grip there. OK, I won't read or agree with Kurt Vonnegut anymore. Mea Culpa.

Old Socialists don't die, they
just fade away — for Yankee
Let's, ahhh, resume the analysis. Here's our third factor.
Oil Price Shocks
In June of 2004, the Wall Street Journal published Oil Prices Start to Pinch, Stirring Concern Over Economic Impact (subscription required).High oil prices have preceded or coincided with nine of the 10 U.S. recessions since World War II -- a history lesson that has policy makers, executives and economists scouring for evidence that it could happen again.This fear is based on Hamilton's theory of oil price shocks—you can read the original paper but this is only for the very brave. The view is described by the Federal Reserve Bank of San Francisco (FRBSF) in Why Hasn't the Jump in Oil Prices Led to a Recession? (November, 2005).
Indeed, Figure 1 [see Figure 4 below], which plots the real, inflation-adjusted price of imported petroleum, shows that high oil prices have frequently coincided with recessions. In a series of papers, Hamilton (1983, 1996, 2003) has argued forcefully that the oil shocks were responsible for these recessions. However, he argues that not all changes in the price of oil have the same effect on the economy. For instance, a fall in oil prices is unlikely to boost the economy in the same way that an increase can drag it down. In addition, he argues that oil price increases that simply reverse previous price decreases are unlikely to have a significant effect. One approach he recommends to isolate the kinds of price changes that can affect the economy is to record an oil shock only if the prevailing price of oil is higher than it has been over the past three years.

Figure 4
Performing Hamilton's transformation, the FRBSF comes up with Figure 5.

Figure 5
The authors critique Hamilton's model as shown in Figure 5, suggesting that the role of oil price shocks in previous [the 70's] recessions was exaggerated. They note that the magnitude of the oil price shock effect is much larger than direct income loss. See their paper for the details.
Plainly, the run up in oil prices since 2002 has not resulted in a recession. The Fed authors seek to explain this. The fundamental premise is that oil prices affect the economy because the price of imported oil is a "tax" on U.S. domestic users. "For each $10/barrel increase in oil prices, the United States pays an effective "tax" of about $50 billion (5 billion barrels times $10), or 0.4% of GDP." The authors argue that the current episode (since 2002) is different, in part, because "the run-up in oil prices in the past few years seems to reflect the endogenous response of prices to the strength of global demand [mostly from China]." Therefore:
- Previous recessions involved exogenous (geopolitcal) shocks to supply.
- Demand increases originating in China coupled with inelastic global supply produces an increase in the oil price for the U.S. similar to a decrease in supply.
- However, a demand-driven price shock will not have the same effects on the U.S. economy as a decrease in supply would.
A related argument can be found in Barreling Down the Road to Recession? from the Federal Reserve Board of St. Louis (September, 2006).
Finally, can we expect a recession to occur as a result of current oil prices? James Hamilton believes that oil shocks affect economic growth only when, as a result of the higher prices, consumers' spending behavior changes. As the accompanying chart [Figure 6 below] shows, PCE [personal consumption expenditures] growth has remained positive since the real price of oil began to rise. The negative PCE growth that accompanied the previous oil shocks has not yet occurred during the current run-up in oil prices. Thus, as of now, economic growth appears to be more resilient to the negative effects of rising oil prices than in the 1970s and early 1980s.
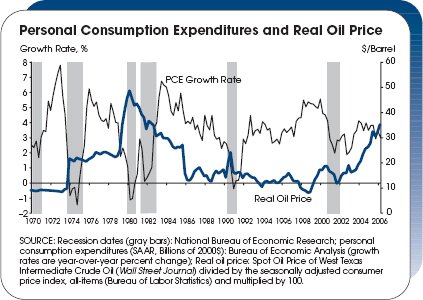
Figure 6
As you can see, the PCE index has remained positive despite the increasing oil prices since 2002.
So, why include the oil price shock effect in this story if it has not, in fact, resulted in a recession over the last 4 years? The two-part answer is this:
- Despite the recent steep drop in oil prices, it is likely this is due to a number of temporary factors that have been extensively discussed at The Oil Drum. The most likely scenario is that the price will begin rising again, starting with the end-of-year seasonal adjustment. The fact that $60/barrel remains the real floor price persuades me even more of the correctness of this assumption. See Khebab's How Periodic Are the Oil Price Fluctuations? The fundamentals have not changed and OPEC can still create downward pressure on supply if prices fall further.
- Even if rising oil prices have not caused a recession, it is still the case that for each $10/barrel increase in oil prices, the United States pays an effective "tax" of about $50 billion, or 0.4% of GDP. Prices had quadrupled since the start of 2002 until very recently. As I said, I believe they will rise to high levels next year.
Therefore, rising oil prices will continue to have their detrimental effects on personal expenditures and also add to inflationary pressures.
Peak Oil, Recession and Oil Prices
Most analysts anticipate a slowdown in 2007. Taken together, the three factors discussed here do not point to a healthy economic outlook. Indeed, if all three effects are piled up one on top of the other, it is possible that there will be a severe recession next year. This may lead to the dreaded deflationary scenario for oil prices.For those concerned about peak oil, low prices resulting from decreased demand in a recession has two detrimental effects.
- Development of new oil & natural gas projects that now depend on high prices is curtailed.
- Development of substitutes for oil & natural gas is curtailed.
This is the worst case I can think of. I do not know that there will be a severe recession but it is a matter of degree. Even a large slowdown or mild recession putting downward pressure on price will have detrimental effects. In the best of all possible worlds, we would see a steady price rise over time reflecting the peaking of world oil production. Hamilton (in How to talk to an economist about peak oil) has argued in a friendly, contrarian kind of way that if the peaking of global oil production is coming in n-years, then
what economists would therefore expect to see under the n-year scenario would be for the oil price to rise steadily over all these n years, gradually producing greater and greater incentives for the needed conservation and the needed development of alternatives between now and year n.Why don't we see that? Well, actually, we are seeing that since 2002, despite great price volatility. However, there are other problems:
- Denial about the peak oil phenomenon itself—this usually amounts to setting n as a large number measured in decades
- Lack of precision in predicting the peak for small values of n measured in years but less than a decade—this invalidates any n-year scenario because we can not predict n
- Deflationary scenarios that lower prices over short periods of time—a few years in the case of a recession—or even shorter periods of time reflecting volatility—a few weeks or months
Oil itself is not yet scarce but its price should always reflect the real geological, technological & economic constraints on supply. See Nate's Natural Gas - A Tale of Two Markets for similar reasoning applying to natural gas prices. Unfortunately, the workings of the near-term market (#3 above) combined with the other factors (#1 and #2) will not solve an inevitable problem which is, ultimately, a tragedy of the commons. But that will be another post.
Sincerely,
Dave Cohen
Senior Contributor
[editor's note, by Prof. Goose] Please folks, don't forget to go rate this story of Dave's at reddit and digg. This is one of his best, and he put a lot of effort into it. He deserves as many eyeballs as he can get!
Contact
- Content: editors at theoildrum dot com
- Tech support: support at theoildrum dot com
License

This work is licensed under a Creative Commons Attribution-Share Alike 3.0 United States License.
http://thehousingbubbleblog.com/?p=1561
Question - What, if any significance is there to the simultaneous drop in the dollar and the rise in oil? Does the fact that oil is priced in dollars mean that the price rise is not as significant to the economy?
What simultaneous drop in the dollar were you talking about?
The Dollar index dropped dramatically in 2002 and 2003 while the price of oil rose only slightly. Since then the price of oil has rose dramatically while the dollar index has muved, up and down, in a very narrow range.
Ron Patterson
http://themessthatgreenspanmade.blogspot.com/2006/10/not-sustainable.html
Quoting Dr. Kurt Richebacher. "At around 80 years old, he still knows how to blast a Federal Reserve Chairman and, having been around so long and having seen so much, he takes great issue with what he's witnessed in the U.S. economy in the last couple decades."
Realized? What do you mean realized?
His entire 20-year stint as Fed chief was spent carefully making it reality. That's all he's done, breaking it down brick by brick.
When are we going to get rid of the silly delusion that the Fed exists for the benefit of the American people?
Following are some fascinating numbers from the Oil & Gas Journal showing the year over year decline, 2004 to 2005, in EU energy production, in terms of oil equivalent. The EU showed no increase in consumption, but because of falling domestic production, imports as a percentage of consumption increased.
Energy importers want to import domestic consumption less production. Even in areas with no increase in consumption, such as the EU, the import demand is increasing.
Energy exports can export domestic production less consumption. By and large, this export number is shrinking, because of the twin effects of flat to falling production and (in many cases) rapidly rising domestic consumption.
Rate of change in EU energy production, 2004 to 2005:
Crude oil production, -9%;
Gas production, -5.8%;
Coal, -5.7%;
Nuclear, -1.3%.
2005 total energy consumption per capita (Tonnes of Oil Equivalent, TOE):
EU, 3.6 TOE
Japan, 4.1 TOE
US, 7.8 TOE
I think that the conversion factor is about 7.3 barrels/tonne.
One of the "benefits" of a recession is lower prices. However, in a Post-Peak Oil world, that will only partially apply to energy, since we are likely to only see a demand respone and not a (net positive) supply response.
The problem that we face here in the US is our very high per capita energy consumption,and it will be very difficult to change. By and large, we live in large houses, long distances from work. Europeans by and large tend to live in smaller housing closer to work (or along mass transit lines).
Here in the US, we are colletively headed toward a cliff in our H2 Hummer, and the prevailing message from the "Iron Triangle" is to push the accelerator to the floor.
I do think that we are facing strong deflationary headwinds as Americans try desperately to unload highly leveraged assets.
Yergin's prediction was that rising production would force oil prices to come down to equalize supply and demand. The opposite has happened. Flat to falling production has forced oil prices up to equalize suppply and demand. Yet, the MSM still trots old Dan out on a regular basis.
http://www.mylinuxisp.com/~blawrence/CERA-Oct-06.pdf
I love some of the posts today, but this is my favorite:
In other words, the author asserts that Peak Oil is being undermined by an alleged oversupply of about 0.5 mbpd, which is about 0.6% of total liquids production, at a time when even ExxonMobil estimates that existing wellbores are declining at up to 5 mbpd per year.
In addition, we have credible evidence that the four largest producing oil fields in the world are declining or crashing, with steadily rising water cuts.
You know what the difference is between the per capita energy consumption in the EU and Japan (average of about 3.9 TOE per year) versus 7.8 for the US? It's the discretionary fluff here in the US. It's the majority of Americans driving to and from work who derive their paycheck from the discretionary side of the economy.
Let me be blunt. The majority of jobs in this country are not necessary. The Europeans live the way we should live, in smaller housing, close to work or along mass transit lines--using half of the per capita energy that Americans use.
I think that so many Americans are reacting so strongly (and irrationally) to the slightest signs that Peak Oil may not be real because they realize, at some basic level, that our imaginary economy--and our high per capita energy consumption--are doomed.
Let me put this is the most basic terms. You need to produce or perish. Jobs in discretionary sectors are going to be targeted for destruction by natural selection.
I am beginning to believe that Matt Savinar is right. As someone said, it is pointless to try to get someone to understand something when their income depends on them not understanding what you are saying.
We have largely become prostitutes to one another
Don't know if this is true, BUT check out this blog where a las Vegas mortgage broker is offering prostitution to close loans.
Hmmm...I'll let you guys tear this one up....
http://blog.lewrockwell.com/lewrw/archives/011473.html
Hey, I'm just here to help.
I can hear it now..........
Honey? whats this $200 service fee?
And why is she smiling?
I prefer to think of it in terms of artist/patron relationships.
That's my social model of choice : we should all be artists in some way, and appreciative consumers of all manner of art, whether it be haircuts, good coffee, street theatre... Work is overrated. You need to do it (and to produce stuff), but not as much as you think you do.
Is there anything really wronmg with exchanging services between people and does anyone seriously think it is desirable to stop doing it?
If I follow this logic, it is OK if I make a shoe for you, but repairing it is prostitution?
Then, I guess manufacturing and airplane is good. But that airplane needs to be designed. So if one company both designs and builds the airplane it is OK, but if a separate company provides the design as a service it is now terrible?
The distinction between goods and services is to a large degree meaningless and arbitrary.
I used to build houses, now I work on a computer all day and am much better off for it. Does that make me the happy hooker?
If globalization is reduced in a post-peak world with reduced transportation, it will become more necessary for individual nations (or even regions within nations) to have mixed economies with some base level of production kept local. Services retain value, but only if there is some production on which they can act. Somebody has to make the shoes on which the repairman plies his trade. If it's too expensive to import them from China, they need to be produced locally.
It seems to me that the fears of American post-peak decline due to a lack of a manufacturing base are largely based on an understanding of this fact.
Depends whether the globalization component is considered a given.
i.e. if you assume that you're morally bound to buy any given commodity from the lowest bidder, then Europe and the USA are f*cked, quite frankly. On a level playing field, i.e. no tariffs or subsidies, someone else will produce food, clothes, steel, cars, electronics, just about everything in fact, cheaper than we can. So actual production will be minimal in an advanced, high wage, environmentally-correct, high-rental economy. This is the big trend we see.
Technological innovation can arguably make up a lot of the gradient; but only if the economy never matures. i.e. the Chinese won't need to buy Euro cars or US electronics for ever.
The exposure we have in a globalised economy becomes pretty frightening if there's a risk of a blow-up.
If, on the other hand, a given economic basin organises itself for a minimum of self-sufficience in strategic areas, then the potential for a sustainable productive economy becomes much greater. I am well aware that I'm speaking heresy here.
I had severe misgivings at seeing the Euro textile industry sacrificed on the altar of free trade. If they do it to agriculture, I'll be on the streets protesting it.
It depends on whether the manufacturing can be done with unskilled labor. Unskilled labor is the area where China, and Mexico, etc excels. There's still a fair amount of skilled manufacturing in OECD countries that is competitive.
Historically, when the big fields roll over, a region can't increase its production. As I have repeatedly said, we have abundant evidence that our biggest fields are headed downhill--thus the flat to declining production, despite new wells coming on line.
I agree. I think we are declining on old fields at 3% in spite of infilling. I am making this conclusion by estimates of 5.5 million barrels of new usable capacity added since October 2004.
Even though I have a fluff job from the perspective of post PO, I do have my Plan B in place and have for the last two years. I will milk what I can outta this employment while it lasts.
I've been looking for the best way to describe what I am seeing in my business world...the best word is "contraction".
You can see contraction everywhere...contraction of budgets, workforce, size of candy bars, support services, patience...we are all contracting down to what is the thing of core value...not the nice to haves.
I remember reading about a chess club (perhaps in NY in the thirties or something) where men sat all day in smoky rooms, playing chess and betting on their games. How did they make a living? Off each other... a certain number of them had real jobs, and as they were not full-time players, tended to be not as good as the others, thereby injecting enough money for everyone to subsist... A simplified model of a service economy.
Gee... just like Las Vegas,
Or ... Indian gaming casinos,
Or ... those who work for the State Lottery system and claim they bring something of value to our civilization.
I often wonder which ship I'd be on.
Obviously, the weak link is that some of the players have to have real jobs. If they don't, the whole thing collapses.
Similarly, we can't really all make a living doing each other's laundry. In the end, clean laundry in a luxury. Food, water, shelter, clothing...those are the necessities. Someone has to do real work to provide them. And I suspect more and more of us will be doing it ourselves, as we lose our ability to pay someone else to do it for us.
Yeah, that's some good stuff. When I saw that link I immediately thought about the quiet hurricane season. I wonder how big of a chunk not having any big destruction has taken out of the economy.
by Frederic Bastiat, 1850:
THAT is the loose thread that is currently undermineing your peak oil revalries.
I'll give you props for the excellent spin though, sir!
But to your point about current prices - supply and demand in the market at any one point in time are the biggest determiners of price, some would say the only determinants. That doesn't say anything about geological supply or long term demand. If you make the mistake of thinking that the current lull in prices demonstrates peak oil is false, than you are making the same mistake as those who think that recent high prices demonstrate that peak oil is true.
First thing I wrote was that not everyone here believes we are past peak. But you chose not to address that.
Second portion of my post specifically said "If you believe...." But you seemed to have ignored that, too.
Wasn't it you that made some smart ass remark about semantics elsewhere in this thread? You seem to be quite dogmatic in your attitude for someone who suggests that "at the very least cant be proven true at the present time." That's not exactly the kind of strong statement that I'd use to go around implying people are completely off base.
Which only makes it more likely that Dec 05 will remain the all-time production high. This would be neither a geological peak nor even a logistical peak, but simply an economic peak.
Think about it : if there is oversupply of oil at $75 or even $60, during a period of strong international economic growth, then when will there ever be demand for greater levels of production? If there is a US recession that lasts several years, gradually dragging other economies down from their current levels of growth, and simultaneously energy saving is imcreasing, and energy substitution kicks in, then it seems likely enough to me that the top of the world production curve will just never happen... that the demand plateau will extend for several years, until it hits the logistico-geological downslope of world production (which will have been pushed out at least a little way).
That's my rosy, best-case scenario. If it happens at a barrel price that is low enough to handicap oil-sands and coal-to-oil, but high enough to make large-scale solar viable, then that's even cooler. Here's to $60 oil!
And alistairC, thats VERY short sighted of you, as demand could always increase next year and we surprise our Deffeys December peak, makeing the entire issue a mute point. Poor stuart, all those graphs for nothing :P
Well, it could. But the smart money is on a US recession. And demand is currently flat or decreasing with a booming world economy. So you'll have to explain your scenario.
I have no religion as to whether the Saudis' production is in geological decline. But if so, this is an extraordinarily happy coincidence for them.
Sales of SUVs and light trucks are up in September. We here at TOD live in a completely opaque bubble, completely free of the real world perceptions and values of those outside the bubble. Al Gore said that dealing with global warming was a moral imperative. Can it be that people have still not gotten the message? Or if they have the message, they don't care. Must buy new shiny, gas guzzling vehicles. Price of gas is all that matters. If gas is down this month, I guess they figure it will be down for the life of their vehicles. Except when it goes up again, they will bitch like banshees.
Main line Wall Street does not get this thing yet.
Some have speculated that the entire Lower Tertiary may offer 3 to 15 billion of recoverable oil. Of course, in addition to risking capital in hurricane prone waters, there are a few other obstacles to production:
"Several inherent technical challenges need to be addressed to ensure economic feasibility of the Lower Tertiary Wilcox trend. These range from the cost-effective drilling of complex salt canopies and evaluating deep structural targets to the completion and production of reservoirs in water depths that have not occurred to date. Understanding the oil chemistry, reservoir quality and associated flow capability will determine the drilling/ completion technology, and ultimately the creation of infrastructure needed to transform the Lower Tertiary Wilcox into a world-class petroleum system in the deepwater GoM." http://www.searchanddiscovery.net/documents/2005/meyer/index.htm
There is another appraisal well planned for the Jack site next year, presumably prior to the onset of hurricane season.
You provided the link to the 'debunking' website and then missed your opportunity to debunk the Jack2 15 billion barrel story that continues to circulate. Instead, you come out with some additional hyperbole.
Are you a paid disinformer, or do you do it just for fun?
As for CO2 for EOR, the infastructure currently isn't in place just yet, but there are plans to capture massive amounts of comercial CO2 from powerplants around the country and pump the CO2 into underground caverns. They could just as easily be dirverted and put back into old oil wells and increase our production by a significant amount in the short to mid term.
Links, please. I basically like the idea, if true. But not because of the expected additional oil, but because of our need to address global warming. I would prefer they just leave the oil in the ground and that all plans be directed to transitioning to a solar and solar related energy economy.
BP building a test plant in Scotland to pump CO2 back under the North Sea.
If not, it adds up to 40% to the price of the electric power (see IPCC range of estimates). Which is my idea of a cheap deal for saving the planet.
The difficulty is no one is going to volunteer to have a CO2 reservoir near their house. And without government stepping in and taking on the legal risk (as it does for the nuclear industry via the Price Anderson Act) CO2 sequestration will just never get off the ground.
http://www.colloqueco2.com/IFP/en/CO2site/presentations/ColloqueCO2_Session1_02_Socolow_PrincetonUni versity.pdf#search=%22socolow%20co2%20wedges%22
If most analysts are seeing slow-down, recession, downturn, etc. in the near future (2006 4Q, 2007?), then everyone's long term purchasing, budget planning changes drastically.
I can see this type of preparatory planning and "business transformation" initiatives in my company, which is heavily reliant on "nice to have" retail items.
This year, for some strange reason, our call volume is way, way down.
Any guesses why?
Actually, we have only 3 options and answer the phone usually within one minute. We are a paid support service. My customers also have my email address and cell phone number. It's a bit different than your normal "sweatshop" help line. Highly technical and worth every cent of the service fee...also, we are located at the HQ of the company and all employees use English as their first language...highly unusual.
There are rumors we will be outsourced in the next year or so.
I'm not trying to belittle the ARM's resetting, but rates are down off their highs and look to be headed lower.
Also, if you were locked in at 4% for 5 years, you can always refinance to a fixed rate loan now. Yes, your payment will go up, but if you extend the term back to 30 years, the hit might not be that bad. Fixed 30 year mortgages are available at 6.25% with no points right now.
Granted, this doesn't help the guy with a stated income loan on a property he can't afford, but that's the exception, not the rule.
The housingbubbleblog article above has some numbers that dwarf that:
30% of the people in a region throwing down 50% of their income on housing ... that seems big.
Now how do you refi this home when you're clearly upside down? We do it with cars all the time, and each time it comes at a greater cost. One day you pay it off entirely, or you trade down to a cheaper vehicle to maintain the payment. So are homes going to start doing this? If so, that's kind of bad since you will need to refi into a 30 yr fixed, but how?
Lenders will stretch lending requirements so long as Fannie Mae or Freddy Mac are buying them. How long is that going to last? Dunno, but I did come across an article saying the Fannie Mae was going to slow it's buying considerably b/c it's become a GIANT concentrated RISK that is absolutely terrifying when imaging the SCOPE of damage that the failure of either one would cause.
So odo, when you've got numbers FAR uut of whack from the NORMS, and you've got genius financial tricks to get that last 5% into homes - you know this IS NOT KOSHER!
So in a typical modern American dysfunction, taxpayers are on the hook, and holding things up.
(would I have gone to them for an uninsured CD? noooo.)
Then the question becomes can people even afford the higher payments of the fixed loan ? Especially if the home purchases was speculative.
Actually your right about people probably refinancing but it may be to yet another ARM to keep the payments low for a bit longer.
There is a pretty good chance that loan officers will informally tighten loan requirements going forward so a lot of these people with ARMS may be rejected for fixed mortgages if they are upside down on the home. I doubt many people with ARMS will qualify for a decent fixed rate loan
since if they did they would probably have done one in the first place. I just don't feel very confident that conversion to fixed rate loans will save the day.
In either case refinancing to a fixed loan or the arm adjusting a lot of American will have less disposable income. The overall decrease will be large enough to curtail
spending in both cases.
We have already started the downward spiral but a housing bubble has a nasty feed back effect on a weakening economy.
The more the economy weakens the more jobs are lost the more homes go on the market the more the housing bubble deflates.
Its a especially vicious cycle since it wipes out the assets of all homeowners not just the speculators.
Finally at some point I think the Feds will have no choice but to raise rates to keep the dollar from doing a nosedive as they try to finance the federal deficit regardless of the internal state of the US economy. Having the global currency
bites both ways. This is the real ticking time bomb not the
housing bubble.
In my opinion, we're going to 0% interest rates ala Japan.
The babyboomers are getting ready to retire. As you get older you are less and less inclined to take risk. I think the inverted yield curve shows this perfectly.
Besides, the govt can't afford higher rates. 5.25% already has things slowing down. If we have a bad 4th quarter, mark my words, Bernanke will be slashing the FF rate.
Just my take.
I'm totally on board with those thoughts. Rates are coming down next yr which will set up a perfect situation for me since I will be finishing my degree and "hope" to get into a home next year. Falling prices and rates would be a BOOST to helping me, I know.
I don't see 0% rates, but in real terms it will be 0% or negative like in 2002. It will probably once again drop below inflation making an effective strategy for hedge funds to manage capital.
Although I guess you are talking about falling prices and falling rates. In general there is more of a negative correlation, but in the short term I suppose we could see a divergence if there is a recession and the housing bubble pops. But lower rates will do a lot to help stem the declines in housing prices. In all honesty, housing is overheated, but if rates stay low it may be that these levels are not entirely unsustainable.
On a side note, I'm not sure the comparison to Japan in the article above is all that apt. There are quite a few differences between the two situations.
Except that the dollar is the international currency.
And we have massive federal debt. We cannot afford a currency crash its far worse then allowing the housing market to crash.
How can we go too 0% and still finance the federal deficit ?
When push comes to shove the rates will rise to protect the dollar housing market be dammed.
Then what will keep foreign investors buying up US debt ?
They will leave in droves if interest rates drop to low.
What will this do to the US economy ?
I just don't see us in the position to play the zero or even low intrest rates for long. If we do this money will start pouring out of the US.
It looks like we might soon be in a situation of 'damned if we do, damned if we don't'.
Absolutely not true! For most of 1996 the dollar index traded around 86, exactly where it is today. Then in 1997 it begin to rise, hitting a high of around 120 in 2001 and 2002. Then it began to fall almost hitting 85 in December of 2003. In 2004 it traded in the low 80s. Now the spot price closed at 85.84, right where it was exactly one decade ago.
Ron Patterson
The Eruo since 1999
The Dollar index since August 1997
To get the data for 1996, one decade back when it was just about where it is right now, you must click on "historical" then punch in the appropraite numbers. My point was, and is, that the dollar is almost exactly where it was ten years ago against a basket of all major currencies in circulation at that time. And I am sure that would have been the case against the Euro, had it been in circulation at that time.
The other index currencies are simply too small, apart from perhaps the pound, but that is just as blown up and out of proportion as the dollar.
The Euro before 2002 is not a standard, and so, counting the past 5 years minus 3 months, 32% is a big loss. Still, if people like the idea that the dollar has held its ground, be my guest. But don't forget that oil, in relative terms, is 32% less expensive for the EU than it was 5 years ago. That adds up. And that goes for all dollar-denominated assets.
The US may think they print those for free anyway, but there lies its weakness: hot air is a volatile substance.
I'm not saying the EU is such an ideal economy, but they are certainly doing better than the US. This remains a bit hidden still because in the past 5 years, unlike the US, they have spent trillions on incorporating new members and greenhouse emissions measures. They are spending a lot of money on building a solid foundation, something of value. I don't see the US do that at all. Too busy building an army.
That's a joke, right?
Then I guess you must have a theory for why other countries are investing in dollar assets. What is it?
Join us in hell, Jack. It's fun. Until then you will be the only humans who trust you. We Love you.
Don't be late. It's a pain to keep the white-whine chilled.
The value of the dollar lags behind the rise and fall of US interest rates. Although it's beginning to diverge now, because other factors that are beginning to affect currency markets. Such as the huge and unsustainable trade, federal deficits, and the record levels of consumer debt.
The indexes are the same way. The dow just posted a record but it's not really a record once you factor in inflation (which we know is under reported), we would need to be at 14000 TODAY to be EVEN with the record we hit in 2000.
Again, the dollar has lost it's value since 1913 and this trend will continue.
You also need to factor in dividends and changes in the composition of the index.
It is far from widely accepted, outside of Financial Sense and the goldbug community, that inflation is under reported. Plenty of people say the CPI overstates inflation because it doesn't account for the consumer's ability to shift the basket of goods or for quality improvements.
Like I said, I know I'm preaching to the choir.
This statement needs some explaining, and some support. How did Warren Buffett bet against the dollar? Warren Buffett, Chairman of Berkshire Hathaway Inc. invest entirely in equities. He doesn't operate, nor has he ever operated a hedge fund or played the futures market. He is one of the most conservative investors ever, and has made his fortune by simply choosing the best companies for his holding company, Berkshire Hathaway.
To be blunt, I simply don't believe he has ever made a dollar betting against the dollar.
Ron Patterson
That is not to say the dollar won't decline in the future as I personally expect it will. Just wanted to set the record straight regarding Buffet.
Buffett has been quite vocal the last 2 years that a significant proportion of Berkshire Hathaway's $50bn of cash is held on deposit in non USD. He doesn't disclose in what form.
He says that the 'triple deficit' (government deficit, trade deficit, current account deficit) ensures that the dollar will, in time, fall dramatically. It is the first time in his investing career he has ever bet against the dollar and held a significant fraction of his assets in non USD currencies
He also has been quite open that this has been a bad year for his bet, and from memory in 2005 he took about a $1bn hit on it.
But they need money the only way they can get it is from forigen investors. The only way to do that is at the end of the day to keep intrest rates high and inflation in check.
If they let inflation take off then we loose all our overseas investments the dollar slides off a cliff and were dead.
If you do that you wipe out quite a few in the housing market.
At the end of the day the US simply does not have the money to bail out the housing market unless they crank up inflation and Business start raising salaries dramatically.
One part of the problem is that business profits have soared but salaries have stagnated if they had only raised salaries to cover the increased cost of housing then we would be in better shape I think maybe :)
Or if the Feds had not run up a huge deficit.
Finally I think they will let housing collapse simply because their is not much they can do about it to many people are way over their heads now even dropping the intrest close zero will still leave a lot of people with loans they cannot cover. And with the inventory pile up it does not help builders since they already have homes they can't sell. I just don't see any way to keep the housing bubble from unwinding for a long time.
For example I live in Irvine CA.
The median income for families is 98,000
http://en.wikipedia.org/wiki/Irvine,_California
The houses sell for about 700-800k
This is way way off base even for such a wealthy area.
Just to sell houses here they need to come down 200-300K.
At 700-800K you need a salary around 200K or more to even think about buying a home.
I did not find the exact answer but.
http://answers.yahoo.com/question/index?qid=20060902221749AANRkjH
This suggests the top 5% of Americans make over 184K so lets
just say 5% make 200K. That's 15 million people.
Sure orange county is wealthy but our population is 3 million so at best there is maybe 200,000 or so people making over 200K in the whole county assuming that its a bit
more then 5% here. Of that maybe 5% are moving any given year and that's probably high which gives at best 10,000 people that can afford homes in Orange County.
Reading here
http://bubbletracking.blogspot.com/2006/09/tracking-orange-county.html
There are close to 17 thousand homes for sale in Orange County. Almost twice what a generous estimate would guess the available market is at the current prices.
And finally the demographics over 200K are quite slanted.
We actually have a large number of multi-millionaires in the region that purchase the 1 mill plus homes. They are not in the market for the crappy overpriced 800K homes. So the market size is probably less then 10 thousand people.
My point is this is not a stable market by any stretch of the imagination regardless of interest rates. Normal homes in orange county need to go back into the range of 300-500K to match market demographics. From my calculations we actually have close to 2 years supply of homes in the area for people that can afford them.
So if you discount the ARMs and other crap loan stuff the real housing market i.e. homes vs people that can afford them is in probably the worst shape in history. Either salaries have to almost double or housing in the area has to drop almost 50% to bring the market back close too reality.
I dont disagree with anything you say. It's been pointed out that damned if we do, damned if we don't. I think that is the BEST way to explain this situation. We have run into a choice of the lessor of two evils. I believe that would be lowering rates next year. Lets see in Mar, what they actually do because I agree with your points, however I feel like the FED will attempt at keeping the consuming public in business.
At lot of ARMS loans were also interest only or had reversed amortization where the principle increases every month. A significant number of borrowers will not be able to afford a fixed mortgage, even if the rate is low.
I believe that mortgage rates will rise substantially within the next tweleve months, do to falling home prices and increased foreclosures. Those that have money to loan will demand a higher premium do to the increase risks of loaning money for mortgage back securities. Banks and other lenders will also be less interested in offering new loans or refinancing existing loans because of the new regulations imposed on them, the risks associated with declining home valuations, and the rising expitation of a recession. "Banks desire to lend you money when you least need it and refuse to lend it to you when you need it the most".
>Granted, this doesn't help the guy with a stated income loan on a property he can't afford, but that's the exception, not the rule.
This all depends on how much the economy is tied to the real estate boom:
- Many families used home equity as an ATM to finance their lifestyles. Now that this source of income is drying up (do to loss of home equity and plateu/declining home prices), they will likely cut back on consumption. Less consumption equals less production and more layoffs.
- A sigficiant portion of the US economy was directly or indirectly tied to new home construction and remodeling. Now that construction is declining, unemployement will rise as these jobs disappear. Those that had jobs in the industry may be laid off and be forced to sell thier homes on a already depreciating real estate market.
- Consumers spending is connected to the wealth effect. As home prices continued to rise, home owners felt they had more money to spend and did so. Now that prices are either falling or leveling off, this effect is rapidly disappearing and may be compelled to start saving money again. This in turn will reduce consumption and raise unemployment.
- As home prices decline, many home owners with substantial mortgage debt may feel the sudden need to sell their home, and sell it quickly. This form of motivated selling can quickly snowball into a avalance of deflation as sellers desperately lower prices in order sell before prices drop even further (aka the nasdaq crash of 2000).
Keep in mind that housing cycles run in periods of decades. The run up on real estate began in 1995. Without considering the near future problems (Peak Oil, US trade and fiscal debts, Medicare and Social Society revenue gaps) we won't see a rebound for probably other ten years. By then other issues will dominate the economy and prevent a rebound from developing.Eight Market Spins About Housing by Perma-Bull Spin-Doctors...And the Reality of the Coming Ugliest Housing Bust Ever....
http://www.rgemonitor.com/blog/roubini/143257
If nothing else, read reason # 7.
Here is part of it.
>>>>>>>>>>>
Spin #7: Banks and mortgage lender are still very sound and there is no risk of systemic banking crisis.
The other spin that one hears over and over again is that, unlike the 1980s when we had a systemic banking crisis (the famous Savings & Loans (S&L) crisis) today banks and mortgage finance institutions are very sound and with low delinquency rates: default rates on mortgages are still low if rising.
The reality is quite different and much uglier: the housing bubble of the last few years may have planted the seeds of another nasty systemic banking crisis that could be more severe and costly than the S&L crisis of the late 1980s. First, notice that the housing boom of the last few years has led to a credit boom that is quite unprecedented for the US in recent history. Credit boom and excessive overlending episodes - based on cross country experience - often lead to credit busts that cause both banking and financial crises as well as economic recessions.
Second, not only we have had in the last few years a massive credit boom associated with the debt financing of the housing bubble; this lending boom has also been associated with an extreme loosening of credit standards that allowed the boom to continue and feed an ever more unsustainable housing bubble. Indeed, many mortgage lenders have gambled for redemption during the bubble years and engaged in extremely risky and reckless lending practices that may eventually lead to financial distress, or even their outright bankruptcy; we may be soon facing the same mess and systemic banking crisis that we had in the 1980s with the S&L crisis. The lending practices of mortgage lenders became increasingly reckless in the last few years: indeed, in 2005 a good third of all new mortgages and home equity loans became interest rate only; over 40% of all first-time home buyer were putting no money down; at least 15% of buyers had negative equity; and an increasing fraction of mortgage came with negative amortization (i.e. debt service payments were not covering interest charges, so the shortfall was added to principal in a Ponzi game of accumulating debt). Finally, at least 10% of all home owners with mortgages currently have zero equity.
This reckless lending scam was fed by ever loosening lending standards, the massive growth of sub-prime lending and over-inflated valuations of homes to justify new mortgages and refinancings (when significant equity extraction was occurring). It was a vast and growing lending scam where lenders' behavior was distorted by serious moral hazard incentives driven by poorly priced deposit insurance, lax supervision of lending practices by regulatory and supervisory authorities, slipping capital adequacy ratios, too-big-to-fail distortions and the distortions created by the financing activities of the too-big-to-fail government sponsored enterprises (Fannie Mae and Freddie Mac). Indeed, you can expect the WSJ op-ed page soon to blame the entire coming housing and banking crisis on the activities of these GSE's (on top of blaming on the Greenspan and Bernanke put).
>>>>>>>>>
John
There is some truth to this statement. Banks and Mortgage lenders have distance themselves from mortgage debt by selling off that debt on the bond market. Its the bond holders that are risk when housing goes off the deep end. That said there are three major issues that lenders face.
- Litigation from bond holders and home owners. Bond holders will argue that the banks did improper paper work to approprate gauge the credit worthyness of borrowers. Home owners will argue that the banks misrepresented the terms and knowly sold them a loan that they could not afford.
- GSEs and other lenders that have inaccurate forcast future mortgage bond rates for long term mortgages. The majority of long term mortgages are financed using short term bonds (2 to 10 year bonds). When the bond term ends they need to reissue a new bond. If the rates on these bonds exceed the yield on the mortgage, they lose money. The odds that during the life of a 30-year mortgage, that interest rates will remain below 5% seems like a huge gamble.
- A lot of lenders have hedge themselves against potential losses using default derivatives for insurance. The issue is that if a significant number mortgages goes bust, its like that the capital reserves will be insufficient. I suspect that the majority of insurers will fight in court on the grounds of improper borrower documentation to avoid payouts.
In the end, the housing bubble may just enrich a lot of lawyers, everyone else stands to lose.Many people have missed the most important point you beat on. Bondholders are ones holding this bag, but again NOT REALLY. Fannie and Freddie have never defaulted on bond payments, ever. They also have never had the scope of liability they currently have (estimated @1.2T in MBS backed bonds).
Bond holders received their payments indirectly from home owners. Home owners pay their mortage and the bonds get paid. Fannie and Freddie mismatch long term needs with short term answers, a clear violation of accounting rules.
If large sections of the public begin defaulting, Fannie and Freddie will need more short term cash to meet these bonds payments. Where does it come from? More bonds? more bonds to service old bonds that are losers? Higher premiums would be demanded for sure, or if TOO MANY defualt TOO FAST, then Wall Street might balk at taking it on and we now have the first ever Fannie Default on bond payments. Now THAT would sent SHOCKWAVES through the economy.
Now whose holding this bag really? Oh yeah all of us, who already sit atop $8.5T in debt or really somewhere near $40Trillion (using accrual accounting, mandated by US LAW for any corp with sales over $1M).
Distillate supplies - UP
Crude Oil - WAY WAY UP +3.3M
How many more weeks are we going to go up? I thought all those pretty charts and spreadsheets and stories about oil fields in decline would have had the opposite effect by now?
The opposite has happened. Flat to falling production has forced oil prices up to equalize suppply and demand.
Yergin's argument is the basically the same argument that the Economist Magazine made in 1999, when they suggested that oil prices were probably on their way down to a semi-permanent price level of $5 per barrel. Oil price are trading in a range about 1,100% to 1,500% higher than the Economist Magazine's long term prediction.
A talking head on CNBC echoed your sentiments. She said that it was "amazing" that crude oil inventories were up when they were supposed to be down. The "WAY WAY UP!" build in US inventories is equivalent to what the world consumes from nuclear + fossil fuel sources in about 22 minutes.
I understand it now. The highest nominal oil prices in history were a result of an oversupply of oil on the market.
Geology puts a cap on the amount of oil produced. But it is not the only factor that limits production. Buyers of oil also limit the production. What is not bought cannot be sold.
If you look at history, there are many times where oil production dropped because of economic slowdowns. The production dropped because ecopmomies weren't consuming. It would be misleading to link those drops to geological decline.
Put on your tin hats folks!
Many expected this. Holding oil at $25 was supposed to be to maintain market share. To prevent recession, conservation, alternate energy, etc.
But now OPEC knows we'll pay $60, and it won't cause a recession or other loss of market share. So why shouldn't they try to maintain the higher price? Wouldn't you, if it was your oil?
I'd say this remains debatable. If we are heading into a recession now, one would be able to argue that the present global economy can't handle that price oil, but this still remains to be seen.
Just to add to this:
A weaker dollar will also mean more oppurtunities for local production. A 20-30% collaps would make US produced goods very competitive again.
Absolutely. OPEC is somewhat reassured about $60 oil not causing recession, and some in OPEC (e.g., Kuwait) are starting to feel that they should ration their limited supplies, but informed folks in OPEC (esp Saudi Arabia) are perfectly aware of the potential for alternatives.
They've simply decided that they need the oil revenue to placate their citizens, and that they'll gamble that alternatives won't come quickly enough relative to supply/demand to matter too much.
This is also a partial argument against the export/internal consumption model, because at some point the revenue will be worth more the country than the internal gasoline subsidies, internal prices will rise and internal consumption growth will moderate. This will vary from country to country (for instance, the US has much lower prices than the EU because it still has has only partially transitioned psychologically to an importer perspective), but it will happen to some extent.
It's a short term mentality.
Most OPEC countries, notably Saudi Arabia, have fast expanding and young populations with rising expectations and big social bills.
To keep those people in healthcare, education and employed, the governments need to spend money, lots of it, on that and infrastructure.
The best way to do that is to keep the oil price up, but not so far up it kills demand.
Nigeria, Venezuela, Iran, Saudi Arabia all have very young populations and high birth rates. Their governments are struggling to keep up. The GDP per head in Saudi Arabia is 1/3rd of what it was in 1975, mostly because the population has tripled-- Saudi Arabia has about the highest population growth rate in the world (other countries in Africa have more babies, but Saudi has a low infant mortality rate).
This pattern is exactly what systems dynamics would predict for a limited oil supply.
Consumers exceed production. Prices spike. Some consumers cannot compete and are destroyed (factories close. airlines declare bankruptcy). Then production exceeds consumption. Inventories build and prices drop down. This "cheap oil" encourages attempts at growth among the surviving consumers. But production is still limited and once the consumers use up the oil in storage, prices spike again, causing another round of demand destruction.
Systems dynamics calls this "pulsing" and WestTexas calls it rounds of bidding, but it is expected behavior. It is totally consistant with peak oil. And it is expected to get much worse as we push over into the decline side of the Hubbert curve. Higher highs and lower lows. This is why India and China are building SPRs.
A good text on systems dynamics "Modeling for all Scales: An introduction to Systems Simulation" by H.T. Odum. Good in this context, because his examples all come from energy and ecology subject matter.
SD is such a powerful tool for analysing energy and also global warming type problems.
Policy makers, and the general public, use 'rules of thumb' (aka heuristics) which do not properly incorporate time lags and feedback effects. So they do not foresee the oscillation of markets.
The price oscillations of oil in the last 25 years are entirely consistent with a model of overshoot, followed by a pullback in consumption, then a return to normalcy, then a collapse in oil prices, once again leading to a supply crisis. The semiconductor industry behaves in exactly the same way, but with a 3-4 year cycle rather than a 25 year one.
The core bathtub metaphor is so powerful. There is a stock, we draw it down by consumption (the planet gets rid of atmospheric CO2 in the GW example) and we replenish it (not at all in the case of oil, and by emitting activities in the case of GW).
It also helps one understand 'overshoot' and 'collapse', 2 phenomena conventional economics isn't very good at (Exchange Rate modelling struggles with this all the time).
Link in Mandelbrot -- outsize events are far, far more common than normal (gaussian) distributions would predict. The stock market crash of 1987 should happen every 17 million years or so.
Another good book on SD: Business Dynamics: Systems Thinking and Modeling for a Complex World by John Sterman (the US textbook is ridiculously expensive, but the Amazon UK site may have cheaper editions). His website at MIT is a goldmine of interesting papers.
Another one: "A Prosperous Way Down: Principles and Policies" again by H.T. Odum. He combines system dynamics with an accounting system based around energy instead of money. There are some surprising results, especially related to oil imports and the world bank.
It is also a little philosophical. He treats societies going down as just as natural as going up. It just takes different planning. He proposes a set of policies for "the peak" and then for the decline.
This phenomena will happen anytime that demand exceeds supply and the "bouncing" will continue while demand growth exceeds supply growth. What that means is that it can happen before peak and after peak. It DOES mean that we are supply constrained, but it DOES NOT mean we have to have a dropping supply.
And in particular, the point I was making was that the slope down of the "bounce" has nothing to do with oil field decline. It's an economic response, not a geologic one.
Note: my apologies to economists for (likely) using the incorrect specific terms.
Historically the experience has always been the latter. Prices have to go up a lot to reduce demand, and they have to go up a lot to induce new supply. Both demand and supply are said to be short term price inelastic.
What economic theory says is that with an exhaustible commodity, you get a rising price as the commodity is used up.
As the price rises, the quantity demanded falls, and new sources of supply (higher cost alternatives) come in.
Google 'Hotelling Model of an exhaustible resource' for a picture of it (a smooth price curve, with price on the Y axis, time on the X axis, rising smoothly towards infinity as t elapses). Uncertainty about the size of total reserves and the arrival of new technologies plays havoc with this nice price path.
In practice though, and this is where SDM kicks in, you get price oscillations. Demand and supply are not perfectly in synch, and the price moves by often large quantums to get them in synch.
Texas produciton rose from about 2.5 mbpd in 1962 to 3.5 mbpd in 1972, when (nominal) oil prices were in the $3 to $4 range. In the next 10 years, oil prices were up as much 1,000%, but production fell by about 30%, despite the biggest drilling boom in state history.
Absent Weimer Republic type inflation, we will not see $1,000 oil, but based on historical models once the world peak hits, the only damper on oil prices will be demand destruction--the supply of alternative energy and non-conventional sources of oil.
Since late 2005, when Deffeyes predicted that we had produced 50% of conventional crude + condensate reserves, oil prices have traded in historically high (nominal) price range, while (EIA) crude + condensate production has been down (relative to December) every single month since December.
There could be a lot more oil out there that we haven't explored for properly.
For a lot of reasons (see Deffyes) I suspect there is not, but that we squeeze a lot more oil out of existing reservoirs (at a higher cost).
It's an industry that had declining prices for most of 20 years. There are big lags in creating new supply.
My own sense is PO is a 2025 phenomenon, not a 2006 one. However it might mean that, like with our North Sea fields, the drop off is even more impressive (because we sustained production at such a high rate for so long).
Yes, sorry, I was trying to make this exact point myself. Some are claiming the HL method has failed because of this "bounce", but that is not true. Pulsing and peak oil can both happen.
Which is why you don't find price anywhere in the HL technique. And there are many other trends suggesting that we are at or past peak:
Very low discovery rates.
Few places left to explore.
Falling oil EROI rates.
Heavier and higher sulfer oil.
I also agree that pulsing will happen post-peak. I'm just pointing out that it can also happen pre-peak. That, along with your list of other trends, IMHO are compelling evidence that we are approaching peak. But there is nothing, yet, that convinces me we are post-peak.
All in all, I think we are in violent agreement. : )
Lets not forget that the hedge funds were also betting on major hurricane damage this year, and a blow up in the middle east, and dramatic decline in oil production from gawhar, none of which materialized. So the prices go down to a more reasonable rate.
But FYI, Oil has actually been much higher adjusted for inflation in the past. Just because todays price is the highest in terms of dollars doesnt mean you can ignore the fact that as a % of household income, its near a historic low. Our purchasing power has increased drastically since the last oil shock, and our efficiencies have reduced the amount of oil we need for the same job. People who keep quoting 'highest nominal prices' and the such are trying to compare apples to oranges.
Maybe someone can tell us for how many days the price exceeded $100(in June 2006 dollars). It is interesting to note how quickly the price climbed to the $100 peak and then to note the relentless decline until the price bottomed out in 1986.
Indeed it is interesting to observe the relatively slow climb to the current price in comparison to the speed at which the price peaked the 3 previous times.
I believe the economic repercussions of the three previous price run ups were greater than the current one because of the relative ability of the global economy to recirculate petro-dollars; i.e. more time and better mechanisms. For the global economy, irrespective of local or regional impacts (x or y country in the South, x or y industry), a rise in oil price does present re-circulation challenges and this 'friction' does have a cost, but overall the impact is small if trading and investment systems function smoothly (I buy your oil, you buy my weapons and my porn and invest in my real estate).
With respect to the ongoing discussion regarding the import of the price of oil, I contend that it is rather the cost of energy, or more accurately the decline in the spread between low entropy resources and high entropy waste, which is the stage on which the troubles facing the industrial economy are being played out. The entropy of the resource base, particularly of the all important hydrocarbon resource, is climbing. This is highlighted by the increasing proportion of our energy which comes from tar pits and suchlike. At the same time we have ever more capacity to convert resources into waste. Unhappily, the dominant economic paradigm measures efficiency as the maximal use of this capacity.
It is time to move on.
Yeah, that's what we saw in Texas and the Lower 48.
The Texas oil industry responded to a 1,000% increase in oil prices from 1972 to 1980 with the biggest drilling boom in state history, and we increased the number of producing wells by 14% from 1972 to 1982, which resulted in about a 30% drop in oil production.
Mathematically, Saudi Arabia and the world are now where Texas and the Lower 48 were at in the early Seventies, and Saudi and world crude + condensate production are both down, while we saw the highest (nominal) oil prices in world history. But that's all just a coincidence. Producers were cutting back because they couldn't find buyers for their oil.
According to Simmons et al, Saudi Arabia and the world are now where Texas and the Lower 48 were in the early seventies...
Symantics are fun :P
You should ask yourself why you are posting at TOD. Most of us are here to develop the most accurate prediction for peak oil that is possible and to understand the ramifications for our society. If your goal is to sow dissent then you should go elsewhere.
On the off chance that the truth does matter to you, here is a quick history.
Science is about finding mathematical relationships so that we can use the properties we can measure to predict the properties we cannot measure. In this case, we are using production flow to predict reservoir volume. Is there a relationship between flow and volume? Of course! It has been well studied for liquids, gases, and even electrons. (try it yourself by pouring out a 20 ounce coke bottle at the same time as a 2 litre bottle. (the necks should be the same size)).
Hubbert was clever enough to figure out how to use a statistical model to map this flow to volume relationship across thousands of reservoirs distributed through time. And his method works really, really well. Well enough that he made a peak oil prediction within 10% from 40 years ago.
On this site, Staniford, Brown, and Khebab have extended his work. They have fit many different countries, alternate statistical models, and done stability analysis. The method continues to hold up. It holds up through 100 years of production, two world wars, depressions and boom times.
I recommend you start your reading with K. Deffeyes's books "Hubberts Peak" and "Beyond Oil". They are short, clear, and inexpensive. Then follow Staniford's link on the side and read the posts and discussions he links. Consider taking a freshman course in physics or chemistry.
If your goal is to spout nonsense, then please leave.
No,what I meant to say is what I said. Based on mathematical modelling (the Hubbert Linearization or HL method), Saudi Arabia and world have arrived at about the same stage of depletion that Texas and the Lower 48 were at in the early Seventies, when they both peaked.
Actually, the last time I talked to Matt Simmons about the HL method (in late 2005), he was not a big fan of the technique because of concerns about data quality. I recently discussed the technique at length with Matt's head of research. My point was that any errors in the data tend to average out with time.
In any case, before making assumptions, it's probably a good idea to do your homework. There are a number of articles on the topic that you can read by going to www.energybulletin.net and searching authors under Jeffrey Brown.
Khebab used the HL method to predict post-1970 Lower 48 cumulative production, using only production data through 1970. The post-1970 actual cumulative Lower 48 production was 99% of what the HL method predicted it would be.
The short answer is you can't.
However, you can sell a lot of books based on your hypotheses. And last I checked the book manufacturers don't give refunds if the book turns out to be wrong a few years down the road.
Of course, eventually someone is bound to get lucky and get it right.
As best that I can tell, there are closer to about 500,000 oil wells currently producing in the US and something on the order of about 1,500 wells producing in KSA.
As I have pointed out elsewhere, the Lower 48 and the North Sea are vastly different producing regions, yet they both peaked in close proximity to 50% of Qt (URR), and both regions have followed the predicted downward production trend.
KSA has been heavily explored. Are there new fields to be found? Absolutely. Will they be able to replace the declning production in the large old fields? Almost certainly not.
The HL method gives us a way to objectively model the production for a given region, regardless of the field size distribution, provided that we have decades of serious levels of oil production.
The bottom line is that the HL method predicted an imminent production decline for KSA, and--as predicted--we are seeing a production decline.
One might say that recession would be good for the wilderness -- human beings may stop producing so much plastic and trash and highways and cars (and maybe people) for a while.
But there is the spectre of mass starvation, irrational violence, and in the modern age, an excuse to resort to nuclear solutions as a result of blaming someone else for the crash.
What do your tea leaves say about real-world possibilities for the short term future? We know what Kurt Vonnegut http://www.inthesetimes.com/site/main/article/cold_turkey/
thinks -- he has tried hard to be optimistic http://www.vonnegut.com/confetti.asp
In the end, we can't eat oil or gold. We have to use such things as tools or levers to get each other and the natural world to cooperate to satisfy mutual desires so that our species will survive. Otherwise, as Vonnegut says again (quoting Wendell Berry) "what are people for?"
Sorry -- I know this site is only for hard data, not callow philosophical speculation. But Dave Cohen brought up Vonnegut in his <rant>
None of us gets paid for what we do on TOD. Some of us work, some don't. Trying to save civilization doesn't pay well. On the other hand, running it into the ground can be quite lucrative.
I myself could use paying work. Anyone reading who can help out should consider this analysis as part of my resume. I have been published in some magazines, as well. Writing for living is a hard way to go.
My e-mail is available if you click on my name in the right side-bar.
Dave
Bingo Dave - great post!
"intellectual class" of information.
Therefore, I have taken on the unpaid job of sorting out the problems in my locale and offering examples of what needs to be done. This has done a lot to boost my morale.
The latest gig is a month of eating locally grown and processed food.
http://www.relocalize.net/blog/42
It is sort of the opposite of Supersize Me. My wife and I weighed in this morning and will check on that as we go along. So far we are eating very well.
If anyone in Mendocino County is reading this and can offer local food sources, please do!
This is how I stay in touch with the big picture. I spent a few years on various yahoogroups before TOD. My heartfelt appreciations to Dave and the others who stick around and perform these analyses.
My point is that one can get addicted forever to more and more information...I know how it can become engrossing. Personally, at some point it started to sap my energy so I had to step back for a while and think about what to DO with the information.
I am nervous about the future. I want to see more getting done. But I also know that most folks don't have the good information or mindset in which to act appropriately. So this site is very important.
Keep it up!
http://www.usatoday.com/money/economy/housing/2006-10-04-builder-sell-usat_x.htm
I think the focus of this recession will be housing so these articles all focus on different angles of housing. I love the Toll brother banking nine figures - Nice.
http://www.chicagotribune.com/business/chi-0610030200oct03,1,4594096.story?coll=chi-business-hed
I think commercial building/renovating or any other type of Property related projects may increase as companies across the board are flush with the most ever cash on balance sheets, ever! This money has to find a use for companies and much will be pissed away. I think there will be plenty of spending on P&E in the next year or so, but it won't help offset the huge size of residential construction.
http://www.ocregister.com/ocregister/money/abox/article_1296117.php
The best part of this is understanding the larger trend. Everyone knows buying a home is the best investment, but much of that was tied into the fact that 10 years from now, you should be making more money and that 30 yr fixed mortgage gets increasing smaller as a % of your total income. When you get into an ARM loan you, in effect, turn into a renter into your own home until you hit a predetermined cap which can be quite high. With home owners increasing falling behind, rents are going up as more people are being forced to find anywhere to live and spaces are filling up quick.
http://www.ft.com/cms/s/548e2aa2-5302-11db-99c5-0000779e2340.html
While this is Europe, I hardly doubt that this is only happening there. I googled US companies are some key phrases with little returned, well too much too sort really. Across the board, debt is just being poured into companies. DANGER, DANGER!
Oddly for once I think we are more advanced than the US. A lot of equity money has gone into buyout deals here, and that has brought the bank debt in behind it. Here in the UK every private equity company wants to own its very own chain of shops.
The US the danger is around the overborrowed consumer.
The UK is in a similar position, and so potentially is Spain. Other countries that have had extraordinary housing booms that may come to a sticky end include the Netherlands. Germany housing prices have been falling, and France has been strong, but only in patches.
Most of the rest of Europe the danger is in the corporate sector and all these debt laden deals. Because Europe doesn't in general have a Chapter 11, the workout from these deals can be very lengthy and very painful.
In 2000 the debt deals were all in the telecoms sector. This time they are much more widely spread.
I hope a social change is in order here.
What's up with the bankruptcy laws structured in the way that they are? I know little about bankruptcy in Europe so some insight would be wonderful.
In some European countries, you basically have to ask the Trade Union's permission to make someone redundant.
Conversely in the UK the law is entirely about protecting creditors, so the onus is on the Company to appoint the Receiver quite quickly.
European companies are making good profits despite generally weak economices, which are why LBO firms are going after them: take them over, ratchet up the debt, cut costs. You can do that as long as there are good profits and cash flow.
Europe is in many ways where the US was in the early 1980s-- there is massive cost and competitiveness issues throughout the economy, and a need to exit a lot of activities which are no longer internationally competitive. VW for example is struggling with this-- it has 100k workers in Germany, and it can build a car in Slovakia with workers on 1/4 the wages and the same productivity. But VW is owned by the state government-- how does it do this?
Selling to an LBO fund is one way.
The problem will come if there is an economic downturn and that cashflow to support all this debt isn't there. Also, (see above), it's not trivial to cut costs in Europe. For example, most UK property leases are for 25 years, and there are pension fund liabilities. On the Continent, laying people off is often quite difficult (if you are a Brit, working for a multinational company with a large operation in Italy, watch out: it's basically impossible to lay someone off in Italy, so they typically clean out the British office and shift the work to Italy).
For instance, I often deride the auto unions because of excessive demands like getting paid to not work(ala job banks). You can't rationally make the argument that you should get paid to not work. There will be little cash left to continue operations in any competitive environment. Now the auto makers are swallowing some tough medicine. The auto unions are next. It's starting with generous buyouts which will be the last. The remaining few will be pressured to work more and cost less no matter if they are in Detroit or not.
However somewhere in all of that, there was a balance that allowed the people to earn more each year and the company to do the same. Both parties were symbiotic in nature, stemming back to Henry Fords first desire to sell cars to his factory workers. Unions became powerful forces that demanded and got much of what they wanted. Now the rest of the world finally wants a piece too.
That seems pretty clear.
However how big the effect is is subject to debate.
Germany trade unions are normally much more flexible and cooperative in their approach than the UAW. Because European companies know that they will be unionised, and have to deal with the unions, they take a cooperative approach to dealing with them. Conversely the unions understand that productivity is the key to keeping their jobs.
Also in the UK a company may deal with many unions, each of which can shut production. On the Continent, mostly, each plant and/or each industry will have one union.
I think it was Opel (GM) that the German union voted to work longer hours to keep the plant open.
Another big factor is European companies don't pay for worker's healthcare. That is a big cost Ford, GM, Daimler Chrysler are trying to shed. For the same reason, plus the high educational standards, Toyota chose Ontario for its new plant over Alabama.
Yes they damn do. Nuance : EVERY european company pays for worker's healthcare (compulsory health insurance, funded by both employee and employer). I would be surprised if the average US car worker was getting significantly better health care than their VW or Peugeot counterpart (though I wouldn't be surprised if it cost the company more.)
Most other companies in the US don't face those health-care costs. This contributes to making US carmakers less profitable than other US companies, perhaps, but it isn't a competitivity issue between US and Euro carmakers.
However in the UK, Sweden (I believe), Canada, at least, healthcare is funded by general government revenues.
Certainly retiree healthcare, which is a big burden to GM and Ford, is a responsibility of the state, throughout Europe?
I am not sure of the position in Germany and France re company v. public health insurance. It is certainly the case that their health care costs as a % of GDP are much lower than in the US, therefore even on the same insurance basis, they would have lower healthcare costs per worker.
Most salaried people (I'm talking France here) also have company-run top-up regimes for health (they pay the approx 30% of health expenses which are not covered by the public system).
As to whether this gives a competitive advantage to UK and (hypothetically) Swedish companies/car makers, that depends. They perhaps don't have to make specific payments for the health and retirement of their employees, but one way or another they are working in an economy where health and retirement are funded. If that's done indirectly (through company tax, sales tax, income tax...) then it may give them an advantage in the marginal cost of employing people, but in the end, they are still paying for it.
By contrast, US companies have (arguably) the advantage of not having to shoulder their share of the economic burden of universal health care and retirement. Non-performing elements can be more or less left by the wayside...
Personally I prefer the option of funding health and retirement from general government revenue. It's a wash in macro-economic terms, and it lowers the marginal cost of employment.
Here in the UK we have online gambling companies. The US Senate just practically shut them down by making it illegal for banks to transfer customer's money to them-- stocks are down 70%. A bigger debacle here than the dot com boom.
Guess what? The execs and insiders have been selling for months.
Contraction in mortgage companies has freed 1 million square feet of office space in the county.
A few more leading indicators of recession:
Falling commodities (check).
Falling equities (we haven't seen that yet).
Money flowing into safe-haven treasuries (check).
I would argue with your conclusion, though. While falling commodities have historically been one of the most reliable indicators of a coming recession, they tend to do surprisingly well once the recession is actually underway. By that point, everyone is anticipating the end of the recession. So, while I think the recent 25% plunge we've seen in oil prices is a great indication that a recession could very well be around the corner, I expect oil to move significantly higher sometime next year, recession and all. It might take several months to form a bottom here, somewhere in the 50's, but I think these oil prices will look like bargains by mid-2007. Personally, i'm licking my chops to start buying some gold shortly. HUI is at 275, baby!
A big part of the fall in oil obviously had to do with the, "shaking out" of late-comers and amateurs. Personally, I wouldn't call it a bubble. I think we're in a long-term commodities bull market which will continue to run its course over the next decade. Typical behavior of bull markets is to have periodic short-term pullbacks followed by a resumption of the upward trend. During commodities and equities bull markets, things tend to temporarily get ahead of themselves (this is when the amateurs pile in) then there is a pullback (this is when the professionals get back in). The only argument that can be made that we won't see a new higher-high for oil prices in 2007 is that the commodities bull market is now over. I don't believe that.
Sincerely,
Amahd (god, I hope I put the 'h' in the right place this time) Celery
AC ):0
Oh boy, you sure called this declining oil price trend right. Have you got the "buy" signal for oil yet? I see you've got "gold fever".
I don't kid myself into thinking that i'm going to, "time" the exact bottom of oil, gold, or anything else. That's why I start buying, little by little, once we get into the range that I think will encompass the bottom. If everything works out perfectly, my heaviest purchases will occur right at the bottom. If prices begin to rise earlier than I anticipated, I buy the dips on the way back up.
Another comment on the recession and oil prices. The time to be worried about the posibility of a recession causing a drop in oil prices was two months ago. A person investing in oil two months ago ran the risk of losing 35% of his money. A person investing today runs the risk of losing maybe 10% of his money, with a lot of addtional upside potential at this point. There comes a point when the upside far outweighs the downside.
That's the mystery, Hummingbird. Let's split up. You and Professor Goose go down to the old mill to check on implied volatility. I'll go up to the inn to see if AngryChimp and Oil CEO have been able to bang any, "inside information" out of Paris and Nicole.
Translation: either bonds, commodities, and the yield curve are giving a, "false signal" of a coming recesion, or the stock market will correct to the downside in the near term.
From Dow Jones News:
On a related note, who are the decision-makers behind this ongoing flood of imports? Why would anyone want to import gasoline into this country except to drive down prices at the pump?
Is it that we just have the dinero to buy it up, so we are?
Note of interest that supports your comments - at the peak in what is the current month crude (Nov 06) of $81 - long dated crude was at $75 (dec 09). It is now at $65 and well above its $62 low whereas front month is down some $23 from its high and near low. This suggests to me:
a) near term demand for crude is dropping faster than perceptions of long term supply are rising.
b) the fact that long term is holding firm suggests there is not much more on the downside here. The open question is storage - could any major consuming country buy additional crude and store it somewhere at cheap prices - of this Im not certain buy my understanding is storage areas are relatively full
Whether $58 is "low enough," I don't know.
http://www.energybulletin.net/11386.html
http://www.chinadaily.com.cn/bizchina/2006-06/17/content_619314.htm
That is one nice ship full of oil on the market per month.
Prices should not find support, until a cold snap hits Northern Hemisphere. We are in a traditional slowdown. Last year, we did not have a slowdown due to Hurricanes skewing the supply and demand picture. I expect prices to jump back up in December at the latest. The current weather gambit that this is a mild winter also plays a big role.
My understanding is the US bubble is huge, but localised. By and large, inland markets (except Las Vegas) don't show massive overvaluation.
By contrast, coastal markets, but especially Southern California, Miami, Washington DC and New York City region, show valuation ratios which are at, or above, their British and Australian comparators?
The other factor which seems common across the US is very aggressive lending practices ('exploding ARMs' etc.) which are new, and driven by the commissions paid to mortgage brokers by financial institutions.
In the midwest and southwest, the population growth has been accomodated by sprawl. And there hasn't been the hype and bubble like behaviour, mostly.
A few exceptions: Los Vegas, Denver. But by and large this is true.
In my town (a quaint New England seaside community) there are zero lots available. If you want to build a new home, you either buy a tear down, or go somewhere else.
And there's no desire in the community to change the zoning requirements to make redevelopment more feasible. If anything it's the exact opposite, with towns tightening up on what they will allow.
It's like this all over New England. Just one of the reasons it's such a wonderful (albeit expensive) place to live.
And I believe it's like this all over Florida. Just one of the reasons it's not such a wonderdul (albeit expensive) place to live.
;-)
The market thinks those positions have found a buyer, therefore they are no longer depressing prices for the futures.
.
And under that, "Posted by Dave Cohen on Wednesday October 04, 2006 at 8:49 AM PST"
And the next line, "Topic: Economics"
And then, "Tags: recession, slowdown, peak oil, James Hamilton, Federal Reserve Bank, yield curve, oil price shocks, housing bubble (all tags)"
And there they are on the next line! You see a small version of the Google G icon: , and four other small icons. These are the ones PG is talking about. See 'em?
I am in the camp of people who are convinced that there is MASSIVE intervention in the markets, and that this is co-ordinated worldwide between central banks and governments. I believe e.g. that the price of oil, gold, Dow industrials, et al is managed on a day to day basis to be exactly what they want it to be, and that major geopolitical events are part of and synchronized with this management. The latest example being Iran that has gone from a non-problem to a big-problem to a non-problem with no fundamental change in the facts.
Now - my point is not to convince anyone of this - (I tried and failed with Darwinian :-)), but just to inject the following into the discussion:
We are naive to think that there is no "behind the scene" planning for PO and it's effects on society. Yes - superficially we seem to have a bumbling bunch of kleptocrats for a government, but look behind it, to the Council on Foreign Relations, and similar structures, and you find very smart people engaged in serious planning. We can see the little signs - Patriot Act, Unification of North America, Encouragement of religious right, watering down of the constitution, etc, but what we need to do is put it all together and realize that someone, somewhere, is planning our reality for us.
If you were put in charge of preparing America for Peak Oil, what would you do? I bet, after ten seconds of thought, you would decide to do the initial work in secret to avoid total chaos.
So in preparing for peak oil at an individual level, it is not enough to just extrapolate how western civilization will cope using the existing paradigm - you also have to take into account this "proactive reality" gorilla that is being planned for us and that is coming from left field to a town near you shortly.
I signed up with Mike at Interventional Analysis in no small part based on your email. Still not convinced but certainly agree with your above statement. In fact, it is still why I won't completely come out against Bush and company.
Just because TPTB (US and UK branches) are making their own PO preparations (police state dictatorship) does not mean that that the other 99% of their populations will like the results. In fact, I am sure that most will not be happy in the end, even rich white folks. Frankly, even the 13th century English nobility thought that they needed the right to a trial by a jury of their peers. Amazing that affluent Americans are not worried about the loss of habeus corpus, privacy, and protection from cruel punishments. You would think that there would been a clause granting first class citizenship (all the old constitutional rights) to people worth $25 million or more or something like that.
Snicker, snicker, that's hilarious! You and Angry Chimp should start your own blog. It should be good for a laugh a day. By the way, who is running this massive control operation and where do they get the money? Is it run by democrats or republicans? What happens if they get voted out of office.
Oh hell, excuse me, I forgot. The guys in Washington don't run anything, they are all just puppets. The world is run by that...that....what't the name of that originzation that runs the world?
This statement is true. The massive coordination of it all I find a bit unbelievable. The military and its academic institutions and think tanks in particular has been conducting peak oil related planning. However, doesn't mean that anything is coordinated.
'Twas ever thus.
Who is in charge of buying and selling T-Bills? Last I read there were only a handful(dont know exact #) who are given the details of T-Bill sales and they broker them.
Now with so much cash floating THROUGH iBanks, you mean to tell me groups can not get together and manipulate individual equities, commodities, & bonds? I'm not saying it IS happening, however it is a possibility. It's not like either one of us can definatly say how Goldman runs their business groups. As each of these manipulations happen, I can easily see a macro effect of the aggregated moves of iBanks.
"We are naive to think that there is no "behind the scene" planning for PO and it's effects on society. Yes - superficially we seem to have a bumbling bunch of kleptocrats for a government, but look behind it, to the Council on Foreign Relations, and similar structures, and you find very smart people engaged in serious planning. "
"If you were put in charge of preparing America for Peak Oil, what would you do? I bet, after ten seconds of thought, you would decide to do the initial work in secret to avoid total chaos."
I think these are very valid points to consider. If you had groups of people being paid 8 hours a day in think tanks like Hoover,AEI, focus groups and study groups for the Pentagon, Carlye, and all...
What WOULD you run thru the computer simulations? After feeding population trends, Economic functions, etc into large computers, what questions WOULD you ask?
I have seen some studies done on population projections and food supplies and such.
I think if you look at what happened with Europe and the UK in 2000 after nine days or so, I think anyone in the top levels of Goverment(any Goverment) are probably most afraid with massive numbers of their own people in the streets mad at them.
Controlled Calm, AND Controlled Chaos(more exactly Controlled Directed Chaos) is very important.
I wouldn't put anything past people in power.
Of course I have lived thru times of Nixon, J.Edgar Hoover, McCarthy, and other leaders pounding tables with their shoe saying "We will bury you".
I don't put Anything past those types of people.
(the current crop is no better, probably worse).
Texas had a similar "quiet" cut in production in 1973, the start of about three decades of "voluntary" cuts in our production, because we couldn't find buyers for all of our oil.
I wasn't making any kind of comment on your post--I was launching missles the--"you know they are lying when their lips are moving"--Saudis.
Funny that the Saudis are rasing prices when they can't find buyers for all their oil.