| Galactic-scale energy: Part 1 | The Oil Drum | World Oil Supplies as Reported in EIA’s most recent International Energy Statistics |
Tech Talk - natural gas production, as shale gas arrives
Posted by Heading Out on July 24, 2011 - 10:33am
The natural gas industry in the United States has undergone significant changes in the last twenty years. As I noted last time, until 1993 the industry was beset by regulation that controlled both price and flows. With the removal of those regulations, the industry was able to make considerable strides to increase market share. As it became able to do so, the problems perceived from the burning of coal in particular as a power plant fuel led to moves to increase the amount of electricity produced using natural gas. By 2009, the installed capacity to generate electricity included 34% that could be supplied from natural gas.
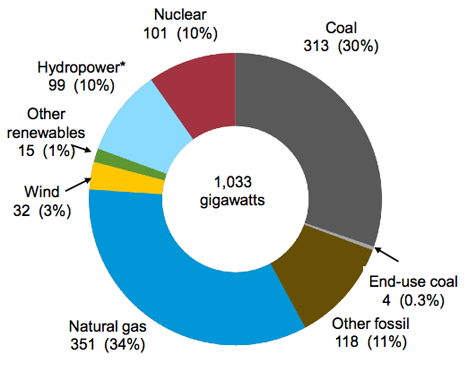
The EIA further anticipate that over the next 25 years that natural gas will continue to dominate new plant construction, comprising about 60% of the 223 gigawatts anticipated, with wind, at 11% coming second, while other renewable sources (which include a number of varieties) has about 12% of the growth. Now that doesn’t mean that the US actually produces 34% of its power from natural gas. In fact it is down at around a quarter of the current total, the difference being that companies prefer to use nuclear and coal -fired stations for their base load, and use natural gas more to meet variations in the demand cycle.
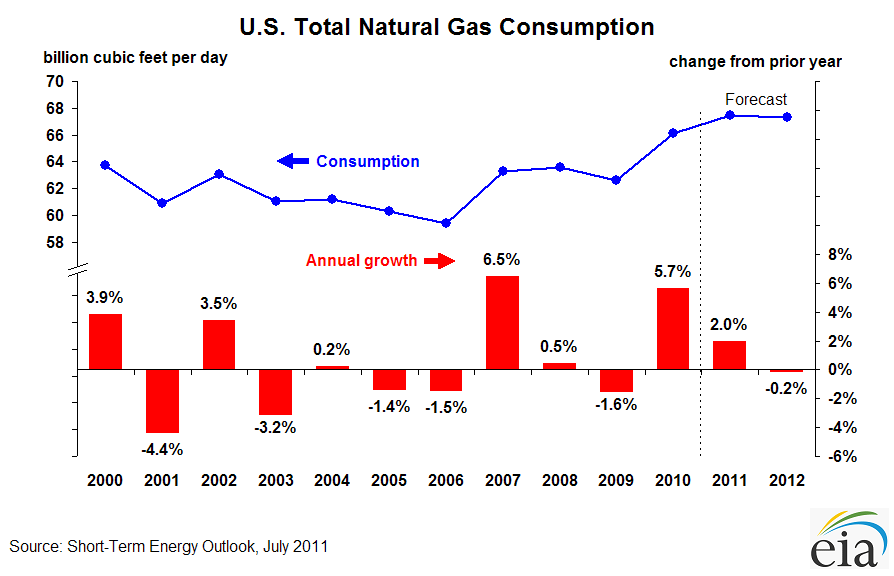
Because of this increased use US natural gas consumption has been rising in the past few years.
The total withdrawals of natural gas from domestic sources in 2009 totaled 28 trillion cubic feet (Tcf) of which 78% came from domestic gas wells, and 22% from oil wells. 13% of the 2009 total came from shale gas wells, and 8% from coal beds. Of the gas produced some 14% was re-injected to help maintain pressure in producing wells, and about 1% was flared. 3% of the volume was of non-hydrocarbon gases. The United States also imports around 11% of the gas that is consumed.
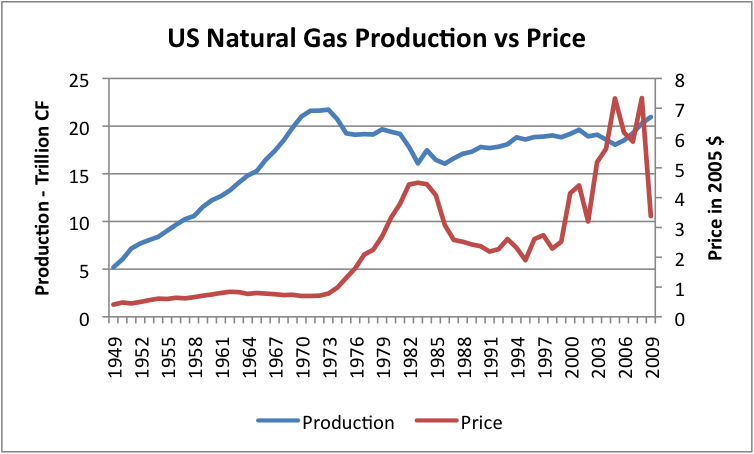
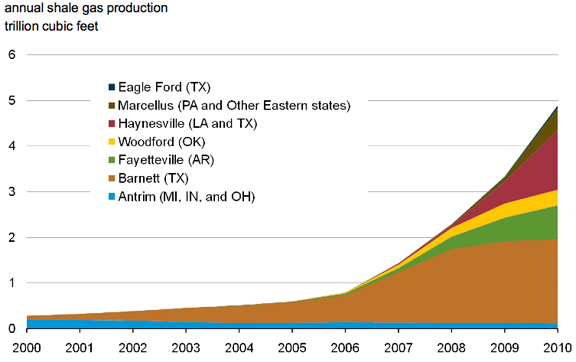
I am indebted to Gail Tverberg for the following plot that shows the longer trend in production, as well as the price (note that the difference in production volumes, relative to my number above, is that the figure below is net dry production. It is net of reinjection, vented and flared, and extraction loss).
Natural gas production by State, which I previously just ranked, shows that Texas continues to be primary, but that the combination of states outside of the big 5 is rising steadily.
It is worth noting that New Mexico, Oklahoma, Wyoming and the Federal offshore Gulf of Mexico (GOM) are declining while Louisiana is showing the greatest growth. In fact, it is so great that Cheniere Energy will convert their LNG plant in the state so that it will be able to export Liquefied Natural Gas (LNG) rather than just store and re-gasify supplies after they have been imported. The hope is to have it on line and allowing the export of LNG by 2015. That growth in production has come largely from the development of the natural gas found in the Haynesville shale.
It was in February of this year that the Haynesville took over the lead in gas production from the Barnett Shale in Texas producing 5.5 bcf/day to the Barnett’s 5.25 bcf. The field has more than a thousand wells in production, with around 2,000 permitted, and over 500 having been drilled but not completed. Part of the more rapid success of the Haynesville, the first successful well was only 3 years ago, has been because the gas could be fed more easily into existing pipelines than the case in Texas. The well location lies south of Shreveport.
The EIA plot of drilling activity in the gas shales shows the growing popularity of the Eagle Ford and Marcellus, presaging future production increases and a challenge to Louisiana.
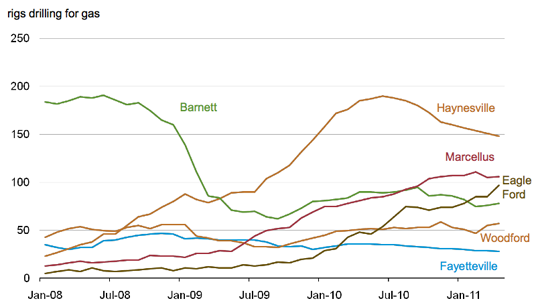
The changing emphasis also is an indicator that the day of the Barnett shale appears to now be passing into afternoon.
One of the big questions with gas shale production, however, relates to how long they will continue to produce if the production decline rates fall at levels of 85% per annum that have been reported in the past. The long-term production from these fields also depends on their profitability, and in this regard it is interesting to see how the EIA sees the price of natural gas moving over the course of the next 25 years.
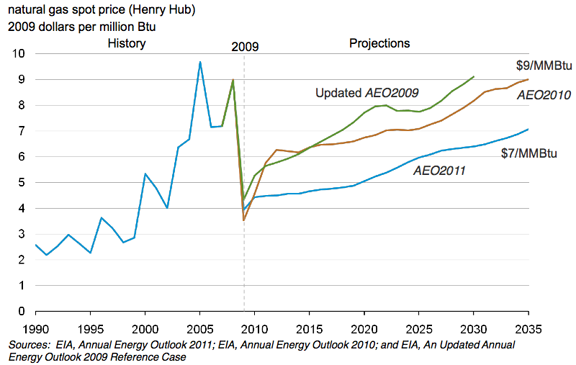
One question continues to lie in the costs required to produce and transport the gas, since this price ties in to the volumes of gas that will be produced. If that remains below the selling price and the new estimate price would appear to keep that distinction for the full 25 years, then the amount of gas produced will be much less. The EIA appears to hang their hat on long-term sustained production from these wells. That may not be as true for the tighter shale rock than it is for more conventional gas reservoirs of the country.
The EIA has just noted, in their Energy Today post that stripper gas wells produce 11% of the volume of natural gas produced in the United States.
Individual natural gas stripper wells produce no more than about 90 thousand cubic feet of natural gas-equivalent per day over a twelve-month period (some wells also produce natural gas liquids), but because there are so many (nearly 340,000) they collectively account for a significant portion the nation's total natural gas production—2,912 billion cubic feet, or over 11% in 2009.
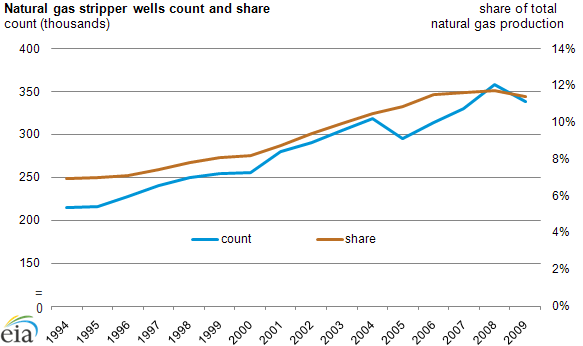
The 11% of volume translates to about 2 Tcf per year. They are most commonly found in Appalachia, Texas, and Oklahoma. The roughly 300,000 stripper gas well total should be put in the context of a total of around 493,000 total gas wells in the USA in 2009.
There is likely thus to be some engagement in terms of the price of the product and thus volumes sold, between imported LNG, domestic conventional gas and shale gas. It will be interesting to see how that develops in the near future.
Contact
- Content: editors at theoildrum dot com
- Tech support: support at theoildrum dot com
License

This work is licensed under a Creative Commons Attribution-Share Alike 3.0 United States License.
"and about 1% was flared."
I would think this would be unacceptable for environmental reasons. Why is it allowed?
Isn't it much less acceptable to not flare gas? Methane is a much more potent GHG than is CO2.
Yes, methane is a much more potent near-term greenhouse gas than CO2. There are probably some other trace gasses in the mix that are also better to flare than to leave unburned.
Flaring has declined since a peak in the 1970s, owing to regulation. .5% of GHGs currently stem from flaring, with most of that coming from Russia. US regs for the GOM (and elsewhere?) developed initially thus:
From this pdf on USA Offshore Flaring and Venting. "OWG" = oil-well gas, i.e., associated.
How big of a reason is the simple increasing economic value of the gas itself in the reduction in flaring . Wasn't it at first seen as annoying byproduct of oil extraction?
dohboi - "Wasn't it at first seen as annoying "...and still is in many countries. Don't flare the NG...don't get to produce the oil. The flares of offshore Nigeria are visible from the Space Shuttle. While working offshore Equatorial Guinea I watched 25 million cu ft flared everyday...over $100,000/day in the US market. ExxonMobil offered to lay a pieline at its expense to the island capital. The mad dictator turned it down...didn't want the expense of building a distribution system to serve the 500,000 citizens there.
Wastefull for sure. But no difference in GHG: if it were pipelined to shore it would still be burned. Just be thankful it's flared and not vented. And it's not done so for environmental reasons: vented NG is an extremely dangerous explosive hazard.
TOD authors and editors prefer that article comments relate directly to the MAIN article topic. Please review the Readers Guidelines at http://www.theoildrum.com/special/guidelines
Other energy topic comments are always welcome in Drumbeat threads, which are basically the TOD open forums.
Best,
K.
I'm not sure what prompted this warning, Kate, but the author did chose to start the article with a stunning pie (doughnut?) chart, and I can imagine that might have sparked some discussion of the percentage of, say, wind power that was already in the mix in 2009.
You have a hard job trying to keep us cats well herded, but I hope the parameters don't get so constrained that important conversations relating to energy production are curtailed even if the don't hue perfectly to the narrowest interpretation of relation to the "MAIN article topic."
In discussion and in science, it is often diversions from the intended 'main topic' that have provided the greatest breakthroughs.
Thanks again for your work.
Dohboi/John
Thanks, John.
No particular reason for the general reminder - I sometimes post one when an article is fresh if I think of it. Don't want to over-do it by posting with each article.
The cats were all over the place during the last two posts, likely because the topics invited busy minds to creative response.
I agree with your concerns and do my best to "herd" with caution, except in the case of personal attacks or blatantly off-topic material.
Cheers,
K.
I have read that half of new electricity generation capacity is due to natural gas powered plants. I don't recall that anyone has ever plotted new electricity generating capacity by source and year.
Of note, natural gas has a 30 yr undulating plateau. Very non-Hubbert.
The EIA figures for summer generating capacity (Electric Power Industry 2009: Year in Review, table ES1) give some useful results.
From 1998 to 2009, natural gas accounted for 84.8% of all increases in capacity. Wind accounted for 14.2% of all increases for that period. Both account for a somewhat larger fraction of net increases, as some oil, coal, and conventional hydro capacities were retired during that period. Much of the remaining capacity increases were nuclear, as operators received NRC permission to run the reactors at higher power levels.
Added wind capacity passed added NG capacity in 2007 (5.2 GW versus 4.6 GW), and was also larger in 2008 and 2009. Annual wind additions today are still well short of the annual NG additions that were being made in the 2000-2003 period (eg, NG additions peaked at 59.7 GW in 2002).
I think it is a mistake to burn more gas in power stations. That is the job for nukes and renewables with storage. Put another way I think LESS gas should be burned in power stations, not more. The reason is that gas will be the remaining flexible hydrocarbon when we are well along the PO downslope. At present it has no easy replacement for industrial process heat or making ammonia based fertiliser. Why waste it on powering game boxes?
A barrel of oil has about 6 gigajoules or mmbtu of heating value which is about 110 kg of NG. Therefore to replace 12 mbpd of oil you'd need about 1.3 Mt a day of gas. The actual conversion depends whether the gas is compressed or liquefied in raw form (CNG, LNG) or converted to liquid (GTL). There will not be enough gas to replace both coal and oil. Secondly the growth of intermittent generation such as wind and solar is largely predicated on gas backup. What happens to all those wind farms when there is no gas?
Gas is not our saviour when is leading us to the same kind of dependency as oil. We should save a lot of it for later, not just a decade or two but til year 2100.
Definitely it is unwise to make the electric grid and transportation fuel more dependent on natural gas, a depleting fossil fuel. Ethanol production uses natural gas in the form of fertilizer and heat at the processing plant. I expect global peak natural gas production circa 2040 when the petroleum production curve is near the inflection point on the falling edge, a point of maximum stress. Humans use natural gas to heat buildings, cook food, generate electricity, make plastics, produce nitrogen fertilizer using the Haber Process and for other purposes in industry. Because the supply of wood is inadequate and coal pollutes too much to use in a dense city, I suspect people will shift to using electricity to heat and cook, but simultaneous with this increase in demand, the supply of electricity will decline due to peak natural gas. The fertilizer needed to grow corn to produce ethanol will become expensive and scarce combining with declining petroleum supply to batter transportation and food. Nuclear power plants with seemingly perpetual license extensions will be crumbling increasing the probability of major accidents to more than one per decade. Increasing dependance on natural gas is folly.
Recent discussion of natural gas production history and potential limits.
http://www.theoildrum.com/node/8078
NG is often discussed as a 'transition fuel'--the least-bad of the fossil fuels as far as CO2 emitted per Btu produced (but of course if when it leaks directly into the atmosphere unburned, it is over 100 time the GHG potential of CO2 in decadal terms). It also doesn't produce ash, or have the mercury and sulfur problems of coal, if I understand correctly.
Until storage methods are developed, it is also handy in that NG plants can be started up or ramped up at need much more quickly than coal or nukes (again, if I understand correctly).
But I agree that we should avoid a further big ramp up of this or any other ff.
Someone once said that burning this stuff to run our economy is like burning stradivarius violins to keep your house warm--they are that chemically interesting and useful--one might say beautiful.
Instead we turn the into planetary poisons--and we have likely just exceeded the lethal dose.
Charts for EROI into the future?
You bring up a good point - although I think Rockman addressed it in an earlier thread. As I recall he said that EROI is irrelevant - the forces at work in shale gas development are basically driven by Wall Street goals.
That being said, I do have a question: Given that shale gas wells deplete faster and more of them are needed anyway, isn't the EROI of shale gas a lot lower than that of conventional natural gas?
Bear - EROI is irrelevant to the oil patch but not to the reality of the situation IMHO. There's an obvious relationship between "investment value" and EROI but it's difficult to quantify. As you point out much of the investment value of the SG play is "off book": the increase in stock value via an increasing reserve base. An extreme but real example: I once drilled 4 horizontal wells that caused stock prices to jump 500% (companywide production rate increased 4X). But the wells actually had negative EROI: the reserves would have been produced by the existing wells but at a much slower rate. The new wells added nothing to the reserve base. But Wall Street loved us because they had no understanding of how we got production up. Sorta like a guy going out Saturday night and spending his whole paycheck: gives the appearance of wealth.
"...isn't the EROI of shale gas a lot lower than that of conventional natural gas?" Yes but only in general. Obviously it depends on the size of a conventional reservoir and what it took to develop it. Unfortunately many of the convention wells drilled today (like ours) have much smaller reserves than they did 30 years ago. They also tend to have a fairly high depletion rate (but not as high as a typical SG well) unlike the ole timers. Compounding the problem: there just aren't nearly as many conventional wells left to drill as there are unconventional. We drill almost exclusively deep conventional NG plays and there just aren't that many left. I've got over $50 million in this year's budget I won't be able to spend for lack of prospects. And that gets back to the heavy activity in the SG plays: their EROI doesn't tend to be as good as a conventional reservoir but there's a lot more of them to drill. If there were no SG wells to be drilled at least half the oil companies wouldn't exist today IMHO.
Hi Rock,
I guess your comment is why I stepped off the fence into the doomer camp about 18 months ago... Dollar trumps EROI.
It's the same with the guys that knock on your door selling (tax dollar assisted) solar panels; "My fine man, you'll have this system paid off in 4 years (sure, it's not large enough to run a toaster). When you're not using it, you'll be feeding back into the grid (trickling power to other homes, but aren't we ALL supposed to be installing solar panels, so where would the trickles go then?)".
It's still not about saving the planet/ourselves. Economy comes first. And what a con that is.
Regards, Matt
Joe - And I guess in theory you could have a project with a very high EROI that won't be undertaken because the profit isn't there. Not sure what it would be but let's assume it takes just a little energy to extract the bitumine from the oil shales but the other costs factors are so high as to make it uneconomic. Say the EROI is 30 but it costs $150/bbl to get to a final oil product: it won't get done at that price.
It is hard to say what the EROI of oil shale would be since no one has a working pilot plant, but it would be considerably lower than 30.
The material in the rock (which is generally marl rather than shale) is kerogen rather than oil, and it has to be cooked at high temperatures to turn it into oil. The fuel consumption would be considerable and an EROI of, say, 4 would be more likely.
But it is the capital costs that would kill it. Companies would be hard-pressed to get the total costs down to $150/bbl, and given the tendency toward cost overruns in these projects, it could be double that by the time all the bills came in.
One question
How does the economy of using Natural Gas change as a function of distance (cost of transportation), is there any metric/stat for that ?
wiseindian - Here's a useful website (http://www.eia.gov/dnav/ng/ng_pri_sum_dcu_sny_a.htm) that can provide a lot of insight. For instance, in 2009 I was selling NG in Texas to the pipeline company for $4.21/unit while the same time NG was being sold to New York residential users for $15.05/unit. Part of that is transportaion and other overhead with the balance being profit. But take the well head price with a grain of salt: it varies significantly depending on where you are. At a time when I was selling NG for $4/unit some operators in CO were selling for less than $1/unit due to a lack of pipeline capacity to ship NG out of the state.
Thanks. So transportation is indeed a major issue, I wonder how it will scale up on a global level if it ever comes to that.
wi - You already see it happening on a major scale in the ME. There have been huge NG fields discovered there and in Indonisia decades ago. These reserves started to be shipped out via LNG more than 30 years ago but has really picked up in the last 10 years. Much of the remaining NG reserves around the globe will only be developed via LNG transport. Pipelining would be just too expensive if not impossible in many regions. Even had an odd situation here in Texas a few months ago: an LNG load was shipped from coastal Texas to England. Well head prices here were down to almost $4/unit. I'm told it costs around $3/unit to compress LNG and ship across the Atlantic. At the time NG was selling for almost $8-9/unit in England. So some profit but not much. But it was locked in before the tanker was loaded.
This eia pie chart shows a quite different distribution than the one at the top of the main post:
http://www.eia.gov/cneaf/electricity/epa/epa_sum.html
44.5% coal, 20% nuke, 23% NG...
Is the difference capacity versus actual use?
And wiki shows wind capacity for 2011 at 41.4 gigawatts. Does that mean that wind is now more like 4% of capacity? Or has total capacity gone much further up in the last two year?
I bring all this up, not to be OT (attention Kate'-), or just because I am a bit fascinated by wind generation.
But one of the reasons many in the environmental movement, at least, have supported ng generation (especially over coal and nukes) is that it can help smooth out the intermittency problems associated with renewables such as wind, because ng plants can be more easily fired up or shut down according to demand and supply, iirc.
As the percentage of the pie represented by wind (and solar) approach 20-30%, the need for either storage or NG plants for this function becomes ever more acute.
Short of other means of storage or off setting, will NG generation have to match that of renewables as a % of the whole in order to keep things running smoothly?
(I understand that, where it is available, hydro can serve as a kind of storage mechanism for other alternatives, too; though that can turn into a kind of embarrassment of alternative riches, as we saw in the Pacific NW this spring.)
Yes, the pie chart shows the actual sources for the electric power that was generated, which, as I noted, is not the same as the generating capacity.
As the accompanying report notes, however, because of the falling price of natural gas there has been significant switching from coal, production from which fell 11.6%. Since the switching is based on price then I suspect that the power companies would be delighted if prices followed the EIA prediction. I am just not convinced that we can get that much gas for those prices, and if the price has to go up, then the competitive fuels start to nibble back into the market.
Thanks.
Has anyone seen this representation of energy generation, use and waste in the US?
http://awesome.good.is/transparency/web/1101/good-energy/interactive.html
"Short of other means of storage or off setting, will NG generation have to match that of renewables as a % of the whole in order to keep things running smoothly?"
Yes I think so. Wind, in a way, have no capacity at all on its own. A 3 MW wind tower could be seen as a way to convert a 3 MW peaking NG plant (running at 66% on average) to 3 MW baseload power (running at 100% always).
If this were slashdot, I would say "mod Parent UP"
I would also adjust the intro in to this discussion to say:
Nuke plants almost never change output, until there is an equipment failure (or earthquake). Big Coal plants take a long time to ramp up and down. Neither one of these does very well in changing market conditions. The low-risk bet for financing equipment is natural gas, as the natural gas price fluctuations can be passed on to ratepayers.
Wind is most effective as a natural gas (or hydro) "helper". Stretching available supplies of NG or water behind the dam by generation.
Canadian gas is mentioned only by inference (11% imports) (Mexico imports NG). A few years ago this was 15%.
My SWAG is that increased tar sands production and increased other Canadian demand is behind that 4% drop, but I would like some #s.
Noteworthy is the 7 GW of new wind under construction or contract in Alberta (+800 MW installed).
Rough calcs suggest that more than 33% of total AB demand will come from wind if all 7.9 GW is built.
Is this due to concerns over NG supply in Alberta ?
If Canadian NG exports are about to trickle down to zero, and possibly reverse, this eventuality will affect the USA NG supply. And this possibility has not been considered.
Canadian natural gas production is indeed declining. Alberta production peaked around 2000, and East Coast offshore fields are depleting.
This is not really a problem for Alberta (other than declining revenues) because there is more than enough gas to supply local demand. There is a priority system, and exports to the US will be cut off first, followed by shipments to other provinces.
Some people think that NAFTA will prevent exports to the US being shut off, but they haven't read the fine print in the agreement. I'm not sure the US authorities are fully aware that they are being curtailed, but given their current surplus of shale gas, I don't think they care much.
Oil sands plants are indeed using up a lot of the supply, but they are sufficiently high on the priority list that they will never be short. Ontario will be cut off before the oil sands plants, much to their considerable annoyance I imagine. If they complain, Alberta will tell them that there is shale gas in Central Canada and they can frack it themselves.
The 7 GW of wind generation on the drawing boards in Alberta is because wind power is economic in certain particularly windy areas of Alberta at current electricity prices. The investors are just waiting on transmission lines to get it to market. The natural gas power plants are mostly peaking units, which will work well in combination with the wind generators, and they are sufficiently high in priority that they will never get cut off.
In addition to environmental issues, it should be mentioned that one of the things that drove massive construction of natural gas-fired (primarily combined cycle) generation in 1998-2003 was independent power producer construction of plants due to ELECTRICITY deregulation. Deregulation caused a significant shift in the market structure for generation from utility driven decisions based on lowest long term prices for ratepayers (energy cost is a pass-thru), to IPP driven decisions based on short-term profits (with an incentive to create higher energy prices).
The changes made gas more competitive. The decision time frame on these plants also coincided with very low natural gas prices. The biggest part of the cost of (most) power is the capital cost. Combined cycle gas plants have substantially lower capital cost than new plants with lower fuel costs (coal, nuclear, hydro, wind, solar, etc.). The change to most new power plants being constructed by IPP's rather than utilities, increased the interest rates (and the risk) at which plants were being financed. At higher interest rates: lower capital cost, higher fuel cost technologies are more competitive. Many IPP's were also gas producers, and building gas power plants constituted an investment (physical hedge) in future profits whether on the power or the gas side. (Low gas prices, power plants make money for sure, high gas prices gas producers make money for sure and potentially both power plants AND producers make more money with high prices if you can increase the market share of gas sufficiently).
In effect, deregulation eliminated the social guarantee that a plant would be paid for, raising interest rates, and skewing consumer costs upward by moving money from consumers to bankers thru IPP's. This also skewed the relative financial merits of gas and coal.