World Oil Supplies as Reported in EIA’s most recent International Energy Statistics
Posted by Rune Likvern on July 25, 2011 - 10:45am
DISCLAIMER: The author holds no positions in the oil/energy market that may be affected by the content of this post.
This post is mainly an update based on World Oil Supplies as Reported in EIA’s most recent International Energy Statistics.
The world is split into four economic groups to describe supply developments as follows: OECD, Russia, OPEC and Rest of World (ROW; Rest of World = World - (OECD + Russia + OPEC)).
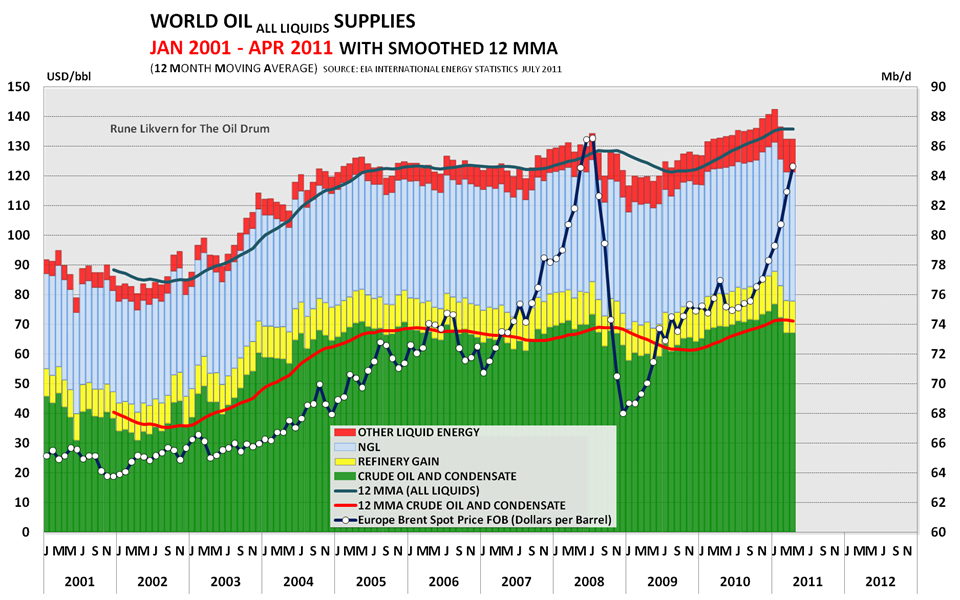
Figure 01: The stacked columns in the diagram above show development in global supplies of crude oil and condensate, refinery gain, natural gas liquids (NGL) and other liquid energy from January 2001 through April 2011. The development in the average monthly oil price is plotted on the left hand y-axis. NOTE: Diagrams based upon EIA data may be subject to future revisions.
NOTE: Scaling varies from chart to chart and some charts are not zero scaled. Labels indicate whether graphs are on an "all liquids" or "crude and condensate" basis.
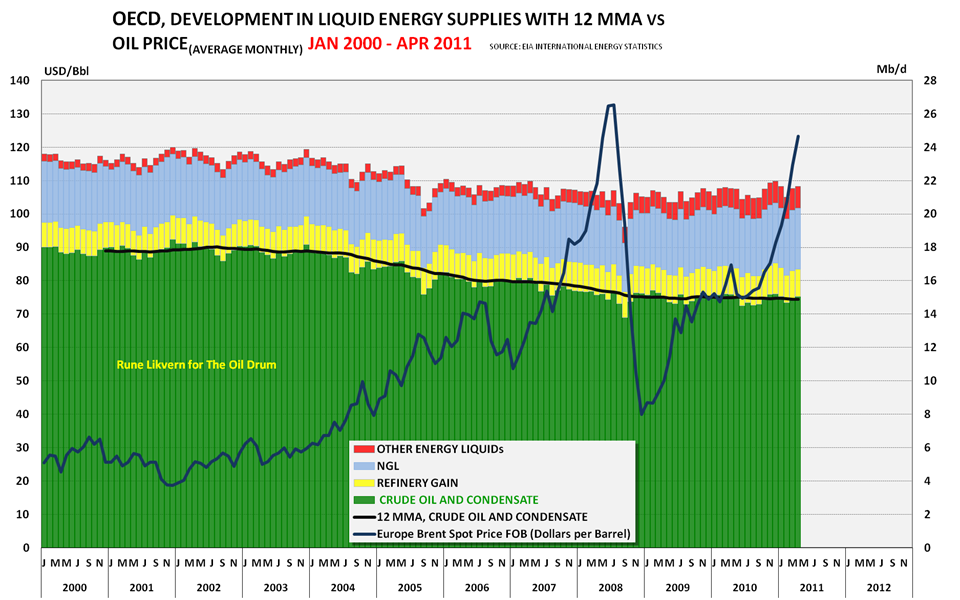
Figure 02: OECD supplies of energy in liquid state split on classes from January 2000 through April 2011.
Figure 2 shows that supplies of crude oil and condensates within the OECD has declined with around 3 Mb/d since 2004 and that some of this decline has been offset by growth in supplies of other liquid energy like bio ethanol and biodiesel.
The chart also illustrates that higher oil prices have (as of now) not resulted in growth in crude oil supplies. The high oil prices have most likely encouraged projects that have slowed decline from producing fields and made possible flows from smaller fields.
EIA in their Short Term Energy Outlook (STEO) for July 2011 has projected a growth of 0,1 Mb/d in OECD and a decline of 0,1 Mb/d in Russian petroleum supplies from 2011 to 2012.
For the world EIA have forecast a growth in world (all liquids) supplies from 87,7 Mb/d in 2011 to 89,4 Mb/d in 2012.
In the recent months supplies of crude oil and condensates from Russia has become stagnant and ROW shows a decline.
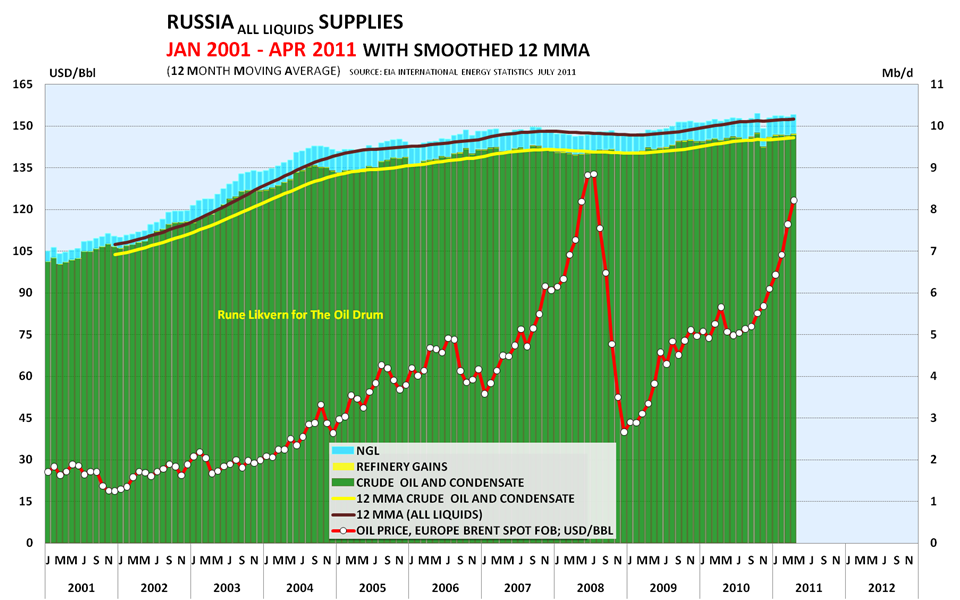
Figure 03: The stacked columns in the diagram above show development in Russian supplies of crude oil and condensate, refinery gains and NGL from January 2001 through April 2011. The development in the average monthly oil price is plotted on the left hand y-axis.
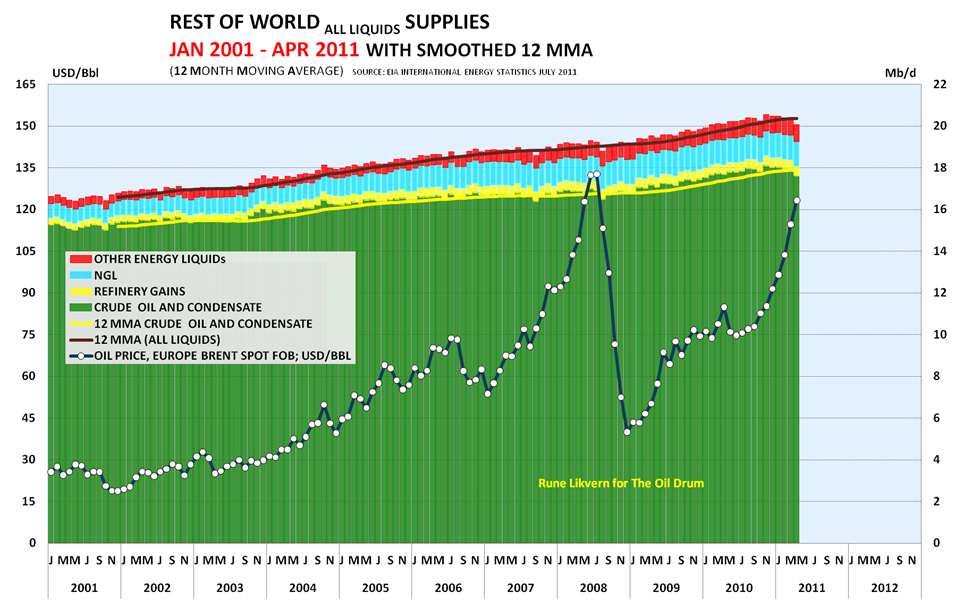
Figure 04: The stacked columns in the diagram above show development in ROW supplies of crude oil and condensate, refinery gains, NGL and other liquid energy from January 2001 through April 2011. The development in the average monthly oil price is plotted on the left hand y-axis.
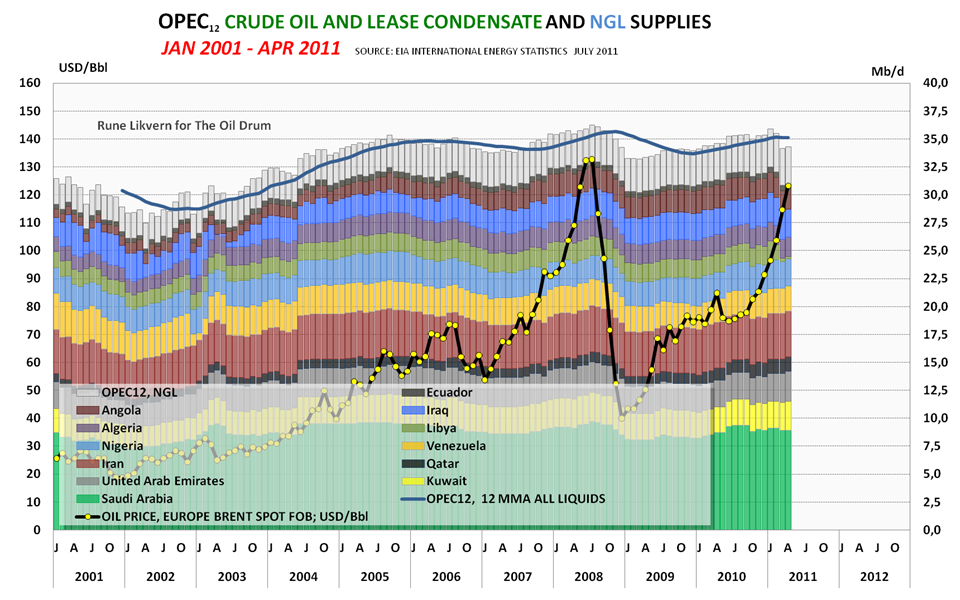
Figure 05: The stacked columns show each OPEC member’s crude oil/condensate supplies and OPEC’s supplies of NGL from January 2001 through April 2011. The average monthly oil price is also plotted on the left hand y-axis.
The recent data from EIA shows weak growth in supplies of crude oil and some growth in supplies of NGL from OPEC. (NGL are presently not part of OPEC's quota arrangements.) The war in Libya took out around 1,5 Mb/d of OPEC supplies.
To me, the recent growth in the oil price (adjusted for fluctuations in the value of the US Dollar) is a signal calling upon increased crude oil deliveries from OPEC. As increased supplies from OPEC have taken time to materialize, IEA decided to improve supplies by selling oil and petroleum products from the OECD stocks.

Figure 06: The diagram above shows crude oil and condensate supplies from January 2001 through April 2011 for Kuwait, Saudi Arabia and United Arab Emirates.
As of April 2011, crude oil and condensates supplies from Kuwait, Saudi Arabia and UAE have not reached the high seen during the summer of 2008. EIA STEO for July 2011 estimates the total spare crude oil capacity from these 3 producers at 3,35 Mb/d for 2nd quarter of 2011. The STEO shows that none of the other OPEC members has any significant spare capacity.
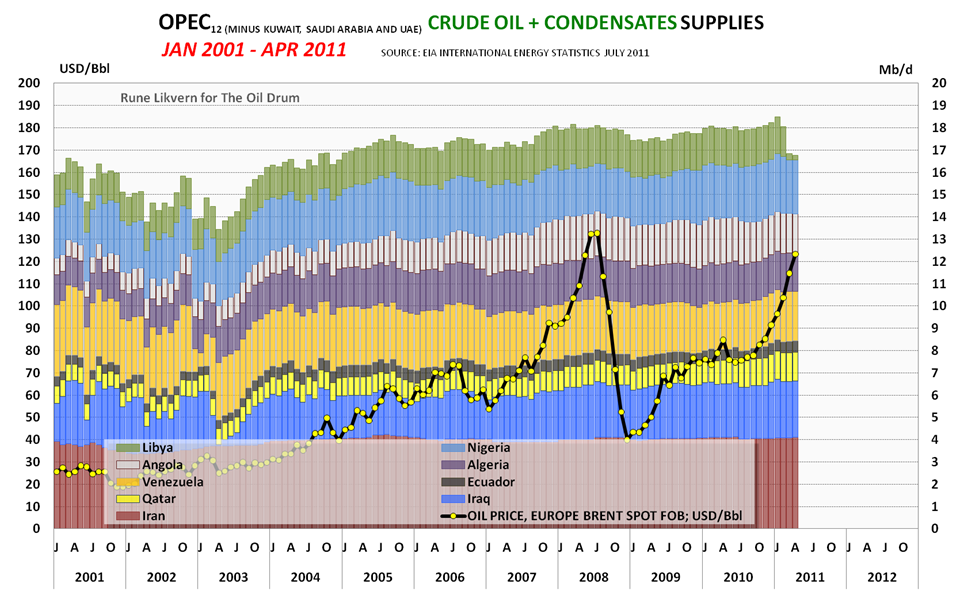
Figure 07: The stacked columns shows development in crude oil supplies from the 9 other OPEC members. The average monthly oil price is plotted on the left hand y-axis.
Total crude oil supply from the 9 remaining OPEC members shown above have remained relatively high and flat until the loss of Libyan production. This suggests that these countries are pumping at capacity, regardless of price.
Since my previous post back in February 2011 on this subject, the big picture remains with stagnant world crude oil supplies in the face of rising oil prices.
SOURCES:
[1] EIA, INTERNATIONAL ENERGY STATISTICS
[2] EIA, SHORT TERM ENERGY OUTLOOK, JULY 2011
World Oil Supplies as Reported in EIA’s most recent International Energy Statistics
PDF version
96 comments
World Oil Supplies as Reported in EIA’s most recent International Energy Statistics
PDF version
96 comments
Contact
- Content: editors at theoildrum dot com
- Tech support: support at theoildrum dot com
License

This work is licensed under a Creative Commons Attribution-Share Alike 3.0 United States License.
Crude oil may be required to produce "other liquid energy". Might this result in double counting?
There are some double counting as volumes of other liquid energy have not been adjusted for petroleum fuels and other petroleum based inputs to produce the crops feeding and running the the processes turning crops into bio diesel, ethanol etc..
Any form of energy that is costly has a lot of embedded energy, like off-shore deep-water drilling, for example. So oil is required to make the equipment to drill the well and so forth.
Net energy is what is needed to make clear the true amount of energy available per capita. That is the real stat to keep track of imho. But it is a hard one to monitor. So we just watch the C&C number stagnate and wonder if we are at a peak.
Given that we have been on a plateau since late '03 (by my eyeball), isn't it pretty certain that we have passed peak net energy extraction a good while back?
That is, the world economy running on fumes.
The economy does not run on fumes. Those cheap Chinese imports are made mainly with coal energy. We are probably at peak net energy about now due to the massive increase in coal production in the last 8 years.
Oct - We've chatted before about the difficulty of including all that embedded energy into the hydrocarbon extraction system. Got me thinking of a very simple approach: ignore it. Same thing with a bad investment: it's sunk money. A $700 million Deep Water rig has a lot of embedded energy. So does a $500 million pipeline or a $2 billion LNG train. But that energy is spent whether that rig is developing a 500 million bbl oil field or is sitting cold stacked in a shipyard somewhere.
And the actual energy used to drill a well, including all the fuel for the boats, choppers and even the hands driving from home to the dock every week is still very small compared to any production developed. I don't think EROI will ever be a limiting factor. Long before an operation can't afford the fuel to run the project costs will kill the effort. A Deep Water GOM might cost $150 million. But the total fuel cost might be less than $20 million.
If such a well won't work with a $20 million fuel bill (IOW won't produce $20 million worth of oil/NG) then it certainly won't merit the $130 million of the other costs. There is energy consumed in making all the other materials used in drilling a well (the "tangible costs") but typically 60%+ of the costs to drill a well is
"intangible": leased equipment like the rig and the 100's of other smaller pieces of equipment. And yes...there energy expended in the maintenance of such equipment but that's an even smaller amount than the fuel burden.
Bottom line it seems any oil/NG extraction program will not go forward on the basis of total cost long before the net energy gain gets anywhere close to zero. But embedded energy does kick in with a passion when you have to expand the infrastructure. And perhaps we're seeing that effect in plays like the Eagle Ford. There's a significant need for much of the equipment used to drill these wells. Contractors, like rigs, frac companies and directional drill companies are charging very high rates. But there has been no huge rush to expand the equipment lines. One reason may be the histories of companies who did do it during the SG boom in Texas/La. a few years ago and were crippled when the boom went bust. But the current high costs of such expansion due to high energy costs maybe an even more critical factor. Difficult to estimate.
This is a very rational way of looking at this issue and why I concede EROI is tricky to understand. I am not of course a professional energy accountant, although I do balance energy equations all the time. The guys I work with must receive more energy from their activity than they put into that activity else they cease to be able to grow in population.
Time will tell whether we invest deeply into expensive carbon-based systems past deep=water and shale-oil or whether there is some investments into other non-NG/Oil, yet expensive, renewable systems.
I would guess that we will invest heavily into shale-oil/NG. less into renewables.
Oct - "we will invest heavily into shale-oil/NG. less into renewables." Maybe along the lines of dealing with the Devil you know and not the one you don't. And, of course, we already have a lot of sunk energy in out hydrocarbon extraction system that we don't have tied up in the alts. I.E.: not how much energy it would take to build the solar panels but how much energy to build the plant to make the solar panels. Same reason someone might not buy a car that gets better milage as long as the old one is paid off and still running OK.
I'm really starting to like that concept "sunk energy". Explains a lot about the tenacious grip BAU has on us.
ROCKMAN, I don't know if I am qualified to, but I concur strongly with your 2 posts above.
The "sunk energy" (and the implied "sunk money") in the fossil fuel industry is astonishing. The fossil fuel industry has the benefit of a century and a half of sunk materials, but even more importantly, of "sunk" development time, at both the production and user side. Whole populations of technicians, scientists, engineers, logistical managers have given their whole career in the development of this industry. The sunk brainpower in this industry is almost impossible to measure. Any alternative, no matter how technically sophisticated, is beginning from a point far, far behind the fossil fuel industry.
The above and the issue of "externalizing" costs are critical to the ongoing success of the fossil fuel industry. From the birth of the industry right up to this day, for example, the "carbon release" has been a freebie for the fossil fuel industry...but we know it will not be a freebie for the renewables industry, as part of thier selling point, low carbon release is a requirement. Likewise other environmental issues (it is not sensible to develop "diry clean energy", i.e., solar and the other renewables will be expected to be clean in a way the fossil fuel industry was never expected to be.
It is a fascinating subject. I wish more of the renewables just now getting to the point of having paid out their sunk costs (such as the concentrating mirror solar thermal plants build in the 1970's) would be studied. We would begin to get a picture of the renewables AFTER the cost of the plant are effectly "sunk", i.e., paid out. It could be very informative. (an aside: You point about keeping an older car is dead on, when it makes more economic sense...even if not "energy" sense, to keep an old car, people will do it in these tough times...this makes things tough for radical development forward such as electric or plug hybrid cars, which would still have much of the 'sunk costs' out in front of them. But even that gets complicated; Does the development of the electric motors over the last century count as part of the sunk costs of an electric car? What about the sunk costs in battery development borrowed from the cell phone and lap top computer industry?).
RC
Indeed our economy is fixated on fossils and many folks work on them. Most Chemistry Departments owe the industry a great deal for sponsoring research into using hydrocarbons to make things or developing ways to manipulate hydrocarbons. Less has gone into renewables. The future looks a little different at the University level today. More solar and so-called bio-based chemistries are happening, but it is modest relative to oil/petroleum stuff.
A famous scientist/chemist once said in the 1970s when he was looking for a job -- the big oil majors were all paying major coin for a Chemist/engineer to refine oil or process X more efficiently by 0.01% or something like that.
That is probably the same today. So when engineers and chemists leave University then they are going to likely sign a Faustian deal with big Oil to get more money -- and so it goes.
Self-perpetuating ...
At one time we had a very large equine industry. Massive amounts of brain power were involved in the breeding and training of horses. Many people were employed in harness, saddle, and wagon industries. Large amounts of our land were given over to hay and grain fields used for keeping our horses fueled.
Some little guy back in Detroit built a car in his shed, working on the engine in his kitchen during the winter. Things changed.
Rockman,
For the first time, possibly, I think I disagree w u on something. I'm cool with discounting the sunk energy, but if we do that, then we need to account for the "sinking" energy rate. It is anything but static, and measures the cost of x in terms of x. Just b/c it is difficult, prbly futile, doesn't mean it isn't extremely important. If oil is the limiting factor in this eq., quantifying it's worth in relation to itself seems hyper-relevant.
Hope that's clearish, oft time lurker...
Stav – I think I get what you’re saying and I don’t think we’re that far apart. I think your “sinking rate” would be the same as future infrastructure costs…no? Let’s use NG pipelines as an example. The energy used to make the steel and lay the 100’s of thousands of miles of pipeline is “sunk”. The only future energy requirement is the fuel the compressors burn that pushes the NG along. And this amount is minimal. Thus the EROI of delivering NG from the well head to your home is very high. But if a new major p/l (like the Rockies Express) has to be laid to get new discoveries to you the EROI would not be as good. It would take a good bit of energy (your sinking rate?) to mine the ore, turn the ore to steel, make the pipe, transport it. , weld it and lay it. But even that energy expenditure wouldn’t stop the project no matter how low the EROI would because the p/l would be laid if it were profitable to do so. The other cost factors would sink the project long before the energy costs.
Of course, EROI is not complete unrelated to financial value. But it tends to be a minor component. When I decide to drill an $8 million well the fact that I’ll use $600,000 of fuel isn’t the deciding cost factor…it’s the $8 million. And most of that $8 million pays for the rental (not the construction) of all the equipment and the labor. If it’s a dry hole then the EROI is obviously negative. But if I find 10 bcf then I spent $600,000 of energy to bring more than $40 million of energy to the market. That would be an EROI of 66…what’s not to like?
But let’s look at your sinking rate of a new solar panel plant. It will obviously take a lot more energy to build that plant than make one panel. So the EROI of that panel is absurd. But you’re not going to make one panel. So now you have to amortize the many panels it will make. Or do you? If the plant is built the EROI of a single panel might be calculated based just on the energy needed to make it. How much energy used to build the plant won’t be used. Likewise the decision to make panels will be based on the production costs. Similar to NG well that doesn’t produce enough to return the initial investment. And even if the energy produced is less than the energy used to drill the well the well will still be produced because the EROI of the production process is still positive even if the overall effort has a negative EROI the NG will still be produced.
Now the tricky part is integrating the failed (negative EROI) with the successful (positive EROI) projects. OTOH all wells drilled start with a very positive EROI/profitable calculation. They just don’t all turn out that way. So after the fact you declare project A has a negative EROI. But that point…so what? The effort/energy has happened. Now if we ever perfect time travel we might be able to avoid all those negative EROI projects. Until then all projects undertaken will be assumed to be profitable with good EROI. Otherwise they wouldn’t happen, would they?
Everyone has a different measure of what's important in their personal universe, I drill oil/NG wells for a living. EROI has never and never will be a consideration of what wells the oil patch drills. Costs, risk and potential are the critical factors. Thus EROI is of no importance in my world. A factor, yes. But one of little impact.
Future infrastructure costs, yes. Amortized into the present if you will to provide a presesnt rate of energy investment to energy returned atm, on average.
eroei is an inevitable consequence of the system, it has a sneaky way of working itself into those other factors that you consider when deciding whether or not to dig a well.
Pls disregard post down the line btw. iPhone refresh button obviously kinda broke or laggy or something. Eroei is something that fascinates me, one step below total amount of oil/liquids/energy/resources avail., IMHO.
Basically, I would like to posit, that as a long time lurker, that unless the form of the energy has a value added bonus, eroei, in the end is everything, unless energy is not the lowest common denominator. Any answer contrary to that is a lagging indicator. And it would not be something I would bet on, long term.
Let me go out on a limb.. Raw materials are the variables we are working with. IMO, they are not our constraining factor, but may become so in 20-60 years. Their delta is constrained by energy, which is the constraining factor. If you need gold, and all you've got is lead, a little alchemy is nice. Without energy, you're never going to get there.
For what it's worth,
Just for arguments sake, what do y'all in the oil patch estimate eroei for crude at this point in the game, accounting for all inputs? Wild guesses are totally acceptable.
stav - That's exactly the point I'm trying to make:"...what do y'all in the oil patch estimate...". We don't. Investment decisions never have nor ever will be made upon EROEI. EROEI is a term totally unknown in the oil patch. The only input of energy in the decision process to drill is the cost of the fuel used to directly run the operation. And that represents around 5% to 7% of the cost to drill and complete a well.
But I don't have to make a wild guess of the EROEI of any well I've ever drilled. For the dry holes it's negative: X btu's used and zero btu's produced. At the other extreme a well that utilized $600,000 of diesel and produced 300,000 bo. I'll skip the btu conversion and just keep it in $'s for simplicity: 300,000 bo X $90 = $27 million. And $27 million/$600,000 = 45.
So two wells: one with and EROI of 45 and the other negative. And yes...lots of embedded energy in the equipment used. But the $700 million and energy spent to build a Deep Water rig doesn't come into the decision process at all. The $600,000 per day rental charge for the rig is THE determining factor along with all the other daily costs. So again: total daily ops costs around $800,000 X 100 days = $80 million. Fuel costs = $6 million. The bottom line: does the risk/reward estimate justify the $80 million investment? The fuel costs is a factor but not a controlling factor by itself.
But this is our sunk energy...the drill rig exists. But let's build a new one and estimate EROEI of the construction phase. That's easy: it's negative. A drill rig just sitting in the water produces no energy. In fact the power plant burns fuel continually even when not drilling. So from day one the rig represents a sunk cost and very big negative EROEI. Most rigs of this class have a life on 20 to 30 years. So let's assume it drills 25 DW wells in its life. And assume 24 are dry holes...all negative EROEI. But it drilled the discovery well at Thunderhorse discovering 100's of millions barrels of oil. Or somewhere around $25 BILLION. Now this is a WAG: EROEI of the rig including all the drilling it every did is very high...well above 40 in this scenario.
And that's the nature of the oil biz: you either loss a lot of money - negative EROEI - (last DW dry hole I worked on costs $158 million) or you make a lot - high EROEI - (last well I completed will produce $40 million of NG compared to the $60,000 of diesel I burned drilling it). Again, when I say EROEI is unimportant I'm saying it isn't used as a defining factor in the decision making process to drill. It is a factor but its impact is minor compared to all the other inputs.
So that takes care of specific projects. So how do we characterize the EROEI of the oil patch as a whole at any point in time? I have no freaking clue. LOL. It's not a zero sum game. I've seen many companies go under because they drilled too many dry holes and found too little reserves. But that stil doesn't mean those companies had a negative EROEI. And maybe not even that low. Again, it's easier to use a specific well: an E Texas shale gas well cost $8 million to drill and complete but only produced $6 million of NG. And every well this fictional company drilled was the same. So a total failure economically. But not from an EROEI standpoint: each well took $600,000 of fuel to drill and complete. So again an EROEI exceeding 10 or so. But even though all the wells are money losers they are still being produced. And the EROEI of producing these wells is even higher...probably 50 or higher. Yes...much of the NG we burn today comes from wells that never paid back the initial investment. And probably a few that won't even recover the cost of the fuel used to drill them.
So bottom line I have no idea what the overall industry EROEI might be. But, then again, I don't care because that answer would have no bearing the next time I evaluate a drilling proposal. Each deal stands alone...the specific numbers either work or don't.
Thanks for the detailed explanation. It's kind of fun coming out of my hidey hole occasionally to actually participate in the process. I am beginning to have a new appreciation for price, and the wealth of information that it hides. In a shrinking economy, with less profit to go around, it seems like it is getting closer to the true cost (or maybe value is a better word) of many items. It may even be unsustainably low.
I used to shop and pay steeply discounted prices for most everything. With the advent of this recession, the same kind of deals do not exist. IMO, we have hidden inflation in the lack of discount available on many items. But I digress..
strav - That's a good point I hadn't noticed. I've always been a discount (read: cheap) buyer. Two-for-ones and buy-one-get-one-free, etc. I'm not much of a consumer these days so I hadn't noticed what you pointed out. Other than Big Lots and a few others it doesn't seem the good deals are out there as once was. Except real estate, of course. But my home buying days are over so that doesn't do me much good.
To me, much of those $130 million of other costs are also part of the EROI. They're ultimately paying for energy. It can be the energy used to build that equipment you're leasing. It can be the energy needed to oversee the whole operation and keep things running. The part of it which is wages... well, that's ultimately paying for energy to keep people alive and happy enough to do the work you want them to do.
So IMO, if the "project costs" keep you from drilling, it's likely because your EROI has fallen too low.
peak - Again it's real simple: in 36 years I've never seen a well not drilled because of the fuel bill to drill it. Every project I ever rejected was due to the reserve potential not justifying costs. And a minor portion of that cost was the fuel. The costs of all the other components have no bearing on the energy used to build them. One year a rig might cost $14,000/day and a few years later might cost $35,000/day. But the energy input used to build to the rig is fixed.
Bottom line: I'm beginning to understand that a lot of folks way over estimate how much energy is used to build infrastructure and drill. I just had a partner drill a $16 million well in the swamps of S La. Spent about $800,000 on fuel. Sounds like a lot to many folks but still a small portion of the cost.
BTW: a dry hole = very negative EROEI to say the least.
I understand your point about drilling or not drilling. I never said the energy expense would come up directly as a fuel bill. However, I disagree that the cost of other components have no relation to the energy used to build them. For sure, there are going to be market driven fluctuations once a certain amount of hardware has been built and demand for it changes. But if energy does not matter in building a rig, why is the market not flooded with cheap rigs? Even at 10,000$ / day, I'd happily lease you a few if I could build them without needing too much energy to do so ;-) But I can't.
There is a minimum cost in building a rig and that cost is very much energy driven: energy to power the machinery, to make the steel, to extract the raw materials, to transport everything together in a single location, etc. It may not even all be oil but it is still energy and I think it needs to be taken into account.
About dry holes: of course the EROEI needs to be averaged over many wells to make sense. It's the same as the risk analysis you do before drilling.
PEAK - "I never said the energy expense would come up directly as a fuel bill." Nor did I (I think). But if you amortize the energy used to build the equipment across the hundreds of onshore wells drilled using that equipment I suspect it would be less than the actually energy used to drill a particular well. For example a $700 million Deep Water rig might drill 45 wells during its 30 year life. Those wells could add up to a total cost of $5.2 TRILLION (at today's prices). That's almost 8X the construction costs. Assuming the energy tab is about 10% of the construction costs then the total drilling costs is 80X as much as the construction energy costs. IOW the energy component of the construction costs is still small compared to the drilling costs. And this doesn't take into account the energy produced by the wells. But consider the reserves from Thunderhorse (300 million bbls). The discovery well was just one of the many dozens drilled by that rig during its life. That 300 million bo would yield 3.1 BILLION gallons of diesel. At $4/gallon that's over $12 BILLION in diesel. Compared that to the $60 million or so of energy used to build the rig. If you applied 100% of the 'EI" to the "ER" on just that one drilling effort the EROEI is over 200. And yes, that's just the EROEI of drilling that one well and much more energy will be expended developing/producing the field. But appreciate the magnitudes we're talking about.
I expect that the effect of EROEI will only be noticed as the whole industry slows down. When the cost of dry holes exceeds the profit from producers, a company will go bust; and as companies disappear, the industry will shrink. It will probably take decades.
I like your comparison to solar. That first solar panel out of the factory is a "dry hole" ... only after millions of panels does the factory begin to produce.
Peak – I’m with you on this one, and it’s also one of the rare times I disagree with Rock. The difficulty of EROEI has always been deciding where to draw the boundaries. What should really be included in the “EI” portion of EROEI? Rock is proposing that only the actual fuel used by machinery directly involved in the extraction process should be included in EROEI. IMO, that’s way too narrow a definition for “EI”. If running a rig business requires X workers, all of whom need food clothing and shelter for themselves and their families, that energy usage is just as much a necessary component of the extraction process as the fuel burned by a pump or a helicopter. From an EROEI standpoint, the human workers can be viewed as just another kind of machine necessary to produce the final output. One could claim that those people are already alive and will be consuming energy anyway, but that exactly misses the point of EROEI. If the extraction process didn’t require these human labor inputs, that labor would be available to apply to other wealth creation activities besides energy extraction. And that’s the whole point of trying to calculate EROEI in the first place: understanding how much “excess” energy/wealth/labor/etc. is available to apply to things that are important to humanity other than energy extraction.
Beyond the energy required to fuel the human “machines,” EROEI should also include depreciation of the rig and other machinery. If it takes X GJ of energy to build a DW rig and associated machinery, and said rig can drill 25 DW wells over its lifetime, then something like X/25 GJ should be included in the EROEI budget for each well, and this is part of that “other” $130M an oil company is spending when they hire the rig. Of course, part of it is profit, and that represents the “excess” that should NOT be included in EROEI calculations. In the end, it may be practically impossible to accurately allocate the “EI” part of EROEI. If you could do this on the basis of monetary costs, it would have to include something like minimum survival wages for all the human employees and families involved in the process, break-even rental rates for the rig and all associated machinery, fuel costs, transportation costs, all consumed material costs, etc. It’s probably not possible to do with any accuracy, but it’s nonetheless crucial to humanity’s near-term prospects for any kind of meaningful prosperity. The fact that oil companies don’t use this as the basis of go-no-go decisions is a separate issue of somewhat lesser importance in the big scheme, IMO.
beam_me_up - I couldn't agree more with you. I think you have worded the whole issue a lot better than I could.
In line with seeing humans as "machines", I might add that moving production to places with lower wages (eg. China) has also been a way to reduce the energy input of manufacturing. It takes (or at least used to take) a lot less energy to "maintain" a worker in China than it does in North America. So the location where your rig parts are made ultimately affects EROEI. It's all rather confusing.
Good and unfortunate point, iq. And nice points above, oct.
One thing that I've taken away from this thread is that sunk energy can be considered a positive.
Basically, a dependable, lowish maintenance machine with a substantial amount of yesterday's energy invested in it does not mean big boo hoo if it can be used to extract tomorrow's energy in a presently energy-cost efficient manner.
I would not go so far as to base future infrastructure decisions on it, but basically, be optimistic where we can be. This is a good thing,- we have assets.
At the risk of being flamed --
EROEI makes a compelling scientific argument and is important in the long term analysis of energy usage, BUT it has little to no relation to the business of energy in the short term, and is actually a bit of a red herring when evaluating energy sources. Why? - Because EROEI does not account for is the RELATIVE value of various types of energy.
What is worth more, a gallon of gasoline or the sun shining on an acre of ground for x hours. The energy measured in BTUs may be identical but I will pay $4 for the gallon of gas to drive to the store while the actual value of the energy from the sunshine is negligible as I have no way to utilize it.
An easy comparison:
Electricity at $0.10 and 3,413 per kwh = $29.30 per million btu
Gasoline at $4.00 and 115,000 btu per gallon = $34.78 per million btu
Crude Oil at $100 and 5,800,000 btu per barrel = $17.24 per million btu
Nat Gas at $4.24 and 1,000,000 btu per thousand cu ft = $4.24 per million btu
Coal at $14.70 and 17,500,000 btu per ton (Powder River) = $0.84 per million btu
On this basis gasoline is worth 40 times the same energy in coal.
From a business and real life standpoint this RELATIVE value of energies completely overrides arguments about EROEI.
What Rockman says about people in the oil industry is entirely correct. I doubt that 1 in 10 (or 20+) will even understand what the term EROEI stands for. If you explain it to them they will grasp the concept but be puzzled why it should have any impact on their day to day business.
No risk of being flamed, this has been brought up before in great detail. There was even a TOD post about it about a year ago IIRC. Some forms of energy are clearly more convenient (and thus more valuable) than others.
So we might end up using other forms of energy (eg. coal, wind, solar) to extract oil even if its EROEI falls below 1, just become it is so damn valuable. But then, the extracted oil will no longer be an energy source to the economy as a whole. It will simply be a way to carry energy around, somewhat like hydrogen generated from electricity or biofuels (a convenient way to store and carry the energy of the sun used to grow the crops).
beamer - I understand the confusion. "Rock is proposing that only the actual fuel used by machinery directly involved in the extraction process should be included in EROEI. IMO, that’s way too narrow a definition for “EI”." I'm not trying to define the EI of EROEI. How ever you want to define or calculate it is OK with me. The point I keep trying to make is that what every you calculate the EROEI to be on a potential driling project it will have zero impact on whether that well is drilled or not. The amount of original embedded eneygy of all the equipment and materials used doesn't enter into the calulation. It's the cost of using the equipment and buying the materials vs. the risk to reward aspect that will determine if the well is drilled or not. And back to the same point I keep failing to get across: the amount of fuel that used to drill a well is very small compared to the total cost and takes very little production to replace. Remember even a mediocre unprofitable $2 million well that makes just 10,000 bbls of oil would yield over 100,000 gallons of diesel. And I burned less than 100,000 gallons of fuel to drill the well. So even a near failure has a positive ERORI. Imagine the EROEI of a 200,000 bo well.
So back to the embedded energy and energy input for maintenance. The rig in my above example might drill 200 wells in its life time. So what every number you might generate for it "EI" you have to divide by at least 200 to amortize for each well drilled. Again I have no good guess what the EI of the infrastructure would be but I would bet that the amortized value per well would be less than the fuel I burned to drill a well.
And again the point I apparently keep failing to explain is that long before a poor EROEI calcualtion would kill a drilling project the lack of sufficient reserve potential vs. thc cost will kill the project. So again it isn't that EROEI is important or not: it doesn't play a part in any decision to drill a well or not. Nor in the decision to spend $700 million in labor and materials to build a Deep Water rig that might require $40 million worth of energy to build. If the investment can't justify the $700 million it would be dropped long before you even notice the $40 million energy component.
EROEI may be a critical factor in other types of projects but it really is irrelavent in the hydrocarbon extraction business. But maybe that's why: most other projects don't generate the fuel they are using. Perhaps it makes more sense to think of it that way.
Perhaps the difference between money and EROEI is something like weather and climate... money is used 'locally and for a short term' to get oil or gas, but EROEI is actually for larger units like countries, whole oil producing areas or something like that and for the long term, to describe the large picture of how things are developing.
ses - A valid point for sure. It's easy for me to dismiss EROEI when describing an individual drilling project. Now step back and look at the results of all drilling activity in the US. Successful wells obviously have a nice positive EROEI and the dry holes a negative EROEI. So what's the net industry wide? I could try to cook such a number for the US but it would take weeks of research and I'm just too lazy for that. But in the end I'm certain the overall EROEI would be positive. While the dry holes burn up a good bit of diesel the successful wells produce many times that volume. Like I said: a barely successful well (30,000 bo) that burned 50,000 gallons of fuel to drill might produce over 1 million gallons of oil yielding 250,000 gallons of diesel alone.
So even if only 30% of wells were sucessful we would find a lot more energy than we used to drill all the wells. But let's get back to my basic point: EROEI is not a factor in any decision made to drill a particular prospect. Let's assume the net result of the entire oil industry in the US yields an negative EROEI. That would be good, of course. But the enxt time i evalaute a drilling prospect I could care less what the industry is doing with respect to EROEI. I'll make judgements based upon the specifics of that prospect. and taht takes us back to the FACT: whether anyone likes it or not, drilling decisons never have nor ever will be based uopon EROEI considerations.
Get over it already. LOL.
That's an interesting analogy. Just like rising global temperatures (climate) can eventually mean there will be fewer days under X degrees (weather), falling EROEI (that fuzzy thing which is hard to define or measure) can eventually mean there will be fewer and fewer profitable wells to drill (what ROCKMAN rightly cares about in the immediate future). Might be why we're having such a hard time getting ideas across. And just like weather/climate, the short term fluctuations completely drown out the long term changes.
Rock – I believe understand the point you’re trying to make, but I don’t think I’ve made mine clearly enough. If I understand your argument correctly, you’re saying:
(a) Oil companies don’t consider EROEI when deciding whether or not to drill; they base their decisions on CROCI = cash returned on cash invested ;-)
(b) Lots of drilling prospects whose EROEI is much greater than 1 will have CROCI not far enough above 1 to justify the investment, and for that reason oil companies will not pursue those prospects
(c) Because of (b), oil production will decline long before EROEI becomes the limiting factor
If the above points accurately outline the message you’re trying to convey, then I understood you from your first post. Where I disagree – and on reflection it’s probably not a big disagreement – is the assignment of cause and effect. If my outline above doesn’t convey your message, then I don’t understand the point you’re trying to make and you can disregard the rest of this post.
Nobody is saying that EROEI will go all the way down to less than 1 and that’ll be what kills oil production and kills the economy. To put the point in terms on which you are focused, I believe the “EI” part of EROEI is roughly correlated with the “CI” part of CROCI. As the less technically challenging prospects decline in size (lower ER), and the big prizes become more challenging and require higher overall activity levels (higher EI), EROEI will decline. Not surprisingly, this will also correspond to lower CROCI, unless energy prices can rise sufficiently to offset the cost increases, and we know there is only so much cost the economy can bear. At some point of diminishing outputs and increasing complexity/inputs, EROEI will decline to some lower threshold (probably much higher than 1) that will be also be associated with an unacceptably low level of CROCI (probably also higher than 1). From your perspective, it will have been CROCI – not EROEI – that caused the problem, because cash considerations are the basis of the oil company’s decision process and you live that process. But I think the two are inextricably linked, even if oil companies don’t think about it that way.
Consider your deepwater example. You’ve got the shipyard building the rig (cost of their activities to be amortized over the life of the rig), the suppliers of all the associated machinery on the rig and the shipyard itself, the company that owns and operates the rig, the oil company commissioning the well, government regulators overseeing and enforcing the rules, the builders and operators of pipelines and tankers, supply chains for materials and services to provide ongoing support to all these key stakeholders, supply chains for the supply chains, etc, an entire global network of activity if you trace the true “footprint” all the way out to the end of the line. And there is an army of human beings required to staff all of these organizations to make it all happen. There is an energy cost for every human being, every process, every scrap of material, every facet of the overall endeavor. It’s impossible to truly calculate EROEI, but I don’t think we have to. As the level of activity goes up to maintain flat or declining production, we know which direction EROEI will be headed. That’s more important than the absolute level. And CROCI will be headed in the same general direction unless energy prices could rise without bound, and we know that can’t happen. If you want to use CROCI as your metric, that’s okay with me. We’re going to run into problems before either one of them gets to 1, and in the case of EROEI, probably before it gets anywhere near 1.
Any idea why a modern wind turbine looks so very different from an ancient windmill ? Did they have lesser engineers or was it the lack of an oil based construction facility ? The wind is still the same I believe.
Old windmills were used to supply very low-speed, very high-torque power, for physical processes such as milling and foundry work. They are an excellent technical solution to this requirement.
Modern windmills are used to supply high-speed, low torque power, for electricity generation.
Wind is the same. But energy extracted is different. Hence a different solution.
Ben
The study of Aerodynamics has progressed since ancient times.
http://en.wikipedia.org/wiki/Aerodynamics
Also: Cast iron gears were a big improvement over wooden gears, and you can make a lot taller tower out of steel than you can out of stone.
Why do modern boats look so different from ancient triremes? A thousand little improvements over time.
Advances in materials, machine tools and engineering
From Roman times windmills were wooden structures with cloth covered sails for blades.
It took the Federal Arsenals over 40 years to develop interchangeable parts (ca. 1818-1850). This required developing machine tools and systems of blocks and gauges to measure precision of parts. This technology did not spread throughout industry until late in the 19th century.
Steel was a very expensive commodity until Bessemer and Siemens-Martin processes and became inexpensive by the 1880s. Steel required harder cutting edges to work with machine tools. Diamond was used earlier but had obvious limitations. Electric furnaces were able to produce cobalt and tungsten for steel alloys and silicon carbide and tungsten carbide cutting edges.
A mathematical treatment of propellers was developed by Rankine in 1865 and improved by others ca. 1889-90. The Wright brothers developed the modern airplane propeller that was within 5% of the efficiency of today's.
Blade design advanced considerably after the 1970s energy crisis after attention was again drawn to wind power.
Today’s wind turbines have composite material blades and rare earth alloy magnets in the generators.
http://en.wikipedia.org/wiki/Propeller
http://en.wikipedia.org/wiki/Wind_turbine
Rune, in an earlier post I aired the idea that Global economy slowed significantly in 2/4 and that demand for oil was already heading lower. The loss of Libyan production coincided with this hence swing producers have not had to swing - any thoughts.
I also think it is significant that production in your ROW group appears to be heading lower. This leaves only OPEC and Russia with stable production / some room fro growth.
We are in a pickle.
Evans-Pritchard, UK's Telegraph, 24th July
Euan,
For OECD (and according to available data) petroleum consumption has slowed a little during 2nd quarter of 2011.
Non OECD consumption seems to continue to grow.
There is still the possibility that producers with spare capacity (most likely Saudi Arabia, Kuwait and United Arab Emirates) are working on bringing this spare capacity on line and that this takes time. We will know in the next few months how much capacities these countries have added.
Euan,
As perhaps the individual who has most knowledgably and consistently (in the past) argued that peak oil is yet to come, has your current view shifted or am I reading too much into this comment?
What are refinery gains? Is it the increase in volume that results cracking from large molecules into smaller ones or something equivalent to putting more hot water into a pot of used tea leaves to get another weak cup of tea? If so is it too a form of double counting?
Refinery gains is a collective term describing the volume expansion of crude oil that is refined. Crude oil needs to be refined (that is longer hydrocarbon chains needs to broken down into shorter hydrocarbon chains like gasoline, diesel, kerosene etc. that is marketable end user products). There are several refining processes and some of them involves adding hydrogen (natural gas) which also adds volume.
The volumetric heat content of the refined products are in general lower than for the crude oil fed into the process.
Roughly crude oil expands with 2,5 - 3 % by volume during refining. This volumetric expansion does not add energy.
You get as much (or close to) energy at the outlet of the refinery as there is put in.
Refinery gains is a form of double counting as long as volumes are counted.
One way around this would be to count energy (Joules/Btus) fed into the refinery and energy in marketable products out from the refinery.
Or to count metric tonnes. A "GigaJoule" is a very meaningless term to most people, inluding me.
A gigajoule would make more sense to you if you received monthly natural gas bills in gigajoules, which I do.
1,000 cubic feet of natural gas has about 1 gigajoule of heat content (varies somewhat)
1 barrel of oil has about 6 gigajoules of heat content (varies somewhat)
The conversion of barrels to tonnes is more difficult because it depends on the density of the oil, and the density of crude oil varies widely. West Texas Intermediate has a density of 827 kg/m3, Brent is 835 kg/m3, and Dubai is 871 kg/m3. Saudi Arabia's Ghawar oil field produces oil ranging from 825 kg/m3 to 860 kg/m3. Extra-heavy crude oils have densities greater than 1000 kg/m3, whereas condensate averages (but varies widely) around 700-750 kg/m3, and NGLs can be much lighter than that.
Using mass rather than volume units would eliminate the "refinery gain" calculated by the EIA, but mass in tonnes as used in Europe is difficult to calculate accurately from the "barrels" that American oil companies use without having access to the raw data.
However, European refineries don't have "refinery gain" because they use mass units. Mass in = mass out, and if it doesn't there's an oil leak somewhere.
You get your gas bills in GJ? One GJ =~ 288 kWh. So you burn, say, 4GJ in a winter quarter? I guess I'm surprised at anyone using GJ; it seems like a really big unit.
It's not that big a unit - equal to 1.055 million btu's. The retail price in Vancouver of one GJ is about $9.10, and I think it is about $7 in Calgary.
If you are using gas for heating, and can use just 4GJ for a winter quarter, then you likely have either a very small, or very cold, house.
In Australia, natural gas in priced in MJ, so you have prices of about 1.6c/MJ (=$16/GJ).
In countries that are smart enough to use the metric system, the people are usually smart enough to understand the energy units.
Using a dysfunctional set of measurement units, as is the case in the US, only serves to keep the people confused - you sometimes wonder if that is intentional...
So, here we need to introduce the concept of "sunk intelligence" as an adjunct to the forces maintaining Business as Usual - In this case, we are talking MAU (Measurement as Usual).
This term was co-founded by leading social scientists from the two world powers (US and Liberia) still using British Engineering Units as the primary system of measure.
MAU in these countries was found to carry such a high societal overhead that disposable intelligence (that portion of intelligence left over after the basic daily needs of an individual had been met) was actually negative on an annualized basis, necessitating importation from abroad to make up the deficit.
Tyan in Seattle (temporarily in Nantes)
Then you would be left with the same problem. A tonne is a measure of weight. A barrel is volume. A Joule is energy. Energy is what we're most concerned with.
Perhaps ToE will work for you?
http://en.wikipedia.org/wiki/Tonne_of_oil_equivalent
No, a tonne of oil equivalent will definitely not work for me because in Canada, at the production level, we measure crude oil and natural gas in cubic metres. At the retail level, we measure fuel oil and gasoline in litres, and natural gas in gigajoules.
Historically, Europeans measured oil in tonnes (or in Britain, long tons) because they shipped oil in ships, who charged for freight by the tonne (or for British ships, long tons). Americans measured oil in barrels because they used to ship them in barrels on railroads, who charged by the barrel. Neither is particularly meaningful to the average consumer. A tonne of oil equivalent of natural gas is particularly hard to visualize, other than the fact that it sounds like it would take up an awful lot of space and be very hard to weigh.
If you really want a definitive comparison, and are really sure energy is what you are trying to compare, measure it in GJ so as to use internationally recognized units.
The price/supply/demand dance seems to have slowed over the past few weeks. Some sort of equilibrium? It's almost as if nobody dare risk changing the tune (or simply can't). Whatever, baring some poke to the system, it looks like 2011 will see an average price of over $100/bl for WTI, higher for Brent.
It'll be interesting to see what effect the pending US Debt situation has on demand and prices, as production seems to be stuck in a rut. Fuel prices are slowly rising again, here in the SE US, after falling a bit in June.
One of the rules of a complex adaptive system is when things start to get less 'jittery' and start to drift - worry.
Such behaviour can be symptomatic of the feedback loops which have to date kept the system in equilibrium breaking down. As those feedback loops lose their power the noise on the signal reduces.
Problem is, without those feedback loops, the behaviour of the system can switch to another attractor - either fast or slow - and be governed by that in future.
One such jump that is anticipated is from where countries pump as much as they can to maximise earnings; to one where they pump as little as they can, to push up prices and maintain reserves. It's quite readily understandable that on the way up the oil production curve the first attractor can hold sway, but on the decline the second will win out. Between the two is breaking and reconnect of the controlling feedback loops.
I'm not saying that that is what's happening at the moment (more likely it's the strange position the WTI index is in), but beware dynamically stable systems that look like they have hit 'equilibrium'.
....the calm before the (next) storm.
First, good to see another Rune Likvern post.
Second, and apologies if I missed this, but do you have a graph with total production of liquids that does discount the fact that biofuels like ethanol have about 65 % of the energy intensity of sweet crude(e.g. you need more ethanol to get up the same energy levels in KiloJoule or whatever your preference is for measurement)?
I'd like to see that in relation to how much new actual energy input is put into the world economy.
Also, I remember you predicted some time ago a shortfall/squeeze in around Q4 or thereabout this year(correct me if I'm wrong), no sign of that prediction in this post. What's your current update?
Hello Leiten and thanks!
Below is a revised diagram showing supplies of crude oil, NGL and other liquid energy on a heating value adjusted basis.
Refinery gains have been left out to avoid double counting. Further NGL and other liquid energy has been converted to crude oil equivalents, that is volumetric energy content of NGL and other liquid energy is treated as it would appear if these were counted as crude oil.
EIA in their STEO for July 2011 forecast a total world consumption of liquids of 89,0 Mb/d for Q3 2011 and 88,8 Mb/d for Q4 2011.
In April 2011 total world supplies was at 86,4 Md/d.
This illustrates that there now is a gap of around 2,5 Mb/d that needs to bridged.
To me it presently seems like it will be challenging to close this gap.
Fascinating ! Thank you, Luke.
So, OECD is way past Peak.
RoWorld ? Maybe we need to see 1 more year.
Russia - the jury is out, but certainly there will not be much growth.
OPEC ? There's the question.
Does the first chart mean that peak oil was not reached in 2005 and still has not been reached? If the EIA is correct, world crude oil and condensate production was higher in 2010 than ever before. Doesn't this mean that spending all this effort on this blog is a waste of time? What am I missing?
Putting the last years development in context takes at least one more year. Peak Oil is as we always said detected with the use of a rear mirror. My guess is this was a temporary bump before a head down. Future will tell.
Constellation, the EIA has Crude + Condensate peaking, so far, in 2010. JODI has C+C peaking in 2006 so take your pick. The EIA however has net crude oil exports peaking in 2005 and we were, according to the EIA's latest data we are still down 3 million barrels per day from net crude exports in 2005.
However the point really is that we are at peak oil right now. That is we are on the peak plateau and any difference between 2005 crude production and today is within the margin of error. But the peak in net crude oil exports is clearly in the rear view mirror.
Depends on how you describe "a waste of time". I guess many would call a study of history a waste of time because there is absolutely nothing you can do to change it. By that measure Edward Gibbon wasted his entire life studying and writing about the "Decline and Fall of the Roman Empire". But hell, I just want to know! So no, I do not consider it a waste of time.
Ron P.
At the 2002 to 2005 rate of increase in global C+C production, we would have been at about 86 mbpd in 2010. Instead, except for 2009, global C+C production has been between 73 and 74 mbpd since 2005 (EIA). And in fact, we have seen a cumulative shortfall, between what we would have produced at the 2005 annual rate and what we actually produced in 2006 to 2010 inclusive. Basically, slowing rising unconventional production has not been sufficient to keep total production on an upward slope.
And as Ron noted, we have seen a measurable decline in Global Net Exports (GNE), which are measured in terms of total petroleum liquids. What I define as Available Net Exports (ANE), which are GNE less Chindia's combined net oil imports, fell at an average annual rate of one mbpd per year from 2005 to 2010, from 40 mbpd in 2005 to 35 mbpd in 2010 (BP + Minor EIA data). A plausible estimate is that ANE will be down to 27 to 30 mbpd in 2015.
But to answer your question, yes our discussions are probably a waste of time, since our political and economic systems are so dependent on the infinite growth model. Basically the majority of people don't want to talk about resource limits. A reasonable ballpark estimate is that the total supply of Global post-2005 CNE (Cumulative Net Exports) will be half depleted by 2020. In other words, imagine all of the oil that would be net exported after 2005 in one big fuel tank. A rough, but reasonable, estimate is that this fuel tank will be about half empty by 2020.
Here is how I described our predicament in a recent essay:
http://www.energybulletin.net/stories/2011-02-21/egypt-classic-case-rapi...
Hello Constellation21,
Peak Oil can not be identified with certainty before after the fact.
Figure 01 also conveys another message and that is that world oil supplies is not growing in the face of growing prices.
Yes, you are right. We would all probably be better off preparing for the effects from higher oil prices.
Don't be too concerned with the year to year blips, bumps, and ripples. A million or two barrels a day either way, measured against 70 - 80 mbd total production, is just not that big of a deal.
As anyone who has spent time here can tell you TOD is famously myopic, not unlike a dog worrying a bone, and for some strange reason the majority of the posters here seem to think the world didn't exist before year 2002. At best that is just plain lazy, at worst it is deliberately deceptive.
The story of oil will be written over the span of two centuries and in the big picture we are well on track to begin seeing significant declines sometime after 2015.
For a little perspective:
After all, it's really not that complicated, the area under the production curve will roughly equal (and cannot exceed) the area under the discovery curve. In an ideal production environment the discovery and production curves would be symmetrical, and the production curve would cross the discovery curve at the time of maximum reserves, roughly midway between their respective peaks.
In our less than ideal global environment the production curve has become flattened, as was already obvious by the late 90's when the famous "End of Cheap Oil" article was published in Sci. Am.
Cheers,
Jerry
"TOD is famously myopic"
There is no unitary TOD, unless perhaps you mean the editorial staff? If you mean those who post here, that would be equivalent to "anyone who has spent time here." So are you saying the posters here would know that they are 'famously myopic'??
Just trying to make sense of what you intend to be saying.
As to "the majority of the posters here seem to think the world didn't exist before year 2002," I can only speak for myself, but the graph you posted is so thoroughly seared into my, and I assume most regular posters's here, mind, that it rarely comes up for discussion. It is old news. Like most people, we are interested in the latest data (new news--can 'news' really be anything else?). But that doesn't mean we don't keep the larger picture constantly in the back of our minds.
It is probably a good idea to bring those broader ranges of data in more often than we do for those new to the site to get the bigger picture.
That statement is at best deliberately insulting and at worst just down in the dirt wrong. There are reasons that the monthly data charts don't start before 2001. That is because no one publishes world monthly data before that date! The EIA monthly data, for world oil production, starts January 2001 and the JODI data starts January 2002. JODI publishes no data whatsoever that dates prior to 2002.
I have posted, many times, yearly data and charts based on the EIA data which starts with the 1970 production numbers.
Anyway, thanks for the insult. We need an occasional slap in the face to keep us on our toes.
Ron P.
This made me google "End of Cheap Oil", which turned up this article and prescient quote.
http://ngm.nationalgeographic.com/ngm/0406/feature5/fulltext.html
June 2004
"We've got an unstable hole," laments Bill Kirton, who's overseeing the project for the oil giant BP.
The drill, suspended from the Enterprise's derrick through a swimming-pool-size gap in the hull, has penetrated 17,000 feet (5,180 meters) below the seafloor. Instead of boring straight down, it has swerved more than a mile sideways, around a massive plume of rock salt. But now, with 2,000 feet (610 meters) to go, progress is stalled. Water has begun seeping into the well from the surrounding rock, and the engineers are determined to stem its spread before drilling farther. Otherwise, the trickle of water could turn into an uncontrolled surge of crude. "There's a lot of oil down there wanting to come out," says Cecil Cheshier, a drilling supervisor, after struggling all night with the unruly hole. "You can cut corners and take chances—but that could cost you a lawsuit or cause a spill into the Gulf of Mexico, and then deepwater drilling gets shut down."
Ironic and Prescient simultaneously.
Andrew - And times don't change: I was given a similar speech by my first mentor in 1975 which he probably got from his first mentor in 1946. The equipment changes and hands come and go. But Mother Earth doesn't change the rules: do it right or you'll pay the price. And sometimes a huge price.
Like the old saying about a seaman never turning his back on the sea. For 36 years I've followed a simliar rule: any well can just be a few minutes away from death and destruction. And often when you think you have little to worry about.
Has the equipment *really* changed all that much from the mid-70's? Seems like the same-ol same-ol to me.
don - Yep..still a lot of dumb iron. I was refering to tech such as Log While Drilling and pore pressure analysis. My last gig was Deep Water Wellsite Pore Pressure Analysts for Devon. In the good ole days you would just drill and "let the well talk to you". And sometimes the well would tell you it's trying to kill you and you would occasionally get the message too late. I have no trouble remembering the fingers, hands and lives lost back when I started in '75. Hands were just considered replaceble meat in steel toe boots. Without PP analysis we would be having a Macondo's every month..or no drilling at all out there.
I've often thought that this chart would be more informative in cumulative form but I've never seen it presented that way. Has anybody else?
If all you learned reading this site is that oil peaked in 2005, then I'm afraid reading it has been a waste of your time.
I have learned so much from this site. I attempted a list, but it became far to long. This site is a wealth of ideas worth investigating. I want to thank everyone who makes it happen and everyone who posts.
If nothing else, TOD is my island of sanity in a world gone mad.
In case you're interested in getting more out of TOD I suggest:
ERoEI and why it's important
http://www.theoildrum.com/story/2006/8/2/114144/2387
The Export Land Model
http://www.theoildrum.com/node/7007
The balance if oil imports and exports.
http://europe.theoildrum.com/node/6994
The big picture.
The average crude oil production since 2005 was 73.4 mb/d, around where we started in the first months of that year. As can be seen the blue areas above the average were cancelled out by production losses below the average.
Each time we reach a peak or spike, something happens. In 2008, it was the GFC, at least partially triggered by high oil prices. Now, in 2011, it's the oil war in Libya, which is a typical negative feed back loop of the peaking process. So, no, it is not a waste of time to monitor oil production. In the contrary, we gain an understanding of what is happening.
The above graph is from my website
http://crudeoilpeak.info/latest-graphs
Nice point.
And if you place the line at the lowest point in the undulating plateau it would be at about 72 mb/d, a point first reached in '03. That is why I date our entry into the plateau from that time. This would mean that we are just two years from the ten year anniversary of entering the plateau.
I hazard to guess that few around here, including myself, predicted the plateau could last this long.
And now our dear rock just below is opining that it could last another ten years or more.
Have NG, coal and renewables ramped up enough to keep something like our earlier upward slope of energy use going?
Even on a plateau, I would have thought the economy would not be able to sustain the illusion of continued growth. '08 certainly saw a major contraction. It seems that we may be about due for another, but I have been thinking that every month for the last year or so.
Great plot Matt!
Great colors, fully documented, easy to interpret and makes the idea of the "bumpy plateau" completely understandable.
Kudos!
Jon
C - Perhaps you might consider the position many have been coming to lately: the exact date of "PO" is, for the most part, not relevant. It has become apparent to me that we have probably entered the realm of "Peak Plateau". And IMHO picking an exact date for it isn't relevant either. PP will be an extended period (a couple of years...5 years...10 years...who knows?) when global oil production rates will vary over a relatively short range. And during which rates will periodically bump up close to the historical max and then drop (perhaps often as a result of demand destruction). And it's that aspect that makes PP much more significant than PO: volatility. The world will be on a tender balance between having adequate energy supplies at a price it can afford and price peaks that push economies into recession. This balance will also tend to exaggerate manmade disruption in oil supplies. I.E. - had the loss of Libyan production happened 15 years ago it wouldn't have made front page news.
If you'll notice much of the discussions on TOD deal with this volatility but you may not see the connection. For instance consider the topic of alternatives be they ethanol, solar, wind, etc. Their development is dependent upon their economic impact. The periodic energy price spikes drive this discussion and just as quickly kill it when prices drop and there's abundant supplies. The same goes for thoughts of economic growth in the US.
For some of us the debate on PO timing is "a waste of time" as you put it. Thus in that sense you're missing everything TOD has to offer if that's all you're focused on. But you can change just as many of us have. Come on in...the water's fine.
Rune, I've a small quibble regarding your graphs. A moving average is a crude filter and the 12 month trailing average as you have used results in a phase lag of about 6 months. I suggest using an odd number of months, then placing the value so calculated at the middle of the period over which you average. This would bring the graphs into the proper phase relation. I know that this technique is widely used, especially when plotting prices for stocks, etc, but it's really not accurate...
E. Swanson
So EIA aren't out of the International Energy Statistics business after all? That talk about trimming their budget was just that, talk?
JODI show demand YOY for the Top 30 consumers in March 2011 thus:
-791.8547 Nations where demand fell
1351.4605 Nations where demand rose
For a difference of 559.6058 kb/d. I'm leaving out Brazil, who didn't report anything for March; also Russia, Singapore, and
Iran, who seem to throw the JODI questionnaire in the garbage, as no data has ever been reported from these countries, IIRC. No doubt you could fill in these gaps easy enough as Rune has done previously. China's average for Jan-Apr is 9.06 mb/d. They've slacked off a bit after hitting >10 mb/d last fall, but haven't departed sharply from an upward trend. Bloomberg mentions them reporting demand up 7.2% for the first half of the year; that would be ca. 9.5 - 9.8 mb/d; so gains would have been a bit more robust in the intervening months since the last JODI data point in May.
Platts however report that growth was only .5% June - lowest in two years - this was attributable to refiners going offline for maintenance due to high prices, not any substantial drop in domestic demand. China's oil demand growth cools on high prices - MarketWatch
Not just talk at all though they still do, and will continue to, gather quite a bit of international energy statistics. They never said they would be entirely out of that business. I don't know where you heard that.
However they did suspend publication of of the International Petroleum Monthly. The last issue was published was the January issue. A lot of other stuff has been cut also.
EIA budget cuts to curb some energy data gathering
Ron P.
Ron - makes me wonder: if that's what they aren't going to do because of the 14% budget cut...what are they going to produce with the 86% of the budget they still have?
Maybe in your link where it's explicitly stated that they'll "terminate updates" to them. Or the articles devoted to this topic which were posted here. Or on various other blogs, starting with Gregor MacDonald's. Other forms of international data from EIA are of marginal interest to me; what they provided of real utility was the hydrocarbon data, which apparently they were paying IHS for.
Your link was from late April, I can't find any more recent articles covering this in Google News. On the EIA's International Energy Statistics page they throw out this disclaimer:
Aren't sure how long that's been on the page. International Energy Statistics.
Any good bureaucracy will try to protect its bureaucratic overhead at the expense of performing useful services.
In the private section, if the word came down, "Cut the budget", the first people out the door would be all the executive secretaries followed by most of the executives ("I think we can usefully eliminate several levels of management in this company"). Then, most of the paperwork would be replaced by computer systems, and the people who used to prepare and read the paperwork would be punted as well. Then all the janitors would be replaced with an outside cleaning service, the back office functions would be outsourced to India, and the corporate head office would be sold to a property management company with a leaseback arrangement.
At the end of it all, costs would be much lower, but services to customers and corporate revenue would be about the same. Bureaucrats don't think this way at all.
What I have presented in this post is an update of the supply side of energy in liquid form as of April 2011.
As was mentioned further up Peak Oil will only be a certainty after the fact.
CATALYST Online Edition has an interview with Dr. Fatih Birol from the International Energy Agency (IEA) where he states that he believes conventional world crude oil production “peaked” in 2006.
(Look at “extended Interviews, then click on Dr. Fatih Birol and/or any of the others interesting intervierws.)
However in my opinion it is equally as important to look at the demand side of the picture. Below there are 2 charts based upon data from EIA that shows the development in demand/consumption from OECD and Non OECD from 2001 and as of March 2011.
Petroleum Consumption for OECD has declined with around 4 Mb/d, from 50 Mb/d to presently around 46 Mb/d, since 2005. I think it will be hard for OECD in the future to reach consumption levels as these were in 2005.
In other words chances are that OECD has been on the down slope for some years.
In the same period demand/consumption for Non OECD has been growing steadily.
As world total oil supplies have been stagnant for some years, price seems to it that oil flows to the highest bidder.
If global oil supplies are to enter a decline these trends could continue fueled by a steadily growth in the oil price.
And 9 of the 12 mbpd rise goes to China. My theory is that the a lot of the oil is going to make products that come back to the OECD in the form of embodied energy -- chemicals, plastics, and other products. The idea is to offshore jobs to lower-paid Chinese workers. You get back the oil products but the workers do not have enough money to consume much allowing the waning barrels per person to be spread a little further. I guess this scheme continues for a while longer. Not sure what the engame is however.
Or in other words "demand/consumption" has only grown in areas with dodgy oil stats not fully monitored or audited by the IEA. Everywhere else that actually is audited is down.
BTW, Your charts appear to not exist on TOD server. For example http://www.theoildrum.com/files/OECDMAR2011.png is not there but actually returns the TOD front page due to a TOD bug I reported years ago that has never been fixed. Browsers don't like html text in a png.
You couldn't wholly fabricate millions of barrels going nowhere, that would be far too blatant to pull off; consider the work of the independent tracking agencies like Oil Movements, or the work the staff at IHS does analyzing supply. If the non-OECD were in fact using a handful of mb/d less it would be next to impossible to cover up.
That said, I always agreed with Laherrère that it's quite ridiculous to go into past the 1st decimal place when discussing hydrocarbons; the data is far too rough to warrant such precision. Also, even with oil hitting its absolute trough recently, I noticed you still had stories about fuel shortages around the world, in Nepal, Kenya, Uganda. You'd think with so much capacity offline there'd be some extra product to send their way. Or are these places simply too uneconomic to supply when prices crater? It's a bit of an enigma, and of course this situation persists even now.
I've thrown out the idea that declining supplies might be dealt with by shortchanging minor customers such as this, but no one ever bought this line of reasoning. Collectively such small fry don't add up to much, for one thing.
Chinese oil production on its own could be 1 mb/day less than they claim and we'd never know. Well I wouldn't anyway.
Undertow you are correct. We can track imports and exports but we cannot track internal production that is, or is not, consumed internally. Net oil exports are about 50 percent of total world production, or so we are told. How do we know? How do we track oil that is produced and consumed internally. Obviously we must take their word for it.
But we don't take Venezuela's word for it. The claim to be producing, on average, about .55 mb/d more than they actually produce. How do we know that China or anyone else is not doing the same thing.
Ron P.
Mr. Rune, thanks for your diligent work. Do you happen to have an updated graph of Global Net Exports?
Thanks again...
Hello oil digger,
Below is a chart showing development in net exports of crude oil and condensate and total petroleum products between 1990 and 2009/2010 (data series for 2010 for crude oil and condensates are presently not available from EIA).
As the chart illustrates both had a high in 2005.
Hi All,
it is very informative posting levels of production, levels of exports, levels of energy requirements, etc, thank you.
I feel that the growing use of fossil fuels by the producers / exporters of said fossil fuels is going to be more of an issue as time goes by. that is the trend to watch. it will dictate how much fossil fuel will be left for the rest of the world to use.
no matter how we slice it all, we are living at the end of the petroleum age. get ready for living in a post industrial civilization. It's going to be bad. I recon we have 20 years left
Oil Megaprojects database says the globe has added almost 15MBD new barrels of production in the past 3 years, 2008 - 2010. That is almost 2 Saudi Arabias, and the fastest 3 year increase in production in history. A Wall of Oil hit us.
And yet global production is about flat - in the low 70s MBD as it has been for 7 years since mid 2004.
From Oil Megaprojects:
2003 - 2004 new oil production fell by 13%. prices were up 70% within two years.
2006-2007 new oil production fell by 23%. prices were up 57% within 2 years
2010 - 2011 Oil production will fall by 35% and in the 2 years 2010 - 2012, oil production will fall by 48%....and never recover. These will be the biggest drops in production we have seen in the past decade or more
So the question is - what will that mean for prices?
According to their website, the summary data and graphs were last updated in 2010!
1) Why isn't this data being refreshed?
2) How do we know that 2012 estimates have been updated since 2010?
No, you are simply reading it wrong. The program that gathers the data was last updated in 2010.
The actual data is updated every few weeks. Just check the bottom of the page.
Ron P.
The notion that Peak Oil has occurred or is upon us seems to be the consensus on this site. Is this the current scientific consensus? Is it like Global Warming where the scientific consensus is clear but it isn't embraced by the average American? Thanks!
dt - There's no "scientific consensus" per se because it isn't "science" IMHO. PO is an observational matter. Just plot global oil production and...Shazam!... you see PO. Maybe 50 years from now we'll know exactly what month PO happened. The debates on TOD have to do with projecting what can't be proven except looking back over history. PO for the US is not a theory: it's a black and white chart about which there is no debate. PO hit us in the 70's and even the most outlandish cornucopian doesn't predict a return to those rates.
And if you note there is a growing opinion that the exact date of PO isn't very important. Many, including myself, beleive "Peak Plateau" is a more important consideration. PP is that period (a few years to maybe a dozen or more) when max global oil production bounces up and down over a relatively small range. So maybe looking back far down the road PO happened in 2005...or 2011...or 2015. Doesn't make much difference. The problem is the instability of the global economy as we bounce along PP when even relatively minor disruptions, like Libya or a GOM hurricane, have a significant impact. During PP political factors could easily overwhelm geology and reservoir engineering.
The thing is, Peak Oil is only a subset of a much larger problem which most people won't acknowledge: our exponential growth is about to run into a brick wall. Limits To Growth, which dates back to '72, remains the best reference on the issue IMO. It's a bit embarrassing really. But for a 40 year-old text, it is eerily accurate in its prediction of how things are unfolding now.
So, scientific consensus? Hard to say... who would you define as the scientific community on the subject? The geologists working for oil companies? They can hardly express themselves in any meaningful way, whatever their ideas on the matter. Except for the few which do here. You can certainly hear a lot of crap that there is "no imminent peak" from a lot of places but that is more PR than science so it can't be used to claim there is no scientific consensus either.