| ASPO Conference 27-29 April Brussels, Belgium | The Oil Drum | Tech Talk - Lower second tier oil producers - Norway, Brazil, Iraq and Algeria |
World Oil Supplies as Reported in EIA’s most recent International Energy Statistics
Posted by Rune Likvern on February 25, 2011 - 2:17am
DISCLAIMER: The author holds no positions in the oil/energy market that may be affected by the content of this post.
My post is mainly an update to Global Oil Supplies as Reported by EIA's International Petroleum Monthly (IPM) for November 2010, based on data which the EIA reported in the past few weeks in their final edition of IPM and in their International Energy Statistics. I will also briefly present updated information regarding OECD and Non OECD oil supplies/consumption.
The recent EIA data shows growth in world supplies and growth in OECD consumption and net imports while Non OECD supplies/demand have temporarily flattened.
NOTE: Scaling varies from chart to chart and some charts are not zero scaled. Labels indicate whether graphs are on an "all liquids" or "crude and condensate" basis.
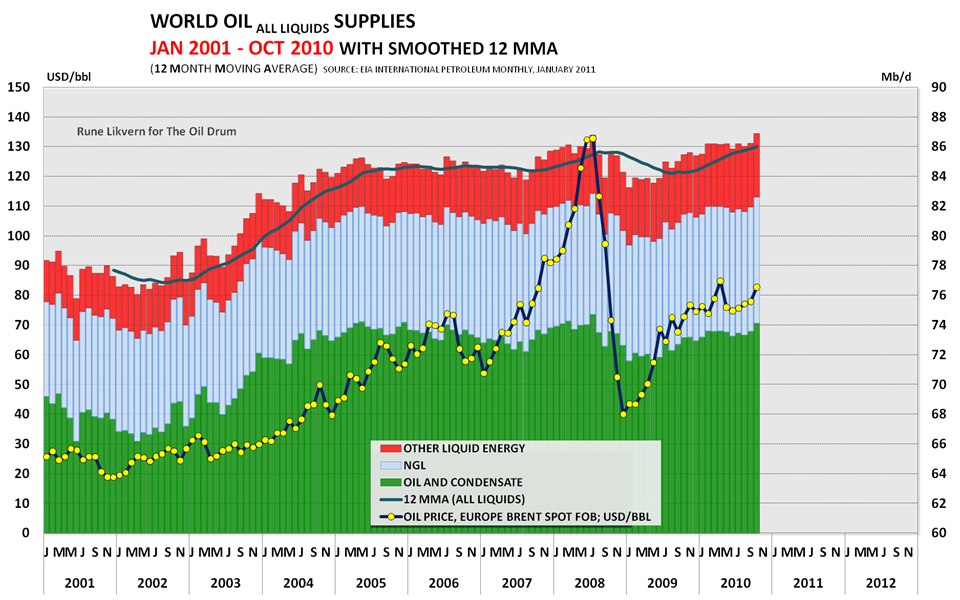
Figure 01: The stacked columns in the diagram above show development in global supplies of crude oil and condensate, NGL and other liquid energy from January 2001 through October 2010. The development in the average monthly oil price is plotted on the left hand y-axis. NOTE: Diagrams based upon EIA data may be subject to future revisions.
In the recent months growth in crude oil and condensates supplies has come from Russia and Rest Of World (ROW). The conclusion of the maintenance season in the North Sea has been a contributing factor to this.
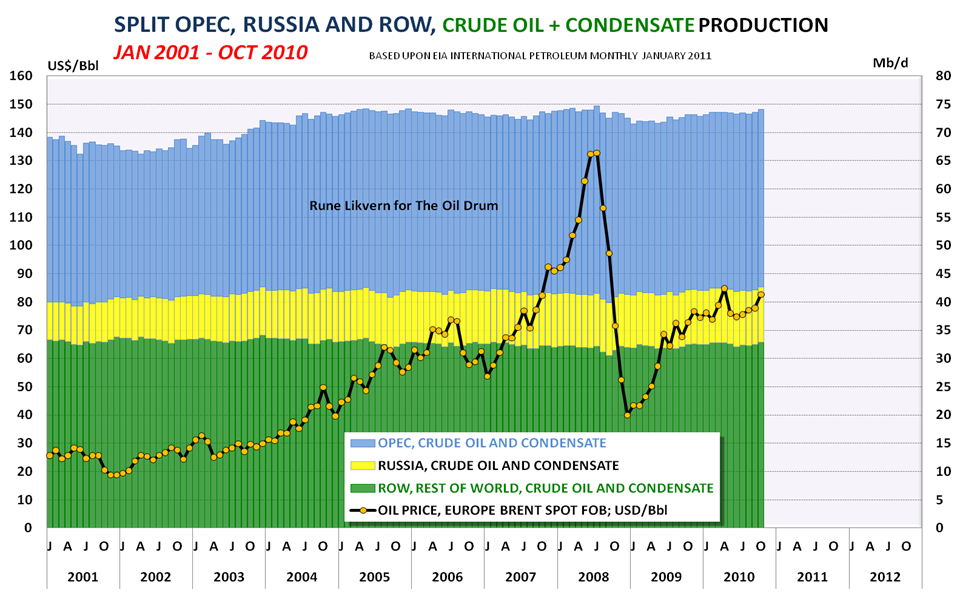
Figure 02: The stacked columns shows crude oil and condensates supplies split among OPEC, Russia and ROW (Rest Of World; which also includes OECD), from January 2001 and as of October 2010. The development in the average monthly oil price is plotted on the left hand y-axis.
The long bumpy plateau from late 2004 to the present illustrates that huge swings in the oil price in recent years have had only a small impact on crude oil and condensate supplies.
EIA in their Short Term Energy Outlook (STEO) for February 2011 has projected a decline of 0,4 Mb/d in OECD and flat Russian petroleum supplies from 2010 to 2011. Under most circumstances, it could be expected that most of these declines would be offset by growth in OPEC supplies.
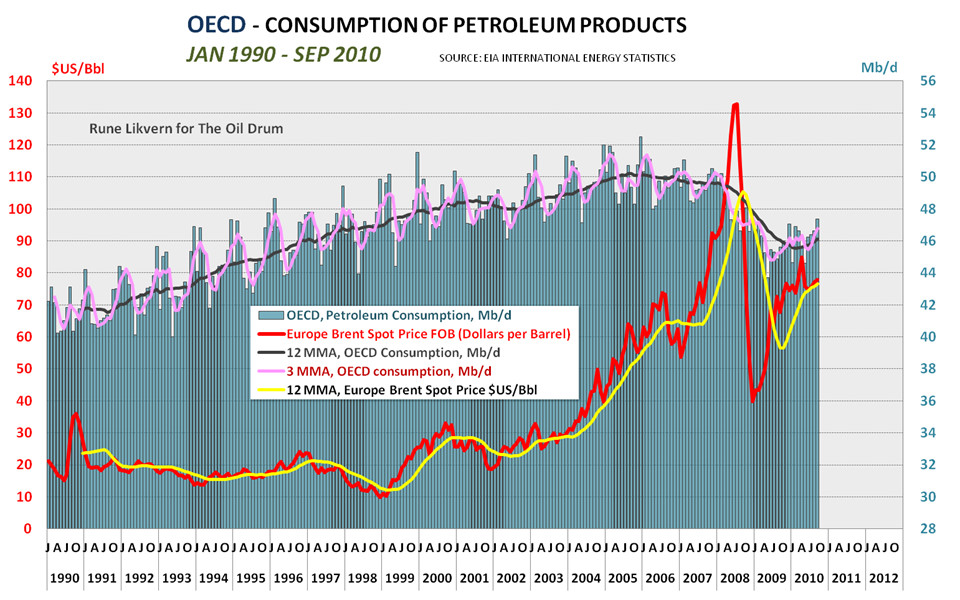
Figure 03: The diagram above shows development in OECD consumption of petroleum products between January 1990 and September 2010 together with the development in the oil price.
In the recent months, petroleum consumption and net imports (ref figure 05) within OECD has seen some growth and this coincides with the growth in the oil price.
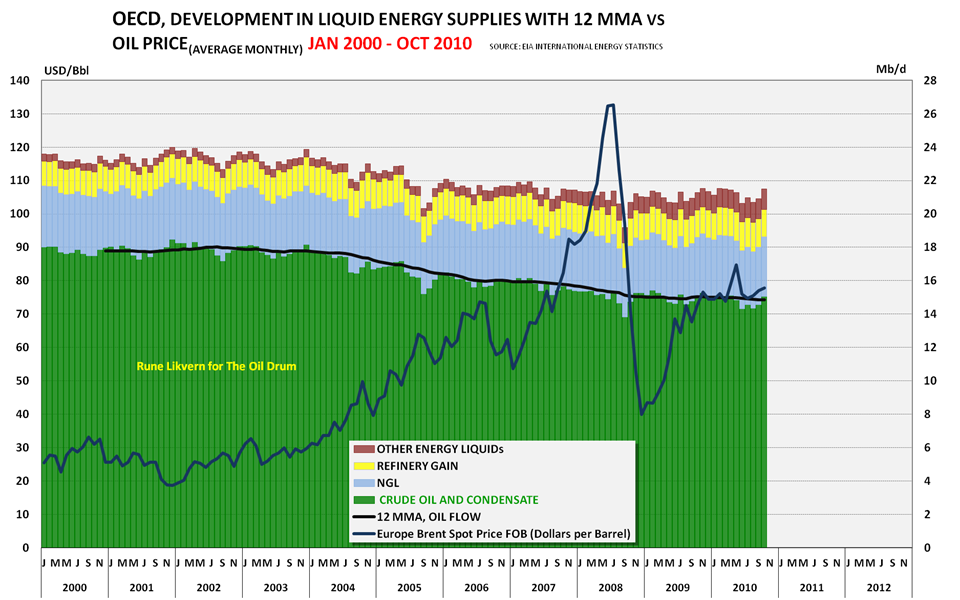
Figure 04: The diagram shows development OECD supplies of energy in liquid state split on classes from January 2000 through October 2010.
The diagram above shows that supplies of crude oil and condensates within OECD has declined with around 3 Mb/d since 2004 and that some of this decline has been offset by growth of other liquid energy like ethanol and biodiesel.
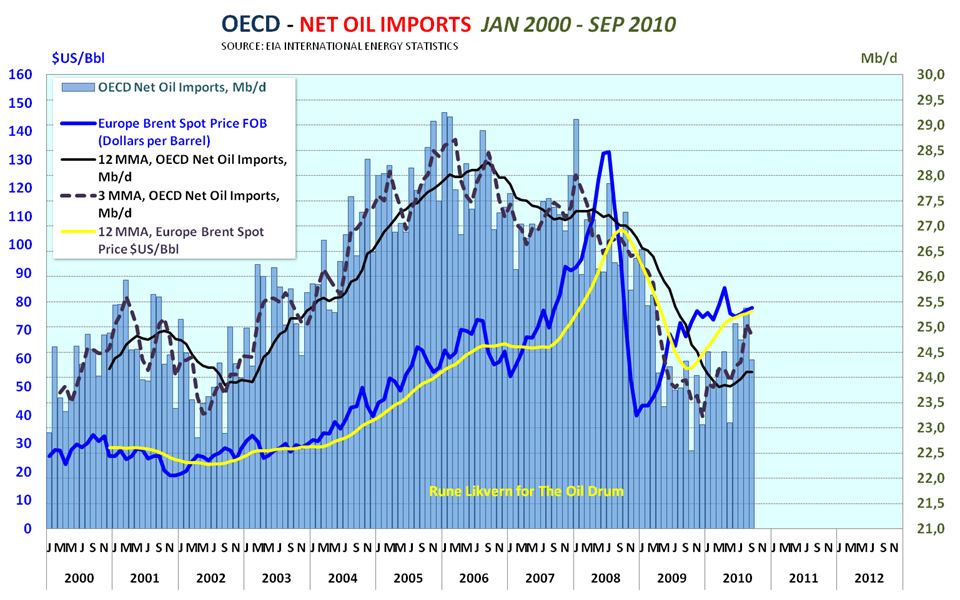
Figure 05: The diagram shows development in net oil imports for OECD from January 2000 through September 2010.
This diagram shows that the recent oil price growth happened as OECD again started increasing oil imports. This is one of the indicators suggesting that the oil price now has support based on fundamentals.
Going forward a decline in OECD supplies and growing OECD consumption will result in a need to grow net imports for OECD and it may prove challenging to reach the net import levels seen in 2005.
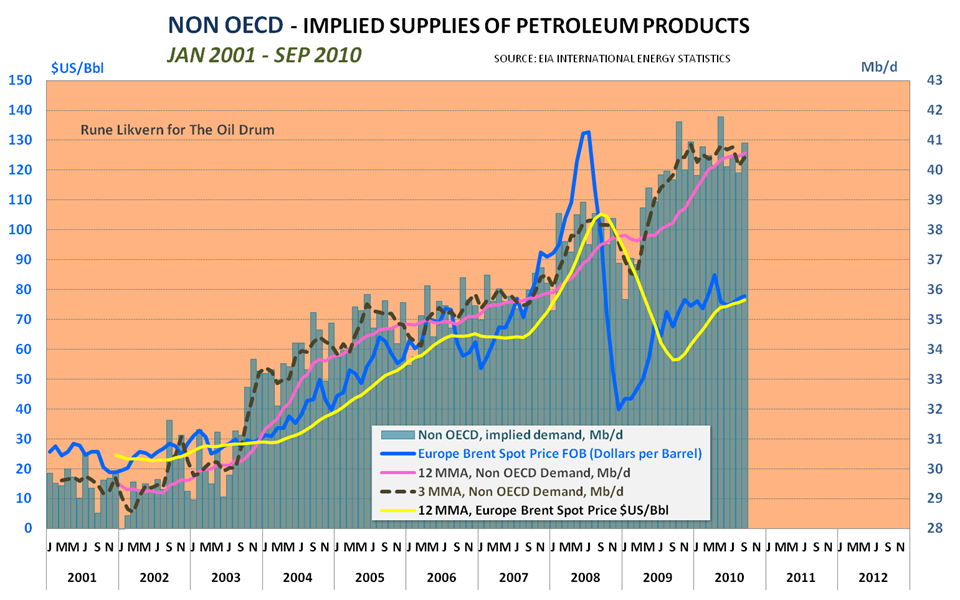
Figure 06: The above diagram shows implied demand for liquid energy from Non OECD countries from January 2001 through September 2010. (I describe it as implied demand as the diagram shows the difference between total global supplies of liquid energy and OECD supplies (production + net imports)).
Recently, demand for petroleum products from Non OECD seems to have levelled out as illustrated by the 3 MMA (3 Month Moving Average). (I use the 3MMA both to more easily identify seasonal variations and also to act as a “pilot” for trends over several months.)
What may be observed from the diagram is that as the oil price (Brent spot) moved north of $70/Bbl it seemed like demand/consumption from Non OECD flattened. Many reports have pointed to continued growth in Chinese oil imports and consumption which may suggest that some economies may have cut down on their demand/consumption as a response to the price growth.

Figure 07: The stacked columns show the split between OECD and Non OECD supplies of liquid energy from January 2001 through September 2010. The average monthly oil price is also plotted on the left hand y-axis.
As OECD production continues to decline, a growing need for imports into OECD (ref figure 04 and 05 in this post) is expected to add upward pressure to the oil price. Oil imports into OECD will normally tend to be higher during the heating season (winter in the Northern Hemisphere) and this suggests an upward pressure to the oil price during the winter months.
With the approach of spring and warmer weather together with expected maintenance at refineries it should be expected that OECD demand/consumption abates some and thus takes some pressure off the oil price in the weeks ahead. However, the geopolitical factor may change that.
Within a few weeks, I hope to post here on TOD an in-depth analysis which found it would take an average annual oil price of $100 - 105/Bbl (Brent spot) before U.S. GDP exclusive of energy expenditures showed no growth, given current data for the U.S. economy and energy consumption for 2010. Energy expenditures are costs for petroleum products, plus energy resources for non energy use (asphalt, coke, petrochemical feedstock etc.), natural gas and electricity).
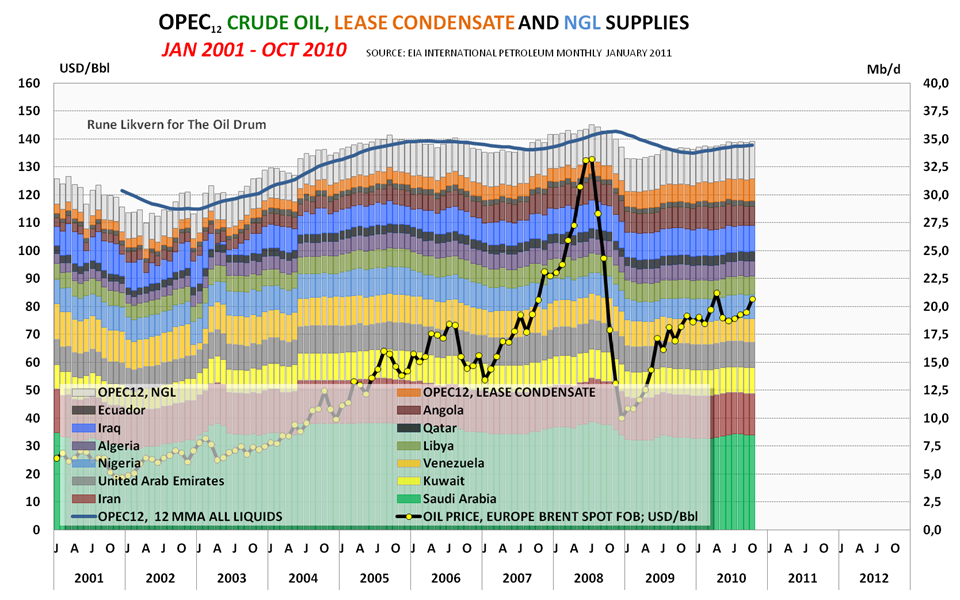
Figure 08: The stacked columns show each OPEC member’s crude oil supplies and OPEC’s supplies of lease condensates and NGL from January 2001 through October 2010. The average monthly oil price is also plotted on the left hand y-axis.
The recent data from EIA shows stagnant supplies of crude oil and some growth in supplies of condensates and NGL from OPEC. (Lease condensates and NGL are presently not part of OPEC's quota arrangements.)
To me, the recent growth in the oil price (adjusted for fluctuations in the value of the US Dollar) is a signal calling upon increased crude oil deliveries from OPEC.
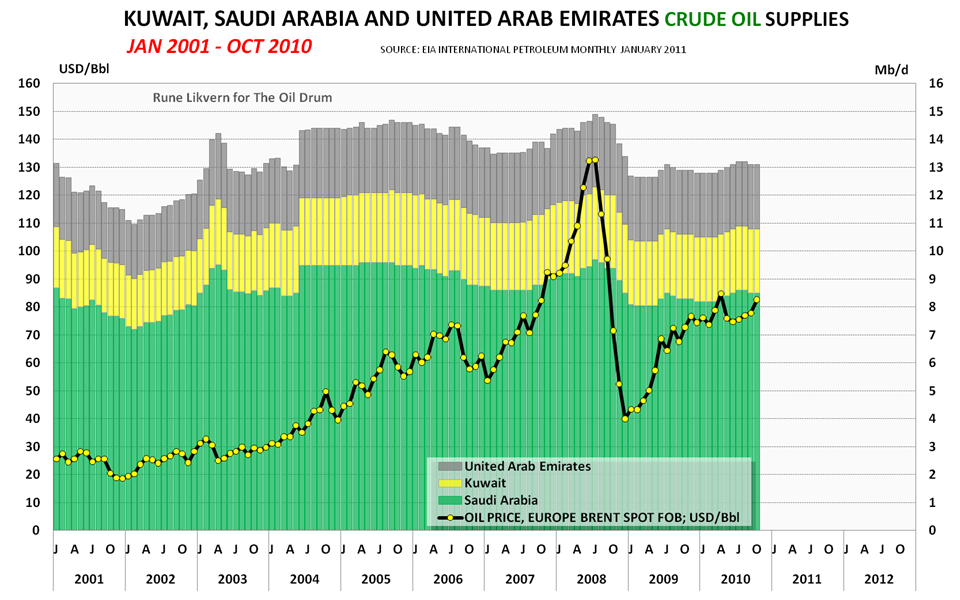
Figure 09: The diagram above shows crude oil supplies from January 2001 through October 2010 for Kuwait, Saudi Arabia and United Arab Emirates.
I believe most of present global spare marketable crude oil capacity is to be found amongst the 3 exporters presented above.

Figure 10: The stacked columns shows development in crude oil supplies from the 9 other OPEC members. The average monthly oil price is plotted on the left hand y-axis.
Total crude oil supply from the 9 OPEC members above have remained relatively high and flat during the recent months, suggesting that these countries are pumping at high levels, regardless of price.

Figure 11: The graph above shows development in crude oil supply from Angola. The average monthly oil price is plotted on the left hand y-axis.
Crude oil supply from Angola has declined in recent months and this may be in response to harmonize deliveries according to Angola’s OPEC quotas.
In summary, January's International Petroleum Monthly supports a continuation of the trends I had noted in my earlier post. In other words, world economies are still growing, putting more pressures on oil prices. By the end of 2011, my earlier analysis showed that the OPEC spare supply margin may be depleted. The next few months may become interesting ones!
SOURCES:
[1] EIA, INTERNATIONAL PETROLEUM MONTHLY, JANUARY 2011
[2] EIA, INTERNATIONAL ENERGY STATISTICS
[3] EIA, SHORT TERM ENERGY OUTLOOK, FEBRUARY 2011
World Oil Supplies as Reported in EIA’s most recent International Energy Statistics
PDF version
164 comments
World Oil Supplies as Reported in EIA’s most recent International Energy Statistics
PDF version
164 comments
Contact
- Content: editors at theoildrum dot com
- Tech support: support at theoildrum dot com
License

This work is licensed under a Creative Commons Attribution-Share Alike 3.0 United States License.
EIA November figures out
http://www.eia.gov/cfapps/ipdbproject/IEDIndex3.cfm?tid=50&pid=53&aid=1
We can now put to bed the idea that 2008 was the peak year for total liquids.
I expect oil and condensate to break the 2008 high in next few months, if not already.
Yep, I'm sure all that extra production from Libya will boost the figures. Flooding the export market and bringing the price crashing down.
Doom
We all know things are a little more complex than this, my take is Saudi etc are holding on to their spare capacity (whatever that is) as they know that if they pump enough to keep oil prices below $100 it would be gone in 1 to 3 years.
So they need high prices to curb demand and hopefully bring on expensive oil quicker, Canada sands and Brazil presalt.
Oil prices will be high even if global oil production grows a little over next couple of years.
Chimerica is no longer the global pivot, China is dealing more and more with countries that produce the oil, gas, coal, copper, etc. They are paying for it in finished goods and finance.
Too many people are missing this point.
jaz don't listen to them. The next stage is anger, and judging by your misguided and uninformed opinion we don't want to see you angry!
Once you reach the ZEN state of acceptance then only will you truly feel at peace my son.
.........makes the sign of nodding donkey on chest and looks skyward.
Marco.
By misguided and uninformed, I assume that you are criticizing jazz for looking at all liquids. Obviously the creative accounting of what constitutes oil liquids can create new peaks. The crude component is still about 4% below peak.
All liquids, CHimerica not being pivotal (WTF??), considering peak oil noise as significant - take your pick. If I was, in 20 years time to dump a big gaussing curve over oil production and/or peak liquids i'll get a good statistical pinpiont on the exaxt date of the peak but at +/- 5 years it's wholly irellevant in the grand scheme of things. Liquids - well see down thread hes getting that now.
Marco.
US GDP fell from +3 to -8 from 2007 to 2008
http://www.bea.gov/newsreleases/national/gdp/gdp_glance.htm
China on the other hand did not fall below +6, much of the reason is due to expanding trade with other countries. Perhaps you need to do some reading up. If you read my other posts down thread, there is something I said, which if you stopped to think, you would realize I have taken Peak Oil very seriously for some time, found it yet?
EH? But the GDP per capita USA is WAY higher than that of China. Just becasue USA consumption decreased a bit and China increased a bit it doesn't even up the score. This isn't even taking into account hedgemony, trade imbalance, dollar reserve, etc....You can't compartmentalise your preferred statisctic like that!
I'm glad to hear it! Then what was the purpose of your opening statement?
The purpose of my opening statement is to try and get people to stop saying oil peaked in 2008. People who do not believe in peak oil jump on the figures and rightly say. Oil production is going up again, peak oil is rubbish.
So I explain to people that globally we loose about 4 million barrels of daily production every year and this is increasing. Also China are driving demand up beyond what world can meet, that is causing the increase in prices.
I also tell people that 8 countries have gone into production decline in the last decade, so as this trend continues total production will start to fall. But i no longer say oil peaked in 2008.
Chimerica is the term used for the trade relationship between China and America and the idea if America goes into recession then China will to same degree.
This is changing rapidly, as China increases trade with other countries, it becomes more insulated from what happens in America.
China overtook US as first trading partner with Venezuela last year, it' trade with Iraq has increased to $30 billion from $7 billion in 9 years. When you add up all these countries and trade volumes you get a picture of a country that is more insulated from a US, European recession than alot of people thought.
Also they are buying oil companies, so the oil is theirs to use or sell, which puts them in an even better position than 5 years ago.
web
July 2008 is 74,685,967 and Nov 2010 is 74,255,729 is that 4%
You picked a pair of cherries to compare.
Why not compare the yearly average instead of pushing statistically insignificant points?
Seriously, the problem with all this quibbling is that statistically, things fluctuate. Like the daily temperature. So use a little more common sense and compare the average temperature or the average daily oil output over a year before you jump up and down.
Graduate students do this all the time and say they found an empirical effect. I say repeat the experiment to determine if it is statistically significant.
I think you get the idea.
Oct
How many times have you heard on this site, that peak production occured July 2008, did you point out then that these people were using insignificant data.
If we want people to take Peak Oil seriously we need to be totally honest with facts and not just dismiss facts when they prove us wrong.(when I say us, I mean you lot ofcourse) :-)
Would you like a little wager that 2010 average will beat 2005 and 2008 average?
Chance to put your money where your mouth is.
The facts are barely relevant when it comes to influencing people. We've seen this shown numerous times on these pages, and elsewhere, over the years, so quibbling about them amongst ourselves is the real detriment. Besides WHT is right to focus on the yearly average. Trends are always more useful than individual data points for ongoing, long-term changes.
What we need to do is get them to understand that PO is not about a date, but a trend in declining energy. More important than barrels of oil, when you get down to it, is net per capita energy, and that peaked a loooong time ago.
For now, let's try not to quibble over a distinction without a difference: the bumps in the plateau are irrelevant. Let's work to keep as many of us on message about overall energy topping out, if you please. I mean, how long can a plateau at much higher prices be ignored?
That is the undeniable reality: 6 years of higher and higher prices with no significant rise in production IS the story. After all, everyone knows price brings more product, right? This very simply demonstrates Peak Oil. So get on message: 6 years of rising prices with no rise in output.
I'm not sure that makes much difference. Surely it doesn't matter if China pays for it's oil in purple-pigs, if Saudi feel their oil is fairly priced, they'll sell it. Better to get that money in now whilst you still have capacity than wait for the declines to set in and find you have no spare, and oil has dropped back to £60 in the next recession.
My take on it is that Saudi are desperately hoping for someone to come along and ease their burden. I just don't see where the cavalry will be riding to their rescue from. Brazil are several years away from getting the presalt to market, Canada needs a new pipeline to help get their oil over to China, again several years away. Russia have ran out of new projects coming on line. Production in almost every country is dropping and the current ME tensions are not going to help bring the numbers up.
If there is an over-supply of oil to the markets, then the price will drop. The producing nations are more than happy to undercut each other to make the deal if they have oil that they can't find a buyer for. For the price of oil to stay high, there can be no-one able to undercut the competition.
How many barrels of oil do you get for a purple pig?
Actually there are about 20 countries increasing production over last year.
The main cavalry, could be public transport, I know several people who use it and come to no harm.
Infact two friends who got rid of their cars, say they have more money for restaurants, hobbies etc.
So it does not all have to be bad.
According to the AAA (American Automobile Association) a car costs on
average $8,800 per year for maintenance, insurance etc.
Yes and I do feel sorry for people who live in areas with no public transport, knowing what is coming I made sure we bought a house within 5 minute walk of train station. We also have local shops, post office and most important a Pub. :-)
In the upcoming era of constrained oil supplies, it will be important to have all the important services within walking distance, particularly the pub. Without being able to get to a pub, an oil crisis could turn into a disaster. If you can make it to a pub, it won't seem that bad.
It just suddenly occurred to me that that it might be a real disaster for most Americans, as if it isn't already. I'm living in Canada and I've got about 6 pubs within walking distance so I'm okay. Downright cheerful, in fact.
Ah but do they sell real beer
http://www.theakstons.co.uk/ales/classics/oldpeculier.html
Now that is one I would call real beer and real beer is the one thing I do miss over here. Beer will be one thing that gets a shakeup if transport crashes, maybe there will be a return to local brews.
NAOM
Peak Beer is covered Here
But there is only so much doomer porn I can handle.
I know that you all have a lot vested in the Oil thingy, but here is a Cognitive Dissonant moment of your own.
Only 0.4 grams of hydrogen were harmed in the exercise.
Ah but do they sell real beer?
Some of them do. My wife knows the brewmaster (or is it brewmistress?) at one of the pubs, and she gave us 4 dozen short-fills recently. These were bottles she had accidentally underfilled, and they couldn't sell them, so they gave them to us. There were no labels on them, so it was a surprise in every bottle, and they wanted the bottles back quickly, so we had to drink them faster than we wanted to, but somehow we managed.
There's no real chance of a local beer shortage around here - unless they figured out some way to convert it to fuel alcohol. That would be a crime against nature. Better people should walk to the pub.
So do I. (6 pubs that is). But, they will have to sell local microbrews or moonshine.
So do I. (6 pubs that is). But, they will have to sell local microbrews or moonshine.
Well, in addition to knowing the brewmaster at one of the local microbreweries (and getting the occasional case of free beer), we have a friend with a still in his basement.
We picked a bucket of juniper berries last fall to flavor his homemade gin, and in return he gave us a gallon of his best product. He also has about 50 gallons of homemade wine on the go. We let him use our mountain chalet for ski weekends, and in return he leaves a few bottles of his best in the wine rack when he lives.
I think we're covered, except for the fact he might not be able to get out here to the mountains with his van load of booze if a fuel crisis hits.
This week, I've got his full-size van sitting in my driveway, and he's driving my little Toyota because he can't afford to take his van on a 12-hour drive for a ski week several mountain ranges over.
Public transit is definitely the best way to save oil quickly as well as
greenhouse emissions. Unfortunately in the US over 150 cities have had
public transit cuts and fare hikes:
http://t4america.org/resources/transitfundingcrisis/
The new crop of Hoover Republicans have been cutting high speed rail, public transit
right and left. In my own state of New Jersey Gov Christie cut the NYC tunnel
project on the drawing boards for over 50 years so he could throw the money over
to roads and a $7 Billion expansion of the New Jersey Turnpike and Garden State Parkway.
This is where the plea for personal changes to save greenhouse emissions or oil falls short - if there is no public transit available then there is no "choice" to use it.
Interestingly on the positive side to note a NY Times article pointing out
that housing and real estate next to transit either retained or increased its
value in the NYC Metro area while other real estate prices fell.
In Uk house prices close to stations on newly electrified line went more than average and did not fall as much after 2008.
People here are already calling for reduced tax on petrol, if that happens the govenment will have to cut back somewhere else.
And in Calgary, the energy capital of Canada, construction of the West Line of the wind-powered Light Rail Transit system continues to be on schedule for completion in 2012.
People on the South, Northeast and Northwest lines continue to ride in large numbers (the Calgary LRT system has more ridership than any other LRT system in Canada or the US). People in other parts of the city which don't already have LRT (i.e. Southeast and North Central) agitate for their part of the system to be built.
This, of course, will free up much more oil which can be sold to Americans who don't have access to public transit. Prices of West Texas Intermediate, the US national oil benchmark, continue to be depressed below international prices by the influx of surplus Canadian oil freed up by Canadians riding electric trains.
Canada has two to three times as much transit ridership per capita as the US.
US has a poster city for transit. Boulder, Colorado. The problem is that it is not very big and inhabited by (sorry, just to lump everybody together) alternative types and scientists, who are prime transit users everywhere.
They also have a massive daily influx of workers by car, both at the bottom end (the $14/hr Target cashier's and McD's workers can't afford to live there) and the professional (the $65/hr engineers and scientists have a hard time affording the lifestyle, and don't want to ride the bus). Plenty of trust-fund money from the kids at CU Boulder too.
It does do very well with bicycles, walking, and transit for locals, and to/from nearby towns. Highway 36 is still pretty busy though!
To me, it is to CO what Austin is to TX and California is to the US, or Switzerland to the world -- a high-priced example of great lifestyle supported largely by those they look down upon, all-inclusive and open but somehow still 99% wealthy white people. Great place to visit. Beautiful place to work in. Expensive place to live. Well-meaning but hypocritical.
Interesting description. I was only there once-road a BSA in from Lake Michigan. This was back in the very early 70's. There just was a strange artificial feel to the place I couldn't get a handle on.
Then one evening after I'd been in town a few days I smelled something that was pungent but somehow refreshing. I couldn't quite get a fix on what it was but it lingered for a long time. I finally realized a skunk must have sprayed a cat or dog and that smell was the 'breath of fresh air' reconnected me to the planet in Boulder. Hadn't thought of that in years ?- )
I was looking at the numbers and Calgary's light rail ridership is impressive, bit over a quarter million people on weekdays. Some the US city's with old heavy electric rail commuter have far higher ridership like Chicago with its 650,000 weekdays just on the "L" but then Chicago proper is nearly three times the size of Calgary.
The Chicago metro area is closer to eight times Calgary's but the "L" only extends a mile two into the near suburbs on a few lines. I was lucky enough to grow up in a near west suburb within walking access to two lines. They were great for work commutes, downtown shopping trips, jaunts to Wrigley Field and stag trips to rock concerts, but dates were nearly always done with personal wheels
What advantages/disadvantage when comparing electric light and electric heavy rail? Back when I was a young kid the streetcars still roamed Chicago but they were replaced by electric buses which were a bit more versatile. I guess even those went away back in '73-about the time I moved away.
Light rail can be built considerably cheaper than heavy rail, if a city avoids the urge to gold-plate the system. The main reason is that you can build most of it at grade rather than putting in expensive subway or elevated lines.
In Calgary they avoided the cost of building a downtown subway by just converting one narrow downtown street to a transit mall and running LRT tracks down the middle, mixed with buses. This is currently carrying about the same number of commuters as a 16-lane freeway, without anybody really being aware of it. The trains are extremely quiet and the biggest problem is hitting jaywalkers who don't hear them coming. And hitting Brits and Aussies who look right instead of left before jumping off the platforms onto the street.
There is actually an underground station and a short section of subway under Calgary's downtown. They bricked it off and mothballed it because they discovered they could move far more people on the surface than they ever expected. There are plans for a future subway line, but a quarter of a million passengers per day hasn't made it necessary yet.
Other than that, they ran the tracks down railway rights-of-way next to freight rail lines, and put tracks into the medians of freeways. There are very few underground or overhead sections, mostly to go over or under major roadways and rivers.
The key to its success has been track, track, track. They built as much track as they could, as cheaply as they could, as far into the suburbs in all directions as they could afford to do. The inner-city part is the expensive part, and once you're out of the core it becomes really easy to extend if you allowed enough space in the freeway medians. Once you've got it far, far into the suburbs, commuters begin to notice that the train is much cheaper and somewhat quicker than driving.
Once you've got it far, far into the suburbs, commuters begin to notice that the train is much cheaper and somewhat quicker than driving.
Yes that is most important. The Congress "L" was actually running down the median into and out of the loop before the freeway was completed. I was entralled by all the heavy equipment and mud lining both sides of the tracks in the big freeway trench way back in the mid 50s. Alas the freeway kept crawling west, while the "L" dead ended.
The big difference that says it all, proportionally, development history wise and more is: Chicago proper pop is just under 3 million but the metro area is almost 10 million. Calgary proper is right around 1 million but the metro area is only about 1.25 million.
Scraping 8 feet of topsoil to clay and replanting that first rate agricultural land--20, 30, 40...miles in every direction except onto the lake--with suburban sprawl was just WRONG.
Calgary does have the advantage that most of its suburbs are internal suburbs rather than external suburbs. It does sprawl, but it has control over how that sprawl happens. The new mayor is trying to get the sprawl under control, although the developers are as usual upset that someone is telling them they have to plan rationally.
Calgary started planning its LRT system when it only had had 500,000 people, and its plan was to leave an ROW for the LRT in the freeways wherever they needed to go, outward in all directions. Now that the city has doubled in size, it can extend the LRT outward by just dropping a couple of tracks into the existing ROW and adding a new station at the end of the line.
It also managed to screw up the freeway system so it doesn't really work. I don't think that was deliberate, I think it was incompetence in the transportation planning department, but it is an advantage for the LRT. People get fed up with the roads and take the train.
Unlike Chicago, Calgary is mostly shortgrass prairie with about 3 inches of topsoil on top of gravel or impermeable clay, mostly suitable for grazing horses. You don't feel that badly when they scrape it up and you see what's underneath. You think, "no WONDER I can't get plants to grow in my yard!"
+1 for the C-Train. Ride it every day in the winter, bike in the summer/fall. Spring is a mix, depending how muddy I feel like getting.
Once the west leg is done, likely won't be driving much of anywhere.
Doom - I agree in general with your sentiment but I'll add a little different opinion: Bz will make no difference in the game at all "in several years". IMHO it will take a decade before any significant production is exported from Bz. And perhaps another decade to reach max flow rate. And even then it may never rival the output of the KSA at it's peak. If the KSA is really looking for a white night in Bz I suspect they'll be veryy disappointed.One giant DW BZ field might bring 400,000 bopd to the market over night...when it's fully developed. And that typically takes 4 to 7 years. But even such a huge addition adds less than 1% to daily global production. Bring 10 such fields online in 12 months (a very unreasonable expectaion IMHO) and now you have a new 4 million bopd brought to a global oil patch that producting over 100 million bopd. That would certainly be a great turn of events for the oil consumers but you're still only looking at a 4% gain.
No arguments with any of that Rock. I think that by the time even one giant DW well is producing at anything like a production rate, the world decline will have gobbled it all up and more besides.
And that's hoping that they don't have another Thunder Horse.
From here on I can't see anything but a decline of varying gradients, regardless of how we pay for the oil.
Yesterday, at 8:35 in the CNBC SQUAWK BOX segment it was shown that the U.S. has by far the largest oil reserves in the world with 800Bb followed by Saudi Arabia with 280Bb and Canada with 220Bb.
Congratulation USA you did it again to be the greatest.
Well there are reserves and then there are resources, I don't know we should be calling stuff like Green River oil shale formation reserves, which is probably what CNBC was doing. That said, I'm guessing the
US will remain undisputed number one, possibly for all time, in one of the two most important oil categories--country that has used the most oil.
On another news media front--one that can actually be informative in some realms from time to time:
I happened to tune in to Charlie Rose the other night and Libya was the hot topic, about 3 segments in Charles Maxwell was the guest. He pointed up how just a bit more of a domino effect ih the mideast could really put a crimp in oil supplies, thus bringing on recession. Charlie Rose looked liked he'd been raised from a stupor with a pitcher of cold water right then. It was a revelation to him that a sudden high oil price shocks cold shrink the economy. I've always wondered why he never deals with the energy issue--apparently he has been oblivious to it.
Political expediency. Bureaucrats can shift this definition around to suit their needs.
Charlie Rose lives in a wonderland of people who have enough money and influence that they dont need to recognize the energy underlying their activities.
More so than most OECD nationals anyway.
To them, it's some sort of intellectual issue. Like a hard puzzle. It's not reality.
As usual, the MSM is thoroughly confused about what "oil shale" is. It is a complete misnomer. It is not oil at all, it is a waxy oil precursor called kerogen which is trapped, not in shale, but in marlstone.
Oil shale
Unfortunately, the MSM doesn't have a clue what that what that means, so they confuse it with crude oil. They also don't realize that you can't call them "reserves" because they cannot be produced at this point in time. You have to call them resources, and in particular they are unconventional resources
US oil shales are more difficult and more expensive to produce than the unconventional resources in other countries, so producing them will be a major technological and capital intensive exercise, much like landing a man on the moon.
The technology hasn't been developed yet, and governments and oil companies, don't seem to be interested in providing the capital, so don't expect "oil shale" to be coming to your local gas station any time soon.
What about Iraq as the calvary?
http://www.theoildrum.com/node/6101
Probably quite optimistic that number (12mbd) but even if they could do a fraction (50%) of that....
'jaz' takes one of most pessimistic views I've ever heard on Saudi oil supplies, when he states that oil prices below $100/bbl mean that Saudi oil is gone in 1 to 3 years! Actually, I don't think that even Texas oil will be gone quite that soon, regardless of oil prices. Perhaps the northern-most areas of the huge Ghawar field may be all but depleted within a few more years time. But, the southern-most area of Ghawar (Haradh III) just went to full-scale production within the last 5 years. While a fairly new giant field in Saudi Arabia, Shayba did not even start producing oil until 1999. The Khurais field, after many years of additional field engineering, finally started producing at full potential (1.2 million bbl/day) only last year (2010). These newer Saudi fields are not even close to being depleted, and each of them could easily have 20+ years of production remaining.
Also, I'm finding it hard to believe that China is switching to what sounds like a barter economy in international trade. The Chinese are certainly trying very hard to sign up oil and gas supplies for the future from whoever will be exporting same. But they will not be paying for this energy with DVD Players, etc - mainly because cash is so much more flexible. And the statement "countries that produce the oil,..." should really read "countries that export" because while the USA still produces several million barrels of crude oil every day, it's all needed at home, and little (if any) of it can be exported.
As Marco said, jaz is all over the map. He thinks oil in SA may be gone in 1 to 3 years unless they put the skids on production, yet he also thinks the peak may not be here yet.
Those two statements are mutually exclusive. The only way to reconcile the views is if SA accelerates its production levels. So according to jaz, global production will rise rapidly in the next 3 years until it falls (?) due to SA running out (?)
But then again what does it matter what he says?
Web you and Marco have the same father
josserand
That would have been the most pessimistic view.........but I never said it.
I stick to my analysis which is OPEC SPARE CAPACITY will be gone in 1 to 3 years.
Peak oil will be between 2012 and 2017.
Peak liquids 2013 to 2020.
Iraq is the source of the doubt, as heading out explains in his post.
Oil prices will continue to fluctuate, seeing higher highes and higher lows as more people buy more economical cars and ones who can use public transport more.
Average production 2010 will almost certainly be higher than 2008 and 2005 on both counts.
OK, so you are grossly hedging your bets in all this.
Just don't ask me for predictions again if you cannot do it yourself...
several times I asked you for your predictions and instead of replying you appeared to take it as some sort of challenge to your integrity. I explained to you I could not find them. I think you need some emotional help.
At least I do not keep saying 2008 is the peak when it clearly is not.
I agree. I consider 2005 to be, so far, the (C+C) annual peak.
The problem with even BP's total petroleum liquids calculation is that a significant portion of NGL's come from natural gas reservoirs, and this is of course even true for a lot of condensate production, but C+C is our best approximation for global crude oil production.
I suspect that the final 2010 average annual C+C number will be, like 2008, basically within the margin of error, ending up at about the same annual rate as 2005. And of course then we have the inevitable revisions, generally downward.
But the bottom line is that despite a strong price signal, C+C production, inclusive of a slowly growing unconventional component, stopped growing in 2005--and in fact we have seen a cumulative shortfall between what the world would have produced at the 2005 annual rate and what was actually produced through 2010.
I think that we are seeing a race between conventional C+C production, which, IMO, has clearly peaked, and slowly increasing unconventional production, and so far unconventional production has not been sufficient to keep global C+C production increasing beyond the 2005 annual rate, resulting, as noted above, in a cumulative shortfall through 2010.
westexas
I respect your work and the export land model, puts global production into second place in terms of oil price.
In other words production can go up and prices at the same time.
What really annoys me is when production of total liquids is higher and I simply state the FACT people react as if I farted in a lift :-).
I think demand will be higher than production from now on, but again Iraq is the big unknown and I think C&C could be broken over next couple of years.
The 2007/8 recession has muddied the waters and made things far more difficult to read.
Anyways all the best
I hope not. Having read newsgroups and blogs for a number of years, I just recognize all the fallacious arguments that get used. You seem to depend on the "raising the bar" line of arguing and often the rhetorical question.
I won't stoop to saying you need professional help (unless you start rambling for page after page) just that I am no spring chicken when it comes to debates on the newsgroups and blogs. I think I know all the tricks of the trade.
since december 2008 (as per the above link) Lybia has been producing EXACTLY 1,789,155 bopd (+/- 0 barrels, month after month). So we can now put to bed the idea that this data means anything.
larsb
Yes I take your point, but what data do we accept? Everyone was quite happy to take EIA data when its showed declines in production in 2008 and 2009.
Jaz,
The only data I currently accept is "Availble Net Exports", Westexas' graphs. The volumes produced (and burned locally) worldwide mean nothing to the OECD, it's the volume of oil that is tradable (not locked in by Chindia) that will in the end determine where our economies are going.
I agree, Net Oil exports is far more important, but where does the initial production data come from?
For the (2005) top five net oil exporters (Saudi Arabia, Russia, Norway, Iran and the UAE, about half of global net oil exports), Sam Foucher used the BP data base. The following projections, showing low case, middle case, high case, were based on actual data through 2006. The actual 2007, 2008 and 2009 data points are circled:
For global net exports (net exporters with 100,000 bpd or more of net exports in 2005, which is more than 99% of global net exports), we principally used the BP data base, with minor input from the EIA:
As I have previously noted, a largely hidden danger is the post-2005 CNE (Cumulative Net Exports) deletion rate. Sam's most optimistic projection is that the (2005) top five will have shipped half of their post-2005 CNE by the end of 2014.
Some CNE case histories follow. Note the numbers of years to CNE "Half Life."
Incidentally, there is an interesting coincidence regarding US net imports and Chindia net imports.
If we extrapolate the 2005 to 2009 rate of decline in the US C/P ratio (100% is the dividing line between net importer and net exporter status), the US would cease (net) importing oil around 2024.
If we extrapolate the 2005 to 2009 rate of increase in Chinidia's net oil imports, as a percentage of global net exports, Chindia would hit 100% in 2025.
As they say, somethings gotta give. At the very least, it will be "interesting."
westexas
Your data 2005 to 2008 prove the point; it is quite possible for oil production to go up globally yet prices to go up also. Is BP data broadly in line with EIA and IEA?
I do not think the EIA and IEA historical data can be that bad, but there future projections do discredit them somewhat.
Note that annual oil prices have been in a long term uptrend since hitting at low of $14 in 1998.
I think that BP primarily focuses on C+C+NGL's, excluding biofuels, and probably excluding refinery gains.
10th time you've posted this isn't it? I'll buy you a beer when you reach 20. And I'll buy you a crate when you reprint this in 1,2,3,4 and 5 years time if you are even remotely right in your crazy predictions.
Wait a minute. How can the export land model be wrong? The only way to subvert it would be:
(A) WAR (US annexes oil producers land and keeps locals impoverished -- not likely)
(B) DISEASE (lowers local consumption by a die off)
Right, in that it can't be wrong; impossible that something that simple can be wrong. Like a lot of analysis having to do with oil depletion, the most obvious (in retrospect) calculations have been serious overlooked by the "experts" and it was up to people like Westexas to figure this stuff out.
BTW, WT can keep posting this as long as he can hold out; it makes up for all those years that nary a word was said.
Yeah, excuse me for even suggesting Disease or War could stop the general trend of declining exports.
War and disease would only maybe be able to reduce the downward slope some.
Oct - "...WAR (US annexes oil producers land and keeps locals impoverished -- not likely)". Actually it seems to be working well in a few spots. Like Libya and Equatorial Guinea for instance. And we didn't even have to annex them: just let a homocidal maniac rule the country as long as he keeps exporting oil to us.
BTW "B" works rather well in conjunction with A. I don't think we can toss out a credible projection but the population decline in EG is rather obvious: just sink the commercial fishing fleet, don't import enough food and stop the once very effective malaria spraying program and you're well on the way to B.
Don't worry about the fishing fleet. They will soon run out of fish to fish.
And malaria will spread when the climate zones move polewards/uphills.
Strictly speaking, they are Sam's "crazy predictions." But to clarify slightly, you would be buying the beer if Sam's predictions continue to be correct for overall combined net oil exports from the (2005) top five net exporters.
But I'll ask some questions I have asked several times. Precisely what is your point, that the fossil fuel fiesta can continue for a little longer than we are projecting or are you asserting that we can have an infinite rate of increase in our consumption of a finite fossil fuel resource base?
BTW, forgot this one:
Post-2005 Saudi Arabia has of course shown the same pattern as Texas after 1972, i.e., declining production, relative to a prior peak, in response to rising oil prices. The 1972 Texas peak (black) lined up with 2005 Saudi production (C+C):
Original graph in this early 2006 paper:
http://www.energybulletin.net/node/16459
In any case, the 2006 to 2010 Saudi data are pretty clear; we'll see what happens in 2011 to 2015.
Westexas,
Please continue to post these charts and statistics as often as necessary. Obviously, some who don't get it have never really paid enough attention. They need to be reminded whenever the cornucopian TV gurus appear to quell any dissent about BAU.
The number of people who don't see a problem is amazing, battery powered electric cars will save us, shale oil, or oil shale, or shail oyl will save us. They don't see that in just a few years the ELM clearly shows trouble in the short term. We just do not have the time to make all the alternatives viable, if they ever were.
I can see a future that I hope I'm very wrong about. This is where the troubles and revolutions that are happening 'over there', come to the rest of the world as food, energy and job shortages make western populations just as unhappy with their leadership.
The beauty of this work is in it's simplicity.
The work by Westexas/Sam and WHT is about all you need to know to understand the past, present and future in regards to Oil. All the rest is just icing on the cake.
For my money, you can post these graphs every hour on the hour until the power is cut. They'll be just as true tomorrow as they are today.
For Westexas/Sam to be wrong, there would need to be either a dramatic increase in the rate of oil discovery or a dramatic technological breakthrough that increases the rate of production and the fraction of original oil place from existing reserves.
The chances for any of this happening are slim, but not zero.
Seems like WT is posting data, not making “crazy” predictions. If you think the data is crazy sorry about your luck.
Exactly right. For understanding ELM, it only drove me crazy in its obvious simplicity. I kept on thinking there is more to it than what was posted. You just have to realize that the premise is of a zero sum game and that what gets added to one place needs to be subtracted somewhere else. And with declining EROEI and other factors similar to that, the trend just accumulates. Essentially the data is all you need to look at.
I really came up with the ELM to help me understand "Net Export Math." I asked a very basic question, to-wit, what happen to the net export decline rate, given an ongoing production decline + increasing consumption? It seemed intuitively obvious that the net export decline rate would exceed the production decline rate, but I was stunned to see how fast the net export decline rate accelerate with time.
I think that a pet peeve we both have is that people frequently make qualitative objections to quantitative models. It's a basic mathematical fact that given an ongoing production decline rate in an oil exporting country, unless they cut their consumption at the same rate as, or at a rate faster than the rate of decline in production, then the net export decline rate will exceed the production decline rate and the net export decline rate will accelerate with time.
And in the real world, excluding countries with practically zero consumption, e.g., Equatorial Guinea, we haven't found any examples of exporting countries cutting their consumption sufficiently over a multiyear period to keep their net export decline rate at or above their production decline rate.
WT, very good point about the pet peeve. Many of these ideas can be cast as constraint problems, the constraint here being how the rates relate to each other. Examples of constraint satisfaction problems (believe it or not something like the game of Sudoku) don't necessarily have unique solutions but the answers have to obey the original premise. ELM I think falls into this category.
Like I said, it was what drove me crazy trying to find a unique solution to ELM. There isn't any, but it's worse than we think!
It's also not just a case of who's data we accept, but also data sets that get left out.
There are, conservatively, 140 million more people on the planet today than
there were this time in 2008 (approx ... obviously) all of whom are in the market.
Peak Oil is not just number crunching the amount oil coming out of the ground.
It's also about oil to market, market size, the cost per litre effect on daily life, etc etc.
I see more of a plateau .. .. .. I'll stop worrying when I see a similar one in population growth.
Don't fret over the excess precision. Accountants often keep the precision intact so they can do regression tests against their tabulation procedures.
That reminds me its nearing tax time.
All liquids does not mean much. You have to adjust for energy efficiency, since you don't get as much energy from ethanol as you get from crude oil. Just like you need to adjust wage rises after taking inflation into account.
Too many people, including jaz, miss this point.
It may be possible that 2011 may see a new peak but it will be so dismally small that's it's the final breath before the plunge, not a New Beginning.
Besides, the world is already past Peak Exports since some time ago. We reached that phase in 2005 and from there on the oil prices have been on a steady march upwards.
Do people keep forgetting that the only thing that hindered oil to keep climbing up in '08 was the crash? Sure, it went down slightly after the 147 dollar mark but it's long-term trend would be 150 dollar+ if the economy had not tanked.
But of course, the world cannot sustain those prices, hence the crash(which was not all about Peak Oil I might add, the recession would have come anyway but it's doubtful that it would be as deep without Peak Oil).
And because of this we will see another scenario like the one in '08 either this year or next.
The only thing that can stop this is from happening is a downward depression of prices. And without a general depression of the economy, this can only be achieved with significant supply increases.
Contrary to the Saudi fairytales spun in '08 and again now, the problem is not of 'demand destruction' or that the market is 'well supplied'.
Darwininan did a nice post on this. Due to the laws(albeit inelastic ones) of supply & demand, the market is always well supplied in relation to it's price. But that doesn't mean it's healthy for the economy.
And since the Saudis have said many times - and do so even to this day - that a price range between 70-80 would be most fair for both consumers and producers, and continued to fail to use their alleged and supposed 'spare capacity' to achieve that price range, what makes people think it will happen now? That the Saudis will suddenly export a lot of oil to keep the price of oil from moving even further wayward into the sky? It's just not happening. See Westexas' data points and graphs. They are already well past their export peak. And since Iraq will not get more than 2 mb/d in production on top of what they produce now in ten years in any realistic scenario, where will the oil come from? Shale? Technology? Please.
Besides, I'm not too worried about Saudi Arabia getting a revolution, Iraq is far more likely due to it's secterian strife and religious divisions. It's already been through a civil war and it might well lapse into another one soon. And if that happens it's essentially finished. They are they key to increased production, Saudi Arabias alleged and supposed 'spare capacity' nonwithstanding. If they fall, Peak Oil will be extremely imminent and the slope will be much harsher, quicker and quite frankly dangerous than the standard case(which is not exactly lighthearted)
It's entirely possible that jaz is right about the smallish - and highly temporary peak - but it's irrelevant. It will not change the fundamental picture. You won't be able to get the oil needed to take the prices down to the levels that worked in the past: around 30 or 40 dollars.
80 is the new low, 100 is becomming the new normal. Since an oil price of above 85 cannot be sustained for longer than a year without significant economic damage, we'll keep seeing boom and busts happening with tighter and tighter intervals until it's just a giant decline with no end compounded with more and more bizarre excuses from the Saudis as their exports inevitably decline further and further until only the clinically insane, the malignant or the hopelessly optimistic(read: blind) are left to either spew or swallow the stuff being fed so far to the general population.
Leiten
http://previous.presstv.ir/detail.aspx?id=165011§ionid=351020102
You got to ask yourself, does China care if oil is trading at $120 or $150 on the international markets?
Not at all, in many countries they are paying for it in part by building power plants, refineries, roads, railways, finished goods, etc.
The expansion of Chinese trade with, Russia, Brazil, Angola...the list is very long, will make future oil prices limits very different from the past.
If US and Europe go into recession, so what,will Iraq care?
http://www.iraq-businessnews.com/2010/05/27/china-races-to-secure-middle...
How hard would it be to produce charts of total liquids with BTUs over time instead of barrels over time? It would be much more meaningful to do so. Mixing liquids with different energy densities into one chart showing only volume and calling the result a meaningful indicator of world energy is just wrong.
Agree. I've been asking for this also.
All liquids does not mean much. You have to adjust for energy efficiency, since you don't get as much energy from ethanol as you get from crude oil.
But how much energy is obtained from a barrel of crude? This will be significantly less than the gross energy content of the oil because of the amount lost in processing and unusable fractions.
TW
I don't think that fraction has changed much over the years, so its absorbed into the baseline. Good question though.
FYI,
The world produces 75 mbpd of crude oil, 8 mbpd of natural gas liquids, and 3 million barrels of unconventional oil(tars sands, CTL) and 1.4 mbpd of biofuels (mainly ethanol).
This totals 87.4 mbpd of liquids.
Natural gas liquids and ethanol have ~2/3 of the volumetric energy density of crude oil.
A 42 gallon USA barrel of oil is 5.6 Mbtus of energy and is broken down into 19.5 gals of gasoline 2.3 Mbtu, 1.5 Mbtu of diesel 11.4 gal including home heating oil, .5 Mbtu of JetA 4 gal., .25 Mbtu of bunker(marine) oil(1.7 gal) and .15 Mbtu of liquified petroleum gases like propane.
So you could say that for every barrel of oil you put in you get
~4.7 Mbtu of fuel out.
The rest goes into non-fuel products. Nothing is unusable.
The overall efficiency of a refinery is 85% but some energy comes from pipeline natural gas as well.
Then we have to subtract embedded energy of extraction and transport in and out of the refinery...
Hello,
I read this as you think supplies should have been adjusted according to volumetric heat content to make it on “crude oil equivalents”.
I did that in a post some weeks back.
Crude oils have different volumetric heat content.
Further some of the crude oil, NGL and other energy in liquid state are used as feedstocks for petrochemical industries so to look at energy available we would have to adjust for these non energy uses as well.
http://www.theoildrum.com/files/FIG06_LIQUID%20ENERGY_SUPPLIES_CRUDE_OIL...
Thanks. Great chart.
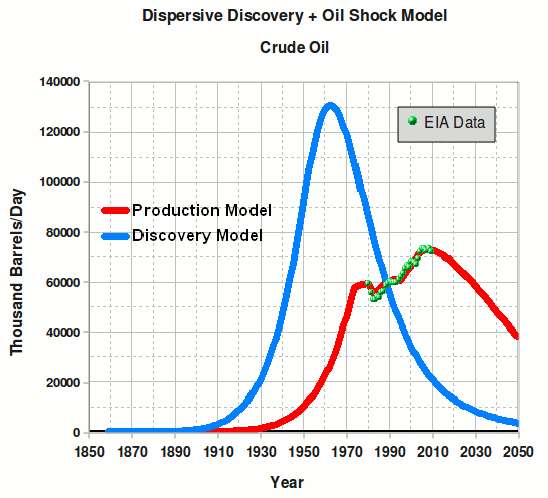
Carefully consider the mathematics of the crude oil production curves and the graphs based on empirical data. Oil production curves are roughly symmetric around the peak. It would be unusual to get the all time maximum global rate of production immediately followed by a rapid permanent decline. The global peak will probably be correlated with an oil price shock and a collapse in demand like in 2008, but the production plateau will remain as in 2009 and 2010. It is more likely there will be a roughly symmetric undulating plateau on each side of the peak. If global crude oil production peaks after 50% depletion of the URR, then the falling edge of the plateau might be a little shorter than the part on the rising edge. Therefore, the timing of the peak is relevant to estimating the width of the plateau.
You appear to be speaking from a collapse scenario: at peak oil, society collapses causing demand for crude oil to decline faster than production. I am speaking from the stair step descent model in which the global economy is hammered down by a series of oil price shocks each time demand intersects maximum global supply. Maybe the world economy will collapse from one of the oil price shocks eventually, but I doubt it will be from the next one. Things have to get much worse before collapse could occur.
This is the second time you have referenced mathematics, also here:
http://www.theoildrum.com/node/7327#comment-757172
I would be curious to see the details of your math or your model. You won't find a better booster than me if you have something significant to add.
WHT, I am trying to make sense of the information posted on The Oil Drum over the years. As such, I have nothing more than what you have already seen on TOD. I have some observations which I post in the comments from time to time and you can do with as you please. Sometimes it helps to have other opinions to prevent one from overlooking the obvious when contemplating ideas in depth.
Actually I am not speaking from a collapse scenario. I consider myself a hardened realist, not a doomster who think the world will go up in flames in matter of a few short years in one giant Apocalypse.
As for the symmetric curves, this is only true in instances of a 'rational production'. E.g. no political or other disruptions, and the best available technology.
Most countries in the ME does not follow this pattern, see Iran as a good example, another is Saudi Arabia. The curves for these countries are very odd and illogical but that's because they have been subject to wars, revolutions and political scheming like sudden supply drops from a political motivation(such as the Yom Kippur war).
If you agree that we've been on a plateau for the last 6 years, why should a peak on the plateau be any more relevant than a trough? Why can't we have a peak just before a decline? Just suppose all the maintenance on the production wells came to an end at the same time. You'd have a minor peak, but then if more wells than normal are offline you get a trough.
It's not what goes on during the plateau years that's the problem, it's the direction that we come off plateau that counts. I know which direction my money is on.
A peak on the plateau corresponds to an oil price shock because demand is intersecting maximum global supply. A trough on the plateau corresponds to demand destruction, that is, consumption less than the maximum possible. A peak reveals the maximum possible production at that time. If there is another oil price shock in 2011 with the peak production higher than in 2008, then we are still on the rising edge. If we have one with the peak production lower or the same, then it is not clear which side of the peak we are on. We would need more oil price shocks to identify our position.
If there is economic collapse or geopolitical events interrupting supply, there could be a peak just before a permanent decline, but I think the odds of this happening on a plateau are small compared to it happening on a falling edge. At the peak we begin to reduce the wasteful usage of the fuel but are far from the minimum operating level of crude oil for human society. On the falling edge we are getting closer to the minimum operating level and the oil price shocks will probably occur more frequently. For example, Europe and USA have petroleum reserves (SPR) to compensate for the interruption of Libyan oil. These reserves can be replaced on the falling edge of an oil price shock during the plateau without causing economic harm (because demand is below maximum supply), but will probably be depleted and thus unavailable on the falling edge to cushion the blows from supply interruptions. Export Land Model says oil exporting countries are prosperous during phase I which makes them less likely to collapse than oil importing countries that must pay the high price. Since Libya has the revenue to pay for food, something else is causing the revolution there (hatred of Gaddafi?). If one accepts ELM, one can not rationally expect oil exporting nations to collapse in mass during their good times. The majority of the problems will occur in oil importing countries which will diminish demand, not supply. We already know from 2008 that oil price shocks do not necessarily result in economic collapse. On the plateau there is a high price for oil causing the producers to try hard to increase production. This effort does not suddenly stop because one passes the peak. Look at westexas' comparison chart for Texas and North Sea oil production. There is symmetry in the absence of geopolitical disruptions.
Storage exists to smooth fluctuations from maintenance.
Time will tell what will happen.
There is symmetry in the absence of geopolitical disruptions.
Exactly my point. I care not what the reason for a peak may be, just that it exists. Similarly, any number of events may cause a drop from the plateau directly after that peak. The fall may even be precipitated by whatever it was that caused the peak.
The claimed symmetry for the pre/post production graph requires a smoothing that would not show any "minor" peaks.
It's akin to claiming that Climate Change has stopped because the world hasn't warmed since 1998. We all know what the trend is doing, having one data point outside of that range is just part of the accepted noise.
My understanding is that storage exists to smooth the fluctuations in delivery. The production figures quoted are generally pre-storage, not post.
jaz - Perhaps but that's of little importance to those of us who could care little when exactly absolute PO is reached. What's significant to me is that we appear to have reached an undulating plateau that will be difficult to maintain into the distant future. Whether PO hits in 2005, 2008 or 2012 doesn't really matter much IMHO.
Rockman
I know you do not, but there are some people on this site who care very much and consider 2008 as sacrosanct.
The way I explain global oil problems to people is to tell them that all countries in decline add up to a fall of about 4 million barrels a day every year. With demand increasing by about 2 million barrels a day, the world cannot any longer bring that amount of new oil to the market.
A North sea of production every year, has to be found and developed, that is why it is costing more and more for the small increases we can see.
Unfortunately many people think OPEC have got endless oil and are milking it.
Gordon Brown stated that much, before we kicked him into touch. So what chance do ordinary people have of grasping all the facts.
Rockman
I take it if I convert my car to lpg then total liquids becomes more relavant to me than oil?
jaz - yep..I don't tease the timing folks. If nothing else it's an interesting effort to see them wade through the incomplete data in their model effort. I do appreciate the toil.
As far as your point about how quickly new oil can replace depleting reserves: I just made a long comment elsewhere regarding Brazil and its ability to help on the supply side "in several years" as someone mentioned. Just like PO timing I don't really care to get into the speculation about how much Bz has in its DW trend. Might be 2 billion bo or might be 100 billion bo. I haven't seen enough public data to even make a rough guess. What's significant to me is the time frame it will take to bring these fields on and how long those big production spikes will last.
I've worked with DW GOM fields and it takes a very long time from discovery to first production. It varies but 4 to 8 years is not uncommon. But even then a huge development project might only bring 400,000+ bopd on line. I say "only" in the sense of how small a percentage of global production that amount represents. Even having 10 such fields come on line in a year is still a small percentage. And I dare say that possibility is slim to none. But even when they bring a monster on line it won't last 20 or 40 years like many of the big onshore fields. Due to economic factors driving such projects to max cash flow in combination with high operating expenses in DW many new DW won't have much economic life (production) beyond 10 years. And a number with even shorter commercial lives.
So again, like the exact timing of PO or how much producible reserves there are in DW Bz (or anywhere else), it doesn't interest me much. The world's economies, as well as each of our own personal economies, are going to be dominated by the play between daily production rates and consumption IMHO. Or, more simply, how much gasoline costs when some fills there care up on 1 January 2018 will have no bearing on how much proved oil is then tallied for DW Bz.
Good comments.
http://www.eia.gov/cfapps/ipdbproject/IEDIndex3.cfm?tid=50&pid=53&aid=1
Looking at the data Sri Lanka has a negative oil production.
Are they pumping it back into the ground?
They are an island. They do this to counter climate change from raising the sea levels.
Joke aside; Salomon islands and Samoa don't even have a single barrel each. I'm not sure of how much one can trust these numbers.
Thanks Rune. Great info as usual. All I can see is plateaus and peaks. With the rise of Chinese and Indian demand this last decade, you would at least expect crude oil to be rising. As demonstrated by the first and second graphs that definitely ain't happening. I gues we can go along the fumes of condensates and NGLS for a little while longer. Not much, but a few years at least.
Great report Rune, and look forward to the report planned above.
But accordning to EIA, Angola's Crude Oil Production Capacity is down 400,000 b/d since December 2009.
Angola figures show 1.98 in April down to 1.7 in December
You left out a chart:
(click for source)
Guys, we need to worry about Iraq:
http://www.guardian.co.uk/world/blog/2011/feb/25/libya-turmoil-gaddafi-l...
Apologies to the mods, but today's Drumbeat is not up yet.
If Iraq goes the way of Libya, everything can happen.
I do believe oil prices will rise despite global production going up over the next few years as China, India and OPEC demand increase is so high.
Matt Simmons said $100 oil is cheap!
People heard what he said, but still do not understand what needs to be done.
If they did the Toyota prius would be the top selling car by now.
The Prius is the top seller - in Japan.
Notes from Figure 6
"What may be observed from the diagram is that as the oil price (Brent spot) moved north of $70/Bbl it seemed like demand/consumption from Non OECD flattened. Many reports have pointed to continued growth in Chinese oil imports and consumption which may suggest that some economies may have cut down on their demand/consumption as a response to the price growth."
This seems like the poorer "cash starved" countries outside of the OECD used less oil once the price rose above $70. What's interesting to me is Figure 3 which shows that in 2006 when oil rose above $70, OECD consumption started trending down also. Then in 2008, when oil rose above $110, OECD consumption fell more rapidly.
I think OECD countries may react quicker now. OECD countries face austerity measures and budget cuts going into the price rise and many people have eaten through their savings, reducing another pile of spending power. We're also better able to reduce transport needs than we were only several years ago.
1. Books - E-readers have finally taken off, B&N tried to sell themselves, Borders is bankrupt and closing stores
2. Movies (DVD in particular) - Streaming services are much more prevalent, Block Buster now faces liquidation
3. Conferences - Airlines fees are again rising with oil prices. However, this time I am getting conference ads which offer onsite attendance vs a reduced fee 6 month window to view all presentations online.
Mid-East instability has the obvious potential to reduce global oil production by a couple of million barrels a day, testing Saudi's spare capacity claims and putting pressure on those who decide whether to tap into stored reserves.
Those who called for a series of price spike/demand destruction cycles may have been right.
CAS
Hello,
The points you mention I believe to be valid. Estimates I made before the recent revisions to US GDP figures showed that the US economy could take an annual average oil price of $100 - 105/Bbl in 2010 before GDP exclusive of energy expenditures was affected. I believe US has a higher resilience with respect to impacts from oil price growth on the economy, as the US produces around 40 % of its crude oil.
Looking at other OECD countries oil consumption started to decline as the oil price reached an annual average of around $65/bbl in 2006.
This also seems to be the price that slowed demand from Non OECD countries in 2006.
An economy that grows strongly, like the Chinese, will have the ability to both grow consumption and absorb some price growth.
Most of the growth in Non OECD oil consumption since 2000/2001 has come from OPEC countries and economies with strong growth like China and India.
Figure 06 shows that demand from Non OECD recently have gone flat as the annual average oil price approached $80/bbl.
As of now the above suggests to me that the world economy would struggle if the annual average oil price remains above $100/Bbl in 2011.
Rune,
How much is the price of oil being affected by devaluing of the US dollar? With the exception of the spkie this week to $100US, from our perspective in Australia, the oil price we pay in $A hasn't changed much as the oil price has risen. How does this inflation adjusted price in local currencies compare to headline price in USD?
Termoil
Hello,
I used data from Norge's Bank and since 01. January 2011 and as of today there seems to have small changes that is around 2 % in the exchange rate between USD and AUD, CHD (Swiss Franc), EURO, GBP (British Pound, around 3 %) and CAD (Canadian Dollar).
It could be that the price increases for consumers comes with a lag.
Thanks for the post Rune, I try to never miss it.
It could be that the price increases for consumers comes with a lag.
maybe some places--here right across a ridge from TAPS our heating fuel prices are climbing steady. In October #1 diesel was $3.19/gal, Tuesday it was $3.59/gal, by Thursday it was up $.12 more. Our refinery sits right on the Alaska pipeline, nothing is getting trucked more than twenty miles. We feel price rises instantly--where we get the lag is when the per barrel price falls.
Does anyone know whether there are any specific rules to the release of IEA reserves? Does the IEA effectively have control over the reserves and can force each country to release similar percentages?
The IEA has no control over anything other than the data they report. They are just a reporting agency, nothing more.
Ron P.
And there's some debate about the control they have on the data.
Well well.. As I have stated so many time in previous posts, I continue to expect crude and condensate production AND total liquids production to keep gradually increasing. Even when the proof is in the numbers I see there are quite a few fundamentalist doomers who are just ignoring the figures and claiming that it "is the wrong kind of oil" or "production doesn't count any more" or "the IEA just make up the numbers"... (as somebody noted higher up in the comments they weren't saying these things as long as the numbers matched their arguments :-)). Still as Stuart Staniford said: "People running around saying that 2005 or 2008 was definitely the peak risk having events make fools of them"... What I find really funny is that those people are still not accepting the facts even as they occur! Seems that doomsterism should be listed as a new religion :-)
Anyway... After we've seen a peak in oil prices over the next few months, oil prices are likely to collapse while production keeps trending upwards. Oil importing countries will be gradually reducing their demand so there is likely to be quite a glut in the near future.
And no. I do not buy the argument that it is only light sweet crude that counts. That is like arguing that we should still be only looking at whale oil!
ps. Jaz. Don't worry about the extremists... They will soon be proven wrong.
Cheers Nordic_Mist
I was an extremist a few years ago, but much better now :-)
Nordic_mist before you start wacking off jaz can I remind you what jaz stated up thread:
jaz, does your definition of extremist mean 'someone that is predicting peak oil within a few years'? So peak oil can happen as long as no-one predicetd it yes?
You guys are all over the place. You both need the darwin award for convolution.
Marco.
Interesting:
1. Convolution is the act of presenting a convoluted or confusing or complicated argument.
2. Convolution is a mathematical technique of processing a stimulus function with a response function; the best example is convolving a discovery profile with an extraction profile -- this gives the Hubbert peak curve.
I defined convolution carefully in The Oil ConunDrum so people would not infer that I was presenting a confusing argument. The term has that unfortunate dual meaning; it's like defining "addition" to also mean "complication" :(
These are all fine as hair-splitting, minor, second-order academic arguments BUT why is the price of gasoline high? Why is the economy not rocking and rolling in all that new high quality light sweet crude you boast of?
Is the "oil" not scant in quality -- hence the confusion of the issue by including propane in the mix?
Are crude oil volumes not critical since they are many fold cheaper?
Do you fly a propane jet?
Humor me why you care about the minute detail of the exact minute peak oil occurred. It does not matter.It is like worrying about the color of the stripes on the football instead of throwing touchdowns. It is not an issue at all.
The general shape of the curve means we are done with significant increases in oil. All the while people are breeding all over the world like mad. We are in the noise at the top of the curve and that is not very good for the industrial economy that requires oil to feed the masses. That to me is no longer something you can argue with.
But please go right ahead and argue that per capita oil volumes are increasing ;-)
Two issues here:
1) Moving the goalposts - when talking about peak oil, the original discussion was crude and condensates from traditional fields for the discovery/production/depletion curves. It makes no sense to include tar sands and Ethanol, as that is a different discussion -- how well we can adapt to lower EROEI sources as crude becomes expensive and rare.
2) Population and economic growth versus total liquids - this is what drives price, the demand of a growing and increasingly energy-centric populace. There are plenty of angles here too, for industry versus static-use energy versus vehicle-use energy, but at least here we're talking about the bigger picture, not crude production.
We could also pick discussions on export-land realities and the impact of Chindia on the US, for a more specific focus.
For 1, is there any indication that traditional crude has much chance of setting a new peak significantly above the past 5 year plateau?
For 2, is there any indication that the total cost of energy per capita is going down?
If we're not obtaining more, cheaper energy, the impact to the economy is going the wrong way for long-term success. Whale oil is a perfectly fine example -- the supply crashed, price skyrocketed, and then demand shifted away from it. Where will crude oil demand shift to?
Why would your assertion that oil importing countries will be reducing their demand, if not for price?
Right on.
Interesting that Nordic_Miss used Stuart Staniford to run interference for him:
The problem with Staniford is that he believed in his heuristics too much. For example, he used to post depletion curves on TOD trying to match a Gaussian function. Yet, the issue with Gaussians is that they show much too steep a decline. So since he used the Gaussian merely as a heuristic, I bet he was at a loss to explain exactly what was happening when the peak hit a plateau.
People that use heuristics for understanding physical processes risk making fools of themselves. Its always safer to understand first as a priority, and only then chase the data. If you are wrong, then at least you can learn from that and maybe use that knowledge to correct your model. With a heuristic, the only option you have left is trying to find a new heuristic. So Staniford may "doth project too much".
Web
Let us be clear; Are you are stating that oil production will not be higher than July 2008? or not higher than 2005 average or 2008 average?
Not to put words in WHT's mouth, but here is a comment of his from August of last year that I think pretty much sums it up.
That is perfectly OK and I hold by that. I recently did a variation of that plot against EIA data:
It may or may not satisfy jaz.
What do you mean "Let's be clear"? Where did I say anything about that in this thread? Jaz has a recent history of putting words in other people's mouth. Look at this exchange:
You are anything but clear. I think you are intentionally inferring results and imaging dialog to further your argument.
All I said is that we should and likely can understand the simple draw-down mechanisms of oil depletion. Then a person won't make such a fool of themselves when they make claims as to what should or should not happen. I assert that Staniford is being hypocritical when he accuses someone else of modeling a peak curve, when he himself has done exactly that in the past, while not having any physical model to back it up. That's what using a heuristic means. Cripes, he doesn't even have a model that can predict a plateau, which is simple enough to model and generate (read The Oil ConunDrum and look for the section The Overshoot Point).
Web
The final part of the conversation, I said Iraq was very important to determining peak oil and since you had done predictions on smaller countries I asked you if you had done Iraq.
I am starting to realize you criticize everyone else but refuse to give a clear prediction of your own.
So do you have one or not??? If not say so.
Prediction is hard, especially about the future
Thought Yogi should have his say today. It is the beginning of spring training.?- )
Oh forgot, darned ocean blinders got in the way again. Yogi Berra is an iconic American baseball player. Spring training is the baseball preseason and is played in the lower latitudes of the continental US. And yes I know baseball has the highest carbon footprint of any major US sport.
Did enjoy watching Rugby 7s the other week though ?- )
Well it was -10F outside this morning, looks like 'Start green' glide wax will define my sports for today. Baseball and Rugby were nice warm thoughts though.
Do you use flourocarbon wax? For skate skiing it is more expensive but it works much better than the traditional wax. I was out this afternoon (0 deg F) with yellow fluoro designed for 20 to 30 degrees and it still works pretty good. I think it is more important to get the best glide wax and then realize that variants for temperature don't matter as much.
I've looked at it, but the price put me off. I only started skating just under two years ago and my cheapish Rossi's have a wood core. If I upgrade skiis I might go for the spendy wax, or do you think it might help on even cheaper skaters?
At -10 to -20 (which can be a third of my season) I just get over in the classic track when I don't like what I'm getting for my effort--can climb steady mild grades with no kick wax at those temps. This lets me get my 20 to 25 k in a couple/three times just about any week but I'm not all that pretty to watch or very quick about it all. Still I can manage better than last place in the 50k come end of March?- )
I am a bit cheap on equipment. This is my second set of skiis in twenty plus years. The first set of Rossi back country 215s no longer have any of the old gray ptex on the center 2-3 feet. I skijored them to oblivion when they were about shot took a five year break before I bought skaters.
I have long weaned off of competitions and ski for unknown reasons. XC skiing in skate form is the closest thing to our knuckle-dragging ancestors, as we end up essentially emulating an ape's motion. Maybe it is primordial.
I go for the top of the line skis because the top ($300) is not that much more expensive than just the good ($200). Carbon fiber for the skis and poles and my next pair of boots when they wear out. I would never do this with a bike because the top of the line there is 10x the price than the price of just a good bike. Bizarre pricing system in comparison but it has a lot to do with the simplicity of the skis and the fact that few people actually do the sport.
I go for the top of the line skis because the top ($300) is not that much more expensive than just the good ($200).
Not the case in our local higher end store. Top of the line poles are over $300 there. I got some okay carbon fiber poles that I didn't like the straps on too much (OneWay-should be called no way). They lasted less than a week. Higher quality replacement straps--ridiculously high. I had broken one of my original carbon poles stumbling at a stop between trails at about -15F, I seem only to get in a bind when I stop ?- ).
Two levels up skis would be in the $400s here--top of the line between double and triple that. I wasn't sure if I'd take to skating but now that I have I likely will upgrade a bit--the knuckle dragging sway does have meditation like qualities. My original skaters will be my deep chill beater skis.
I did buy reasonably decent boots and bindings. I only 'race' our spring 50k called the Sonot Kkaazoot (my only race is to see how many ks I can ski between now and the end of the line or of my living near snow, whichever comes first).?-) The race name is supposed to be Athabascan for 'sliding around in eary spring' but 'kkaazoot' sure sounds like some recent word (early 20th century) that maybe came from rootin' tootin' I'm going kkaazootin'?- )
Thanks for letting us ramble a bit Rune. To bring the thread back around. It will take very high oil prices keep oil away from its top end value added goods such as cutting edge sporting goods. The less oil we burn the more we will have for better uses--if we can somehow hold it together for a bit.
$1200? You are getting ripped off. I spent $300 for Atomic World Cup which is what the olympics-caliber racers use. They weigh about a pound apiece. Bindings are $100. I got top carbon poles for $50 on ebay, the baskets didn't last but that was because they were for perfectly groomed courses, replacement baskets with tips for $15.
Not sure if they had anything over $800-900 which is an MRSP I see on line. With me at 95-98 kilo (depends on the weather) many skis aren't stiff enough for me in the mid flex range--good numbers are hard to find on line. Fischer's Stiff Flex skier weight range starts at 197 pounds, most other makes stiff skis start at around 170 pounds.
Swix pole straps run $30-40 on line (they are very nice straps even if overpriced)--it really burned me to buy some OneWay poles that were a bit cheaper and then get stuck upgrading straps which would have come on the slightly higher carbon content Swix poles if I'd have paid the pole plus strap price at the outset. I should have hit a couple other shops, but waiting for something from online when I had only one pole was not on the agenda.
The flex on carbon skis is amazing. The closer they get to flat, the harder they are to bend. I never really worried about the flex before. My Atomic carbon poles barely flex at all. Winter is nearing a close :(
Well come on up if you want to extend your ski season a bit?- )
Last year the trails on the hill slushed out about April Fools but the year before I had a decent ski Tax Day. Ice permitting, March 26 you'll find a big bunch of us normally very solitary skiers massed on the river downtown?- )
Everyone at this place knows I put everything on the line, all the time, IF I have good data and confident that I have a good model to work from. I criticize because I can easily tell when other people do not step up to the plate. My rule-of-thumb is that when you do the work yourself and put in the effort, you know exactly who the poseurs are.
I am currently battling two cornucopians on the PeakOil.com message board.
http://peakoil.com/forums/catalog-of-recent-oil-discoveries-t35194-1185....
They accused me of not making an estimate of USA production for the year 2014. So I specially created a custom graph for them of reserves and production going out to the year 2050. I didn't do a complete forecast for the USA before because the discovery data was split between lower-48 and elsewhere. The current model fit has only two physical parameters.
1) a probability per year that a new discovery will be developed, constructed and reach maturation -- these were each set to 0.07 (7%).
2) an average extraction rate from reserve of 0.08 (8%) per year.
(click for bigger image)
The analysis is the Oil Shock Model applied with these two parameters, just a set of convolutions to get reserve and production matching the EIA data for the USA. Apart from the input discovery data, the following is the entirety of the Ruby code; the discovery.txt file is yearly discovery data, which is in the first graph. The second graph shows reserve.out and production.out. You can run these easily if you have a shell environment on your computer.
cat discovery.txt | ruby exp.rb 0.07 | ruby exp.rb 0.07 | ruby exp.rb 0.07 > reserve.out
cat reserve.out | ruby exp.rb 0.08 >production.out

$ cat exp.rb
def exp(a, b)
rate = b
length = a.length
temp = 0.0
for i in 0..length do
    output = (a[i].to_f + temp) * rate
    temp = (a[i].to_f + temp) * (1.0 - rate)
    puts output
end
end
exp(STDIN.readlines, ARGV[0].to_f)
This reflects the reality of oil production with the simplest description one can imagine. Those parameters model real temporal quantities and the discovery data is a best estimate based on information available, while the two adjustable parameters work the two curves simultaneously.
Yet, the 2 cornucopians still criticized me because I made a graph and did not say exactly what the number will be for 2014. Look in the mirror, and you can probably see the similarity to your attitude. It's called the arguments of raising the bar, moving the goal-posts, language lawyering, and setting unreasonable expections. You doth project too much and you are the one that may have a criticism problem.
The reason I wrote the book (http://TheOilConundrum.com) is to educate people on how the oil production process works at the most elementary level. You will find predictions for world production there -- the predictions become better the larger the scale of the model, simply because the statistics get better and better the more data you have.
As to your request for me to jump through every hoop you throw at me (like you did last time with Iraq), I choose to use my time wisely. If OTOH you would like to step up to the plate, the code is all there, feel free to knock yourself out.
Can't get much flatter than the curve going on out in the cumulative chart. In that scaling even a big discovery like Prudhoe in 1968 barely budges the line. Very unlikely another discovery that big will be coming on line again in the US.
The flatness of the discovery curve is a bit misleading because it is on a log-scale, but I wanted to show the cumulative change since the very early days. Still, it really does show that the diminishing returns will no way match an increasing level of consumption.
So I am not the only one who has found you out as a fraud.
At least I put some figures to my analysis and explain how polical considerations produce an amount of uncertainty. So 2012 to 2020 for all liquids is my estimate all considered.
Your arrogant putdowns of many people without any real predictions of your own just shows how insecure you are with your own calculations
Sure, if you want to believe what a couple of cornucopians say. It's kind of like having Dick Cheney or the Koch brothers calling me a fraud.
I honestly don't see an analysis, only assertions.
You might want to restate that as it doesn't make any sense. What's exactly wrong with pointing out that the emperor is wearing no clothes?
I will go toe-to-toe with any cornucopian any day. I don't think you are a cornucopian, more like a needler. Those other guys on peakoil.com are true cornucopians yet curiously use the same fallacious arguments that you are using.
It is not just cornucopians you put down.
From Gail's post some time back, your statement
I hope it fills the gap for those like me who feel frustrated by the futile atttempts at mental bookkeeping when much more powerful means are available.
http://www.theoildrum.com/node/7258
That is basically my attempt at Marketing 101. You try to sell a product as to its worthiness by pointing out the weaknesses of other approaches. Any time I do "mental bookkeeping", I realize it is "futile" because other "much more powerful means are available". I learned that in school and that's why I use a calculator and not try to multiply numbers in my head. YMMV.
I suppose you also sensed all my pent-up frustration as well as my optimism, because I used the word "frustrated" and then "hope".
It's funny how certain words have such an effect on people.
"I am currently battling two cornucopians on the PeakOil.com message board."
The starter of that thread is very good at raising oil discovery numbers, but appears to not bother with revisions. In one of the new 120 million bbls discoveries from 2007 that is mentioned, the company involved revised the reserves down in the following 2 years. Innaminka's total reserves from all of their fields constitute 8.8 million bbls oil equivalent according to their annual report in 2009. The share price spiked to over $1.70 at the time of the 120 mbbl 'discovery', it currently languishes at $0.15.
Web is fighting a lot of hot air over there.
That's my take too.
I started the fireworks just by suggesting that we could guess the number of future discoveries by extrapolating from a model of past discoveries. I stated that the one fellow collecting the data (who on TOD goes by the name "Abundance.Concept") was essentially wasting his time by listening to press releases.
PEAK OIL = PEAK OIL and NOT PEAK ALL LIQUIDS.
Yes, the oil price will collapse again. After the economy collapses. Its coming soon, before the end of 2012. Then marginal production will make a loss and these developments will stop. The world economy cannot function with oil prices significantly above $100.
Equally PEAK WHALE OIL = PEAK WHALE OIL and NOT CRUDE OIL. By your argument the world should have collapsed when we ran out of whale oil. :-)
Whales are a renewable resource and you can't declare a peak on a renewable resource unless you make that species go extinct. Look at predator-prey dynamics and you can see the famous random oscillations exposing peaks. That is just elementary logic, man.
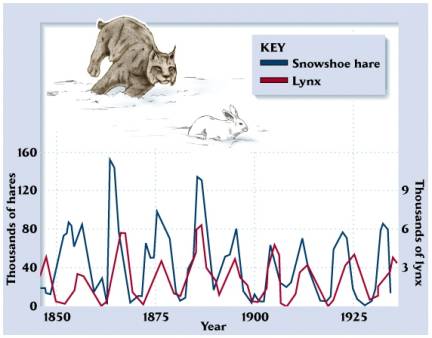
In the USA during the 1800's, both passenger pigeons and carolina parakeets were wiped out and made extinct. This from huge flocks consisting of millions of birds. The bird hunting and trapping economy collapsed and you could no longer buy dog food for a penny a bird. But Americans then just shifted to raising chickens.
So I have to ask, what is your point?
Our trucks and cars function in UK with petrol prices the equivalent of $250 Barrel.
I think you may mean the US economy cannot function with oil prices above $100, what is significant by the way $20 $50 or $80?
Not quite.
We pay petrol prices that equate to that, but then most of price is tax which goes back to the government. At $250 a barrel all that tax will go out of the economy and over to whomever we buy the oil from.
Doom
You are right that the tax money gets spent here ofcourse, other than the £6.2 Billion we GIVE to European countries to have the priviledge of buying BMW cars, French wine and Italian salami.
http://www.telegraph.co.uk/news/newstopics/politics/6073804/UKs-payments...
Much of the rest is not spent wisely, the failed NHS computer system cost aroung £20 billion
http://business.timesonline.co.uk/tol/business/economics/pbr/article6946...
Read the book Squandered by David Craig, much of our tax money achieves nothing.
You mean the 40+% EU budget share that goes into agricultural subsedies, so that farmers can produce stuff people don't need? Or the fantasticly high amount of money that goes into translating every document ever written into every language of every one of the 27 member states? Or the money we pay fishermen to deplete fish stocks in fishing waters from the Arctic to the coast of West Africa?
What's the point in beeing the richest continent in the world if not to waste unbelivable amounts of money in completely useless or even destructive ways?
Classic destructive way
The estimated discards for the North Sea ranged from 500,000 to 880,000 tonnes. To the west of Ireland and Scotland, discards ranged from 31% to 90% of catches depending on the fleets, target species and depth.
http://www.fish2fork.com/news-index/EU-moves-to-end-scandal-of-dumped-fi...
Why are Spanish and portugese fleets fishing in Irish and North sea they have their own waters, UK fisherman go bankrupt and other take the catch.
$250? I just paid $8.34 per US gallon for diesel. This is $350 per barrel.
John
What do you mean by saying that you expect crude and condensate production to "keep gradually increasing" ? 2005 is, so far, the annual-production peak of C&C. We're into year 6, so where is your "gradual increase" ? !
Hinson,
I mean that I expect the trend from the beginning of 2009 to continue. Since January 2009 crude oil and lease condensate production has increased from 71.5 million bbls/day to approximately 74.25 milliion bbls/day in November 2010. The absolute monthly peak was in July 2008 at approximately 74.7 million bbls/day. In my opinion this number has probably already been surpassed over the last couple of months. The average production for 2005 (that you refer to) was 73.7 million bbls/day. This figure will also almost certainly be surpassed in 2011. The trend for all liquids is even steeper.
Large increases in oil production in Iraq, Brazil, and a little bit further down the road, in West Africa (there isn't only presalt in Brazil!!) will ensure this trend will continue. SA also has spare capacity.
The figures will prove my point over the coming months.
You are projecting this while Libya's oil production of approximately 1.8 Mb/d of light sweet crude oil is being interrupted. Dismissing geopolitical events can be hazardous.
You don't seem to be factoring declines in your analysis; as we move froward more of the world oil production is coming from either smaller fields, shell fields ,or deep water fields all of which have a significantly steeper decline rate in comparison with the onshore giant oil producing fields that supplied most of our oil for decades; this trend makes sustaining a high C+C average much harder in the future; the headline C+C number may look stable, but the running on the treadmill is accelerating underneath.
Regards,
Nawar
You are an entertaining poster! "Peakists are extremists and should shut up! By the way, peakpeakpeakpeakpeakpeakpeak...."
You have brightened up my day.
Your rise may or may not occur, but I quibble with your assertion people are running around screaming "2008! 2008! 2008! 2008!" And even more with your distinction without a difference of a new high in 2011. Let's be generous and say it's 74.5 bbd in 2011. That's maybe slightly more than 100,000 bd/year over the last 6 years.
8-/
Volatility in the MIddle East means that all bets are off until we see whether the contagion results in ongoing turmoil which disrupts production and exports. I believe Gaddafi has threatened to make the oil fields in Libya unusable (should he be toppled). Things could get much worse or they could settle down. Geology + economics + geopolitics will determine production and exports. Which of these is most predictable? Which do we have great trouble in assessing? in predicting? We don't know exactly how much oil is available, we certainly have a lot of trouble predicting economic cycles, and with geopolitics we can identify which regimes might be vulnerable to turmoil based on resources, population growth, income distribution, but figuring out when major geopolitical events will occur with reliability is next to impossible. Very few predicted the relatively peaceful demise of the Soviet Union--Russia is the number one oil producer today. We have data which shows trends in production and exports, but as we approach geologic limits to expanding production, I think prediction about economics and geopolitics becomes very difficult. It might be logical to assume that as we approach some geological limits, the geopolitics and economics will become more volatile, but which way things will go and when, good luck with that. We don't have much precision to begin with since we have lots of missing data about what resources exist.
What are my conclusions? We have sufficient data to suggest that we are approaching geologic limits. We know that stability in the Middle East, Mexico, Africa, etc has been tenuous for a long time. We have several years of data showing economic volatility. The US is using volumes of energy to fight two wars. The long-term oil price trend for the last 13 years has been increasing, suggesting that demand is pushing against supply. The last 5 years have shown no increase in production and decreases in exports. Therefore, I conclude we are in the vicinity of peak oil and that economic difficulties related to oil availability are upon us. I believe that we will know when oil peaked 10 or 15 years from now when we have better data if we actually can obtain it. I think we are better off making general rather than very specific predictions about the timing of events.
The peak - even for crude oil - is not yet reached. Unless there is a demand contraction or some above the ground constraints, I think the world is still able to increase its oil production.
The decline from countries like Mexico, Norway and UK can be offset by increasing production in Irak, Brazil.
If you take the first producers you get this :
- FSU : production close to peak and should remain quite flat in the next 2-3 years
- Saudi Arabia : spare capacity (> 1million bpd)
- USA : the production has increased last years and should remain flat during the next 2/3 years
- China : increasing oil production - they have the reserves to increase it again in the next 2 or 3 years
- Iran : they have the reserves to increase the production - but the limiting factor is investment I think
- Brazil : production will increase for sure with commitment of offshore projects.
- Kuwait and UAE : small spare capacity
- Irak : big (but how much ? ) increase can be expected in the next 10 years.
No peak before 2013-2015 in IMO.
Irak:
Iraq's biggest oil refinery shut by gun and bomb attack
26 February 2011
An early morning gun and bomb attack has shut down Iraq's biggest oil refinery, Baiji, with at least two employees killed.
Police said it took 50 fire engines to control the fire at the refinery, which processes about 150,000 barrels of oil per day.
"Then they detonated bombs at one unit, the al-Shamal unit, of the refinery, which represents 25 percent of the refinery's production. In the morning, we came to put out the fire, which erupted as a result of the bombs."
http://www.bbc.co.uk/news/world-middle-east-12586852
Iran:
3/7/2010
Iran needs $130 oil to balance budget
IEA: Iran's crude oil production to decline by 700 Kb/d by 2015
http://www.crudeoilpeak.com/?p=1669
24/2/2011
DAMASCUS (AFP) – Two Iranian warships, the first to enter the Mediterranean from the Suez Canal since 1979, docked at the Syrian port of Latakia on Thursday, an Iranian diplomatic source told AFP in Damascus.
http://news.yahoo.com/s/afp/20110224/wl_mideast_afp/iransyriaisraelconfl...
Thanks for the info, I was not aware of IEA forecasts regarding Iran. Yet I think the big picture remains the same. Next months will give us some answers anyway.
This is my first post to the site though I have been a constant reader for several years. My expertise, if I have any, is in the pharma industry. So this site has been a great education for me.
I have two comments on Rune’s article besides thanking him for another informative post.
First, the most interesting thing to me about the graphs is the differences in the declines in production/demand for the two recessions of the past decade. The recession of 2001-2003 created a more significant decline in production/demand for “all liquids” than did/does the 2008 – on going recession. The occurred even though the current recession, for the “classical” industrial countries, is much deeper than the 2001 – 2003 recession. Why the difference experience in production/demand declines? Is it the economic growth of India and China and other developing countries? Is it that their economic activity (manufacturing and trade) is of sufficient size and complexity that they can dampen the decline of demand from the “classic” industrial countries? If true, this is startlingly. What they could not do in 2001 – 2003 they where able to do in 2008 – now. The fact that this occurred in such a short time frame needs to be factored into all discussions going forward about the nature of the demand pressures on “all liquids”. Let me repeat this, since to me this is amazing. In a short five years the worlds fastest growing economies grew enough to prevent a recurrence of the 2001 – 2003 significant demand “destruction”. And if the last five months (Oct – Feb) is any indication then the growth occurring in these new industrial economies does not need the “classic” industrial countries to come out of recession to put significant pressure on production capabilities of the world, regardless of what happens in the Middle East and North Africa.
Second, it isn’t just industrial growth that has to be factored into the forecasts for demand. It is the type of industrial growth. The past industrial growth in India and China has basically been in non-personal transportation industrials. Going forward there is going to be significant growth in personal transport industrial sectors in these and other industrializing nations. We have a country that wants to go from 8 million new car purchases a year to 24 million, China, and India with a car company that wants a car in every “pot” in the developing world. And we know that the personal transport industrial sector is a far heavier user of oil based products than non-personal transportation sectors.
Hello Doug HJ and welcome.
What you point at, is as you put it “amazing”.
Some time back I made a chart (ref below) on how Non OECD growth had developed since 2000 and as of 2009.
As the chart illustrates Non OECD had a growth in petroleum consumption of around 10 Mb/d (35 % or an average of 3,4 % annually) during from 2000 and as of 2009.
70 % of this growth was from OPEC, China and India. For OPEC growing petroleum exports and oil price turned into higher revenues and allowed for economic growth in these countries.
China and India has also seen strong economic growth (as expressed by Gross Domestic Product; GDP) and generally a growing economy will afford both growth in oil/energy consumption and prices.
I am not sure how the split is between industrial use and private use of petroleum for those countries.
Looking at figure 06 it appears to me that growth from Non OECD (and data as of October 2010 from EIA keeps up this trend) slowed down as the oil price recently approached $80/Bbl.
The key word is "demand". We had the peak of 3 dollar oil decades ago. 80 dollar oil peaked a few years ago. We probably have not peaked 120 dollar oil yet, and if you are willing to pay 200 dollar for the oil we can keep playing a good while. Only problem is, when prices rise, demand goes down, and for just fun and game, people are not willing to pay 200 dollars for the oil. Hey, for 1000 dollar oil we got centuries of the stuff. But no one will ever afford that oil.
"Peak Oil You Can Afford" is history. For the exact date, ask people who work on Wall Street.