| Tech Talk: When oil isn’t crude and gas isn’t gas, the Eagle Ford Shale play | The Oil Drum | Tech Talk: pipelines, a help that can be costly |
World Oil Production - Looking for Clues as to What may be Ahead
Posted by Gail the Actuary on December 20, 2010 - 10:56pm
If we look at a graph of historical world oil production, we see a somewhat bumpy production pattern with two major price spikes (in 2009 $)–one peaking in 1981 and one peaking in 2008.
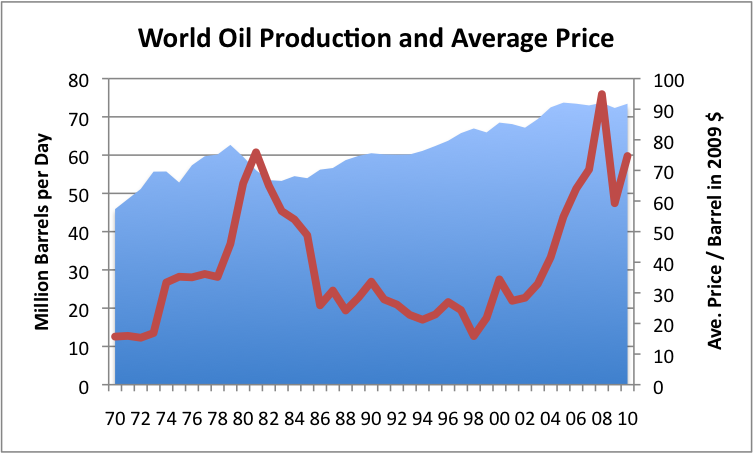
The first spike in prices occurred when Persian Gulf production dropped starting in 1980, so seems to be oil supply related. The second spike occurred when world oil production would not rise above a bumpy plateau, despite rising demand, in the 2005 to 2008 period.
In this post, I will show some breakdowns that I think give a little insight into our current situation.
All of the graphs that I have made are from EIA’s International Petroleum Monthly. The data I am showing oil production is “crude and condensate”. For price, I show US refiners average acquisition cost, since this is a data series that goes back to 1968. I have adjusted prices to 2009 levels using the US GDP deflator. The amounts shown reflect US prices; the price trend in other parts of the world would be affected by the relative value of the dollar, so would be a little different.
Persian Gulf Issues
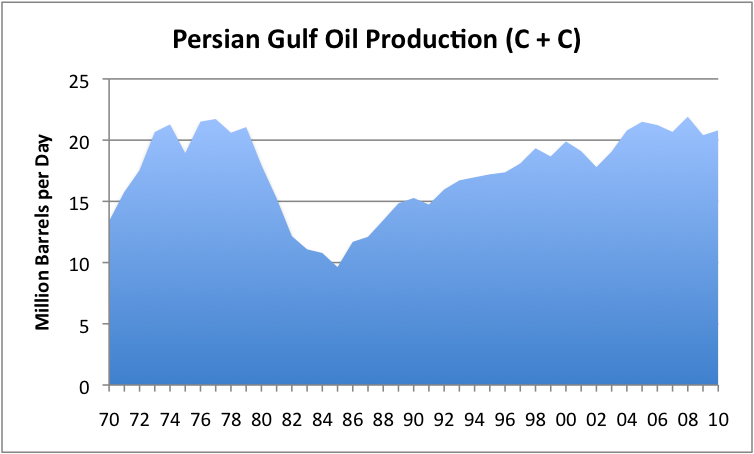
One of the breakouts the International Petroleum Monthly shows in its data is called “Persian Gulf”. It consists of the production from Bahrain, Iran, Iraq, Kuwait, Qatar, Saudi Arabia, the United Arab Emirates and the Neutral Zone. In Europe and Arabian counties, this grouping might be called the “Arabian Sea,” but I have used the naming convention of the EIA and US-made maps. If we look at a graph of Persian Gulf oil, we find that it has two big humps to it.
If we overlay the same oil price information as used in Figure 1, we see that a big drop in Persian Gulf oil production immediately preceded the 1981 spike in prices. We also see that there wasn’t much of a Persian Gulf increase in oil production in response to the 2003-2008 rise in prices, which is no doubt a big reason prices increased so much.
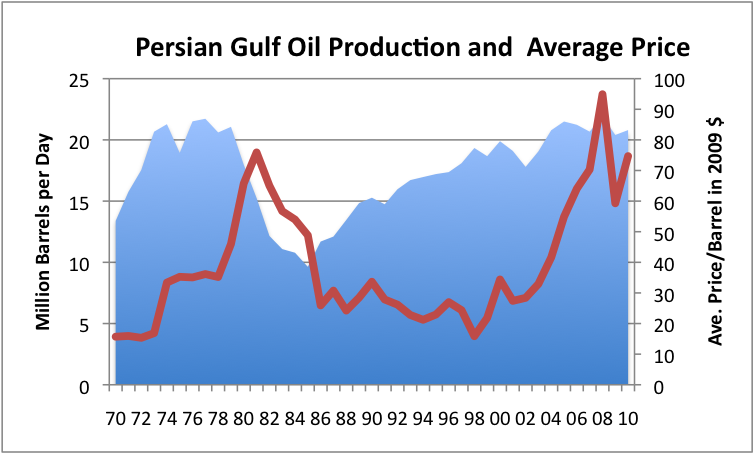
If we look at the prices in Figure 3, there is a big jump in prices occurring about 1974, (actually starting October 1973), corresponding an oil embargo by Arab members of OPEC. There was not really a major change in production at that time, however. The US was especially affected by the embargo, and the graph shows that US oil prices roughly doubled then.
What can we learn from this graph? For one thing, Persian Gulf oil production is now approximately at the same level it was at in the 1970s. While OPEC talks big, Persian Gulf production doesn’t really follow the upward trend line one might expect if the countries are really able to significantly ramp up production above the level of 35 years ago.
We also see that a drop in oil production from the Persian Gulf nations seems to have played a role in the previous price run-ups. We know OPEC played a role in the 1974 US price run-up. It is pretty clear from the graph that a reduction in oil from the Persian Gulf played a major role in the 1981 oil price spice (through cutbacks in production related to disruptions such as the Iranian revolution and the Iran-Iraq war). Based on these experiences, it seems as though leaders of the US would be worried about stability of oil supply from the Persian Gulf.
Not long after these problems, the Persian Gulf members of OPEC raised their reserves in the 1980s, without actually finding more oil–the increases seemed to be motivated by wanting higher OPEC quotas.
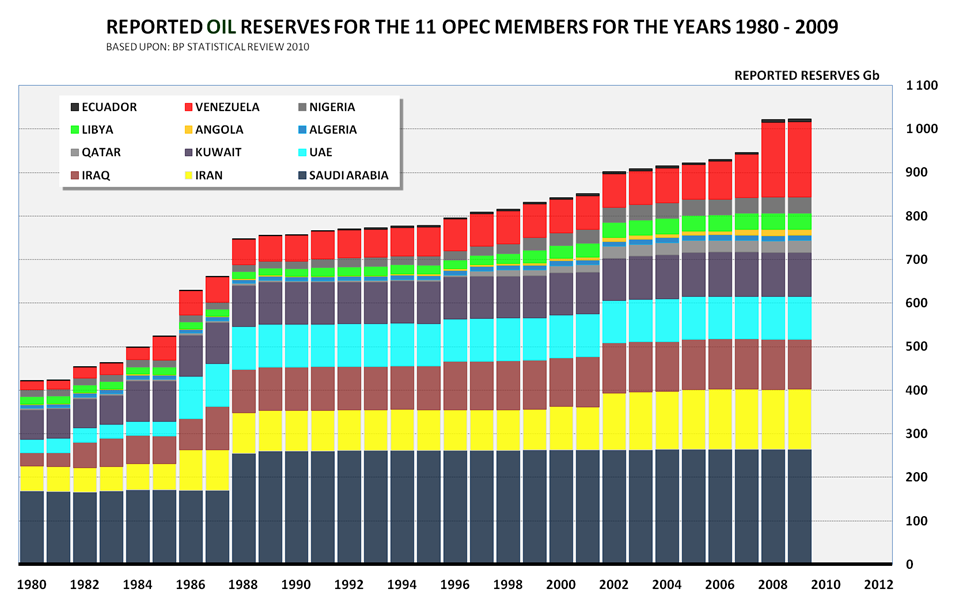
With the history of instability of supply in the Persian Gulf, and the apparent lack of physical explanation for the increase, it seems as though US leaders could have told the US people:
Don’t really believe the new reserve numbers. They are not audited, and appear to be politically motivated. The folks from the Persian Gulf have caused problems with world oil supply in the past. We need to be cautious in dealing with them.
But instead, we saw increased friendliness with Saudi Arabia, and increased intervention into Persian Gulf affairs. No one mentioned the possibility that reported oil reserves might be overstated. The American people were only told about the general dangers of imported oil, not the specific way that we seemed to be being misled. All of this seems more than a bit odd.
Recently, OPEC has been claiming a huge amount of spare capacity–now 5.6 million barrels a day, according to IEA. But in the 2004 to 2008 price run-up, the Persian Gulf nations didn’t come to the world’s rescue, except to a very limited extent – a bit over 1 million barrels a day. This adds further to the oddness of the situation.
Many people who are concerned about oil supply expect that the Persian Gulf nations will help us out in the future. But looking back, we need to understand that this is historically an unstable area. While there is a possibility of increased supply (especially from Iraq), we haven’t seen much recent evidence of the Persian Gulf’s ability to ramp up production by more than a small amount. If King Abdullah of Saudi Arabia should die and there were to be a problem with succession, or if there should be a Middle Eastern war, we could see a decline in oil production rather than an increase. Persian Gulf leaders talk “big”, but it is not clear that we should believe them.
Other Major Groupings
Apart from the Persian Gulf, some other major oil producing areas are the following:
The former USSR:
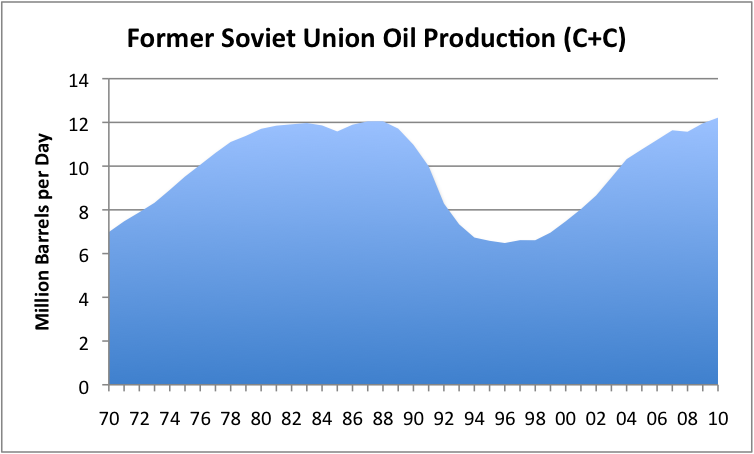
The Former Soviet Union (FSU) saw a big dip in production at the time of its fall. This drop in production was no doubt related to the breakup of the FSU. In fact, it may have been a contributing cause to the breakup. The big drop in oil production occurred when oil prices were low. As oil prices rose, and as newer technology was added, the FSU was able to ramp up production to the same level it was prior to the collapse of the FSU. Production may continue to rise a bit if prices remain high. No one is expecting a huge additional ramp-up, however, because Russia seems to be running out of large new oil fields to put on line.
The USA:
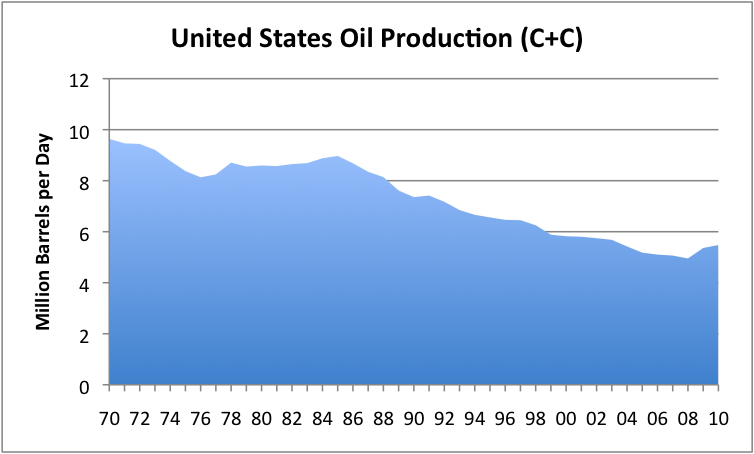
Oil production of the US has been falling since 1970. Addition of oil from Alaska helped produce an upward “bump” in the 1984 -1986 time-period. More recently, increased deepwater oil production and increased production from the Bakken has produced a small upward bump of about a half million barrels a day. Most of this increase relates to deepwater drilling. We will need to maintain our deepwater drilling if this higher level of production is to last for a few more years. Otherwise, we can expect the downward trend in production to continue.
North Sea:
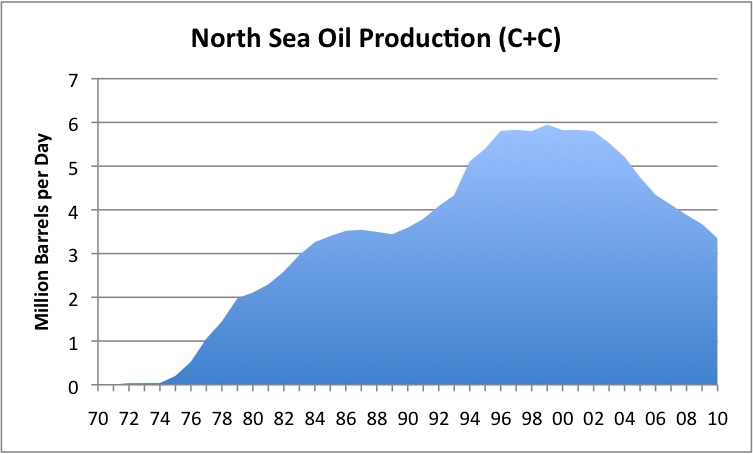
Oil production from the North Sea is Europe’s story–initially a happy one, but now a sad one. Oil production reached a peak in 1999, and now is declining every year, even with infill drilling. It is hard to see that anything can be done to make the situation better. Some platforms are likely to become unprofitable as production declines, and need to be permanently taken off line. Removal of platforms could result in a steeper drop in production.
All of the rest of the countries in the world, combined:
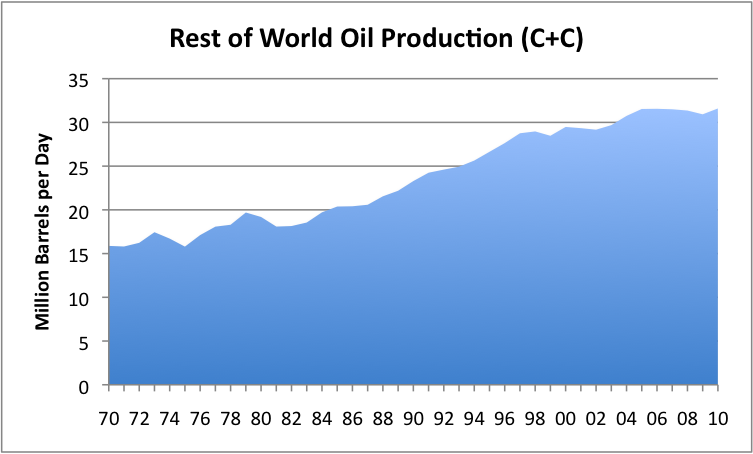
This category includes all of the locations with smaller production amounts around the world. It includes areas such as Angola and Brazil, which have recently been growing their production. It includes Canada and its oil sands. It includes all of the new countries we have been hearing about like Uganda. But it also includes many countries where production has been taking place for many years, and which are now in decline, such as Mexico.
Production from this group of countries was rising until 2005, but has been pretty much flat since. It remains to be seen whether production from this group can rise again. If production does rise from this group, one might expect that it would rise gently, since individual new fields tend to add only a small amount, and since most of the increases that are being added are being offset by declines elsewhere.
If prices stay high, there is a possibility that production for this grouping might slowly rise, adding a few million barrels a day over the next 20 years. But given this grouping seems to already be on a plateau, there is also a possibility that production could start to decline within the next few years.
Summary
Countries in the Persian Gulf would like us to believe that there are great prospects for higher production from the area. Looking back at historical production and past changes in stated reserves, we should be a little cautious about believing what we are told. We should keep in mind that there are possibilities for disruption in oil supplies from that area as well possibilities for increases. The stories we are being told about higher productive capacity may be just that – stories.
The North Sea will no doubt continue to decline in its oil production. The US with its long-term decline also faces challenges. Unless a high level of deepwater production is maintained, it is likely that US oil production will again begin to decline.
The FSU and the Rest of the World have at least the possibility of increased production, but these increases are likely to be relatively small, based on past patterns.
In total, world oil production is unlikely to rise by much, and may fall in ways that are hard to predict in advance.
Contact
- Content: editors at theoildrum dot com
- Tech support: support at theoildrum dot com
License

This work is licensed under a Creative Commons Attribution-Share Alike 3.0 United States License.
I always find it both frustrating and amusing to read this kind of analysis. Deduction based on reconstructing scores of individual pieces of evidence doesn't cut it. Since this is in totality all about numbers, we should really use more of the scientific method to infer from the 'clues' in the title of this post. So the best way to approach this is to apply a comprehensive mathematical model. I have a chapter called 'Facts in the Ground' that starts the statistical odyssey and I take it from there. I hope it fills the gap for those like me who feel frustrated by the futile atttempts at mental bookkeeping when much more powerful means are available.
The amusing part is that you can still treat this all as a Sherlock Holmes mystery and people still get a kick about reading as it were such. And that is why it is both faacinating and frustrating. The guy from Wikileaks coined the term earlier in the year - "scientific journalism".
You have a chapter Where?
I have compiled all my blog postings from TOD and MOBJ into a single document which I will make available as a PDF this January. It has equation markup and full indexing so it should be more convenient to wade through. Should be interesting to see how it plays out.
are you claiming to have a equation that predicts pricing?
Pricing of oil is not too interesting as it serves only as a proxy for an arbitrary number that is some absolute value but only is important in relative terms, i.e. as a measure of productivity exchange. Labor productivity is what I have a handle on because it really shows understandable relative measures.
http://mobjectivist.blogspot.com/2010/04/extracting-learning-curve-in-la...
"Pricing of oil is not too interesting"
Not mathematically, perhaps, but it's obviously interesting to traders '-)
I would like to see a good measure of affordability. If gasoline is down to $3 from its high of around $4 but meanwhile the unemployment rate has gone through the roof, the price doesn't very well reflect how well people can access it.
I'm really looking forward to the straight dope. Keep us posted WHT.
WHT,
I WILL BE THE FIRST TO ADMIT that I know almost nothing about statistics or higher mathematics-I did get a year of heavy duty university level calculus back in the sixties but haven't used it in over forty years, plus an introductory course in probability because it fit my graduation requirements and looked interesting as an elective.
I have looked at your blog and quite frankly in my estimation it is well over the heads of the general readership, excepting those of us who are well educated in and make use of statistics, probability, and so forth, on a regular basis.I could probably more or less make SOME sense out of it , if I were to spend a GREAT deal of time on it, but the return would be poor compared to study of other subjects more nearly within my feeble grasp.
But I haven't forgotten EVERYTHING I learned even so far back as the sixties.
In ordinary langauge, patterns that repeat in a reasonably consistent fashion literally hundreds or thousands of times must indicate one of two things, basically:
One, there exists an underlying set of causes or reasons for the consistency, and the longer the pattern persists, the more compelling the evidence that the causes are apt to apply in all circumstances, barring any evidence to the contrary.
Given that the Earth is finite, and that it has been explored pretty well for oil and gas,I can see no "evidence to the contrary" in respect to the actual results obtained by conventional peak oil analysis such as is so often published here.As a matter of fact, it would appear obvious to me as a layman -but not an idiot-that such analysts are literally certain to be correct in their predictions, plus or minus a few years.
The other reason, "two" is that there has been and continues to be some sort of super conspiracy that has been in place and lasted for over half a century which invalidates Hubbert, and all his followers in principle -and there are among them some who are expert in statistics and probability, such as professors of physics.
I notice two things in particular about your comments- you post few if any predictions yourself, and you don't seem to actually say that other analysts are making bad predictions-even if their basic methodology is somehow faulty.
So I am humbly asking you for a Christmas present from you to all of us lesser souls (insofar as our math and statistics are concerned) so that we might sleep a little easier;how about some actual predictions, even if they are just couched in general qualitative terms?And how about -if such a thing is possible-a plain language, non mathematical explaination of what is wrong with the work of others who post analysis here ?
Yours are the ONLY comments that I have any difficulty following, as a rule;something tells me I am far from alone, although I might be alone when it comes to the point of admitting you have ME snowed under-most of the time at least.
Merry Christmas!
Mac, my sentiments exactly. I wrote the below post but then decided not to post it. But after reading your post I decided I must.
WHT is a real mathematical whiz, perhaps even a mathematical genus, but it is my experience that he is no great explainer. And if you are to be read, and understood, you must be able to explain things without going so deep into mathematical equations that only other mathematicians understand you.
Even if you are a genus, to be read and also understood, you must also be a great explainer. The late Isaac Asimov was a great example of a great explainer. He was also a great science fiction writer and many females he met say he was also an absolute cad but I guess everyone has their faults. He could make you understand the most complicated problems of chemistry, physics and astronomy without pages of numbers and strange symbols. Had he wrote with the aid of these long equation then he would have been known only for his science fiction works because no one would have bought his books of scientific essays.
George Gamow was another great explainer. He was a theoretical physicist and cosmologist who also wrote science facts and theories for the general public. He did not write fiction and he write deep scientific essays in a manner such that almost everyone could understand the most complicated astronomical problems he wrote about. One of his books, "Red Giants and White Dwarfs" was the book that got me started reading books and essays on astronomy.
Alas, the world needs more great explainers like Asimov and Gamow. They were both Russian immigrants perhaps that had something to do with it. Another Great Russian immigrant explainer is a man named Orlov, but that is another story and another subject.
But I am looking forward to WHT’s paper with hopes that I can understand what the hell he is talking about, but I am not getting my hopes too high.
Ron P.
Likewise.
The first time I took a look at WHT's stuff I thought "EH??" but after investing a little more time I quickly realised that he makes a great deal of sense and has probably the only really meaningful and potentially predictive model of oil depletion that I have seen. By predictive, I mean in the sense of being able to put meaningful numbers with error bars on. I look forward to his paper, and just hope I can get my head round it before TEOTWAWKI ;)
rovman. Half ROV, half man.
In most statistical analyses, groupings are very important, in figuring out how a model is to be structured. It is interesting that WHT is not too interested in these.
You really ought to look into the topic of superstatistics (google it). The best way to think about many of these problems is applying statistics to statistical groupings. This is what dispersion is all about and am ahead of the curve in this area.
Really what I am saying is that you can't just stare at the curves. There has to be a model that underlies the numbers, and that's where my head is at.
And Ron sorry to say that I am no math genius, just a plodder who doesn't give up.
"There are three kinds of lies: lies, damned lies, and statistics."
Attribution uncertain, but possibly Disraeli.
I know nothing of mathematics (much) but I can understand graphs, and also the concept of using up finite resources. We had a coal cellar when I was a kid and getting the last few lumps out from the bottom before the coal man arrived was very difficult, and dirty.
Simplistic soul that I am I see world oil supply like this, only without the coal man coming.
Statistics are useful knowledge of things -- using a sample to determine the wider phenomena.
The Brewmasters at Guinness (William Gosset for example) invented powerful tests to determine beer quality from small samples.
Now did he lie about it? No. Guinness beer profited from his efforts. Mark twain is perhaps referring to the ability to make arguments 9say political ones) from stats, which can be quite dubious admittedly.
Has your model generated a range of lengths for oil's peak production plateau? I understand how your broader analysis could flatten out short term political, fungibilitity and elasticity issues so it is the ranges your model generates that interest me--and a good many of the rest of us here. Some of us keep a great many tracks running in our personal 'dead reckoning' systems while trying to make sense of this universe, but then by doing that we are trying to minimize entropy and you've set out to prove that is illusion as all tends toward maximum entropy ?- )
"Red Giants and White Dwarfs"
I hadn't thought about that book for a long time. It was a favorite among my small group of nerdy friends in High School, one of which went on to become an astro-physicist at a major university.
Thanks for reminding me of it, Ron.
On explanation, it might be too much to expect the same person to always be good at both. Perhaps someone who can at least follow the math could give synopses of the basics of what is being said?
Years ago I was a huge fan of both Asimov and Gamow. An amusing story which I believe was admitted by Asimov himself. He was planning to go to medical school but was so obnoxious that he was not admitted. The world may have lost an outstanding physician but most likely gained on balance. Asimov was among the best on population.
--------------------------------------------------------------------
A George Gamow Memorial Lecture Award:
" Albert A. Bartlett is Professor Emeritus of Physics at the University of Colorado in Boulder. A distinguished and dedicated educator and widely published author, Dr. Bartlett recently received the first George Gamow Memorial Lecture Award in recognition of his "most significant contribution to the public's understanding of science." Besides an illustrious career as a physicist, educator, and activist for stopping population growth, Dr. Bartlett is perhaps best known for his lecture, "Arithmetic, Population, and Energy: The Forgotten Fundamentals of the Energy Crisis," which has been given over a thousand times, including repeat performances to members of Congress at the U.S. Capitol. NPG is honored to have Dr. Bartlett as one of our Board of Advisors."
Please, I do not want to offend anyone.
WHT's maximum entropy models are mathematical models based on certain ideas in statistics, thermodynamics and information theory. I do not think that one can actually simplify them to completely non-mathematical presentation, without trivializing them to the point of waving hand and "believe me". The mathematical models of physical reality at certain moment require use of mathematics as the only appropriate language, the concepts loose their meaning without the precise language. Simplifications turn into hand waving.
With that in mind, mathematics necessary to follow basics of WHT concepts are taught in grade 12 calculus course in some high schools and every first year science/engineering college/university math course covers the material thoroughly. Sometimes he refers to stuff from second/third year engineering/math/physics repertoire, but at the same time the problems he addresses are not first year university problems either. WHT seems to be trained as a physicist with a graduate degree and as such his math background must be solid, but no wizardry required here.
Admittedly, the discovery and oil shock models are on the complex side of his derivations. But to start, I'd recommend the following entry about dispersion of wind speeds. It presents the idea and the flavour of his work and the more complex models, are well... more complex models, following same lines of thinking, but more complex physical underpinnings.
http://mobjectivist.blogspot.com/2010/04/wind-dispersion-and-renewable-hubbert.html
The math in the first part takes literally three lines and the only thing required for the first part of the article is knowledge how to calculate derivative of an exponential function.
The second part requires knowledge of what are probability density function (PDF) and cumulative probability distribution functions (CDF) and how they are related to each other (see below) and how to calculate an integral of a function. The latter is a bit more difficult than calculating a derivative, but there are free computer tools to do that, e.g.
http://www.wolframalpha.com/
About PDF and CDF, copied from Wikipedia with apologies for copyright...
PDF: In probability theory, a probability density function (pdf), or density of a continuous random variable is a function that describes the relative likelihood for this random variable to occur at a given point. The probability for the random variable to fall within a particular region is given by the integral of this variable’s density over the region. The probability density function is nonnegative everywhere, and its integral over the entire space is equal to one.
CDF:
In probability theory and statistics, the cumulative distribution function (CDF), or just distribution function, describes the probability that a real-valued random variable X with a given probability distribution will be found at a value less than or equal to x. Intuitively, it is the "area so far" function of the probability distribution. Cumulative distribution functions are also used to specify the distribution of multivariate random variables.
There are many "requests" for predictions...As far as any predictions are concerned, one can not predict anything..., but only assign probabilities to events derived from the model and projected into the future. WHT uses Monte Carlo models of his own mathematical models, to see the size of the error bars. The above blog on wind gives a clear example how to use CDF to "predict" future outcomes in the second part of the entry.
The only predictions one can make are statements such as "There is 90% probability that the wind turbine will produce 1MWh of electricity in any 10hr period".
Finally, the scary and complicated sounding concept of Maximum Entropy dispersion is not that complex: In a nutshell, imagine someone gives you a coin and asks what is the probability of heads or tails. Without the examination of the coin, i.e. in the absence of any other information, the best GUESS ( as there is no correct answer) is that the coin is fair: A fair coin has larger entropy than an unfair coin. If the coin was not fair e.g. I could see one side is magnetic, then I have extra information and have to abandon the 50/50 idea and assume some sort of skewed probabilities - and this will have a lesser entropy (because I know more about the coin). WHT assumes, every time, that the probabilities of various events in his problem will follow the pattern that has maximum entropy. That is MaxEnt.
I hope it helps in demystifying the blog and reading it.
I am commenting on it way of coming in defense of..., because I am sharing with WHT certain aspects of education and approach to scientific problems and feel WHT does not get credit he deserves for his work, for example none of his posts made it to best of TOD 2005-2010.
P.S. This is a major edit of yesterdays's post
CuriousCanuck please rest assured that you are not offending anyone.
A few years ago, well actually many years ago, I read a book called The Universe and Dr. Einstein. I was absolutely elated. I almost turned cartwheels after reading this book. Finally I understood what the theory of relativity was all about.
What I am attempting to say Curious Canuck, is that if the general theory of relativity can be explained without massive long equations that no one understands then virtually anything can be understood without massively long mathematical equations, then virtually anything can. So when you say:
I then must say: Bull$hit! Read "The Universe and Dr. Einstein" then repeat those words. It can be done Canuck. Pretending that it cannot be done is nothing but pure elitism.
But that is only half the story. If a person understands that what he/she is trying to say can only be understood by a tiny minority of the readership, then why bother? Why post a long equation that only two or three percent of the readers understand. To do so only says that "I can fully understand these equations but the fact that you do not only means that I am much smarter than you!" I have strongly suspected that this was the motive of many who do post such things. WHT will have to decide for himself whether or not that is his motivation.
Thank you for your kind attention,
Ron Patterson
It may be possible for SOMEONE to explain in easy to comprehend language, but that doesn't mean that it is possible for a particular person to explain it that way.
In other words, understanding the math and being able to explain it well in layman's terms may be two different skill sets. This might mean that WHT might have the motivation of disseminating the knowledge, but not the ability to do it well.
There are two pieces here. One is the concept, methodology. This one can be done actually quite easily and clearly in a few sentences, as the concept is simple. The issue with following WHT is that you need the math to arrive at specific results. It's like with general relativity. I can talk about curvature of space but can't explain anomalies in Mercury orbit without some math.
Let's see whether I can present the idea using math accessible to everyone...(WHT, hope you are OK, that I am summarizing your idea and blog entry trying to be really simple, but still reasonably correct)
I described WHT's idea of MaxEnt using coin analogy, a post above, I think it is accessible to everybody. Now I need a few paragraphs about what are probability functions and one tying entropy and probability:
When there are many possible results/values/outcomes in a process when randomness plays a role, probability density function (PDF) is a list of values of probability of each result/value/outcome. E.g. for single throw of dice, PDF looks like this:
E.g. This indicates that probability of throwing a 3 is 1/6.
Cumulative distribution function (CDF) is a list of numbers that describes the (cumulative) probability of all results/value/outcome being less then or equal to given value. E.g. probability that a throw of dice results in less than or eqal to 2 is 2/6 -> 1/3 -> 33.3% (only throwing one and two counts); less than or
equal to 4 - 4/6 -> 2/3 -> 66.6% (throwing one, two, three and four counts, out of six possible numbers).
Probability of throwing six or less is 1.
Here CDF looks like that:
Each PDF has its own entropy. Entropy is a number that describes how little is known about the distribution and can always be calculated from a simple formula. So if I have two distributions to choose from for my coin:
and
I will choose 50/50 based on the fact that it has larger entropy (0.693147181 for 50/50 coin and 0.610864302 for the 70/30 one)
When looking at physical phenomena where randomness plays a role, the MaxEnt principle states that we will assume that the probabilities of these random events will follow a pattern (PDF) with largest possible entropy, just like I am choosing 50/50 for my coin. This randomness is sometimes called dispersion.
That is it. The rest is application. For WHTs blog on windspeed (referenced above) it goes like this: pick a process (wind dispersion -> randomness in wind speeds), pick a measurable value that is subject to randomness (kinetic energy carried by the wind), assume pattern (PDF) with maximum entropy (pattern where wind will carry low amounts of energy more frequently than large amounts of energy). Then one must do some math, usually at the 1st year university level to obtain values that can be interpreted by humans.
PS. Edit. I read it again, and am not finding it any simpler than what WHT writes in his blog, really. Maybe I am not the person to explain things simply...
Thanks Canuck, you did a fantastic job. There are ways to explain just about anything and everything however. And your dice throwing example is explained, in beautiful detail here:
John Mighton on The Ubiquitous Bell Curve TVO.org Video
I sometimes try to tell people that the measure of everything in the universe, both animate and inanimate, falls into a bell curve. This video explains that beautifully. I try to watch at least one or two of these videos every week. I have a list of University Lecture links but this one is my favorite. It is even better than Ted because the Ted talks are all only about 20 minutes. The lectures on this site are almost always over one hour long.
Anyway, I think I have figured out my problem. I am a fantastic fan of those explain very complicated things, like John Mighton in the video above. And I just have too little patience with those who fail at this task. I am sorry, it is entirely my bias. I just set my expectations too high. Some people are good at math and some people are very good at explaining things. I should not expect that everyone who is good at one be also good at the other.
I shall try to quit complaining so much.
Ron P.
I did not have time to see the whole 54 minutes, so I am commenting in general manner bases on pieces I saw:
JUMP Math is a really good way to teach early math (know first hand), it is based on learning skills, by repetition, so that when the kids come to the stage of "getting" abstract concepts they do not have to wrestle with the mechanics.
We must be careful with the The Ubiquitous Bell Curve. The point raised on TOD again and again is that ever so often we have physical phenomena with "fat tails" i.e. results with values far from the mean are more likely than accounted by normal distribution. Normal distribution is actually ...not that common, except when discussing "mature stable populations". In common language (as in the video) when referring to bell curve, people think "most in the middle, few on the sides, and symmetrical". That's heuristic.
My dice and his dice have not much in common:
In the entropy argument I had one coin, one throw and I discussed fair v. fake coin. In his presentation he has multiple throws of a fair coin and these DO NOT adhere to a normal distribution but something called binomial distribution. If he used my fake 70/30 coin, he would NOT GET a bell curve, but something skewed.
Here, again, "most in the middle, few on the side, bell curve"
When there is change or evolution involved, other distribution usually apply.
I never meant to apply the bell curve to the production of anything man controls, only the measure of everything in nature. Obviously production curves, whether oil, automobiles or cotton would almost never resemble a bell curve. Such things are controlled by man and would have no reason to resemble a bell curve.
Evolution? I don't think you truly understand nature's distribution here. Normal distribution, in nature, always resembles a bell curve. Saying the distribution resembles a bell curve is just another way of saying what you have is normal distribution. The Normal Distribution (Bell Curve)
Whether you are measuring the speed of cheetahs or the length of a giraffes necks, the results will resemble a bell curve.
If you are measuring any characteristic of an animal, then after measuring all of them, the results will resemble a bell curve. If the animals that fall on either side of the mean have even a slight higher reproduction or survival rate, then this would cause the mean, for that characteristic, in the next generation, to move slightly in that direction, the direction of the highest survival rate. That is evolution!
Coin toss. Of course if you had only one toss, the results would not resemble a bell curve. Let's use a little common sense here. And a coin is either/or. Measure the size of grains of sand on a beach, find the mean, and plot the larger ones on the right and the smaller ones on the left, and your plot will be a bell curve. Ditto for the size of stars in the sky or the length of men's penises.
Ron P.
No, coin throwing is binomial. Just looks like a bell but is not normal . It happens many times for non-normal distribution for certain values of parameters. blood pressure - has a fat tail, cholesterol rates - has fat tail, changes in the stock maket - no (WHT made a blog on this one), prices and exchange rates - maybe, velocity of molecules - emphatic no, errors in experiments - yes. The bells look like bells, but are not normal. That is just recognition of the fact that most results fall in the middle and few around it.
Yes, if I measure giraffe penises, human necks and stuff like that, that is as I said a parameter in a stable mature population and things look like a bell. But even grain sizes are not normally distributed (log-normal is best approximation), and penis size distribution has - no pun intended - a fat tail. Symmetric distributions are not as frequent as they seem.
Using your evolutionary example, asymmetric distribution is a sign of a dynamic process preferring the values lying within the fat tail, and these might become next generations' average.
I would like your source for that information. I have read the sand example for the bell curve in several places. It is one of the favorite ways of explaining the bell curve. Google (The bell curve grains of sand) and you will see what I mean.
Sand: the never ending story
Mean, means not the average but as many on one side as the other. As many shorter as taller, as many smaller as larger. Find the mean of grains of sand and you will find that just as many are larger as smaller. Hell that is what the term "mean" means so it could not possibly be otherwise.
How would you know that Canuck? You are just making up stuff now. And that is also what you did in the sand example above. I noticed you never post links because no link would agree with what you just pulled out of your a$$. If this is the way you debate then we have nothing more to say to each other.
Ron P.
OK, I could not resist the temptation to extend the debate and get the straight facts:
wyjdsnvsl;v;dld;;kbkbhttp://www.mraverage.com/stats.htmdodjhodhpodhpodjv
I did my best to shield all the kids who frequent TOD...
Looks like, according to this purported survey, Curious Canuck may have a point.
Like this point. He said:
He just made that up! I googled it and found out. (Hint, a person who knows how to use google prevents a lot of very stupid mistakes.)
What Is Normal Blood Pressure?
I rest my case.
Ron P.
I basically don't think this has anything at all to do with how much oil will be extracted world-wide. The amount of oil that will be extracted world-wide has to do with how long our systems stay together well enough to do the extraction. Once systems start falling apart, extraction will drop dramatically, in my view. And of course, net energy will drop faster than gross energy.
In nature, things tend to follow the fractal distribution. This distribution has a much fatter tail than the normal distribution. Use of the normal distribution instead of the fractal distribution is a big part of why financial models have performed so badly.
Bravo! Gayle
We seem to have come full circle -- early posts on TOD asserted that the "stone age didn't end because we ran out of stones." Culture took off in a different direction, and the rest is history.
Similarly, discussions of the "normal" distribution of oil production or consumption are meaningful only in the context of a given oil-consuming culture -- and there will be only one of those, and for a short time at that, on this earth. There was essentially no oil use prior to middle 1850's, and for all the reasons you mention (failure of a complex civilization to hold together well enough to perform complex extraction processes) there will be none again in a few (10, 50, 100? -- not very many in any case). How are you going to construct a bell curve out of that? Fractal -- or chaotic -- is a better description.
I just don't see the point of the statistical arguments -- they are quibbling about the distribution of angels on a pinhead.
Yes, that is exactly what I have been saying. The oil extraction curve has absolutely no reason to resemble a bell curve. Humans and their politics determines the extraction rate. Nature limits but does not control the extraction rate. Bell curves are found in nature, and in the natural behavior of humans and all other animals but the production of any human produced commodity has no reason to resemble a bell curve.
Ron P.
http://www.mraverage.com/results.htm
I have to go now, will continue...
CC,
You are much bolder than I...
Ron, I understand your point and respect your knowledge...but...CC may have made a valid point on this one area of study...
And what was that point?
Blood pressure has a fat tail? No, that was wrong.
Grains of sand resemble a log-normal scale, not a bell curve? No that was wrong.
Or penis size has a fat tail? No, that was wrong.
Errr, exactly what was his valid point?
Of course only almost everything in nature falls into a bell curve when measured. The size of all the atoms in the universe would be way overloaded on the small size, 90 percent being hydrogen. And I might think of a few other things. But fat tails are caused by human intervention. Skewing the scale by hand in other words. I know of nothing in nature, unaffected by man, that has a natural fat tail. Perhaps your link above showed such a thing but that link doesn't work. Please fix it and we will discuss it. If you can show me a natural fat tail then I will agree with you. Mind you, I am not saying that such a thing does not exist, just that I have never seen such a thing.
Hint: You should always check your links before posting. This can be done with the "preview" button. Preview your post before posting, then click on your link. If it doesn't work then you can fix it before posting.
Ron P.
Ron,
Peace.
H
Peace mon. The classic TOD case of a non-Normal fat-tail distribution that is completely natural is in oil reservoir sizing.
Thanks!
I was trying to have a little fun with words wrt the graph of the penis-size distribution (which actually was /not/ normal), but...tough crowd!
Peak levity?
I was pretty sure I posted these links about blood pressure:
http://www.acponline.org/clinical_information/journals_publications/ecp/marapr99/changing_fg3.htm
and cholesterol, first image:
http://www.google.ca/images?hl=en&biw=1366&bih=541&q=cholesterol%20level%20distribution&um=1&ie=UTF-8&source=og&sa=N&tab=wi
But I clearly did not. Here they are.
Merry Christmas
Bolder by putting an unobfuscated link, or calling the skewness fat-tail?
Actually the point with blood pressure and cholesterol is stronger, the numbers show as billions of dollars spent in health care. But there is truth to the funny one too.
mean is another term for (arithmetic)average. median is the middle value.
http://www.purplemath.com/modules/meanmode.htm
The Normal distribution is just one example of a stable distribution that obeys a central limit theorem. The other non-Normal stable distributionns show fat-tails and often a skew. It is a fascinating subject area when you dive into it. Taleb describes it well in The Black Swan.
I think you are mistaking me for Nassim Nicholas Taleb and his books on the Black Swan. Lots of people pretend to understand his writing, while he berates everyone within 10 feet of his intellectual stature. It makes for interesting reading because many enjoy reading highly opinionated narratives. That's what will get to the top of the best-seller lists. If I haven't said this before, I am simply applying many of Taleb's assertions on 'fat-tail' probabilities to mathematical practice. He may have an inflated ego, but he is largely correct and I think it wise to try to apply his findings.
The same can be said for Edwin T. Jaynes, father of maximum entropy, who also had a flair for conflict in his writing. He had the gall to call his last book 'Probability: The Logic of Science' . His writing, like Taleb's is hughly readable because it maintains a sense of conflict, and if you haven't guessed, I apply many of Jaynes ideas as well.
One more guy is Murrsy Gell-Mann, who makes no bones about being smarter than the others combined. He better than anyone else has been able to explsin chaos and disorder. And i frankly don't care that his motivation is still trying to prove how much smarter he is than everyone else, even though he has a Nobel prize to put on his mantle.
I am not going to rewrite Taleb's books or Mandelbrot's coffee-table books on fractals or Jaynes writings or cofound Gell-Mann's Sante Fe institute on chaos. I am simply mathematically applying their ideas.
Besides, as Feynman once said thst 'nobody understands quantum mechanics'. I am OK with that attitude. I would probably be referencing Asimiv as well if he had said anythiing worthwhile on any of these subjects.
Web, thanks for the kind reply. And I take it all back, everything cannot be explained so that a layman can understand it. The works of Einstein can but the works of Niles Bohr cannot. At least I doubt it. Almost no one understands Quantum Mechanics. And no, Asimov never tried to explain quantum mechanics. I seriously doubt that he understood it.
Thanks again,
Ron P.
Its not always about predicting. Eveything starts from fundamentals. Only then can you obtain an understanding. I have plenty of predictions, its just that I have built up an argument in a nonlinear fashion over the years, with holes here and there that I have eventually filled in. Recompiling everything has allowed me to streamline the narrative. Above all else, this has been a hobby of mine and take it as nothing more than citizen journalism, with lots of editorial comments on the side. The models sit on their own terms and would eventually emerge whether or not I had anything to do with it.
How are you converting the trianglular oil-discovery curve into the production data?
What are the underlying functions that describe how oil is produced from the discoveries as a function of time?
Are you adding together a distribution of smaller production curves?
You could decide what you unit of time is. Then step through the trianglular oil-discovery curve and then convert that into a production vs. time curve and then add these together to make your production curve.
So I am just wondering what you production vs time equation is basically.
That is my point. Over the years of trying to understand oil depletion, I have transitioned from simple models such as triangular discovery (2005 timeframe) to more comprehensive models such as Dispersive Discovery (2007 timeframe). You can follow the narrative by sequencing through the blog posts but I figured it would be easier to recompile all this information into a more monolithuc form. When I got started I knew it wasn't going to be easy, and it still requires some intellectual investment to wade through. That's really the rationale for going through this entire exercise -- to have something writtten down cohesive enough that I can stand behind it as a thematic whole.
To answer your question in some basic terms, oil production is the time convolution of the discovery curve with an extractive profile. Something this fundamental hasn't been considered before and it forms the basis of the oil shock model. Explaining all this again in a continuous narrative was my goal.
Yes, I looked through your blog (briefly).
I saw that the oil shock model just needs you to first understand the simpler model (triangle) with single rate constant for depletion.
Oil shock has the time constant (k) changes at each shock -- reduces in rate.
Oddly there has never been the need to have an inverse shock in which the rate of depletion increases -- so does that mean the original extraction rate was the maximum figure possible? Also I thought that perhaps oil shocks were not political matters, but rather extraction rate (physical) matters and the politics was cover for a deeper problem (but that is conspiracy theory -- I know)!
So I would need to see the extraction profile function and then apply it to the triangle discovery curve to get the production curve.
Sounds like about 40-50 lines of a PERL script -- if I am correct -- it should be easy to replicate.
The multi-shock model looked very good to me in modeling the oil production real world data. Very nice work!
You should write it into a publication or a series of them.
It sounds like you have a good handle on the approach.
I think it is much harder to generate an increasing extractive force than a suppressive one. The former requires actual technology effort while the latter relaxes the effort. Therefore you may most often see suppressive shocks such as in an embargo.
That is what the math model suggestss at least, as we use it to gain the insight into what Gail seems to be just asserting. That is my point, and sorry to others for coming across as being too headstrong -- I truly believe and their are others that share this belief that some simple math models can go a long way to explaining the situation.
One of the reasons for doing this was to look at the shape of the "All other" piece, when one had backed out the pieces. The fact that its production is flat for the last several years is, to me, interesting, since it has most of the growth pieces.
I expect that there are quite a few readers who are not aware of how small a "blip" the addition of deep water drilling and Bakken production has made to US production. But this is the kind of additional production that perhaps we can expect from new projects.
I personally am not a fan of most of the modeling that is done based on past production patterns, because I don't see it as being very accurate. If nothing else, look at the diversity of patterns above. No model could have predicted them. The only grouping above that to me might be looked at from a Hubbert Linearization approach is the "All Other" piece.
There are other ways of looking at things. I show graphs of price vs production for OPEC vs Non-OPEC on this post on Our FInite World. OPEC production shows some response to higher price, but non-OPEC does not.
Deffeyes used HL and total C+C production to predict a global crude oil production peak between 2004 and 2008, most likely in 2005*. It's pretty obvious that his estimate of about 2,000 Gb in total ultimate global cumulative C+C production did not include nonconventional, but his assessment was that slowly rising nonconventional would not be sufficient to offset the decline in conventional production. As I said on the Drumbeat thread, "Slowly rising Canadian net oil exports could not even offset the decline in Venezuelan net oil exports, with their combined net oil exports falling by about one mbpd from 1998 to 2009 (BP). To paraphrase Pyrrhus somewhat liberally, based on recent data if the combined output from Canada + Venezuela is our salvation, we are truly lost."
In any case, so far at least Deffeyes has been right on all counts. Despite US annual oil prices exceeding the $57 level that we saw in 2005 for five straight years, with four of the five years showing year over year increases in oil prices, it appears likely that we will see, through 2010, five straight years of global C+C production being at or below the 2005 annual rate. This is in marked contrast to the rapid increase in global production that we saw from 2002 to 2005, in response to rising oil prices.
IMO, Deffeyes has been the most accurate of the current Peak Oil Prognosticators.
*His erroneous observation about a 2000 peak does not constitute a prediction; he never backed away from what his model showed, i.e., a peak in the 2004 to 2008 time frame.
I love your comment:
The EIA shows this graph for Venezuela.
Production has continued to fall since 2008, including Orinoco heavy oil production.
For Canada, EIA shows this graph:
Recent data indicates that production to 2010 has indeed been flat, as forecast by EIA. So Canada isn't saving the world either.
I think you are correct about Deffeyes using a 2000 GB URR in his early estimates. Seems like I've seen that somewhere before (or maybe it was Campbell in 1998). Besides, if you had charted the HL tail of global production starting with the annual production in 1983 through 1998, the HL line would have "predicted" a URR of just under 1950 GB.
The run-up of production from 2002 through 2005 shifted the HL regression to a URR of just under 2200 GB (during that same time C+C total oil consumed had increased by another 177 GB).
The HL URR calculated at the end of 2006 was ~2230 GB.
The HL URR calculated at the end of 2007 was ~2260 GB.
The HL URR calculated at the end of 2008 and 2009 was just under 2300 GB.
From all the data I've been able to gather, it looks like total global oil production is approximately 1160 GB as of the end of 2009.
When all the data for 2010 is figured in, the calculated URR is likely to decrease only slightly from 2008 and 2009, still just under 2300 GB.
But there seems no plausible scenario to take the URR up to 4000 or even 3000 GB.
In any case, we are and/or have been near the "halfway" point in the past few years.
Using a 13-month, centered, recursive MA, the "annual" peak in C+C production still sits squarely on September/October 2005 although the shoulder months from July-December 2005 are quite close and are not significantly (statisitcally) different from the Sept/Oct values.
Interestingly, although the February 2008 value and the "spike" (and thats what it was) of July 2008 were higher than the May 2005 peak monthly value, the 13-month MA value for 2008 is more than 100,000 BPD lower than the 2005 peak. Thus, longer term trends show a "wavy" decrease from 2005 values.
The current production increase "wave" for 2010 is once again flattening. So far, each new wave, when averaged in this way, comes out with a decrease of just about 100,000 BPD when compared to the previouos wave peak.
How many more ripples before we begin the long descent? It does not sound like many.
Of course, your mileage may vary.
I know you believe your model has predictive power, but I am not convinced of this.
Your model is developed for smaller parts of the world, with very different economic conditions than we are likely to have going forward. It seems to me that it presents an upper bound to what might be extracted, if investment is adequate, and prices remain high enough (and there is not a huge improvement in technology). More and more oil will be used in the production of oil, further adding to the shortfall in what is actually available, relative to what you are forecasting.
Gail
It may help to look at the major transitions in fuel consequent to the 1973-81 OPEC oil crisis. Oil was cheap and was used for power plants. (From memory) after OPEC embargoed oil to Denmark, power production in Denmark was strategically transitioned from >80% on oil to >80% on natural gas. Similarly France shifted from oil to > 80% on nuclear power.
Recommend exploring those strategic shifts in oil use to fill in the major decline in oil use after the price spike and the resultant "slow" recovery.
You are right, there is a whole additional story to be told about the transition at the time of the 1973-1981 oil crisis. I thought about including the story in this post, but decided it would make it too long for a single post.
My understanding is that in 1970s Denmark transitioned from oil-fired power to mostly CHP (Combined Heat & Power), with District Heating, burning imported coal. They had multiple convenient coastal locations. Most of which still exist. I was told by one of their generating Directors that there was something of a panic at the time.
The French as you know, went nuclear.
UK promptly moth-balled recently built oil-fired power stations like the Fawley 1GW station where I had been a construction worker as a young man in 1965. That station came out of mothball only during the miners strike in 1984. UK still uses coal (mostly imported) for electricity, providing around 35%, but currently in this recent cold period, 44%.
EDIT: export databrowser gives a rough idea of the different timing for transitions through 1970s and 1980s. Interesting variations on timing in these 3 countries. http://mazamascience.com/OilExport/
Thanks Phil
Do you have any suggestion as to how many of those oil-fired power stations are still mothballed vs being converted to natural gas? e.g., if renewable fuels were available cheaper than oil?
Any suggestions on data distinguishing coal fired CHP vs natural gas?
David
This would need a bit of research to provide a proper reply.
For the UK, oil has been less than 2% of UK generating capacity for decades. Apparently, (by 2007), 3 oil-fired stations were retained for emergency, including Fawley. The latter saw a permanent closure of 1GW in the 1990s and the remaining 1GW has a 'standby' role. That site now has 2 gas turbines for on-demand peak/load balancing as required by the grid. The grid also retains access to a large number of emergency diesel generating sets owned by institutions and private companies across UK, for example water utilities.
There are currently planning applications for a number of dedicated smaller power stations planning to burn imported vegetable oil (palm oil). IMHO a lunatic maneuver; could make money but devil take the tropical rainforests and world food etc.
For Denmark, I would need to make a personal request to my friend the retired Director, but I remember his talk of 3 years ago that suggested that lack of grid control of CHP output was still relatively recently a complicating factor in integrating wind-generated supply. From databrowser you can see that NG has been part of DK's energy mix for a while now.
For me it is interesting that "Transition" started around 1973/74 but took a while to ramp up, especially for example, French nuclear. Big gas from North Sea started to come ashore in UK but not Denmark: the really big NG phase did not replace coal much until 1990s, both countries. N. Sea oil on the other hand appears not to have played a part in electricity generation. Again see databrowser for broad picture of history of comparative energy use.
If you want details from present situation in DK, I can make my contact on your behalf. Let me know
phil
The article is neither frustrating nor amusing. You probably have not read it at all since your comments are irrelevant. The above article plots the past oil productions of countries as they are reported by the producers. Hence, no scientific method is needed here. Scientic methods are perhaps good if forecasting is done which is not at all the aim of the article. It looks like your harsh comments are the introduction for peddling your own blog.
Yeah, we all know that when it comes to the scientific method, anecdotal information, circumstantial evidence,and subjective assertions always win, hands down.
Its amusing in the same way that if climate scientists started relying on anecdotal temperature readings and circumstantial evidence ("boy, its been an awfully warm winter") to further their arguments. Please explain why I can't push for something more substantial without me getting accused of peddling some agenda. We all know that oil depletion analysis has barely any scientific toehold as it stands and its not doing us any favors to argue over anecdotal information and treating the subject as some sort of whodunnit, solved by making assertions where no cause over effect has really been established.
Can you briefly describe the techniques you think will produce better analysis, and give the results of your analysis?
The technique is too think logically about the situation, get a paper and pencil and work it out like a word problem using probability concepts. The result is that you can eventually start to understand how the numbers came to be. The results of the analysis to me is always about an understanding.
Do we ever work in numbers that reflect the CO2 increases per cubic meter of oil, as we move from light crude to tar sands?
Here is some recent research. The second link is the key image of charts.
http://pubs.acs.org/doi/full/10.1021/es1019965
http://pubs.acs.org/appl/literatum/publisher/achs/journals/content/estha...
The study is highly technical, but it seems to ignore the fact that the vast majority of greenhouse gas emissions (about 80%) occur when you burn in in your car (the well-to-wheels analysis). The processing and distribution (well-to-pump) is just part of the big picture.
Also in the modern world there is a lack of alternatives. There is not a great deal of difference between Arabian Heavy, Venezuelan Extra-Heavy, and Canadian Bitumen. Comparisons with Arabian Light and West Texas Intermediate aren't helpful because those are becoming increasingly scarce on the world market.
huh ? what saudi aramco calls heavy crude is 26 to 29 deg api. manifa 26 - 29 deg api, safaniyah 27 deg api, for example.
http://www.allbusiness.com/mining/oil-gas-extraction-crude-petroleum-nat...
Okay, maybe not Arabian Heavy. 26-29 degrees API is not considered heavy oil in most parts of the world. Substitute California Kern County Heavy Oil (12 degrees API).
Uhmm, that was the point. With constantly decreasing EROI well to wheel, doesn't CO2/useful work increase with denser crude? Did Karras mention 42 api somewhere? What's the EROI on tar sand SCO, what with steam extraction, backfilling the holes, etc.
It's not just that we're using up the oil, we're using up the easy less polluting oil. And not just CO2, but real pollutants. Did I mention I live a few hundred feet from Richmond Chevron Refinery? And Greg Karras is the technical driving force behind the blocking of Chevron using heavy crude input to it?
I think that what these studies miss is while the CO2 per cubic meter of oil increases, the number of cubic meters of oil produced each year goes down. The forecasts based on BAU assumptions thus substantially overstate the effect of a shift to heavier oil. It seems like if we looked at it at TOD, we would want to combine the two trends. I would think the downward trend in oil production would quickly overwhelm the impact of rising CO2 per cubic meter.
if the motive was to increase quotas by lying about reserves, only iraq was able to pull off an increase in quota proximate to a (lied about)reserve increase, uae saw their quota decrease with increased (lied about) reserves. not very successful criminals, imo.
could you explain how saudi arabia had a motive to increase quota by increasing reserves, ca 1989 ?
saudi arabia may have had a motive to understate reserves prior to 1989, as that is the year nationalization was complete, according to chevron. nationalization was accomplished by paying chevron, etal book value for their reserves.
http://www.chevron.com/countries/saudiarabia/recordofachievement/
and on the subject of how reserves can increase by means other than exploration:
http://www.saudi-us-relations.org/energy/saudi-energy-reserves.html
ghawar is another field that has already produced previously estimated reserves.
A country might want to increase reserves, just so the leaders look good in the eyes of the citizens, and so that the people of the world look up to the nation. Without oil reserves, Saudi Arabia is pretty much a pile of sand in the desert. There is no way that it could support its current population (especially as they now live) without the sale of oil.
People assume higher reserves means the possibility of higher flow, and this doesn't necessarily go together. Some of the oil in the Middle East is very heavy. There may not be much chance of high flow, even with high reserve amounts.
Gail, as you obviously know, and everyone else on this list should know by now, OPEC never based quotas on reserve numbers. In the early 80s there was some discussion of doing this but such a plan was never implemented. However just the belief that OPEC might do such a thing in the future was enough to get the massive reserve increase ball rolling.
At this late date I doubt that any OPEC member really believes quotas will ever be based on reserve numbers. Now it appears, as you suggest, it is mostly a matter of prestige. One ups-man-ship is a way of life in the Middle East. Of course every OPEC member knows exactly what is going on here. What is shocking however is that the rest of the world seems to be totally oblivious to this fact.
Ron P.
I know that OPEC never based quotas on reserve numbers. In fact, I agree with everything you are saying. The reserve amounts seem to me to be mostly a game of one ups-man-ship, with little connection to reality.
I've posted an excerpt from the NYT in 1990 which mentions Iraq making noises about increasing reserves another twofold, which was met with appropriate ridicule. This just goes to show that these numbers can be fiddled about with at will, lest there be any doubt. By the same token reserves are certainly not static - the US has produced more than its past reserves numbers, too. The whole concept isn't of much value, imo. Better to work out ways of ascertaining when a nation will peak based on other criteria. One can visualize a model based on length of time producing, age of various major fields, length of sustained output, discovery curve, etc. An actuarial approach, in other words, rather than relying on infinitely malleable assessments from geologists and suppositions about the future of oilfield tech.
the us oil reserves have been exploitated based on rule of capture and maximize pv principals. saudi aramco's exploitation decisions have been based on maximizing ultimate recovery. therefore a model based on 'length of time producing, age of various major fields, length of sustained output, discovery curve,etc.', using the us as an analog, is invalid.
applying a depletion rate to 'calculate' reserves for saudi arabia is as a$$-backward as a 'calculation' can get. half of saudi aramco's proven reserves are proven undeveloped and therefore have a depletion rate of zero.
applying an hl to a country producing at less than capacity, such as saudi arabia, is equally invalid.
you want a forecast of future production ? use the megaprojects approach, only this time make provisions for omissions and less than mega-sized projects. do so by history matching past megaprojects(yeah, include the thunderhorses and everything else) with actual production to calibrate the forecast.
There is a shocking fact in Wright's "The Looming Tower", where he mentions that since at least the 80s the Saudis have massively inflated their population numbers for the purpose of looking big next to their Arab neighbors. In the 1980s a U.S. study determined that out of a claimed 12 million citizens there were really only around 5 million. If a country is willing to lie this brazenly about their own population, how does anybody trust their oil reserve claims?
I think of Matt Taibbi. His book blames the 2008 oil price shock on speculation by Goldman Sachs, but then naively quotes OPEC to prove that oil supply did not cause the prick shock. As shady as Goldman is, they got nothing on the Saudis. The fact that so many otherwise level-headed people believe them is an odd blindspot in our national psyche.
The influence of Saudi Arabia in international politics is proportional to its capability to control the oil price. This is obvious. And therefore the motive for Saudi Arabia to inflate its reserves, and its production capacity, is also obvious. They wish to control the foreign policies of the powerful oil-dependents, the US and Europe.
saudi's reserves and production remained rock steady through the '08 - '09 price girations.
Saudi Arabia's production did move up and down a little during the '08-'09 price gyrations. The biggest move was down, when the price dropped. According to the EIA, Saudi Arabian oil production (C+C) hit a high point of 9.7 million barrels a day in July 2008, the month with the highest prices. It was lower both before and after July 2008, dropping to 8.1 million barrels a day in February 2009. It is now back up to 8.6 million barrels a day.
Gail
Thanks for this useful summary.
(Will also be useful additionally to see WHT's update of his discovery / probability model in due course :)).
You do say regarding Canada as part of 'Rest of World'
As the post is about Crude + Condensates, your numbers actually exclude oil that is processed from very 'heavy' sources, which I understand almost entirely rely on Canada's Tar Sands and Venezuelen Tar? Such sources would need a separate analysis?
best
phil
The way the EIA assembles its data, what it calls "Crude and Condensates" includes all Canadian production, including Tar Sands. So Canadian tar sands is included in my numbers.
It appears that Venezuelan tar is not part of Crude and Condensate, but it is a smaller quantity. According to EIA's Venezuela Energy Profile, for 2009, Venezuela produced crude oil of 2,239,450 barrels per day, and total oil (presumably including tar) of 2,471,500 barrels per day, so the tar portion was about 232,000 barrels a day.
Canada's bitumen has not been increasing much--it only keeps Canadian production level, helping offset decline elsewhere. I expect heavy oil around the world will be growing, but there is no easy way of getting it from EIA data, since some of it is buried in a lot of the production. Even in OPEC, some of the planned new projects is very heavy oil.
Canadian production and exports are steadily increasing, and have been for some time, as shown in this graph from the EIA.
What the graph shows is that Canadian conventional production peaked in the early 1970's, and then started falling with most of the decline coming out of exports to the US. Exports went almost to zero in the early 1980's.
However, in the 1980's oil sands started coming on production in large volumes, with most of the incremental production going to the US market. Canadian production is now mostly non-conventional, and most of that non-conventional oil goes to the US. As I am fond of pointing out to people, Canada now exports more oil to the US than it consumes itself.
Canada is a big importer of petroleum coming to ports on its East Coast. It is these imports that allow Canada to have enough oil to export to the US.
Once Canada starts running into problems with oil imports, it is hard to see that its exports to the US will continue to rise (unless somehow oil sands production is growing a lot more than it has been recently). Either Canada will demand that the refined products needed by Canada be exported back to Canada, as a condition for the US even getting a part of them, or Canada will start figuring out ways to keep more of what it produces (perhaps shipping bitumen East by rail car, and reconfiguring refining capacity to handle bitumen).
These are a couple of graphs from a post I wrote in September 2009.
My forecast at that time, based on hoped for increases in oil sands production, suggested that in total oil available to Canadians might remain flat:
Canada is a big importer of petroleum coming to ports on its East Coast. It is these imports that allow Canada to have enough oil to export to the US.
The big East Coast refineries in Canada export 2/3 of their output directly to the US. It isn't as if there are a lot of consumers in Canada's Atlantic Provinces, and the refineries are some of the biggest in Canada. They are really just processing imported oil for the US market, since the US doesn't have enough refining capacity of its own.
Once Canada starts running into problems with oil imports, it is hard to see that its exports to the US will continue to rise (unless somehow oil sands production is growing a lot more than it has been recently).
Note that 1 million barrels per day is about what the entire state of Texas is producing these days. And that's just the production of one oil sands company.
Either Canada will demand that the refined products needed by Canada be exported back to Canada, as a condition for the US even getting a part of them, or Canada will start figuring out ways to keep more of what it produces (perhaps shipping bitumen East by rail car, and reconfiguring refining capacity to handle bitumen).
Under the NAFTA agreement, Canada can't do that. However, it would be economically inefficient to do it as well. What would be economically more efficient is to move the population West rather than the oil East, which is basically what is actually happening. However the Easterners don't like to think in those terms. Alternatively they could start stringing power transmission lines down the East Coast from the hydroelectric sites in Labrador.
My forecast at that time, based on hoped for increases in oil sands production, suggested that in total oil available to Canadians might remain flat
Note that in the graph, the total production (all liquids) increases from about 2.3 million bpd to about 4 million bpd. In reality, almost all of that incremental production (1.7 mmbpd) would go to the US. Certainly imports decline, (it looks like from around 800,000 bpd to 400,000 bpd) but that would be economically efficient.
Other energy sources (of which Canada has huge amounts) would back oil imports out of the market. At the prices oil would be trading at, Canadians would not want to use any more of it than absolutely necessary. They might have to take public transit to work, but Canadians are used to that. They'd just bring back electric trolley buses and streetcars. Except in Toronto, which never gave up streetcars.
I don't really expect NAFTA to hold for the long term. If push comes to shove, I expect those with the power (or rather oil) to set the terms, and those in need of oil to accept the term forced on them. If the US doesn't do as Canada wants, I expect Canada will see if it can get better terms selling the oil to China (shipping bitumen to the West coast by train). Alternatively, I can imagine Canada figuring out how it can refine the oil itself, and use it in Canada.
I would caution against believing company plans regarding increases in oil sand production. Actual ramp up has been much slower than hoped for. I would not be surprised if future plans to have similar ramp-up problems.
The main reason Canada signed the NAFTA production-sharing agreement is that many Canadian politicians prefer it. The provincial governments, which own the resources, don't want the federal government interfering in their marketing of it.
Canada may very well start to market the oil to China. However, the fundamental reason they don't ship it to Eastern Canada is that it is too expensive to ship it that far. There would be no fundamental problem modifying the refineries to handle it, except for the cost.
I would caution against believing company plans regarding increases in oil sand production. Actual ramp up has been much slower than hoped for. I would not be surprised if future plans to have similar ramp-up problems.
Actually, it has ramping up quite nicely.
(thousands of barrels per day)
Note that is an increase of 1 million barrels per day in 14 years, or an average of 9% per year. Suncor's plan to increase production involves an increase of 10% per year for 10 years. It's not a serious stretch of the imagination.
The production scale up is still a lot less than what initial plans were for. In the whole scheme of things, production is still tiny.
Total oil sands production is still 1.5 million barrels a day, while US imports from Canada are 2.3 million barrels a day. Thus, as you pointed out earlier, quite of bit of the US's imports from Canada are still oil that Canada has imported from elsewhere, refined, and exported to the US.
I imagine increases in production going forward will depend a lot on investment conditions. If loans are difficult to get, there may be very little scale up in production.
The production scale up is still a lot less than what initial plans were for. In the whole scheme of things, production is still tiny.
Some developments have been deferred, and it is true that in the global context oil sands don't amount to much. If the biggest oil producing field in the world, Saudi Arabia's Ghawar, follows Mexico's Cantarell (formerly the second biggest) and falls off a cliff, oil sands will not save consumers from a major hit in the pocket book.
However, it's important to the US. The oil sands are now producing more oil than the entire state of Texas. If American refiners can't get oil from Canada, they are really stuck. They don't have alternatives. Venezuela and Mexico certainly aren't good alternatives.
I imagine increases in production going forward will depend a lot on investment conditions. If loans are difficult to get, there may be very little scale up in production.
I don't think they intend to borrow money. They intend to fund their expansion through cash flow and joint ventures with international companies.
Suncor Energy unveils ten-year growth strategy
Reading between the lines, they've run out of exploration opportunities internationally and offshore, and Total (the big French multinational) is in a similar position, so they're pooling their money and putting it into oil sands. The alternative is to go out of business, which is what I think a lot of oil companies are going to do in the not-too-distant future.
RMG: I think NAFTA applies only the federal gov't jurisdiction i.e. bulk water. Private company exploiting oil in Athabasca can sell the oil to whomever it wants.
http://www2.parl.gc.ca/Content/LOP/ResearchPublications/prb0633-e.htm#interpreting
Here is what the EIA shows for Canadian net oil exports (BP shows a slightly lower number):
As you noted, the gross exports number to the US does not take into account East Coast imports into Canada. From 2005 to 2009, the EIA shows Canadian net exports increasing by 370,000 bpd. BP shows an increase of 220,000 bpd over the same time period. I suspect, but don't know for sure, that part of the difference may be attributed to biofuels.
To put the 2005 to 2009 increase in Canadian net oil exports in perspective, over the same time frame BP shows that Saudi domestic consumption increased by 600,000 bpd. In other words, based on recent data, it would take the increasing net oil exports from two to three Canadas to just offset the recent increase in Saudi consumption.
What you show is net oil exports from Canada.
If one looks at net oil imports that the US gets from Canada, it is a fairly much higher number, because it includes the oil that Canada has imported, refined, and shipped to the US as refined products.
This seems to be leveling off at 2.3 million barrels a day or so, presumably since the imported and re-exported oil is down.
As I said, the chart is "Canadian net oil exports." I'm not sure what the difference is between "Canadian net oil exports" and "Net oil exports from Canada."
And I think that the key difference between the Canadian net export number and imports to the US is that Western Canada is a big exporter, while Eastern Canada is a big importer. I don't think that there are any pipelines of any consequence between western and eastern Canada.
What I am showing is "US net oil imports from Canada". (What it is "net" of, is exports that the US sends back to Canada.) It consists of oil from the oil sands, plus other oil that the US imports from Canada. Much of this other oil was originally imported by Canada from overseas (for example, North Sea or Middle East), refined in Canada, and sent on to the US. As Canada loses imports, the US is likely to lose this oil. That is most likely why US net oil imports that I show appear to have leveled off at 2,300,000 barrels a day.
What you showed up higher on the thread are "Canadian net oil exports". These are "exports minus imports", looked at from a Canadian point of view. Essentially, it would exclude all of the "pass through" exports the US gets from Canada--the oil Canada imports from overseas, refines in Canada, and sends on to the United States. These seem to be dropping as imported oil of all kinds becomes more rare.
It looks like the math works out the same way, but the simpler definition of net oil exports is domestic production less consumption. Here is the model I use to explain it:
"Production Land" has 2 mbpd of crude production, but no refining capacity.
"Refinery Land" has 2 mbpd of refining capacity, but no crude production.
Each country consumes one mbpd of refined product.
Production Land exports 2 mbpd of crude to Refinery Land.
Ignoring refinery gains and energy used for crude and product transportation, Refinery Land refines the 2 mbpd, consumes one mbpd of refined product, and exports one mbpd of refined product back to Production Land.
Production Land's net exports are two mbpd (production) - one mbpd (consumption) = one mbpd (net exports).
Refinery Land's net imports are zero production - one mbpd (consumption) = -one mbpd (net imports)
I don't think that there are any pipelines of any consequence between western and eastern Canada.
Well there are, but at this point in time their primary function is to deliver oil and products to the US. Actually moving oil from Western Canada to Eastern Canada is something of a secondary function.
It wasn't planned that way, but that's the way is works at this point in time. It's one of the consequences of NAFTA. Western Canada is supplying the US with crude oil, Eastern Canada is supplying the US with refined products. Keeping Canadians supplied is just something that happens as a by-product of keeping Americans supplied. It's all about money and keeping those Yankee dollars flowing into Canadian pockets.
This seems to be leveling off at 2.3 million barrels a day or so, presumably since the imported and re-exported oil is down.
Pipeline problems. There are major problems on the pipeline system moving oil from Canada to the US.
Export constraints back up Enbridge
Enbridge rations more oil pipeline capacity
To put the 2005 to 2009 increase in Canadian net oil exports in perspective, over the same time frame BP shows that Saudi domestic consumption increased by 600,000 bpd. In other words, based on recent data, it would take the increasing net oil exports from two to three Canadas to just offset the recent increase in Saudi consumption.
And to add a little more perspective, during the period when Saudi domestic oil consumption increased by 600,000 bpd, Canadian oil consumption declined by 190,000 bpd. Saudi Arabia subsidizes oil consumption, Canada taxes it relatively heavily. Canadians took a hard blow in the pocketbook and they just stopped driving so much.
Saudi Arabia used to be a quaint desert kingdom with about 6 million people. Now they have over 25 million people and one of the highest birth rates in the world. By the time they run out of oil, they will have more people than Canada (35 million) or California (37 million). At that point their economy will be based on sand and camels again. It will not be a happy experience for their population, (as if it were at this point in time).
The Canadian approach (reduce domestic oil consumption, sell more to other countries) is more rational in a world of high and increasing oil prices. Canadians are used to taking buses and streetcars, they can get used to using them more often.
Sorry for being ignorant but what do you guys refer to as "BP" in these reports.
NAOM
They are referring to the BP Statistical Review of World Energy which BP publishes every year and which contains statistics on world energy markets.
It's free and is commonly cited by people wanting data, but I'm not completely convinced it is as authoritative as it claims to be. It's BP's view of the world, and BP is only one company. Other companies will have different data and different ideas of what the data means.
BP tends to be particularly poor for Canadian data because they do their best to ignore the oil sands. This makes their data meaningless in predicting future Canadian production.
I find the CIA World Factbook a better source for data on most countries.
Thanks, I was trying to think of another BP due to the 1 company issue you describe.
NAOM
Canadian crude oil production is no longer increasing. It's been oscillating around 2.6 mbpd for 4 years. True, Canadian crude oil production saw a significant advance from the year 2000 to the year 2003, then slowed considerably to 2006. Canada is producing at the 2006 levels now.
Obviously what's happened is that conventional barrels have been replaced by unconventional barrels. Accordingly, any optimism about meaningful future increased in Canadian oil production are unwarranted.
G
Canadian production was generally flat around 2.7 MMbpd from 2007 to 2009, mainly because the East Coast Offshore production started to decline in 2007, and onshore conventional production continued to decline, while not much new oil sands production came on stream because some projects were deferred due to high costs and low prices.
However, 2010 and 2011 should see a significant jump in production because some new oil sands projects are coming on stream, Saskatchewan is adding production from the Bakken Formation, and East Coast offshore should not decline as much because of drilling of satellite fields.
The Canadian Association of Petroleum Producers (CAPP) forecasts oil production will average 2.81 million bpd in 2010, 2.96 in 2011, 3.07 in 2012, 3.18 in 2013, and 3.23 in 2014.
Long term, the oil sands companies are planning some major expansion. Suncor is planning to increase its production to 1 million bpd over the next 10 years, and Syncrude is talking about adding another 500,000 bpd over a similar period. This largely depends on continued high prices, though.
Gail - thanks once more for an interesting review of oil production history. I find it very useful and helpful to understanding to break out the information in this way and I appreciate your work in doing this.
Some things never change. Every time someone presents us with this type of analysis WHT steps up to the plate to remind us we are all scientific and mathematical illiterates and only he in his mathematical modeling brilliance really understand what is going on. And there is always the promise that he will shortly publish something that will make it all clear to us. Hasn't happened yet.
Each piece is so different that it is to me helpful to break it out. I dislike the idea of fitting curves to something I don't understand. Curve fitting to me is of quite limited value--even more so, if I don't understand the pieces in question.
You sir are a liar. I promised once that I will release a document and that was earlier this month and I said it will be out in January. Everything I have "published" is via blog and this document will be a cleaned-up manuscript of my blog postings. Of course its been in the works for awhile, I can't edit 700 plus pages overnight, but I never promised anything more than what I have already written. That is the nature of a blog and if this new way of doing business bothers you, I can't help it.
Will you be submitting a summary overview post to TOD (if its editors approve it)?
I don't see why not. But then again, it will be available as a PDF so you can read an overview inside the document.
While one can read the overview inside the document at your site, one won't get the feedback on your site as on TOD.
Someone can always do a critical review on TOD.
Prior to the Aramco takeover it was in the interests of publicly traded companies to keep some reserves in their back pocket, so they could book a small annual increase regardless of exploration success, and keep the shareholders happy. Also the SEC specified that only proven reserves (P1 or 90% probability) could be claimed by companies listed on American exchanges. Aramco had neither motivation, so probably just changed to full reporting of P2 reserves. Smaller OPEC members almost certainly bumped up claimed reserves to get a better quota, but it is very doubtful that KSA did. The real issue is the unvarying reserves for 2 decades or so, regardless of production or possible E&D success.
The thing about the reserves is even if they are right, they don't tell us anything about Saudi Arabia (or anyone else's) ability to increase production in a given year. The only way I could imagine that Saudi Arabia reserves might be right is if they include a substantial amount of very heavy oil reserves, that can only be extracted very slowly. We shouldn't be counting on such reserves for quick production, any more than those from the Canadian oil sands or from the Orinoco area of Venezuela.
Here I must respectfully disagree. Those vast Saudi reserves, if they were correct would tell us a great deal about Saudi Arabia's ability to increase production in a short period of time. If those reserve numbers were correct then Saudi could easily increase production by 4 to 6 million barrels per day in 30 days or less. If those figures were correct then they could just poke a few more holes in the ground and double their production to 16 to 20 million barrels per day in one year or two at the most.
Bottom line if those massive reserve numbers Saudi publishes were real, then that would speak volumes about their ability to rapidly increase their production.
Ron P.
Suppose that the reserves are for bitumen or some other very heavy oil. Then the amount produced each year is likely to be miniscule, even with a very high reserve amount. You are assuming that the reserves are for a type of oil similar to what Saudi Arabia has produced to date, but that doesn't need to be the case.
Gail, give me a break. You know better than that! Saudi does not have any bitumen. Yes, they have a "tar wall" that borders part of the northeast side of Ghawar, but it is thousands of feet deep. But even if they counted that it would only add about 20 GB or less to their reserves. But not to worry, Dr. Saleri says they have 900 billion barrels of ultimate reserves.
Oil Innovations Pump New Life Into Old Wells
Ron P.
no he did not say that, according to nyt.
saleri went on to say:
now where did dr. saleri say 'they have 900 billion barrels of ultimate reserves'?
Well, I can only take the New York Times word for it. If you wish to call them a liar it is okay with me. But if you look at the sidebar, which I reproduce in my post above, it says:
But I suppose you are saying that the New York Times is just lying here, that Dr. Salari did not say any such thing. Well we have your word against that of the New York Times. Okay who do we believe? Boy, that is a real toughie. The credibility of Elwood verses that of the New York Times.
Well, take your pick.
But the question must be asked: Did the New York Times have sources that Salari said this? Does Elwood have sources that he did not? Well, again, take your pick.
Boy that is a real toughie! Not!
Ron P.
i am saying that you are lying in claiming 'Dr. Saleri says they have 900 billion barrels of ultimate reserves' - (based on the nyt article).
i wouldn't be surprised if the nyt created the graph to sell newspapers.
i wouldn't be surprised if saudi aramco's proven reserves exceed 260 gb.
In the back of my mind, what I envision Mr. Saleri to be thinking is that by steaming the source rocks, or by using some other sophisticated, slow technique, Saudi Arabia hopes to get the ultimate recovery up to a very high percentage. But I expect this oil will be coming out practically by drips, over many, many years.
So I would expect the pattern of oil extraction to follow the very slow pattern we see with very heavy oil, rather than the pattern for we see for light oil extracted using natural pressurization or water flood.
dr. saleri was obviously talking in abstract terms about an event that wouldn't surprise if it happened in a few centruies. saleri won't be surprised, he will be dead, imo.
Naw, Saleri has no idea what he is talking about. He stated in 2005 that he got his information from the United States Geological Survey!
Doubts Raised on Saudi Vow for More Oil
This is a riot! The EIA gets its information about Saudi Reserves from Saudi and Saudi gets their information from the USGS. But Price is right, the USGS has no credibility whatsoever. But then of course, neither does Saleri. I would take the word of the four American oil companies over either. They said there is little evidence of Saudi undiscovered oil. That is what we suspected all along.
Ron P.
Ron - At the risk of butting my nose into this debate but let me toss out my unasked for opinion: I could care less what the URR the KSA might be or that of any other country. I know y'all understand what I'm about to say as well or better than I do: it's the flow rate...not the URR. I can point you to a field in Texas that has made 20 million bo to date. I have no doubt that its URR will be 2X or 3X that amount. But that additional oil is coming out the ground at a little less than one bopd per well. Yes: 100 wells producing a little less than 100 bopd...total.
I understand that y'all have gotten embroiled in the technical aspects of URR. But some day the KSA max production rate may be just 2 million bopd and they still may have a few 100 billions bo to produce. I doubt the prospect of all those billions of bo will help the world economy very much.
Rockman, no you simply do not understand. Everything you say is absolutely correct, but that is not the problem. And I don't care about the technical aspects of URR. Here is my bone of contention:
The world believes that OPEC has massive reserves of over one trillion barrels. The world believes OPEC has over 6 million barrels of excess capacity per day with almost 5 million of that belonging to Saudi Arabia. The world believes that OPEC can increase its production to 41 billion barrels in the next few years. And the world is basing its energy policy on these beliefs!
And that Rockman, is my point of contention.
Ron P.
Ron - Check my post again: I think you and I have the same bone of contention to chew on: irresponsible assumptions regarding future production rates.
You are correct Rock. Thanks.
And I need to point out that in my post above I meant to say 41 million barrels per day not 41 billion barrels. 41 million barrels per day is what many say will be the "call on OPEC" by 2020.
Ron P.
No problamo Ron. I knew I was jumping into the middle of a heated debate with some chance of friendly fire. LOL.
yeah sure ron, you alone know what saudi aramco's reserves are.
no the nyt reported that price said that saleri said.....
the nyt article starts out talking about production capacity and meanders off to undiscovered resources - what is the point. half of saudi aramco's proven reserves are proven undeveloped.
Actually I have no idea what Saudi reserves truly are. I have guessed, several times in the past on TOD, that they were somewhere between 60 and 75 billion barrels, but that is just a guess.
But there is one thing I do know. And that is that they have nowhere near the 267 billion barrels they now claim. And I am not the only one that knows this, almost everyone on this list is well aware of that fact. Well, everyone except you of course.
And yes, the reporter did say that Saleri said. But only Elwood knows what Saleri really said. And everyone except Elwood is lying about what Saleri really said.
This whole exercise of who said what Saleri said and who is lying and who is telling the truth about what Saleri said... is really stupid. Really funny but stupid nevertheless. What Saleri really said it totally irrelevant. He is just spouting the Saudi line. Hell, what would anyone expect him to do?
Ron P.
are you sure you are allright ? you appear to be having trouble comprehending plain english and now confusing fact with opinion.
i assume you are refering to saudi aramco. saleri specifically stated that their proven reserves conformed with p1 guidelines. you can find that in the link i provided above.
i have documented reserve additions of 21 - 41 gb from 1990 through about mid '90's. an additional 7 gb condensate reserves could easily have been added from stated gas reserve increases since '89.
saudi aramco has produced essentially 60 gb since 1989, with up to 41 gb documented through the first half decade.
Here is a chart that shows the price of a barrel of oil in terms of how many you can buy for an ounce of gold:
http://grab.by/80u4
Right now it is about 16 which is the same as it was for most of the 1990's. Until that chart makes a new low there is no market recognition of peak oil. If gold continues to rise or hold steady, then oil must rise to at least $220 before that chart makes a new low. If gold simply follows its 5 year trendline, then oil will need to hit $300 before that chart makes a new low.
I would expect the gold/oil ratio to go below 1:1 when the market acknowledges peak oil. I dont think you need to be a mathematical genius to figure out how much oil will need to cost then. At this point the market is completely and utterly convinced that Iraq (and a fairy godmother or two) is going to save it.
The price of oil partly depends on how much benefit it provides to society. At some point, the price has to stop rising, since it becomes priced too high relative to other goods and service. History shows that the US economy tends to go into recession, if the price of oil (in 2009$) exceeds $85 barrel, according to the work of Steve Balogh and Dave Murphy.
The Steve Balogh Graph shows a relationship between oil prices and recessions, what is does not show is governments responded to inflation by putting up interest rates.
It was the high interest on loans to businesses and mortgages that pushed an already weaken economy into recession not the price of oil.
An extra $30 a month on fuel is trivial but an extra £300 on a mortgage for millions of people does far more damage.
Sorry but that is just not the case. Long term mortgage rates ticked up from about 6.25 to 6.5 percent. That hardly added 300 dollars or pounds to anyone's mortgage. And of the people that bought houses during that short period of times were but a tiny fraction of all home owners. The vast majority of homeowners have fixed rate mortgages.
The price of oil causes everything to go up, from gasoline to cement to asphalt. It is the percentage of GDP that counts. And historically virtually all recessions have been caused by high energy prices.
Reproduced with the permission of Mortgage-X.com
Ron P.
Well it wasn't just the tick up "from about 6.25 to 6.5 percent". It was also the the fact that a large wave of loans given out with low ~2% (or no interest) teaser rates were going to expire and they would be hit with real mortgage rates of 5 or 6%. There were loans that really were a house of cards. They just assumed that they would re-fi again with some cheap rate and/or have a job to cover the mortgage. But when they lacked a job or the house became worth less than the mortgage . . . they walked. And the entire housing market collapse. And it is STILL collapsing even though we try not to talk about it.
I think both contributed significantly. Neither one completely dominates the other. And they are linked. High oil prices makes the value of homes that are far from work worth less thus helping trigger the housing collapse. A housing collapse makes people feel poor so they are less likely to burn oil.
On Amazon, the "Carlton Sheets Investor's Edge - How to get CASH at Closing" VHS tape is selling for from $0.01 New and from $0.50 Used.
You can get his whole Investors Edge course with 7 DVDs and 12 CDs for only $65.00.
Perhaps some people here would like his "How to Overcome Fear" tape -- buy it now on eBay for $3.95.
People were misled into thinking house prices couldn't fall, so they bought too much house (bank fault) and then borrowed against supposed increases in equity for living expenses (bank/borrower fault). The banks invested bad bundled securities (investment house/rating company fault).
It was all based on the theory house prices couldn't fall (economics professor fault).
40% financialization share of the economy is an insupportable parasitization. Short term profit seeking leading to crappy jobs here, because the (too) high-paying jobs went to even crappier paying jobs overseas.
Americans used more than they made. Financial dealings MOSTLY don't increase wealth, they just distribute it upwards. Economy collapses, is revived by extreme methods, will collapse again, since we still consume more than we make. Admonitions to consume more are mistaken.
Henry Ford was an anti-Semite, but he understood wages and the banker mentality. Workers have to be able to buy their products.
I'm sure that is true. What will be interesting is what happens this time as oil price continues to rise. So far it's bounced back from 35 to close to 90 and as Chindia continues to have expanding economies, the price will surely go skyward in the months and years ahead.
I view the situation moving forward as being even more precarious than what happened in 08. As oil price rises into triple digits, there might not be an obvious culprit like subprime mortgages to act as a catalyst for dropping the oil price back down. It might seem more like a constrictor slowly squeezing the life out of the economy. A medium trickle of foreclosures and business shutterings, along with governments at the fed, state and local level that are tapped out financially from being able to offer any assistance. This slow constricting action might keep the price of oil from reaching so high it causes another temporary collapse.
The other factor that will be tough is the inevitable austerity measures that will at some point need to be applied to a financially weakened populace. There will probably be big property tax rate hikes to pay down debt and keep the roads paved, that will greatly pressure those that have just barely held on to their homes.
I would describe the first major economic step down in 08 as analagous to a boxer having been knocked down. The current build-up to the next collapse will probably be more like a boxer getting caught in the corner for way too long by a seasoned body puncher. We'll reach a point where we'll want to go down, in hopes it will cause an oil price retreat that will allow the illusion of another 'Recovery'.
Firstly you should know with a complex system such as oil production, it only takes a small change close to the tipping point to make a very big difference.
Secondly you need to look at the interest rates over the last 40 years and not just for the 2007-2008 period.
Thirdly the financial crises of 2007-2008 had many factors besides the simplistic and obvious fact that oil prices went up. Take a look a graph of US or for that matter UK household debt, it went up to unprecedented levels over the preceding 6 years.
The housing market is a complex system, what we saw with the housing market is many sub prime people had their ARM rate adjusted upwards to a level they could not pay. This had a massive knock on effect with repossessions and banks loans going bad. Banks started having cash flow problems and were not lending to businesses and for home loans. House prices started to fall and people on all levels on the housing ladder either could not get further loans on their homes or did not want to.
The wiki link sums it up, but I must warn you it does not have oil in it so some people here dismiss everything that is not oil related, no wonder the message of peak oil does not get across.
It is part of the problem not the entire problem.
http://en.wikipedia.org/wiki/Subprime_mortgage_crisis
Also their have been several recessions where oil price is not a factor at all, so stop trying to make a foot fit into a glove.
The ARM resets were only in the US.
The spike in oil prices was global.
The recession was global.
I agree the ARM resets were in the USA but Lehman Brothers went bankrupt due to their massive exposure to subprime many other banks found they had invested in this of financial pyramid con trick. Suddenly banks did not know who it was safe to lend to so they did not.
The problem started in 2007, well before oil went over $100
http://en.wikipedia.org/wiki/Lehman_Brothers#Subprime_mortgage_crisis
Oil prices did not help but it was over borrowing the the late 1920s that caused the crash then not oil. The 1950 recession was caused by high inflation/interest rates due to Korean war. If you want to find only one reason for periods of high inflation WARS are by far the most prevalent factor.
But the causes of recessions are varied.
http://en.wikipedia.org/wiki/List_of_recessions_in_the_United_States
Again oil prices will not help, but a well run economy in all other areas would be able to cope, trouble is they are all run very badly and therfore easily knocked over.
"Oil prices did not help"
It sounds like we can agree that the recession was cause by a combination of factors in which oil prices played some role. If we had really healthy economy, it doubtless could have handled this first oil price shock better.
I would just point out that another way oil played a role is in the long run up to the current situation. The world and the US in particular got used to decades of on-average more and more abundant energy, mostly from oil and other ffs.
This situation lead to expectations that this would always be the case. All sorts of crazy gambles that wouldn't have made any sense in a more steady state economy seemed to work on the way up Hubbert's Peak. So the very shenanegans in realestate and in complex derivatives were fostered by decades and nearly centuries of increased access to energy and expectation of the same lasting for ever.
By 2007 we had already had nine years of exponential growth in oil prices and it was starting to look to more and more people like something more serious than a temporary glitch, especially when oil production did nor respond, as economic theory taught it should, and even started to plateau in 2005 even as prices kept going higher.
Best wishes for a well run economy arising in the near future. I'm not holding my breath.
When the Federal Reserve raised target interest rates in the 2004 to 2006 period, Steve from Virginia showed that the Federal Reserve Open Market Committee raised interest rates in response to the increase in the inflation rate in food and energy products caused by the rise in oil prices. Thus, there is a very direct tie between the rise in oil prices and the rise in interest rates.
Gail
Could you please tell me how high interest rates get oil prices down?
You, I and the local businesses all have only so much money to spend, because of the size of our paychecks, or how much money consumers spend of their paychecks. If interest rates rise, people have to cut back on spending somewhere else, because now they are spending more on their loans. The cutback in spending affects discretionary items like new bigger homes, and new cars. Oil is used in building new cars and in transporting materials needed to build new bigger homes. The drop in demand for oil because of spending cutbacks leads to a drop in the price of oil.
Gail,
Everything you said is correct, but there is an additional reason why high interest rates tend to lower the demand for oil. High interest rates tend to discourage business investment in plant, equipment, and inventory and thereby lower the GDP, which reduces the demand for oil. Other things staying the same, a lower demand for oil will also lower the price of oil.
Reality, however, is messy. The Fed uses high interest rates to reduce the amount of inflation. And often one of the driving forces of inflation is rising oil prices. Thus a rising price of oil can be associated with rising interest rates, especially when expectations of higher inflation in the future drive nominal interest rates up.
Agreed, regarding both points. We know the interest rate increases in the 2004 - 2006 period were accompanied by discussion in the Federal Reserve Open Market Committee about rising oil prices and their inflationary impact. Then we had the crash in subprime mortgage market and falling home prices.
Gail
The UK bank of England policy team is already making statements about worry over inflation and some commentators are predicting a rise in interest rates to 2.75% over next year.
We agree that oil prices damage the economy, but high interest rates do the same. It is mad that the government responds to high commodity prices by damaging the economy further with high interest rates.
Not sure what the answer is but perhaps reduce oil demand via taxes and use the tax to invest in public transport. Would this not be better?
I see many in UK with massive mortgages and debt losing their homes if interest rates go up alot.
regards
Interest rates and inflation rates tend to move together--otherwise the "real" inflation rate (the nominal interest rate minus the inflation rate) will become negative, and people will begin to borrow money just because it is possible to come out "ahead" by borrowing money. So what happens is
Oil prices to go -> inflation rate in general goes up -> interest rates go up
Also, regulatory officials want to get the inflation rate down, so it will try to raise interest rates, to reduced demand and bring interest rates down.
So rising oil prices and rising interest rates tend to go together, and both damage the economy. This brings oil prices back down, and sends the economy into recession. What we tend to get is oscillating oil prices, unless something truly bad happens to the economy.
On the other hand, the price of oil is set in an international market. There is a massive increase in demand for oil in places like China and India--where for example the middle class is buying automobiles for the first time. So the combination of declining availability of oil due to peak oil and increasing China/India demand could well sometime in the future overwhelm price-induced demand cutbacks in the U.S. and other first world countries.
I don't know whether anyone here saw this article a couple of weeks back (http://seekingalpha.com/article/240571-bubbleomics-10-year-oil-price-pre...), but A. Butter defines the affordability of oil in an equation:
Fundamental price of oil = 3.33% X World's GDP / World Oil Production
and graphs this versus time. Anytime the price of oil goes above the fundamental price we tend to have a recession. If the price is below the line we are expanding.
It is also interesting to note that the fundamental line changes with time. Currently it is at or a little above $80 per barrel, which is in the ball park of S. Balogh & D. Murphy. However, it looks to be trending up yet.
Butter did a more recent article where he expanded on this concept a bit more:
http://www.marketoracle.co.uk/Article25009.html
Will this gold/oil ratio be distorted by the loss in confidence of the dollar? My first thought was that fluctuations in the dollar would affect each equally, washing out the distortion. However, the price of gold is affected more by loss of confidence in fiat currency than oil, since gold is a common hedge (relative movement is an unverified assumption). Let's assume that assumption is valid for the moment. Recent movement in gold has been largely due to increasing US deficit, debt and debasement policies. If these conditions increase the price of gold more than they do the price of oil, then it could be assumed that without these conditions, the price of gold would be relatively lower, making the gold/oil ratio lower.
Just curious if you had considered this and if so, if you come to the same conclusions...
Gold bugs! There is nothing but a confidence game going on.
Comes the crash, you can't eat gold. OR buy anything with it. Maybe you could cast it into bullets, after the old car batteries give out.
Irrelevant!
I see no reason to compare the price of gold to that of oil. The price of gold has more to do with lack of confidence in the financial system than it does to movements in oil, per say.
Moreover, there's good reason to believe oil won't hit those numbers, not for awhile anyhow. Ongoing recession/depression is demand destruction, and when it hits China, all I can say is watch out below.
I have profetized for a couple of years of a comming gold speculation bubble. I believe we see this coming right as we speak. If so, you will get A LOT of oil for your gold bar in coming years, no matter what happens to oil. But it is just a matter of gold prices rising faster than oil prices.
It used to be fashionable to declare a need for another "Saudi Arabia" worth of oil to meet future demand. It turns out it can be sourced directly from American overconsumption. As long as oil production worldwide remains on a plateau, U.S. consumers will gradually be priced out of the market for petroleum to feed rapidly growing economies elsewhere.
U.S. oil imports are falling. NPR this morning declared 2006 the permanent peak of U.S. gasoline consumption. China and India are carving that Saudi Arabia worth of oil out of us, since in any case it was never ours to begin with.
The U.S. and western Europe have already entered our own post peak world. Asia gets a reprieve for as long as they can tap into our overconsumption.
An interesting way of looking at it. I agree that the US and western Europe have entered their own post-peak world. This is what is making finances such a problem now.
Don't be such a wet blanket, Gail.
Haven't you been listening to the business news?
Everybody is pretty sure that in 2011 the market is going to roar; 3.5% to 4% growth, easy. Employment will pick up real soon.
The sentiment seems overwhelmingly bullish. QE2 is working. The market is responding. Profits are up. There is going to be a big correction in the precious metals. The possibility of a double dip is, "Off The Table".
Pesky debt levels are on the back burner. Everybody has been backstopped.
Go back to sleep.
No Worries;-)
“Overconsumption” is qualitative.
Not be difficult here but if the US “over consumes” than what is “proper” consumption? 0.5* US consumption?
The global average per capita consumption?
The global average per capita ex-US consumption?
3.047 bbl per family of WTI equivalent per year adjusted for regional temperatures??
We are consuming a finite resource so unless the utility of the output of a consumed bbl is greater than the utility adjusted for duration (if you will) embedded in a bbl of oil the net/net utility of using oil is negative, therefore any consumption greater than zero is negative.
And how do you measure utility? We all have different utility curves..
I think that qualitative statements such as “over consumption” are an extremely slippery, and often unproductive slope.
Rgds
WeekendPeak
Come on, WP. Are you just being defensive here? Do you really think that having 4% of the worlds population and using about a fourth of the worlds oil isn't overconsumption.
I do agree that as you get closer to parity, exact measures and comparisons of things like utility can get tricky, but the US consumes so much more per capita than just about anyone else, it seems like sophistry to say that because we can't precisely measure utility that we can't recognize overconsumption relative to the rest of the world.
But ultimately you are right that any consumption of a limited resource is over-consumption, unless what is produced is of greater potential energy value--like building very long lasting renewable energy infrastructure, perhaps.
Mmmm….
Well, perhaps I got out of the wrong side of my bed this morning…
However, I’m not defensive, just (on occasion) a stickler for attempting to define terms as accurately as possible to avoid misunderstanding and miscommunication.
One can argue that the rest of the world has an under consumption issue. After all, things are apparently so bad here: we’re building a wall between the US and Mexico not to keep people of escaping TO Mexico. US waters of FL aren’t patrolled to prevent US citizens from escaping to Cuba. Think TSA, retina scanners etc…. you get the picture.
Not that I believe for a second that the US (consumption) model is something the ROW should follow, (it is plain impossible) but my point simply is that terms like “overconsumption” are highly, highly subjective.
I once read somewhere “the only responsible use of non-renewable resources is to build a renewable society”.
That sounds about right to me.
Rgds
WeekendPeak
"Not that I believe for a second that the US (consumption) model is something the ROW should follow, (it is plain impossible)"
You can split semantic hairs all you like, but this sounds to me like a pretty good definition of overconsumption--if it impossible for the rest of the world to consume at that level.
Wakernagel (www.myfootprint.org), Merkel ("Radical Simplicity"), and Ramachandra Gupta ("How much should people consume") are some of my guiding lights on thinking about how to define (or at least get some handle on) overconsumption. It is perhaps the most important term to define in our time.
If the average US citizen can't be said to be overconsuming, I guess we'll just have to retire the word and find a new one. See the article in the recent oildrum about modern Americans using 11,000 watts/day (more than whales use) versus 250 for hunter/gatherers.
Perhaps I am in a way responding to the sense of doomerism which is somewhat prevalent on this site, the peak “fill in the blank” movement as well as in my own psyche, and would like to offer an alternative angle.
The US per capita consumption of many inputs is significantly higher than the ROW per capita consumption. Although that fact is pretty much indisputable (yes, there are always exceptions in certain tiny countries for certain inputs) it could be interpreted as a symptom rather than a cause an sich.
The US has the advantage of being a country of immigrants. Immigrants are likely to be a bit more driven, risk seeking, and in all likelihood younger than the population they are leaving, and those advantages accrue to the host country – in this case the USA.
That gives the US a significant positive self-selection bias in terms of population, and the countries from which the immigrants originate a disadvantage. The effect is likely to be most pronounced in the first generation with some kind of a decay in that positive effect in their offspring. Add to that active culling efforts in other countries of the highest IQ part of the population (Cultural revolution in China, Pol Pot in Cambodia, Stalin, Hitler all liked lining up the “intellectuals” and shooting them – talk about introducing a negative IQ skew in your population) and it should come to no surprise that the US, which has not yet done such a thing, had and has a relative advantage in its workforce.
When these slightly better than ROW average people get to the US and are relatively unconstrained in terms of other inputs because they were in effect in virgin territory it should come as no surprise that there was an explosion of productivity and commensurate consumption.
As an aside, we all want “more”. It is part of being human. Nobody wakes up in the morning with the goal to have less, know less and be less healthy, make worse pasta than yesterday, at the end of the day . Nobody tries to be downgraded when they’re flying business class to coach - it is against human nature. If that desire for “more” can be channeled into a direction which does not destroy our environment is a different discussion.
Asia and Europe specifically have been externally constrained for 100’s of years (Diamond’s Collapse) and their societies and mentalities have developed accordingly. Average house sizes are much smaller in, for example, Japan and Europe than they are in the US. In Japan a public bus turns off the engine at bus stops. In the US a public bus will keep idling while the driver is on lunch break.
The US is only recently starting to become aware of external constraints and for now that awareness is likely to be limited to certain parts of the population.
One can argue that the US has an advantage in that there is so much fat which can be cut, although no cutting of anything is painless. Every time I see a 100lb woman in a 5000lb SUV I cringe yet at the same time there is a tremendous opportunity to change things and become more efficient in a relatively painless way.
Dohboi, as you pointed out, the US has 4% of the population yet uses a quarter of the resources. If the US cuts resource consumption by a small amount it will change demand/supply dynamics significantly. How that temporary slack is used though is a political question and given the political system here where you can buy access to decision makers cheaply I am less than positive on that.
Rgds
WeekendPeak
WP, thanks for your very clear elucidation of the theory of American exceptionalism in your first few paragraphs. You are certainly not alone in holding this position. I'm not sure if you see this more as an explanation or a justification, or if you see any difference between the two.
I certainly share the pessimism expressed in your final lines about the current political situation.
On your point: "Nobody wakes up in the morning with the goal to have less" I must point out that many people, especially 'religious' people, throughout history have done just that. I am tending to think that it is some such religious awakening that is required now on a global level. Perhaps you could lead the way? I'm too tired.
Exceptionalism is not a justification imho to be a resource hog, but I think it may to some degree, though clearly not solely (nod to rovman), explain what has happened in the US along with having a huge resource base. Add to that cheerleaders who in all likelihood benefit personally from high entropy and you have a country with huge productivity/consumption.
Is it sustainable? It’s hard to see how, especially given the generally higher marginal utility extracted out of a given resource in other countries. Like I’ve said before, a soccer mom driving to the mall in her SUV cannot compete against 3 guys and a chicken on a scooter driving to the factory.
The political situation in the US is interesting because other countries with relatively fewer natural resources (think France, UK, Germany, Netherlands etc) ARE willing to make painful choices and redirect at least some (nonrenewable) resources towards at least attempting to build a more renewable society. They are also making other changes in the entitlement culture. Yes, the population doesn’t like it but at some level understands it needs to be done. Retirement ages are going up. Individual contributions to education are going up etc.
In the US obvious things like a gradual introduction and increasing of a national gasoline tax and a coherent, gradual rezoning is much less likely to happen although a combination of those 2 could make a huge difference over time.
But as long as you have a political system where select people can buy influence and there is a revolving door between wall street and DC without the sense of duty which often exists in other countries that is not going to happen.
But hey, the people accept it. There are no protests in down town Manhattan or in DC. No general strikes. Some people may write something in the comment section of some newspaper website but that’s it.
After all, Kim Kardashian is more important than crazy skewed income and wealth distributions.
Again, well put.
***Warning- sarcasm alert!***
Alternatively...
People never voluntarily leave home, friends and family, therefore:
1. They were sold the idea that life would be much easier in the new land (They were stupid).
2. They saw the opportunity to grab what land and resources they could from the native people and make a buck (They were greedy).
3. They were forced to leave their home country. A home country would never expel the useful, clever, productive members of society, it would kick out those too poor, stupid and lazy to make it in the competitive crowded old country.
Those genetic traits would carry on, leading to a country viewed by the outside world to be populated by slightly stupid greedy people.
Nah, it could never happen, right? ;)
*Runs and ducks for cover...*
When you stick your head above the parapet like this, you'll probably draw mortar fire.
Excellent sarc.
It can be hard to outdo reality with satire. For one thing, the advertising that drew immigrants to North America - and not only the USA - was sometimes over the top. And for another, it seems that countries may be prone to expel or kill their most useful, clever, productive citizens (hardly ever the others) - envy (on the part of the stupid and lazy) seems to become an overwhelming force when things break down. (N.B. add the French Revolution to the list WeekendPeak gave.)
You can't really believe the U.S. imports smart people, can you? Since 1965 it has essentially been dirt poor, third worlders via chain migration. There's a reason the schools of California rank much lower than those of Denmark. Anyhow, the U.S. doesn't really over-consume the oil, the oil is consumed here because many people here are more economical productive. You can't over-consume anything really, oil has no use when left in the ground.
To which I append: a recent study put the energy needs of a hunter gatherer at 250 waking watts, 90 sleeping. The average energy consumption of an American is 11,000 watts.
I wonder what that means to you and your
Sounds like NPR were parroting this article from the LA Examiner, where we are informed that "Defying all the “experts,” gasoline demand in the U.S. has dropped 8% since 2006 when demand peaked." That'd be great if it weren't just a load of context free BS. Someone mention to this schmuck that we're in a recession, for starters.
YOY change in US gasoline demand for 2008-2010 was -297/-4/111, this last being tentative of course but won't change by much unless every car in the country grinds to a halt this instant. Add 'em up and you have cumulative savings of -189.97 kb/d, which will be largely gone next year, all LEAFs and Volts notwithstanding a whit.
Article also mentions some DEO report promising a 20% drop in demand by 2030, with the world "awash in gasoline." Golly. Wonder if they include the expected half a billion cars in China in that report. "Roughly" half a billion, of course. In that ballpark.
.
There seems to be nothing on the supply side to explain the price rise. The dollar index falls by about 30% during 2001-2008, but the inflation of the dollar only explains part of the rise.
Which leaves the credit bubble in the US as the main driver of demand that supported a higher oil price.
Risks to the economy are not simply a function of oil production volumes, but have had more to do with rapid changes in oil supply which result from political and financial causes, e.g. the oil embargo and the 2008 price spike. It is not just O(t) that matters, but dO/dt.
After 2005 there is a lot on the supply side to explain the price rise. That is when the oil supply stopped growing.
Ron P.
Agreed. That is the problem. No one came forward with enough additional production to make a difference, even though OPEC "talked big".
Most of the price rise occurs before the oil production plateaus. It's hard to tell from the graph, but the price goes from about $30 to $60 / barrel during 2001-2005, while production was rising. The subsequent rise after the plateau is percentagewise less. Since the price rise clearly precedes the plateauing of production, it is difficult to see how it is caused by the plateauing of production.
(Although what happened to the $140 / barrel peak? What is the smoothing function used on prices?)
These are average amount that refiners paid for oil during a month (adjusted to Sept 2010 $). Since it is a monthly average, the average is lower than $140, since the high point that was hit for only a day or so. Also, the average includes lower grades of oil than West Texas Intermediate. The amount also reflects the actual amounts refiners paid, which could include the effect of contracts purchased in advance.
Speaking of oil price, CNBC rolling ticker shows oil at 89.80 but http://www.oil-price.net/ shows a lower price of 88.81
Up until the past few days those figures matched up. Maybe CNBC is now simply posting an oil price of a higher grade, but if anyone knows more, please enlighten.
NYMEX Light Crude Oil closed at $89.82. Don't know what is the problem with Oil-Price.net but what they are posting is simply wrong. There is only one grade of WTI which is what is traded on the NYMEX. You can also get Brent quotes but Brent settled at $92.74 today.
Ron P.
I've emailed that link to ask what gives on oil price vs. the actual close of 89.82.
The most interesting thing is that the latest price spike occurred with rising to flat production while the one in the 1980's was against falling production.
On the face of it it would seem the current spike was purely demand driven i.e demand was outstripping our ability to supply oil.
If you look prices rose even as a significant increment was brought online early on. Far more oil than had been added over a short period of time for a while.
And of course when the economy went down prices cratered since as the graph shows it was primarily the large increase in demand over a short period of time that was driving prices. Only deep cuts in OPEC production are keeping prices up now.
Fascinating but is it true ?
My point is that the two price spikes seem to have very different reasons comparing the two may are may not be correct.
Given the sharp increases in prices in both cases it makes more sense to at least consider that falling supplies was likely the root problem.
If so then the ability of demand for a good to push price up by multiples even as supply is flat or rising is a problem that needs to be addressed. This does happen but as far as I know only via ponzi bubbles a natural market requires falling supply to spike prices.
The 80's price spike has its own set of issues but our current one seems to have more. I don't like the fit to price/production in either case.
The reason it makes no sense is that it is being gamed by large players, who often collude, I think. Think Enron about gas supplies.
the '90 - '91 price spike appears to have been driven by speculation alone.
It only lasted 8 months before returning to the secular mean, too. Fun stuff, pricing at the margins.
Here's some rockin' volatility:
Clearly, volatility of this magnitude can be driven only by speculation and not by fundamental demand and supply factors. Such data support my contenton that speculation does indeed affect oil prices in the short run.
What is interesting to me right now is the graph on the right of the TOD page; it is now up to almost $90. During recent weeks, whenever the price gets up to $90 something or somebody knocks the price back down to $88. It will be interesting to see if this trend continues; I think it probably will and that tomorrow will show a decline in the price below the the $89 level.
Naw, what you have here is the price collapsing as the recession begins to take hold. The speculators are trying to guess what is happening and guessing wrong most of the time. The price eventually collapsed, way down to the low thirties. And the speculators, in general, took a bath. Some however, those who went short and stayed short, made a mint.
Sure, occasionally a few thousand speculators jump in, thinking the price is too low, and drive the price higher... temporarily... but soon their mistake becomes obvious and the price starts to plunge again. Speculators sometimes cause short and dramatic swings in the market. But they can never affect the long term trend. And their guesses sometimes make them money and sometimes cause them to go bankrupt.
Supply is still high but demand is dropping like a rock. That causes the price to collapse. The speculators try to figure out what is happening. Some do, some don't. End of story.
Ron P.
Remember this, from September 2008? Investigation Widens Into Unusual Oil Price Rise - NYTimes.com
Dante at peakoil.com speculated that this was some Fed agency unwinding a monster contract. Just a hunch - he was a very interesting guy. Without doubt I posted about his theory here as well.
Eventually the speculators take their ball and go home like Ron says. Volatility increases as the price rises too - except in the last year for some reason. What that means I have no idea - fewer players in the game now? Fundamentals are taking over? For the former theory you could check and see how many non-commercials are still trading; maybe they're going extinct.
Or perhaps the WTI contract is meaning less than ever with its production in terminal decline, a criticism that's been leveled at it in recent years.
Nope, the Fed does not trade commodities. Dante, of all people, should know that. And you must realize that an upwards of 1,500 contracts per minute are traded during the day on the NYMEX. That both on the electronic market and the open pit market during the 5.5 hours both are open together. And that is all contracts combined. Usually between 500,000 and 600,000 contracts trade on all contracts combined. But I can understand how a contract two months out jumped so violently if only 41,000 contracts were traded. Perhaps a few thousand shorts were trying to cover their losses.
And never, never, never forget that the speculators are trying to guess what the fundamentals are really doing. If they guess right they make a mint, if they guess wrong they lose their ass. That is why that if they think they are wrong they get out fast. Getting out fast means buying back their contracts if they are short or selling their contracts if they are long.
Ron P.
What is the WTI contract volume on the ICE in London? The ICE is less regulated by the CFTC than the MYMEX.
the '08 spike certainly was amplified by speculation, but the '90-91 spike appears to be based on speculation alone. speculation that oil supplies would be disrupted.
the '08 spike seems to have been partially based on actual shortages, china stockpiling diesel and falling mexican supply.
the current price spike seems to be driven, in part, by spot shortages of fuel oil, economic optimism and santa claus........and of course speculation that this is the big one....big peak, that is.
The reserve graph above shows that Iraq's reserves in 1980 were much smaller compared to Kuwait's and Iran's at that time. Today, all three are at about the same magnitude. So what has happened since? Huge new discoveries in Iraq, or much lower depletion rate of its political barrels, or simply higher magnitude exaggerations?
CERA projects that world oil production capacity – including crude oil, condensate, natural gas liquids (NGLs), oil sands, gas-to-liquids (GTL), and other sources – has the potential to rise from 87 million barrels per day (mbd) in 2005 to as much as 108 mbd by 2015, with further growth in capacity continuing after that point.
“A detailed new audit of our own analysis and the enormous scale of reserve upgrades in existing fields, confirmed by the most extensive and complete databases on field production – the proprietary databases of IHS, of which CERA is now part – contradicts those who believe that peak oil is imminent,” Esser testified.
Sunbrella Patio Umbrellas
I have sometimes wondered if it just possible that CERA is right and the great majority on TOD is wrong. I'm not an oilman. I judge credibility by certain "cues," none of which is infallible. If by chance CERA is right, I would frankly be delighted--but after five years of studying TOD I think CERA is quite wrong. We're at or close to Peak Oil.
Now comes the really interesting question, to which I have no answer: How is it possible for CERA to be so wrong (assuming they are wrong)? Are they idiots? Charlatans? Liars? Or is there some nonobvious flaw with their methodolgy? CERA claims great expertise and better data than is publicly available. If these claims are false, why has nobody blown the whistle on them? On TOD it is fashionable just to make fun of CERA, but I do not think that is an adequate response. CERA, of course, is not alone in making claims of a substantial increase in oil production capacity in years to come; indeed, CERA represents the conventional wisdom.
My own guess (and that is all it is) is that CERA is honest but profoundly mistaken. Indeed, their predictions are not only a mistake, they are a huge blunder--a blunder of historical magnitude comparable, say, to U.S. participation in the Vietnam War. The "best and brightest" people in the U.S. supported U.S. involvement with the war. Now the "best and brightest" people in CERA, IEA, EIA, USGS all say that oil production capacity is going to increase, and that there is no geological reason why oil output will not increase from present levels. As a sociologist and amateur historian, I wonder exactly what is going on to keep the conventional wisdom going. Maybe it is groupthink.
Don
They could have data that we do not have. But consider another possibility. I used energy consulting firms many times in preparing budgets in my career as a consumer of basic hydrocarbons. Hydrocarbon costs were 50-55% of our costs. One of the things we observed is that some energy consulting firms realize that they can differentiate themselves from the rest of the field by picking a niche. One of the niches we observed is one or two firms that choose to be the "optimists". By doing that they are routinely hired to provide price forecasts to companies that want optimistic (low price)forecasts that make their five year forecasts look profitable.
You may think business people would want the most realistic price forecast but in a competitive environment in which the best forecasts get the best support from their investors there is a subtle pressure to choose the most optimist forecasts of prices when preparing budgets. CERA may have decided that they are always going to be the optimists as a business strategy. That is a niche strategy that works for consultants.
Curious to see you both respond to someone pitching Sunbrella patio umbrellas and a quote by Esser from 3 years ago.
Spammers are getting more sophisticated by the day but it doesn't take much effort to ignore them.
:)
NAOM
TE/Don - I've also seen the same bias many times. I've seen many public companies pick the "optimists" specifically for that prejudice. We know who they are. I even had one operator choose the out of state office of one reserve company over the local office because the two shops used different assumptions. But I've also seen companies choose other companies for the same reason but just the opposite: we all discount the Pollyanna companies. Use an “optimistic” consulting company and the rest of us automatically discount their numbers.
As far as "and that there is no geological reason why oil output will not increase from present levels" this is obviously the easiest assumption to slam: simplistic and wrong but a huge impact on any model. My company is privately owned and we are brutally honest with our reserve estimates. So honest we cut our year end bonuses in half by our own analysis. If a company isn't evaluating its progress honestly you can't make needed adjustments to your game plan. We're in the process of making that adjustment. A great example of how crippling not making adjustments can be: Devon. I was consulting for them when the shale gas plays began to crumble along with NG prices. First, from a technical stand point, they were one of the best outfits I’ve ever worked with. At staff level they knew exactly how venerable they were to NG prices. They knew exactly what their recoveries were going to be. But corporate forced an optimism for NG prices that pushed drilling ahead. But in one of the most dramatic changes I’ve seen in 35 years staff attitude replaced the corporate position in less than six months: they dropped 14 of the 18 SG rigs running in E Texas and paid $40 million in cancellation penalties. But it was too late. They went so deep and fast into a hole they had to sell off most of the company’s most valuable assets just to keep the lights on.
CERA et al make assumptions. Everyone has to do the same. If the assumptions aren’t presented clearly and completely you can’t evaluate the resulting model properly IMHO. As Web said far above: you just can’t look at a curve…you have to understand the set up behind those numbers. Unfortunately such analysis doesn’t fit into MSM sound bites very well.
Yes, I see my dog often won't "see" a bigger dog having a walk on the street. My little dog, a Yorkshire Terrier, will avidly pretend that there is nothing there if he thinks it is unpleasant. It is easy for a dog: turn head, look away, walk off.
I think people are also masters at this art. But we take it to a whole other level!
Well . . . if you carefully look at what they say, they don't really contradict each other. They just say there is 'potential' for 105mbpd. Uh . . . yeah, I can see that. If we consumers could scape up the money for $300/barrel oil, I think they could deliver 105mbpd in 2015. I don't think that is going to happen though. I think the price will go up and the demand will be weakened. Maybe we hit 105mbpd. Maybe not. And if we do, it will probably be because of consumption outside of the USA . . . so it is Pyrrhic victory for the Cornucopians. Yeah! There is more oil consumed (in China and the mid-East). Just like our low-tax policies have stimulated a lot of economic growth (again, in China).
CERA (wisely) uses a lot of ambiguity. And if things don't pan out, they'll always have an excuse. Oh . . . it was just "above ground" factors, we didn't invest enough, hurricanes, lack of access, too few rigs, regulations, whatever. Oh . . . it is just "peak demand".
The current spike in oil prices is being driven by events in Europe, Refinery utilization is down to 75%. There is talk of rationing of fuel oil in the UK right now because the winter has been so cold and oil production out of the north sea is currently in a state of collapse.
http://www.eia.doe.gov/ipm/supply.html
http://republicanifi.com/news/Heating-Oil-Rationing-in-UK-More-Riots-176...
Events are being driven on the world stage by the almost complete disappearance of refined products.
As this graph shows, U.S. net imports of refined products have dropped to almost zero.
http://www.eia.gov/dnav/pet/hist/LeafHandler.ashx?n=PET&s=WRPNTUS2&f=W
and both China, and Europe are having difficulty finding refined products, in fact Europe is closing many refineries due to lack of oil inputs:
http://www.petroleum-economist.com/default.asp?Page=14&PUB=279&SID=72497...
If you look at the specific products that are in short supply, you will see it is mainly finished gasoline and heating oil, both of which, until recently, were coming from refineries around the North Sea. The U.S. is now exporting record amounts of refined products due to the world shortage. None of this is getting any press coverage but it should.
So is this why we just crossed $90/barrel?
The Oil Drum is probably going to become mighty popular again as the price begins to approach $100/barrel is it could easily do in the next few months.
spec - the answer is rather simplistic (from my position in the game): because the crude buyers think they can make a profit selling the products made from that oil. And I'm talking about the crude buyers...not the future players. So the question IMHO is really why do they think they can raise the price of their products and still make a profit? I'm not being a smart ass...honest. As a crude producer I could care less what the buyers are thinking. They post their purchase prices and I can sell at that price or shut my wells in because my tanks are full. Few crude producers can afford to lose cash flow by not selling when their tanks get full. My world is far simpler then the big picture contemplated on TOD.
If Europe is closing down refineries (as your article notes) due to slack demand, that would indicate a surplus of product, not a shortage.
If demand is slacking, then why are oil prices at a 2 year high:
http://news.smh.com.au/breaking-news-business/oil-hits-new-twoyear-high-...
there certainly is no drop in demand for heating oil in the UK:
http://www.boilerjuice.com/heatingOilPrices.php
Low demand would mean lower prices not record prices.
With any product other than oil, they would be building more refineries to cash in on the "boom".
Actions speak louder than words
I agree, and here's another article on oil price:
'Markets close higher as oil passes $90
http://money.cnn.com/2010/12/22/markets/markets_newyork/index.htm
That price & date should give everybody pause for concern.
I've been watching oil prices for several months and they have incrementally gone up or simply held their ground within a few dollars. The recent rise from about 80 to 90 coincided with increased demand for diesel in China and reduced stockpiles in the US. The price seems solidly anchored on supply and demand.
I'm wondering why the White House and MSM seems to show no concern for the rising price of oil. They probably think the last economic disaster was caused by the subprime mess only and don't include oil price and for that matter the high cost of all commodities. I guess the lesson will have to be re-taught.
If oil is a firm 90 now, with the economy starting to bust a move to higher growth, what will be the price by the 4th of July? If we aren't into 4.50 - 4.70 (in CA) a gallon range by then I'll be very surprised.
I've been following the prices for a long time as well, and as I remember the price hit $145 in either June or July of 2008 and was actually on its way down by October. At that time many corporations had there prices locked in at much lower price, so the actual price paid was much lower, around $90.
Here is a graph that shows a measure of what trucking companies are actually paying for their fuel costs, I assume that most other oil utilizing corporations are basically the same.
http://www.cassinfo.com/frtindex.html
I suspect that because of the contango in the futures markets, more companies are purchasing their oil at spot prices, so effectively, we are at the point where we were in June and July of 2008.
To make it more alarming, take a look at combined oil, and product imports during that time period:
http://www.eia.gov/dnav/pet/hist/LeafHandler.ashx?n=PET&s=WTTNTUS2&f=W
the flow had been dropping since 2006, even as prices went up, and finally skyrocketed in 2008. Most people simply look at the crude oil numbers, but you have to add the products as well, to get a complete picture of the flow of oil into this country. In 2006 our refinery capacity was running close to 100%, so we were forced to import a whole lot of refined products (mostly from europe) to make up for the lack of capacity. This particular flow is continuously dropping.
http://www.eia.gov/dnav/pet/hist/LeafHandler.ashx?n=PET&s=WRPNTUS2&f=W
I think it is obvious that the corporations who build refineries knew this was going to happen, so they did not build any more capacity to meet the demand that was very high at that time(2006).
The U.S. had its' hand in Europe's cookie jar, and now the jar is empty. Prices for refined products are either getting ready to explode, or more likely, drive the US into a deeper depression, because of unafforadability.
I was not aware of that very interesting fact. But does that also mean they are currently locked into lower prices than $90?
neb - Unfortunately between the permitting and building efforts it takes 6 to 10 years for a new refinery start up in the US. That's a long time to estimate the economic factors/oil availability that far out.
If they were confident in future supplies of crude, they would have at least started the process of buidling new refineries in 2005 and 2006. Were any, even attempted?
I suspect that rather than build new refineries, the oil companies simply increased the capacity of already existing facilities. This process must have stopped in 2005-2006, because refinery utilization has remained fairly constant, even as the flow of crude oil into u.s. has withered.
http://www.eia.gov/dnav/pet/hist/LeafHandler.ashx?n=pet&s=mcrimus1&f=a
http://www.eia.gov/dnav/pet/hist/LeafHandler.ashx?n=pet&s=wcrntus2&f=4
They also probably did cost/benefit analysis which showed that it was cheaper to import refined product from around the North Sea, and sell it in the U.S. than to build new refineries here. This allowed us to indirectly tap north sea oil supplies for U.S. consumption. Of course this would work, unless crude production declined, which it obvioulsy has. Europe must be having a difficult time procuring crude oil since Brent is so high, and refinery capacity utilization is down to 75% from 90% in 2005-2006 when 25% of european refinery outputs were coming to America.
I would think that with our record amount of product exports, the U.S. would be adding capacity as fast as they could to meet the apparently elevated international demand but to my knowledge that is not happening.
I think the end oil game has just begun.
http://www.eia.gov/dnav/pet/hist/LeafHandler.ashx?n=PET&s=WTTEXUS2&f=W
I have just spent the whole morning engaging in a rare and guilty pleasure -- reading an article from Gail, with the entire list of comments -- when I was supposed to be doing something else, related to my own job.
Thank you all! It has been a most entertaining and enlightening morning.
I think nebraska sums it up pretty well, and I agree with Gail that it doesn't require fancy mathematics to show that the future will be very different from the recent past -- but of course, exact predictions of the future are not likely to be correct.
I agree with WHT that mathematics is a language of its own, that translations into say, English, are as fraught as translating any other language into any other language. I suppose, that at some level, if you are going to read Rumi accurately you really have to be a 13th century Persian --
And of course, if you want accurate predictions, you have to do the math -- but to do the math correctly, you have to immerse yourself, not just in the language of mathematics in some abstract way, but also in the sociology, psychology, history, geology, etc. of the culture. What is the origin of the data points upon which the mathematics operates?
WHT is right, I believe -- you can't just look at curves. But Gayle is right, too -- the data points are often subjective, even dishonest. And where in WHT's mathematics is a dishonesty function?
Like others above, I eagerly await the January publishing of the "Facts in the Ground."
I am a physician by trade, so it is my job to look at systems, and come to a conclusion based on mathematical principles. Part of my decision processes take into consideration, that some of my data might be skewed or wrong, so I look for numbers that justify and explain the facts that are clearly seen. If data is wrong, it will be contradicted by other sources and can be rejected based on the weight of evidence.
Uncertainty is always part of the equation, but you can't use it as an excuse to not treat the patient when he or she is clearly decompensating
My business also, so perhaps that's why I seem to feel a sort of kinship with your analysis -- our training and experience teach us to think in certain ways that may well be different from lawyers or engineers.
In medical practice there is "uncertainty", of course, which we have to figure into our calculations, but there are several components to "uncertainty". There is "just the nature of things", random statistical fluctuations, but there is also "deception" -- some of which is conscious, as in deliberate manipulation, which may or may not be easy to detect, and then there is simply self-deception. People sometimes tell us things that we "know" to be untrue, but which they fervently believe. And their belief system profoundly affects the way we proceed with our treatments and prescriptions, regardless of what the "truth" may be.
Ultimately, you can calculate all you want to, using "evidence based medicine" and all, but in the end, you are faced on the one hand, with someone who hurts or is scared, and on the other, with very imperfect data sets -- and you have 12 1/2 minutes to decide what to do -- and you might get sued if you make the wrong decision. And you do that 20+ times a day.
Pretty much, medical training is about pattern recognition -- eyeballing curves, rejecting that which doesn't square with our experience, or if we have no relevant experience, relying on the accumulated experience of the profession, or resort to Wikipedia. No amount of calculation will tell you exactly when to operate on a failing mitral valve, for example -- too much uncertainty.
I suppose that politics is like that, too.
So I am fascinated by the Oil Drum, and I love to see all the varying thought processes, world views and rhetorical styles. And in the end, maybe it helps shape political as well as personal decisions -- it has changed the way I live my life.
I totally agree with you. I started out in general practice, but felt that my training in pattern recognition was totally insufficient for the problems encountered in daily practice. I decided to go back and do a residency in Internal Medicine which was basically taught by specialists who were all volunteers that loved to teach in a community based program. My experience in general practice gave me tons of questions to ask these specialists and it changed the way I approached every patient. I now approach everyone as a biological, psychological, and emotional system, with multiple interconnections. It probably sounds pretty cold and calculating, but my patients always know they have been heard and taken seriously, which really means a lot to them. And in the end, we have a strong doctor-patient relationship which is probably the most powerful tool a physician can have.
I have been following this peak oil problem since 1998 after reading the famous article in Scientific American by Laherre and Campbell and have followed the statistics of international oil flow religiously ever since. All of my insticts have told me to be silent and non-alarmist, but these last few months aberrant currents are becoming apparent, and I feel like I need to say something to someone.
It appears to me that signficant changes are imminently about to occur, and people need to get ready for the repercussions that are sure to follow. The system that we live in, is about to take a very problematic and dangerous path.
In the ICU we watch the Is and Os, to guage how our patients are doing, and the same analogy can be applied to any other system. If our country was an ICU patient, then heroic intervention would clearly be appropriate and justified in the near future if things happen the way I am afraid they are about to.
I now approach everyone as a biological, psychological, and emotional system, with multiple interconnections. It probably sounds pretty cold and calculating,
Quite the contrary, sounds like a sane, rational and holistic approach to me. I wish that outlook were ubiquitous among the medical profession at large. Are you familiar with Orac's blog? Respectful Insolence
http://scienceblogs.com/insolence/
When I'm in the office, with a patient, I try to make it a collaboration, as much as possible, just two people sitting down to try and solve a problem. It's a system that really works for me at least. People are very complex, but if the discussion is both ways, you have a much greater chance of making them feel better, even if they have chronic problems that are never going to be solved, they at least feel like their particular disease has been treated with the respect that it deserves.
The next patient I see might be the 20th case in my practice that day, but to every person who has it, it is EXTREMELY important to them individually, and deserves some discussion in a way that they can understand it.
You might figure out that their diabetes was brought on by weight gain that they just can't control, Oh, and by the way they have had constipation, dry skin, hair loss, for three years now. You check their tsh, and it is normal, but their free-t4 is low. This rings a bell as pattern from med school, but you have been taught that TSH is highly sensitive and specific for primary hypothryoidism; however, you were also taught that tsh controls free-t4 levels, and is in return controlled by TRH. If you think of this problem as a system, you will correctly figure out that the tsh is in the low normal range when it should be high, and the patient has secondary or tertiary hypothyroidism, a treatable disease process.
To me, thinking of medical problems in terms of a set of systems, is the best way to practice medicine, and an art which is just not taught well in medical schools.
Before going into medicine, I was a component level electronic repair technician. An art that is sadly probably gone forever. When you fix electronics, you know that 9 times out of 10 your primary problem is not the obvious, it is being caused by something else, but is easy to go in with a voltmeter and oscilloscope and track down the actual problem. With people, it is not that easy, that is why many millions of dollars are spent by the medical establishment on imaging and expensive tests.
I've never read that blog, but it does sound interesting.
Orac is a research scientist as well as a physician. I enjoy the blog. However, the fact that he is laboratory-based puts him in a different category from people who have to rapidly assess patients, each of whom brings a different (and often unstated) world view, and whose clinical presentation may be straightforward or bizarre, with sometimes hidden motives or agendas -- but always, some process decision has to be made.
That's not a criticism, it is important that people like him defend objectivity and wring out the "woo" of the subjective approach.
Unfortunately, my experience has been that "objectivists" are just as likely to be charlatans as "subjectivists" -- and in so in any interaction with another human being, you need to make sure your shit-detector is in good working order.
This is all apropos my comments about why I like the Oil Drum so much -- unlike the world of medicine, it would seem that nothing could be more straightforward and scientific than finding oil in the ground and getting it into my gas tank or an airliner. But TOD puts the lie to that assumption, and brings out the subjectivity, uncertainty, wishful thinking and frequent outright deception at the heart of "hard" science.
You have really hit the nail on the head. My motto is "trust but verify." almost nothing is as straight forward as it appears.
I was just thinking about this the other day, when a commercial from an oil company, came on the radio, asking people to watch the air in their tires so many millions of gallons of gas could be saved each year. This is an incredibly odd thing for a company to say, when they are publicly saying on CNBC that there are no problems with future oil supplies every time they are asked.
It makes me think that something is rotten in the state of Denmark, literally.
http://www.indexmundi.com/denmark/oil_production.html
Rocketing Fuel Prices:
http://www.thesun.co.uk/sol/homepage/news/money/3271776/Gas-electricity-...
According to the article:
"It's the coldest winter since 1911, and a combination of factors is pushing up petrol, heating oil, gas and electricity. It's a quadruple whammy."
I wonder what "a combination of factors means"?
They are even stealing heating oil:
http://www.oilfiredup.com/site/news/item/1178
A country sitting on an oil field the size of the north sea, should not be having these kind of problems extremely early in the winter. All of this is happening while they close down refineries because of "overcapacity"
http://online.wsj.com/article/SB1000142405274870356160457528243174141384...
I think this should make everyone stop and think, it's a little like Saudi Arabia, having similar problems. Can you imagine what people would say if there was a rash of gasoline theft in Kuwait, or Iraq because of a "really hot summer".
I've been preparing my family for Peak Oil for about 5 years now and made some videos to help people save money and powerdown their homes. I attached one of them here....
http://www.youtube.com/watch?v=PUCl1TruUfo
MrEnergyCzar