New High of Liquid Fuel Production
Posted by Stuart Staniford on January 5, 2011 - 11:34am
This post is based on two articles previously published at Early Warning.
New High of Liquid Fuel Production
Prospects for a New Peak in Crude & Condensate
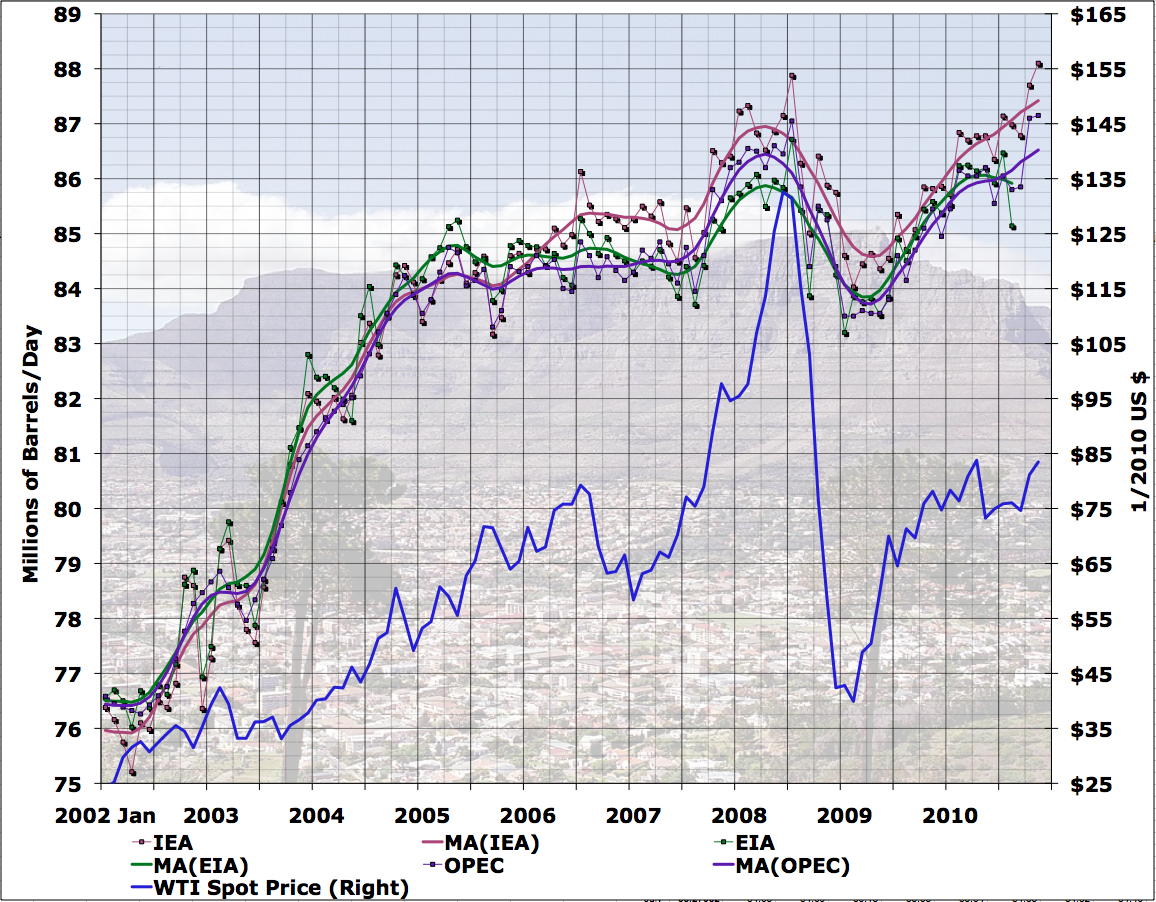
Both the IEA and OPEC came out with new monthly reports recently. And both report that oil production in November 2010 exceeded the previous high month of July 2008 (back when oil was over $140). Probably the difference is within the margin of error, and in any case the third agency (the EIA) won't weigh in for a few months.
Stuart Staniford is a long standing contributor to TheOilDrum but now writes for his own blog Early Warning. This is Stuart's first post on TheOilDrum for some time and it would be very much appreciated if commenters focussed exclusively on on-topic comments.
At the moment, the average index looks like pretty much a statistical tie:
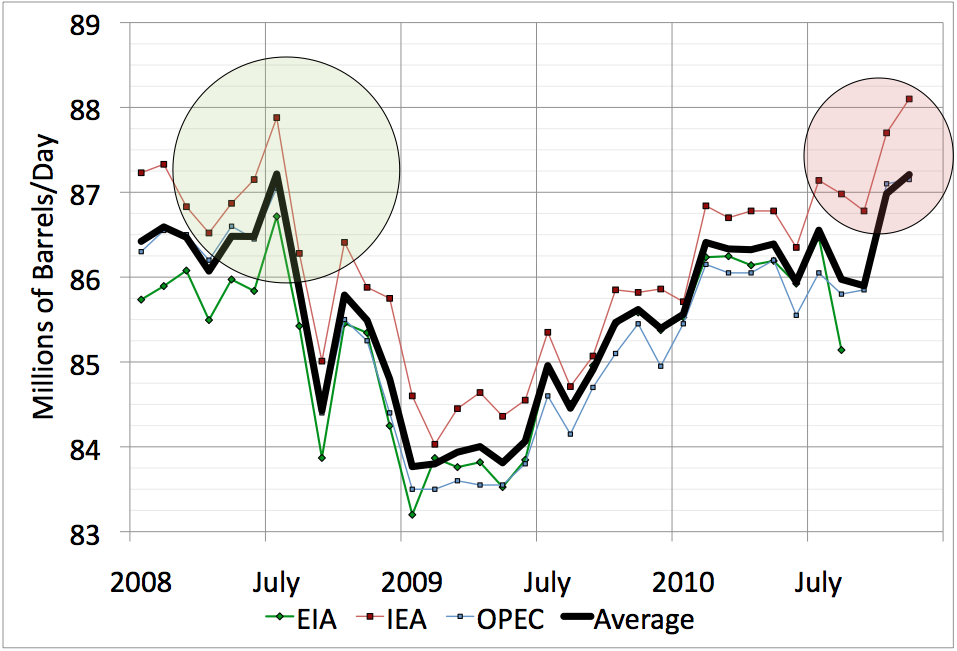
Still, a significant point: not peak monthly oil just yet. As long as there isn't a massive financial crisis in the next few months (which is what happened to the last global high in oil production) I imagine we'll clearly exceed the July 2008 peak production. In particular, the point I first made here still holds: the increases in the last eighteen months have largely come from non-OPEC production rather than OPEC, and the latter undoubtedly still have some spare capacity that can be released (at a price). Thus production can and will go somewhat higher as long as demand continues to increase, which will be true as long as the global economy doesn't hit another big pothole.
However, prices have been creeping up lately:
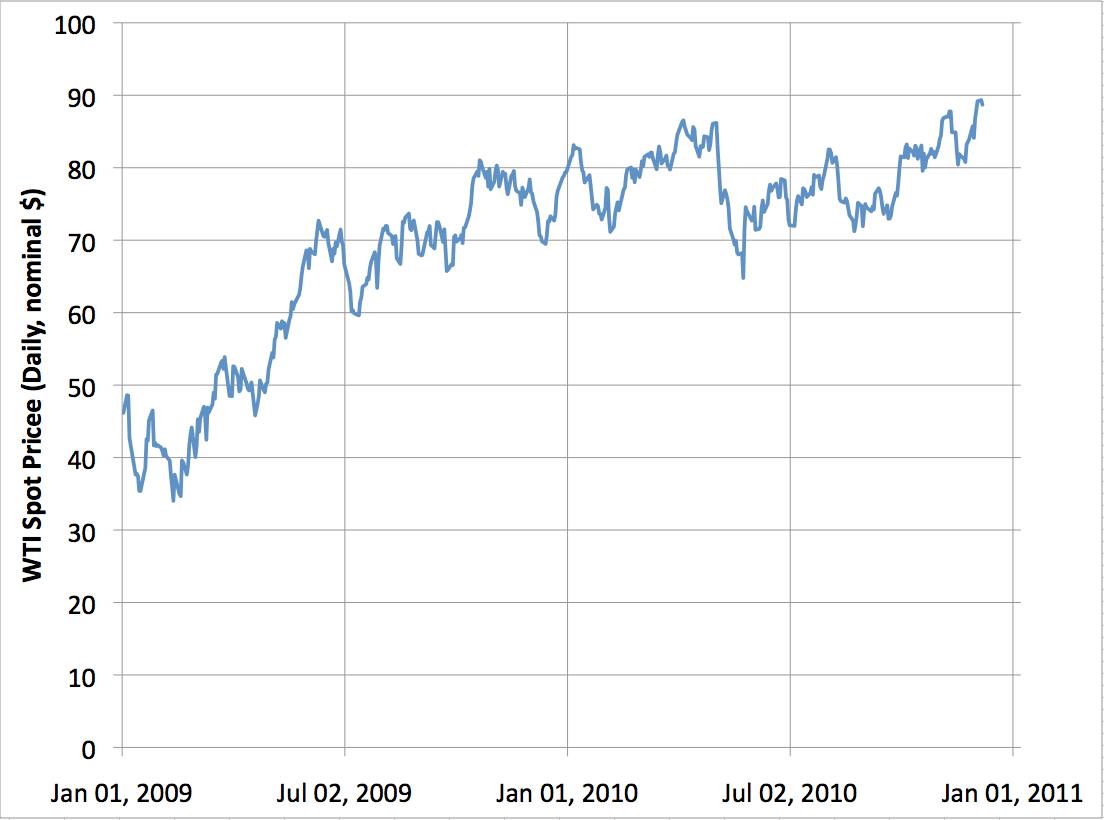
I wouldn't be surprised to see that trend continue, on and off, until it starts to cause real problems.
Prospects for a New Peak in Crude & Condensate
Of course, the full liquid fuel series that the various agencies report on include things that aren't really oil, such as biofuels, and natural gas liquids (things like butane and propane). There are decent arguments on both sides of what exact definition of oil one should use. If we look at one more conservative but reasonable definition - crude plus lease condensate (C&C) - we see the picture below (according to the EIA). I have shown the full liquid fuel series in blue, and only the C&C component in red.
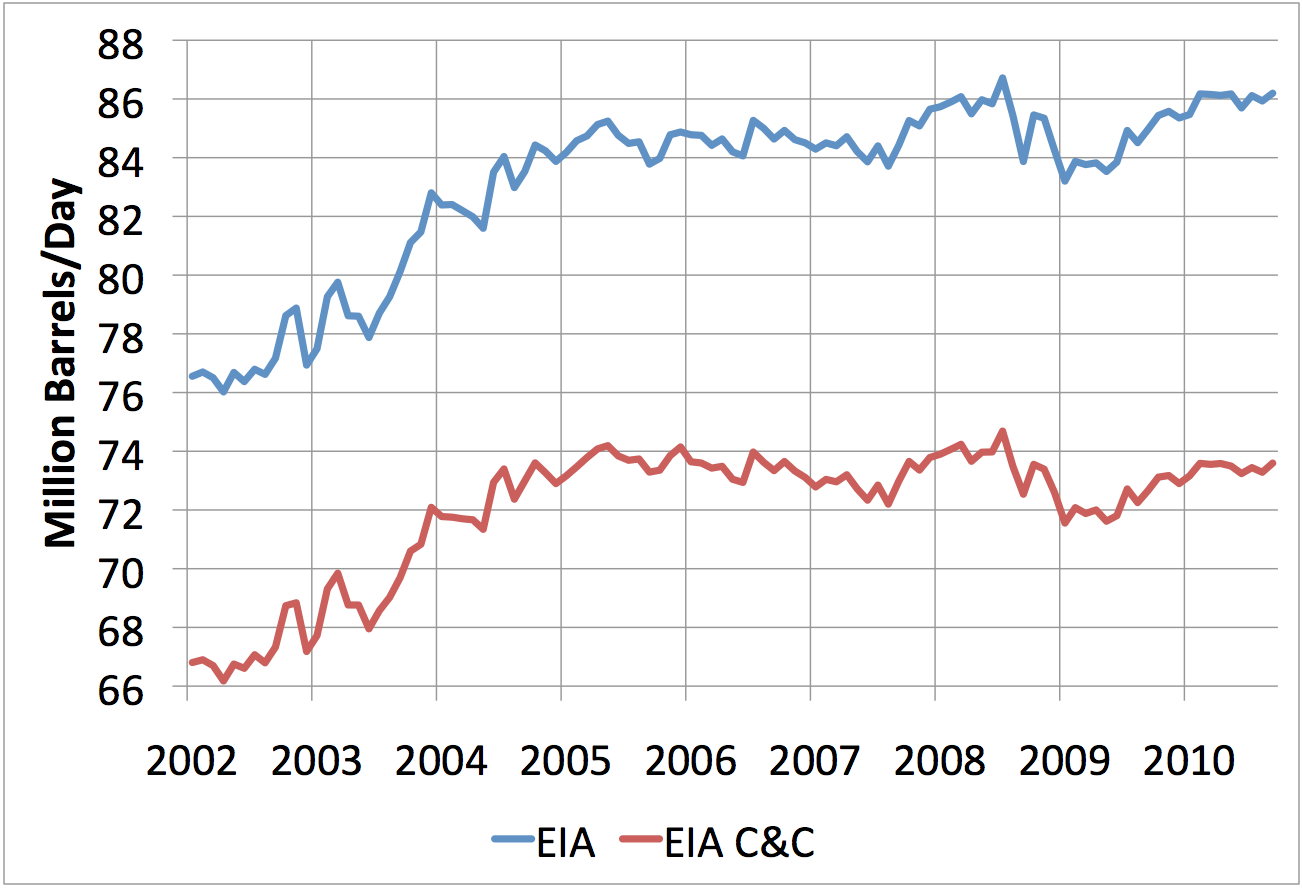
Now, the EIA is only up to September as of today, whereas OPEC and the IEA have just released November numbers. So the big leap up in October/November is not apparent in the graph above. However, if these two EIA series behave like the ones that have been released, they will jump up by over a million barrels/day between September and November. As of September, the EIA all liquids series is 0.5mbd below it's all time peak, so it will very likely exceed it as the next couple of month's numbers come out. However, the EIA C&C number is 1.1mbd below it's all time peak, so it will be a near thing when the November numbers are out.
Still, if demand stays strong and prices up, it seems likely that supply will increase further in the next six months. If so, then it's likely that the July 2008 crude+condensate peak will also be exceeded.
The bottom line is this: those people running around saying that the all-time peak in monthly oil production was definitely in 2005 or 2008 are running a considerable risk of having events make fools of them. Appropriate caveats should be used.
Contact
- Content: editors at theoildrum dot com
- Tech support: support at theoildrum dot com
License

This work is licensed under a Creative Commons Attribution-Share Alike 3.0 United States License.
To what degree are we certain these numbers are coming from holes in the ground, not tankers in the bay?
Spike capacity derived from emptying storage is one thing, but sustained capacity is another. Are there numbers for draw down of storage, say of oil stockpiled during the collapse in demand?
IMO, average annual numbers provide a better indication of actual production and tend to filter out monthly fluctuations due to inventory changes, seasonal factors and maintenance issues. And I think that average annual oil prices give us a better indication of fundamental supply & demand factors.
Consider a simple example, a salesman who gets monthly commission checks. Let's say that he makes $50,000 in July, but his annual income for the year is $240,000. Which metric is a better indication of his annual income and of his actual earning capacity, the monthly peak of $50,000 or the average monthly income of $20,000?
Gary:
By and large, the decrease in production associated with the great recession was intentional cutbacks by OPEC, but the recovery of the production since has not come from OPEC, but from non-OPEC countries increasing their production. I wrote about this pattern back in April - the graphs there are a little dated, but the basic pattern hasn't changed much since.
$64,000 question: why?
I can just about see non-OPEC production in certain countries, like Angola, ramping up slightly in response to policies enacted as a result of the $147 spike. But why would OPEC sit back and eat the loss in revenue associated with cutting production and not seek to take advantage of $90 oil?
There aren't many explanations, and they don't point towards a bright, all-you-can-eat future, do they?
Angola is in OPEC :-)
There is some hint in recent Saudi production data that they have been starting to increase production, but it's hard to be sure given how bad the data is:
However, I'm pretty sure they have not been struggling to maintain production because the rig count has been falling, not rising:
The rig count is very telling. Clearly major panic in 2005 - when the bumpy ascending plateau was reached, and KSA discovered they didn't really have much spare capacity left. Drilled a pile of wells on Khurais and Ghawar - and since they have relaxed, and all the while decline has been eating away at their capacity.
How significant would you say that little up tick in rig count is at the tail end of your chart:-) ?
Yeah, I noticed the tick up too, and I'm pretty keen to see the next few months of data :-)
of course, as you know, drilling in ksa doesn't generally have any immediate effect on production, or capacity. saudi aramco will spend years planning and executing megaproject processing capacity expansions. the drilling of wells occurs in the background.
a recent example:
http://www.bloomberg.com/news/2011-01-03/aramco-receives-bids-for-shayba...
if saudi aramco is to maintain their capacity, they may have to become more nimble - as their fields and projects become smaller.
I don't have the chart, but the biggest drilling boom in Texas history was in the late Seventies, into the early Eighties, in response to a 10 fold increase in oil prices.
the biggest drilling boom in Texas history was in the late Seventies, into the early Eighties, in response to a 10 fold increase in oil prices.
Yes, and the drilling effort was remarkably unsuccessful in increasing Texas oil production. You cannot find oil that is not there (although some people seem to believe more in magic than geology).
Or to be more accurate, the smaller fields that we are finding post-peak haven't been able to offset the decline from the older, larger fields like the East Texas Field.
Here is a chart of US rig count
http://www.wtrg.com/prices.htm
Compare it to the Saudi one above. The spike seems to be a very good indicator of a peak in oil production.
Also note its after peak production in other words its a lagging indicator.
Probably quite telling. I see in this graph, that the 20 oldest rigs were mothballed or cut up during the economic downturn. Plus one exploded and sank... so now, new orders are being placed with an expectation of $90-125 bbl oil and new safety scrutiny on the older rigs. This count could go up quite a bit, with a tailing off a little later on as some of the more venerables are retired when their replacements enter service.
Oops, yeah I persist with not thinking of Angola in OPEC, even 5 years later.
Question remain however, the 'why' rather than the 'what' of OPEC production. They cut production in tune with reduced demand, but they didn't raise it as demand returned.
Possible motives include:
My guess is partly 1 and partly 5, with a bit of 4. OPEC is looking to ensure it maximises both its price for a non-renewable resource, and its duration in getting that price. At the same time, what's the point of investing billions in new capacity/infill drilling/etc. if all it does is push down the price for the bulk of their product? Better to allow extraction to tail-off, commensurate with maximising the price like a good cartel.
If that's actually their thinking (and its not much of a jump) then active management of the price, in the process pushing down demand, is the order of the day. The $80+ region of pricing is enough to actively reduce low efficiency uses of oil around the world. Thus, over time, the price can float up, with less oil produced, and still not throw the global economy into reverse.
Active fuel efficiency promotion by OPEC, so they can harvest the maximum returns in a supply constrained world. By forcing out the low efficiency usage they can get higher prices for the bulk of their production. That's a new variation on an old tune.
Play that forward into the near future of actual declining global production.
Production can't keep pace with demand > Price spikes > Recession > Demand falls > Balance restored
It's the downwards sawtooth we all expect, with a cycle time of several years. Problem for OPEC et al is it's start/stop on production and income. So can they smooth that sawtooth? If they can balance the global economy on the ragged edge of recession, demand rises are slowed and price collapses can be avoided by 'slightly' induced recessions via 'slightly' increased prices. Enhanced growth is no longer the win-win, now its zero growth that's OPEC's target.
Call it 'Puppetmaster OPEC'. It's an active control mechanism for oil demand, using price to keep the global economy on the edge of recession. Is it possible? I'm thinking not, not with the perturbations inherent in the system - but you could see the advantages from OPEC's position. They get to recover the absolute maximum for their resource AND pull the strings of the entire world. A megalomaniac's dream.
Why take $90 when they can wait for $140 while their competitors use up their resources.
NAOM
"So can they smooth that sawtooth? If they can balance the global economy on the ragged edge of recession, demand rises are slowed and price collapses can be avoided by 'slightly' induced recessions via 'slightly' increased prices."
This is precisely what I pondered on while showeling snow yesterday. If I was intelligent, and had the phone number to a few guys in top OPEC i knew since 15 years, this is what I would propose the production numbers to follow for a strategy.
I even thought if something like this get posted here, GaryP would get a phone call from KSA and ask to remove his post ;) to close to the truth methinks!
Our 2006 paper using Texas and the Lower 48 as models for Saudi Arabia & the world:
http://www.energybulletin.net/node/16459
The Texas/Saudi crude oil production chart, from the 2006 paper, updated with 2006-2010 Saudi production data (2010 is based on data through 9/10) is shown below. If 2005 does turn out to be the final production peak, there was an element of luck involved in posting this chart in early 2006, but the real story is Saudi net oil exports. I think that it is very unlikely that they will ever again exceed their 2005 annual net export rate of 9.1 mbpd (total petroleum liquids).
From 2002 to 2008, we saw six straight years of year over year increases in annual oil prices, and Saudi Arabia showed a significant increase in net oil exports (total petroleum liquids) from 2002 to 2005, in response to rising oil prices, but they showed significant declines in annual net oil exports from 2005 to 2008, relative to 2005, in response to rising oil prices. Something clearly changed. Note the similarity to the Texas production/price chart down the thread.
It could be that the price movements are more speculative than supply/demand. The first chart shows a huge swing in price whose impact on volume is rather muted by comparison. If producers think supply/demand is reasonably balanced, then they are simply letting speculators with cheap leverage run the price.
Just a thought.
Cooter
A related point is that July 2008 "production" was not actual production that month (or the month before).
EVERY oil producer in the world had an incentive to reduce working inventory as close to the MOL (minimum operating level) as feasible. In the USA, Canada and perhaps North Sea, this drawdown in working inventory would not be counted as production, but in much of the world it would be.
And Saudi Aramco has large volumes in long term storage (one estimate from years ago was 70 million barrels, most in KSA, but some in Amsterdam and the Caribbean). A modest drawdown there would "pop' July 2008 production to an all time record. The fear of economic damage from $147/barrel oil would be an incentive for KSA to throw extra supplies from storage on the market.
Today's more modest price increase slope is less likely to pull down inventories (after the tankers anchored at sea have been emptied, although they are not counted as "production" typically), so I "strongly suspect" that reported production today is almost all real production.
None-the-Less, Net World Oil Exports/Imports are almost 2 million b/day below their peak. And that number matters more than Peak Oil per se.
Just Stopping By,
Alan
With Brent trading on $94 and Tapis on $101, this up tick in demand / production provides important piece of jigsaw. World economic recovery seems to be gathering pace. As Gail noted in her recent post, stage seems to be set for a rerun of 2008. If sovereign debt problems and banking insolvencies don't derail the party (at any moment) then it will be interesting to see what energy price is required to halt growth this time around. Inflation looks set to zoom.
Its also worth noting long time lag between higher oil price and investment feeding through to increased production in OECD.
Thanks Stuart
I must say I never thought when opec cut production in 2008 that this production just vanished it would have required a depletion rate of 10% to do so. Also the new fields shown on wiki megaprojects make it a good bet that the 2008 high will be broken during 2011.
Ofcourse the big question is how much of this becomes net exports?
But one thing i am quite sure of peak oil is not yet passed.
Following is a table showing global net oil exports* versus Chindia's rising net oil imports from 2005 to 2009. If we assume an exporters' production level of about 61 mbpd for 2010 and consumption of 18 mbpd, annual 2010 global net oil exports would be about 43 mbpd.
If we assume Chindia's net imports were about 8 mbpd, then "Available" net oil exports, i.e., the volume of global net oil exports not consumed by China + India, would have fallen from about 41 mbpd in 2005 to about 35 mbpd in 2010. Chindia's combined net oil imports as a percentage of global net oil exports, based on the foregoing assumptions, would have risen from 11% in 2005 to about 19% in 2010.
*Net oil exporters of 100,000 bpd or more in 2005, which is 99%+ of global net oil exports, principally BP (total petroleum liquids) data with minor EIA inputs
Following is the chart showing the 1972 Texas and 1999 North Sea crude oil production peaks lined up with each other, and then charts showing US oil prices (vertical scale) versus Texas and North Sea crude production around their respective peaks.
Even with the benefit of slowing rising unconventional production (which was not a factor in the Texas & North Sea peaks), global crude oil production is showing a similar pattern, having--so far at least--failed to exceed the 2005 annual rate.
The key question is why has global annual conventional + unconventional crude oil production (C+C, EIA) so far failed to exceed the 2005 annual rate for four years and for 2010 to date, despite the fact that annual oil prices have exceeded the 2005 annual rate for five years? This lack of a production increase in response to rising oil prices is especially noteworthy given the large increase in production from 2002 to 2005, in response to rising oil prices.
WT
I have assumed that the world production curve would broadly track the US and north sea production curve, that is, a broad peak lasting 6 or 7 years then beginning a decline.
the megaprojects database seemed to support this
this new data from Stuart, so late in the "peaking" period (that is, I take world production to have broadly plateaued since mid 2004, so we are in the 7th year) is surprising
I agree with your comments about using annual averages of price and production, and long term 10 year trends in price direction.
As noted up the thread, we need to look at annual data, and the key difference between regions like the US Lower 48 in 1970 and the North Sea in 1999 versus the world in 2005 is that globally we now have a slowly rising contribution unconventional production that was not a material factor in the Lower 48 and North Sea declines.
In any case, annual oil prices since 2005 have all exceeded the 2005 annual level of $57, with four of the five years showing year over year increases in oil prices (with 2010 being the second highest annual oil price in history), yet annual global crude oil production has so far at least not exceeded the 2005 annual rate, in contrast to the rapid increase in production from 2002 to 2005, in response to rising oil prices.
I would actually say we entered the plateau in very late 2003 at about 70.5 mbd, since we have been in a range with that as the low and 75 as the high ever since. The whole 'all liquids' thing should be ignored--moving goal posts, double counting, differences in energy content...
But even if their isn't a new 'real' daily or even annual high production number, I am guessing that every extension of the plateau will come out of an even steeper fall off the other side whenever that does come.
And of course the raw numbers also overlook things like ELM and net energy/EROEI...
We all need to realize that anything and everything that can be used (conventional and non-conventional) will be done to maintain the plateau. It's not in the best interest of oil producing nations to allow a descent, and if super-straws or adding in ethanol can help the numbers and output, then it's going to be done.
But like you mention Dohboi, the longer the plateau is maintained, the sharper the shark fin decline once it gets started.
Personally I'm not surprised at this long plateau period, the undulating plateau of seemingly new highs, etc. It's just par for the course. I'm figuring at least 10 years of plateau due in part to the addition of non-conventional. As easily extracted crude descends these other sources will be ramped up until like Gail says, price dictates what the economy can handle.
My take on the width of these production peaks is that the curves are similar, but the global production curve is wider, between 200 and 300 years wide. Therefore, I expect the width of the peak of global production to be wider than the peaks in the U.S. and North Sea production curves. We might be near the peak in global production for 10 to 20 years, i.e. 2004 to 2024, and consume up to 500 billion barrels around the peak. The world's crude oil resources are not as extensively developed as the U.S.'s and North Sea's which ought to help extend the plateau.
Thats actually fairly close to the new party line thats forming. As far as I can tell the argument is that the oil is there however a lot of it is now what we call unconventional. It will be expensive to develop but it exists.
Indeed exactly how wide the production range is is open to question why not a thousand years ? Why pick 500 million barrels ?
Its simply a big number. The problem is not oil its simply a matter of cost since oil is more expensive demand for oil will grow slower and economic growth will simply be slower than it was in the past. Thus its a demand pull event.
The claim is this has obviously already happened in the more mature economies. Whats happening right now is simply that developing economies are still expanding and the oil industry has not yet really started producing oil at the new high prices.
Although its certainly started to respond with the growth in none-OPEC supplies. As demand stabilizes and prices stabilize at a new higher baseline supporting our large but expensive reserve base then oil production in a sense is simply moving to a new mature phase and for that matter so is the oil economy.
The actual peak when it finally occurs could well not be all that much higher than now say perhaps 100mbd or so ?
It might be ten years before we get there.
Oil will continue to play and important role in the worlds economy. Meanwhile steadily and probably slower than most people expect alternatives such as EV's will play and ever increasing role. Help keeping price down but also delaying the exploitation of our vast but somewhat expensive endowment of oil.
I have to guess overtime the assumption is that alternatives will allow growth to rebound even though oil remains expensive but still widely used. Where oil can be replaced it will be replaced but where its useful it will stay.
I'd argue that in such a scenario the eventual decline in oil production won't occur because of lack of oil simply because the new infrastructure that has expanded to around alternatives esp electricity has expanded to the point that its cheaper to continue to expand it than it is to maintain the oil infrastructure. This would be similar to the decline of the coal powered steamer. As oil powered shipping became increasingly common coal bunkers where eliminated and coal fired ships became non-viable not because we ran out of coal but simply because the distribution network was dismantled.
As with coal oil would continue to be used its got plenty of uses outside of transportation but its production rate will be controlled by the changing use pattern not supply.
Cool but whats interesting is how demand can surge by 3mbd despite the relatively high price. And play a role in sending oil over 100 once and it looks like again. How can demand from developing nations remain robust while collapsing in the more mature economies ? For now the long term picture leaves our recent past very murky. Basically it seems simply the result of a unfortunate combination of events. The move to "expensive" oil was painful and it seems unexpected. Indeed the explosive growth of China and India basically caught the oil industry flat footed and just happened to overlap with the transition between conventional crude and enormous but different unconventional production. Sh%$t happens sometimes. However given the recent report and assuming OPEC capacity claims are reasonably true it looks like we made it through the transition period even though it was a bit rocky. It might get a bit tight here and there in the future but it looks like we have years to go esp if non-OPEC oil production continues to rise.
We might strain capacity again but the possibility is fading. Also of course at some point Chinese expansion should start to cool down same with India. The real problem is they are simply growing too fast. For China coal production is simply so large now its difficult to believe that can keep the rate of expansion up. This will help cool their economy.
Also for India overtime the new high oil prices should eventually slow the rate of economic expansion. For the US our economy may be growing again but we still have one hell of a debt issue left to deal with. The EU is not looking to hot. In short over the next few years growth in China and India should moderate indeed they might even suffer a mild recession while growth in the US and Europe should also be very slow. As the short term becomes long term a lot of the issues that have been ignored for now won't be and they will have to be solved and they will be a bit painful.
Maybe not a double dip but tough going for several more years. OPEC will ensure a bottom on oil prices so we can be safe in assuming the spare capacity will be with us for a long time to come.
So still some tough times ahead but basically we made it through our pinch point and transitioned.
Problem is one piece of the puzzle is still missing indeed the cornerstone of the whole story has yet to be laid.
OPEC has yet to surge production to stem price increases. Indeed as prices rise they seem to be moving the goal posts on us. It was primarly non-OPEC that did the heavy lifting so far according to the official numbers.
Until OPEC actually shows it can contain oil prices well, the truth is still in the future.
Obviously I don't buy into the story.
Being the cynical bastard I am however I don't expect the truth far from it indeed I fully expect some "event" above ground that will have and impact on OPEC's ability to deliver oil or demand. It won't be their fault of course. This beautiful vision of the future will still be there of course I just suspect that events will seem to keep happening that somehow mean we will never get there.
500 billion barrels is approximately 73 Mb/d * 365 days/year * 20 years. I presented the number to give an idea of how much crude oil and condensate might be consumed near the global peak and to suggest the falling edge might be rather steep.
Look I don't want to be a dead horse but I will :)
If we can do 73 mbd for 20 years and extract 500 billion barrels of oil well perhaps we can also ramp up to 100mbd over ten years etc. Indeed good chance we can produce more than 500 billion barrels assuming what your saying makes sense today.
A 20-30 year wide peak event simply does not make a lot of sense to me I'm sorry. Its indicative of a substantially higher oil resource base. I'd argue at least 3-4 trillion barrels remaining makes sense even if you assume a symmetric decline in our current fields regardless of the overall shape. Indeed it suggests most of the oil that will be burned has yet to even be discovered.
If it was a matter of price well if we assume say 80-120 as a price range that allows us to tap these reserves why stay at 73 mbd ? If we assume that we can do 73 for 20 years well clearly we would have economic expansion over the same time period and if the oil exists the demand for it would be higher in the future. If you want to take this route then I'd argue that we would do say 75mbd or less at 100 dollar oil say 85mbd at 150 and say 90+ at 200. If its a price issue I'd argue the world will adjust to higher prices and overall growth would ensure production continued to increase.
Perhaps oil production would peak over the 20 year span perhaps not. If such capacity existed it would be effectively unpredictable how much oil would be produced and at what price point. One has to think that with high priced oil and our latest multi-branched lateral wells and fracking technology that production would continue to climb. And of course the new high prices are certainly to garner a few more technical breakthroughs or make some methods that are often too expensive today feasible tomorrow. Look at how fast horizontal drilling expanded once it was perfected.
If the current plateau is real then its simply the result of the almost random overlap of a number of events and it will be resolved peak oil is somewhere well in the future and its difficult to even guess the same of the curve.
If peak oil is happening now then I think the long plateau implied by current production claims makes no sense. Not even for my shark fin fall off model. Oil production would remain high for too long. The argument for the asymmetric production in the first place was because technical enhancements allowed production to remain high past 50% of URR indeed past 60% of URR and close to 70%. Almost by definition the time period one could keep the max production rate against advancing depletion is fairly short. Indeed the actual onset of the plateau itself is very likely to be delayed until you hit 60% of URR. And its unlikely to be maintained after 70% URR. Looking at global oil production then the period of time where we passed through a 10% remaining URR change with production close to its present value is easy enough to see. About the earliest date you could pick would be say 1995 and production was clearly rising through 2004.
Basically about ten years at most to burn through 10% of the remaining URR and thats in my opinion stretching the time case quite a bit. Obviously since 2004 we then burned through a good bit more of our remaining URR. Going with the 10 year extreme estimate well then the plateau ends in 2014. I'm not convinced that the same technical advances which held the plateau will also allow and initial shallow decline period of 1mbd or less for several years say at least 5. This puts the final obvious decline out to 2019 or 2020. And not only is this really pushing the model its negating almost all future discoveries. All the shark fin model buys you is a fairly small number of years of high production at the expense of eventually very steep declines as you approach 80% of your remaining URR perhaps expensive oil does expand the time getting you perhaps close to your 20 year claim.
Perhaps it still fits and is still correct but I find it questionable. Realistically I'd argue your looking at two cycles. The end of cheap oil and the onset of expensive oil. The new demand for expensive oil is driving the expansion and shifting the decline outwards. The entire argument rests primarily on technology and it makes more sense when your considering such a long interval that fundamentals also change over the same time period. For example expansion of heavy oil production and deep water would perhaps add significantly to the resource base. A long shark fin is intrinsically a different model from on I considered. With new hard to develop resources becoming financially viable the existence of the "fin" is questionable. In short your really pushing it. It may well eventually prove correct but I dunno.
Instead if any sort of shark fin model makes sense well its going to have a much shorter duration. My best guess at the shape of the top is 10 years of increasing production past 50% URR 5 years of flat production then 10 years of shallow decline followed by a big drop. Basically a parallelogram. Technology at first allows you to increase production then stem the initial decline and then keep it initially shallow. The assumption is a total URR of about 1.5trillion barrels.
The time scale is pinned via the onset of both horizontal drilling and rising production in the 1990's. This also pins the URR estimate as we would have hit 50% of URR or a symmetric peak in the early 1990's.
Look at the graphs here:
http://www.hubbertpeak.com/curves.htm
And Ivanhoe the real father of the shark fin.
I'd argue that the symmetric peak if it was going to happen was clearly forming in the early 1990's. Technical innovation esp horizontal drilling that would eventually result in a shark fin became widely deployed at this point.
Certainly one can argue the shape of the curve. Anyone assuming and asymmetric curve has serious problems explaining the shape around the peak. The shark fin concept is far more about the eventual steep drop not the exact shape of the top. By definition its detailed shape is driving by technology. I think my argument for a squashed pyramid is very reasonable and eliminates the unnatural sudden fall off and replaces it with a much more sensible linear decline phase.
No matter how you slice and dice it its still well pinned in the early 1990's and by default also pins the URR.
Ivanhoe was a bit off on his shape and production actually continued to increase instead of flatlining as he thought.
His curve is still basically correct in my opinion simply the details around the peak are hard to discern.
Indeed in my calculated oil production I see what seems to be two technical moves upward not just one. The second is probably expansion of offshore drilling in any case the revolution in oil drilling technology that started in the 1980's was bearing fruit. Indeed the onset of symmetric peak was soon well in the past and even if expected quickly forgotten.
Hubbert's predictions esp the lower estimates of 1,350 billion where seemingly wrong.
However as I've said you can pin the curve and indeed it says that Hubberts low estimate was actually very close to correct. If he missed at all it was not by much. I guess 1,400 to 1,500 indeed if I'm wrong its to the high side thus closer to his results. Distortion of production from technology did not happen suddenly Dec 1, 1990 it was already causing some distortion in the late 1980's. I'm far more likely to be high than anything.
Regardless esp if you adopt the concept of a linear decline phase no way does a shark fin fit todays numbers.
Correcting Ivanhoes projection to include and additional growth and linear decline phase still puts you falling of the cliff in production. Using the distillate and argument and upstream technical innovation allowing optimization of distillate production dampens the economic impact but still prices work to pin things even more.
I believe one of two answers work.
1.) Hubbert nailed it with his low case symmetric curve.
2.) The Ivanhoe technical correction i.e shark fin was fundamentally correct.
3.) The peak needs further modification to recognize the ramp plataue and linear decline caused by technology. ( My correction to Ivanhoe)
3.) Price narrows down the situation and we apply one additional upstream factor where complex refining allows significant leeway to produce more distillate.
4.) Rising lease condensate and NGLS primarly from wet NG wells offset the demand for light petroleum products including gasoline allowing complex refining even more leeway to produce distillates.
With this Peak oil is seen as having two big events. The first was a shortage of distillates as oil production fell below the offsetting abilities of advanced refining the second was when production really did go over the cliff.
Amazingly it seems that if the second has occurred then it just happened to happen in the depths of the greatest recession in history. Or not amazing at all depending on your opinion. Regardless current oil prices would have had to resulted from a steep drop in oil production aka the cliff all the way through the recession period.
Thus we eventually repeat the distillate shock of 2008 but pass through it rapidly into real shortages.
Obviously oil production numbers have been fudged big time for a while.
------------------------------------
Or you have to throw all these models out. It is some sort of long plateau and or multi decade peak. Mine is I think the most extreme one but effectively all the peak oil models are effectively wrong if we are looking at 30 years plus of high oil production or at least all the near term ones are wrong and all the long term ones wrong for different reasons.
Still everyone got it wrong one way or another. Yet thats really my point. I think my short term shark fin model is still valid. If so then we are not only going to see a price shock real soon now its doubtful that prices will really fall off after the distillate shock. It won't be an exact repeat of the 2008 distillate shock simply a bigger and different one that starts in the same way.
I don't know but one thing is for sure any sort of long plateau model even if it eventually ends in a steep drop will be interesting to understand if it turn out true. For now at least I'm betting Hubbert nailed it coming and going.
Obviously he could not easily predict the technical innovations but still he nailed it.
Indeed you have a pretty interesting paper see slide 10.
http://www.docstoc.com/docs/22383983/Evaluation-of-Crude-Oil-Production-...
I'm saying the early giants nailed it perfectly using simply symmetric models.
All the later forecasters have simply misinterpreted the effects of technical innovation.
Now its even worse falsified public data is being used to try and support the longest forecasts I guess underpinned by the belief that high prices and technology will find the oil just like it was able to offset the symmetric 90's peak.
In a sense if we can just keep things going then the truth will eventually match what we are more subprime is contained logic if you will.
In the other approach technology also beat these early forecasters and also of course all of the later near term peak oil forecasters they where all wrong however technology not only enhanced production but also greatly expanded reserves.
Its only real weakness was the expense and the fairly slow rate that production could be increased. Its a very different oil production curve and since technology play a huge role its exact shape is also difficult to discern. But no real shortage of oil is on the horizon even if cheap oil is a thing of the past.
Regardless the near term symmetric peak oil proponents still got beat by technology coming and going its simply a matter of how exactly did they get beat. Technology has in my opinion clearly played a very significant role in oil production and its effects have not been correctly included in most peak oil scenarios the only question is the exact nature of its role. If its a shark fin then then using price to do the final curve pinning means we are already over the cliff. If technology has indeed also expanded the producible reserve base substantially then oil production should continue to increase simply at a bit slower rate than in the pass and only cheap oil is in the rear view mirror the peak is not even discernible.
I know less about this than you do, but it seems to me that nationalized oil companies might behave differently than purely profit-seeking oil companies, especially as they learned over time. I am thinking in particular of the Saudis, Iranians, and Norwegians. It seems to me that a quick spike does not profit them as a long plateau; someone that's thinking about a country's economy, and not chasing quarterly results, might favor a long steady stream of money in a stable world economy, to a quick pile of cash (that is worth what, in 20 years?) and the resulting unstable economy.
I'm not sure if this explains Venezuela's behavior or not. One corollary/advantage of dribbling out the oil, is that you would not sink a ton of money into your oil production infrastructure, preferring instead to extra the maximum value from what you already have.
Not likely. Logic that you, the good doctor, displays goes a long ways to understanding.
I'm not a REAL doctor, understand :-). And my degree's in CS -- what ails your computer today?
Well read the new tech talk that now up on Venezuela the investments to develop heavy crude increments are huge.
Assuming that they are holding back is questionable. Better to assume that the remaining oil resources seem to require a significantly different level of investment to extract. From Brazil deepwater to the heavy oil deposits the technical challenge is dramatically higher than it used to be.
This seems to result in two key points.
1.) The reserve base has to be huge to justify the expenses.
2.) Development will be slow.
The production rate from these reserves is effectively independent of their discovery date and ultimate URR except for the fact they need to be large to justify the investment. Intrinsically I argue they don't fit most oil depletion models.
Also one has to imagine if there was any other significant prospects for oil that where similar to what we had in the past they would be developed first. Your certainly scrapping the bottom of the barrel with these projects.
Other places like Iraq which might hold more traditional oil reserves suffer from whats probably long term political instability thats not easily fixed.
Simply given this move to non-traditional sources suggests that traditional produces are at the minimum no longer capable of large incremental increases. Many could well be in decline. Certainly this will put tremendous political strain on producing nations esp given many are also seeing internal consumption climb.
Countries like Mexico that historically minimized their interaction with the big oil companies are faced with the issue of needing technical help to manage their declining reserves. At the same time internal politics will become heated to say the least.
Technical and political factors rule distorting the production curve perhaps significantly from any simple discovery development production cycle. Basically across the board in every single country the nature of oil extraction and the challenges facing the industry change dramatically. Accidents like we had in the US can also happen at any point especially as things simply get more complex.
Perhaps I'm also right are partially right and underneath all of this we are now finding that our previous applications of technology have resulted in steep declines of our remaining traditional reserves even as the barriers to expansion and continued development grow.
Does it matter well yes it does the details of whats happening right now will determine the future of the oil industry.
Across the board I think its obvious that the entire industry is undergoing a fundamental change as the days of cheap oil are clearly over.
The simplistic symmetric models based eventually on URR estimates fail to capture the new situation. Technical and political issues cannot be ignored.
As far as nations willingly holding back production of legacy "cheap oil" fields to maximize profits. Well thats one explanation. Does it even make sense.
If one takes the new reserve estimates that have been published at face value well oil production at its current rates or higher will continue for decades to come. We are not even close to the midpoint much less decline. Why hold back right now ? You have decades of production. Certainly it will be more expensive and expansion will become harder but the production is there. Why cut back now to "force" a higher price expensive oil seems to be a given. Lacking any reasonable models for future oil production acting today in anticipation of some well defined result decades from now seems questionable.
Indeed your implicitly assuming that oil producing nations have excellent models of their current and future production and more than this excellent models of global production and demand over the next several decades. Even though we have already been through one horrendous price crash. Making the assumption that decisions are being made now to accomplish some goal thats decades in the future is interesting.
I don't think the situation is that simple indeed the intrinsic problem is one of significant increase in complexity not simplicity. Claiming that we now have rational actors that are deftly able to navigate this complex situation with almost perfect knowledge is well questionable. We have not even considered the impact of EV's and alternatives such as GTL in a high priced yet reasonably well supplied world. I'm not excited about EV's over the short term but if one is talking about twenty years then EV's, NG etc all become significant. And last but not least you cannot ignore the financial situation. China one day perhaps soon is going to have to slow its growth rate. Western nations have huge debt loads the entire global economy is unbalanced. Any sort of multi-decade planning has to consider the evolution of our financial system. Obviously something has to be done about it over a 20 year span.
And of course you have to also assume that all these nations are very confident in their governments over twenty or more years. Suddenly politicians esp in unstable parts of the world become visionaries ?
At the very least lets see some new models attempting to model this new world with all its complexity. All I see is a very opaque and unknowable future with way to many factors at play. What I'm saying is pretty simple all bets are now off all the models broken this might be because of corrupt data as I claim or not. Its literally impossible to guess what the future holds.
If people actually take the time to try and model I think they will see numerous divergent outcomes are possible depending on the details future oil production is driven almost completely by how economic/political/technical factors interact.
Well, I'm upfront about not knowing enough, but I also can't quite make sense of what I observe, and what I read. And I think there's a possibility that maybe people running countries learn, plus there's no doubt weird diplomatic interactions between countries that there are not between corporations.
Or to put it differently -- economists are famous for pretending that ugly real-world entities fit their beautiful models, but corporations and nations are different beasts.
Countries that treat their reserves as state secrets and don't allow independent audits ?
Countries like the US that still don't even have and energy policy ?
I agree with you that they have learned something indeed I think they have learned a lot.
Just I think we differ substantially on the exact nature of what has been learned.
One need only look beyond oil at other issues we face to see what our government have learned.
http://www.scientificamerican.com/article.cfm?id=future-of-kyoto-protoco...
The sad thing is many people consider the Global Warming debate a success ?
No doubt it taught the world governments a thing or two but like I said perhaps we differ on exactly what the lesson was.
If nothing else is reaching a peak I think peak arrogance, selfishness and disregard for the common man has hit and all time high. Historically the greatest atrocities are often committed when governments shed the fetters of accountability and no longer listen to their people.
http://www.abs-cbnnews.com/nation/11/30/10/wikileaks-cablegate-shows-us-...
Now as far as oil goes simply consider for a moment that we might have been fed a pack of lies. What reasonably independent data exists that can confirm or deny such a situation ? If you do ask the question well the answer is very little some scraps of data. Some interesting moves in the markets. I even looked into CO2 as I've mentioned.
But the reality is we don't have any real checks and balances against duplicity as far as oil is concerned.
Heck as far as I know no country in the world has ever raised any sort of official concern about OPEC's interesting
reserve claims much less more vigorous action.
Well lets look shall we little information is not no information.
http://www.energyintel.com/documentdetail.asp?document_id=167229
And we get a bit of real data it seems in this report.
A 48% recovery rate is excellent and Kuwait has been applying modern technology to its fields for decades.
Such a result is a perfect match for what I'm claiming has happened that advanced technology has kept production levels high till nations are in the last few percent of oil that can be recovered at high flow rates. This paper was in 2006.
Its not 2009 if the above is true well Kuwaiti production should now be declining rapidly or at best be on the verge of decline.
And we have reports like this.
http://www.gregcroft.com/burgan.ivnu
Now whats really really neat is if Kuwait and Saudi production did start crashing indeed probably problems in numerous countries well the economic crisis could readily have hidden a huge change in overall production.
http://noir.bloomberg.com/apps/news?pid=newsarchive&sid=akpmrbF4lZtQ
With current prices approaching 90 a barrel overall oil production could have fallen by as much as 4mbd !
Obviously this casts serious doubt on Chinese imports and internal consumption claims.
Setting aside oil for a moment lets just check some official Chinese numbers.
http://www.washingtonpost.com/wp-dyn/content/article/2006/05/19/AR200605...
Almost a 50% difference ! And this is a statistic that has a reasonable chance at being recreated. No telling what the error is in other stats with China 30% or more is probably a safe bet.
Here is and excellent overview of Chinese statistics.
http://www.theoildrum.com/node/6126
Forget about oil its the least of your problems. If Chinese statistics have serious flaws well fairly quickly you run into and ever bigger problem. You have a huge car problem. Thats not to say that demand for cars in China is probably not growing at a healthy rate but if you even consider a large but for the Chinese reasonable difference of 5% well you have a problem. A better Chinese correction is 50% thats the norm not the exception.
If one simply "corrects" the Chinese stats we get a growth rate of 10-15% actually not at all out of line with corrected GDP numbers. Next of course crushing rates or the rate of removal of older vehicles in China is as far as I know not known. Its however a pretty good bet that all the old Communist era cars where rapidly scrapped.
There seems to be zero chance that we can get good scrapping rates however the Russian auto industry is not doing well.
http://www.livetradingnews.com/russias-car-industry-s-big-q-upgrade-or-d...
If one assumes that FSU countries and China and India have effectively rapidly replaced their fleets with either new more modern local model or imports or locally build foreign designs well its huge. The transition is over a very short period of time but its important to note that in the US fleet replacement following the 1980's oil crisis resulted little change in overall oil demand. Often the change in fuel efficiency is larger between old poorly maintained auto's of the FSU and china and modern cars. Thats not to say they are not seeing fleet expansion simply that the relationship between the fleet modernization thats taking place and fuel demand is likely to not be a simple 1:1 change.
However all of this is simply sidestepping the real issue and elephant in the room. The problem is it casts serious doubts on the claimed production figures made by our international car companies. Any attempt to try and guess corrected auto import figures leaves a huge gaping hole in the production claims by public car companies.
This is of course a startling claim right ? Well lets look around and see what we can find.
http://www.thetruthaboutcars.com/2010/11/gm-breaks-2-million-car-sound-b...
Ouch !
Now we see the game in China joint ventures are the rule not the exception. Well if every member of the joint venture gets to claim 100% of the production voila ! Fantastic numbers. Apply my educated guess I used to live in China so I know how they do their government math and bingo my estimate is right on. Obviously we have to correct the growth in Chinese demand by a similar amount and of course unlike everyone else consider the scrapping rate.
This eventually results in a probable growth rate for Chinese oil demand of around 2-5% per year.
Now whats really interesting is we have plenty of evidence that Chinese oil imports are probably much higher than this.
Even if you again assume questionable stats in this case you have yet another big problem. China is still no matter how you slice and dice it importing too much oil. Indeed the game with car numbers goes a long way to covering up a real and obvious surge in imports.
Well crashing oil production is not just the domain of the worlds exporters if its happening well it happens in every oil producing country. China like the US is not immune to its own national peak. This time around however like the rest of the world technology played a bigger role and the resulting decline is probably far sharper.
China it seems is not immune to the problem of rapidly falling oil production indeed if I'm right they are in a serious bind. The rapid expansion of Chinese oil companies in the international space takes on a whole new meaning if I'm right.
Also of course they would be just as willing to play along with the rest of the world in fudging numbers.
If anything they are in the worst shape of all. Japan of course was already in the frying pan and has been for some time.
If one assumes Russia like everyone else is having production issues well the EU is also stuck.
With China, Russia, the US, and many OPEC and non-OPEC exporters politically motivated to keep a lid on oil production problems what are the chances of any sort of truth emerging. Not only is it not in anyones best interest to go against any attempt to keep portraying things as normal. Its important to the biggest economies in the world. Who is going to stand up on and issue where China and the US are in perfect agreement ? Consider also the financial position China has created ? The best description I can come up is with is that our world leaders are in a ring playing Russian Roulette with each other everyone has a gun pointed at the other and each one has a few bullets in his gun.
Indeed the number one issue facing the world right now is in my opinion a rapid fall in domestic Chinese oil production if thats whats happening. If I'm even close to being right about global oil supplies falling and one includes export land concepts. Its a ticking time bomb and it does not have a solution. The world simply cannot accommodate a China that is seeing rapid declines in domestic oil production. And China can no longer change its course and reign in growth without facing collapse. Indeed a perfect storm is brewing and I simply don't see any solution.
With just a bit of digging its really not all that hard to figure out whats really going on indeed the attempts to hide the real situation become increasingly superficial and ludicrous the more you dig. Its simply not that hard to figure out whats being hidden if we are being told a pack of lies and its fairly obvious why. The only way out is to try and keep things under control and hope they get better or war. Sooner than later this high stakes game will probably come unraveled.
The problem is, you seem to think that what the Saudis should learn, is to allow independent audits. How does this help the Saudis? There are what's-in-it-for-them lines of reasoning that support them having a fair amount of oil, and being in no hurry to pump it. Suppose an independent audit revealed this -- would they like this? Conversely, suppose their reserves are near their end, but they wish to prolong their influence as long as possible in OPEC. Would an independent audit serve this purpose?
Countries with marginal or difficult-to-produce fields, why should they be in a hurry to produce them? I've heard that production can be harmed if you do extraction wrong, why not let someone else be the guinea pig first?
And, in all cases, people who stand to profit now, who are expected to deliver results next quarter, have a fair amount of money to spend on PR. For example, is Venezuela "wasting" their oil, or "conserving" it? Beats me, but I think this is a very interesting question.
LOL :)
The Saudi's don't have to learn anything. Its the nations dependent on oil imports which have the problems.
Its the US, EU, China, Japan etc that should have been at to forefront of a transparent oil infrastructure.
For the US and China this includes a real transparent assessment of domestic production. Heck the long term potential for US production is just as opaque as the Saudi's for different reasons but still our own reporting is at best poor.
A significant about of oil production in the US is from stripper wells.
http://www.epmag.com/Magazine/2009/1/item26683.php
http://www.onepetro.org/mslib/servlet/onepetropreview?id=00020513&soc=SPE
I can go on and on...
http://www.onepetro.org/mslib/servlet/onepetropreview?id=00003828&soc=SPE
Its not like these issues are unknown.
Thus simply starting with one of the most basic issues baseline stripper well production in the US and its potential impact of future US production and working my way out to eventually question KSA production what do I find ?
And almost criminal lack of concern about our energy supply.
Heck you have things moving in the opposite direction with increasing taxes on these marginal producers.
http://findarticles.com/p/articles/mi_qn4182/is_20100728/ai_n54662743/
Who knows how heavy handed central government polices have impacted Chinese oil production over the short and long term.
Whats really happened with oil production under authoritarian regimes like Saudi Arabia ?
The oil spill disaster in the GOM for example highlighted just how poorly the industry was regulated. Effectively for all intents and purposes self regulated. Although it detracts from my argument to some extent the Industry in general has obviously done a good job of regulating itself as far as safety is concerned. Accidents are and exception not a rule.
This says nothing however about the quality of long term management of our natural resources and overall accountability.
In the end all you really have are statements from the leaders of Saudi Arabia and the large oil companies that they are wise stewards of these resources.
The governments of the world maintain a literally blind trust in the oil industry. The critical problem is perhaps not that the trust is justified but thats its literally blind. There is zero public accountability and oversight as far as long term resource management goes from the smallest stripper well in Oklahoma to the giant Ghawar field in Saudi Arabia.
The world seems content to simply look at effectively unaudited R/P ratios and continue on its merry way.
I love this explanation.
http://moneyterms.co.uk/reserve-replacement-ratio/
Surely its possible that this decades long policy of benign neglect and trust might have resulted in a building crisis ?
What would happen if say other critical industries such as Banks where allowed to effectively self regulate themselves ?
Ohh wait ....
History is so full of eventual crisis from lax regulation that its impossible to find a situation where such and approach ended well. Indeed government regulations are almost always created in response to a crisis of one sort or another in one industry or another. Often way too late to solve the original problems and seldom anticipating the need for any sort of stewardship. The industry quickly regains the "trust" of the government often with a steady stream of payoffs and we move on till the next crisis.
Perhaps the oil industry is different I seriously doubt it. And this is not to demean the workers in the industry the vast majority never deal with these sorts of higher level problems. Indeed even inside companies data that allows you to even ascertain such issues is often only available to upper management. Few has access to it generally because its considered sensitive. Sometimes from time to time they do and we get our whistle blowers. The significance of one or more whistle blowers is often disregarded but eventually becomes clear in hindsight.
Again we turn to history and in this case to the history of the oil industry has it really established that its occupies and almost unique position in history and is the one industry that won't eventually abuse its trusted position ?
I'm not just talking about national oil companies but the entire industry.
I'd argue that not only does such assurance not exist if you dig it seems that the industry has developed in such a way that some fairly huge discrepancies could readily exist. This does not mean by any means that they do exist simply that the opacity level if you will is so high that a huge range of real conditions could readily underly the public positions of the oil industry.
Given this and given history well eventually it seems as time progress these concerns do turn out to be right the unregulated industries sooner or later abuse their position of trust as events force them to either be forthright and suffer the consequences or lie and get by for a bit longer.
Again this does not mean that the oil industry has fallen into this trap but it also does not mean they have not.
The trap is there and one day if history is any guide we can make a safe bet that the industry will choose the wrong path. There is a very good chance given oil price action that it already has at least to some extent. It inability to meet demand and prevent high oil prices alone is enough to justify the existence of issues which where not addressed by the industry itself. It failed in its obligations to its customers.
The only real question is just how much has it failed was it simply the result of unanticipated robust demand and failure to regulate speculators in the futures markets as claimed ?
Or is it a much larger issue ?
At the very least I'll argue we really don't have a clue all we have is trust me.
One of two things have happened the oil industry was simply blind sided by a series of events and is working hard to rectify the problem and ensure stable oil prices or they are they are telling ever larger lies.
We have seen similar things happen in the past in the Sugar industry which is about as honorable as the Oil industry.
(Thats not saying much :)
Its chock full of all kinds of price swings and corruption. Indeed sugar is of course intertwined deeply with the slave trade and effective slavery for cane cutters. In comparison the oil industry actually looks pretty good :)
Just consider for a moment what the sugar industry would do if it was faced with falling sugar production say for some reason no matter what they did they would have less sugar cane every year ? If your willing to read about the history of sugar and then conclude you would trust the sugar industry to do the right thing and manage the declining production say perhaps investing in alternatives well then you can trust the oil industry. Personally I'd like to know if you would be interested in millions of acres of sugar cane fields recently available in Alaska because of global warming.
Seriously however I have no doubt that the oil industry has some serious problems. Trust me is not the answer. The only question is just what these problems are and how serious are they. And the way things are now structured you cannot dismiss the potential for a crisis. Most Americans are ignorant of history but not everyone was born yesterday.
The price spike should have caused a massive outcry for and audit of the global oil industry that was heeded by our governments. It did not.
Perhaps because the governments already know the cause ?
Pleasr throttle back. Everything you write detracts from your argument.
Not to mention that it's at least 5 times too long for what it says, so most people reach MEGO and stop bothering. I know I have.
Memmel, maybe there's something like Immodium for logorrhea. Get some and use it.
I did a bit of searching today and found this from 2000.
http://nl.newsbank.com/nl-search/we/Archives?p_product=NewsLibrary&p_mul...
If you look you will find many news reports about falling stagnant or falling domestic production in China from 2000 and even up into 2004.
http://english.people.com.cn/200403/25/eng20040325_138469.shtml
And this
http://www.sciencedirect.com/science?_ob=ArticleURL&_udi=B6V2S-5005SMM-2...
and this..
http://web.cup.edu.cn/peakoil/document/20100805090622040004.pdf
And in 2011 just how is old Daqing doing ?
http://www.chinaknowledge.com/Newswires/News_Detail.aspx?type=1&cat=CMP&...
I think the Mexicans need to learn a thing or two from the Chinese about reporting oil production.
Edited to add missing links.
"The key question is why has global annual conventional + unconventional crude oil production (C+C, EIA) so far failed to exceed the 2005 annual rate for four years and for 2010 to date, despite the fact that annual oil prices have exceeded the 2005 annual rate for five years?"
Could it be that the nature of the Great Recession is a demand-based slump. This is unlike any comparable modern downturn. Until recently there has been no signal to open the spigots.
Yes, especially given the big drop in demand in those countries where white folks don't rule the roost.
Global Crude Oil Production Versus US Oil Prices
2002-2005 & 2005-2008 (EIA, crude + condensate)
2002: 67.16 mbpd & $26
2003: 69.43 mbpd & $31
2004: 72.48 mbpd & $42
2005: 73.72 mbpd & $57
2006: 73.46 mbpd & $66
2007: 73.00 mbpd & $72
2008: 73.71 mbpd & $100
I agree that global demand at annual oil prices in the $66 to $100 range (2006 to 2008) was lower than it would be at oil prices in the $26 to $57 range that we saw from 2002 to 2005. However, the question is, why did global producers increase production by more than six mbpd from 2002 to 2005, in response to rising oil prices, but show flat to lower production from 2005 to 2008, in response to rising oil prices? Sometimes, the simplest explanation is the best, i.e., Peaks Happen.
We are on the "bumpy plateau" of peak oil production. There may yet be a year with a higher total annual production than 2005 but I doubt it will be by much. The monthly number is far noisier and certainly can pop higher briefly.
Several years ago, Stuart himself raised a couple of important questions:
1. How long will the peak last?
2. What will be the decline rate once we begin the downward move?
The first question is relevant in that it partially defines the amount of time that global civilization has to respond to the peak in liquid hydrocarbons. The second is relevant in that it defines how hard and how quickly the changes will hit us once they begin in earnest.
These questions are, in my opinion, far more important than defining some exact date for peak oil. Unfortunately, they get little discussion anymore, particularly the second question.
Agreed. Add in the little net export problem we have and the first few years after the peak could be ferocious:
For comparison, the 73 shortage was ~ 4%.
2008 annual was lower due to the recession. It impacted demand. Production was lower as a result. To point out the obvious. You really should include this in these boilerplate arguments of yours, you know. It's a bit disingenuous otherwise. A simple linear trend from Jan-July '08 suggests that if demand had stayed steady the annual figure would have been ca. 74.5 mb/d, and there goes your theory. The flatness '05-07 and decline in KSA are the bona fide alarm bells.
Rapier is correct that we really shouldn't be in a froth insisting that this or that year was the absolute peak. The industry could still pull off one final hoorah. I notice the US rebounded to ca. 96% of its absolute peak about a year later, too. Doubtless there are other examples.
But why does the exact month or year of PO matter? It is a worthless statistic in the grand scheme of things. We are generally at the top of the mountain. It does not matter a hill of beans whether we are within 1-3 years plus or minus of that point. We are all facing this one way or the other. It is not decades away in 2030 or something it is facings us in the near term.
The biggest producers cannot all go flat in such a way as to mean that they are resting for a while to make a new peak of any future significance.
What probably matters more than the exact date of aggregate PO is PO per oil consuming capita. (the reason for the “oil consuming” is because if one never really used oil PO is irrelevant anyway). Once that metric goes down outside of the noise band it is going to be painful.
Rgds
WeekendPeak
I wonder if one could view the spike up and down in 2008 as the "changing of the guard" between western and eastern influence driving price? The super-spike likely occurred as multiple growing economies converged to drive demand sharply. After the spike, China comes along to fuel the recent price increases, while the west sorts itself out in the economic doldrums.
Given the uncertain relationship between total production, price, and demand, I can't help but think that there must be a better figure of merit that "peak oil" or "peak price". Perhaps some utility function per nation of GDP divided by oil expenditure (imports times price per barrel, plus the cost of extraction alone for internal production)?
Intuitively, it's not just the quantity that matters, but the price, and not just the price-quantity product, but what you actually do with it, that determines the health of a nation. The UK as an export nation had benefits that the UK as an importing nation does not. Ditto for the US.
On the world stage, one would think a summation could readily result in a simple curve for world GDP, given the fungibility of oil overall and netting out of imports and exports. In such a case, cost of extraction overall would be the key -- and that brings us back to EROI and EROEI in a round-about way.
Probably all of this is trivial from an economics cash-flow analysis. I suspect we are simply focusing on a triviality of "peak production" and missing a more complex but also more meaningful competitive value model. It would be easy for our marginal utility per barrel of imported oil to shift as the cost rises and we not even notice the transition point. Knowing where that point might lie would provide a rubric for determining when a shift from maximum-consumption to higher-efficiency become mandatory.
On the next level down, it may well be the Ethanol is good for Iowa but unhelpful for the nation. Or it may be helpful to both, compared to imported oil. Or it might be lost in the weeds compared to low-hanging efficiency fruit. I'm not sure we have any way of knowing today.
In a stable market, the price of oil is the price of marginal production. OPEC (or at least SA) is doing it's best to preserve a stable market with the price high enough to maximise global production by bringing on tar sands and deep water and other high cost oil. This of course does not mean that all oil costs $90 to extract, so the average cost of production globally is much lower. The difference is the profit to the oil producers. This profit is re-invested into the world economy, albeit a lot goes into inefficient prestige projects like artificial island resorts for the super rich. The end result is that global economy becomes deeply unbalanced. Major oil importers are dramatically impoverished, important infrastructure projects like renewable energy systems are underfunded, the rich get richer and the poor starve. Riots and Wars proliferate.
The truth is that the peak of oil production (or net energy from liquid fuels) is going to cause a major a period of geopolitical instability at its best, and all out war at its worst.
All monthly prices in 2008 were above the $57 average annual price that we saw in 2005--until December, 2008. And on the production side, 2005 was heavily impacted by hurricanes. Regarding the obsession with July, 2008, I suspect that there was a lot of inventory liquidation going on, given an average monthly price of $133. In any case, here are the updated global C+C numbers:
Global Crude Oil Production Versus US Oil Annual Spot Crude Prices
(EIA, crude + condensate)
2002: 67.16 mbpd & $26
2003: 69.43 mbpd & $31
2004: 72.48 mbpd & $42
2005: 73.72 mbpd & $57
2006: 73.46 mbpd & $66
2007: 73.00 mbpd & $72
2008: 73.71 mbpd & $100
2009: 72.31 mbpd & $62
2010: 73.44* mbpd & $79
*Through 9/10 and subject to revision
There was a clear price signal from 2002 to 2005, as oil prices rose from $26 to $57. In response, global crude oil production increased by 6.56 mbpd.
Annual oil prices from 2006 to 2010 inclusive have all exceeded the $57 level, and four of the five years have shown year over year increases in annual oil prices. In response, global annual crude oil production has so far not exceeded the 2005 level, and in fact we have seen a cumulative shortfall--on the order of a billion barrels of oil--between what we would have produced at the 2005 rate and what was actually produced.
But of course the real battle is in the global net export market, and a plausible scenario is that the global supply of Available Net Exports, i.e., the volume of global net exports not consumed by Chindia, is in the process of falling from 41 mbpd 2005 to about 27 mbpd in 2015.
Most intersesting are the years from 2002 until 2004. Even production increases of more than 2m b/d were not sufficient to prevent prices from rising dramatically. Everyone may calculate where production figures should be in 2011 if something like BAU for the OECD nations could have materialized.
Second: Availability beats prices. The rising prices did not prevent global GDP from growing, but the shortage does.
-There would not have been an malnutrition problem in germany at the end of WWII if the nazis only printed enough foodstamps. Many, who laugh about this fuzzy logik become true believers when it comes to the terms of oil and $, instead of food and foodstamps.
Yes, but GDP correlates to gross energy, not net energy. Net energy is what the world feels. "The economy" runs on net energy.
73.71 mbpd & $100 (2008) yields much lower net energy than 73.72 mbpd & $57 (2005).
Prices are often "sticky" on the way down as well. We are human after all. Not perfectly rational.
What is the definition of "oil production" and of "liquid fuel production"?
Is CTL (Coal converted To Liquid) included in the definition of the phrase "oil production"?
Obviously it would seem that CTL should be included in the definition of the phrase "liquid fuel production", but what are the metrics for such a thing? How can it be in barrels per day? If BTUs are used, shouldn't there be an asterisk and an EROI number attached?
We just had lengthy discussion behind the scenes here on energy content and accounting of liquids, especially with regard to NGLs that per unit volume contain much less energy than distillates for example and also place of refinery gains where volume expansion is not accompanied by energy expansion. Personally I don't think ethanol should count as primary energy and should be treated more like electricity where one energy source is used to produce another.
It would be good if the IEA began accounting using net energy content of fuels - but dream on.
Very interesting... Is there any chance someone "behind the scenes" could distill out the essentials of this discussion, and run it as a main post?
Here is a comment from a college kid named David Murphy:
If we are to consider NGLs and other unconventional resources of oil as substitutes for oil, than we should also consider conventional oil a substitute for whale oil. After all, whale oil and the oil sands are both chemically similar to crude oil, and crude oil production offset the decline in whale oil production due to depletion of whales just like NGLs and unconventional oil may offset the decline in crude oil production due to the depletion of conventional crude. Thus, by this transitive property of economics, we are really still waiting for a peak in whale oil production!
If anyone would like to frame their argument to consider all combustible hydrocarbons as crude oil, that’s fine with me. However, we all realize an important point concerning the transitions between types of combustible hydrocarbons is their relative costs to find, extract, and produce. The real cost to find, extract, and produce conventional petroleum is lower than whale oil – so obviously that was a good transition, economically speaking, for everyone but the whalers. The real cost to find, extract, and produce non-conventional petroleum (tar sands, e.g.) is higher than conventional petroleum, so obviously this will be a less good transition – for everyone but the Canadians.
Yes, "all liquid fuels" includes CTL, as well as biofuels, and NGLs, GTL, syncrude from tar sands. Thus it's closest to "everything you can pour into an engine, however produced", except for the lightest fractions of NGLs.
IF it's true, then ha, ha. It'll teach us not to have an evangelical hold on our ideas. Even our best science, to paraphrase Einstein, is a meager thing (but it's all we have).
Two words: Downward revisions.
Seven words: Never trusted any of the numbers before, still don't.
Three words: Cantarell, North Sea.
Two more words: Undulating plateau.
Four words: Specific peak don't matter.
Eight nice words: Thanks, Stuart. Nice, condensed report. I likes that.
"Nice, condensed report."
Yes indeed. This is condensate we can appreciate '-)
But I must admit to missing Rembrandt's excellent monthly oilwatches. Are they coming back soon?
Should be one this month.
I hope so. Please, Rembrandt, pretty please....
One word: Afghanistan
Two words: Kazakhstan, Turkmenistan
Three words: Gulf of Mexico
One more word: Iraq
Four words: Iran, the real prize
Five words: The American military industrial complex
One more not so nice word: War
And todays bonus cover-up numbers: 911
A thorough examination of the matter:
And just three more words: truth will out (Shakespeare, The Merchant of Venice)
Maybe the glass is still more than 1/2 full
hey stueys back.. how far north of 74mbd C+C are we looking at ? Are we envisaging a new C+C plateau bouncing around 76mbd?
won't somebody just turn the tap off?
My view is that it depends profoundly on what happens in Iraq, which remains extremely uncertain. If you listen to Dr al-Shahristani, the Iraqi oil minister, we're going to have another 9mpd or so in seven years from there. Nominally, all the world's IOCs are signed up to produce different pieces of that 12mbd. I don't think anyone else outside of Iraq will credit that production can increase so much, so fast. And if the country were to descend back into civil war, production could go down, not up.
ok ..lets say they do start pumping out 9mbd for a decade or 2 where does that leave us?
a ramping up of C+C production to a new peak as opposed to a new plateau is possibly the worst thing that can happen.
thats a recipe for severe disruption/dislocation.
the bumpy plateau regulated by cartels is in fact in hindsight a good thing
Iraq's daily oil production exceeds 2.7M barrels (jan 2 2011)
http://www.google.com/hostednews/ap/article/ALeqM5icBHVbM1r1xIh06wM-LzPc...
Iraq oil daily production exceeds 2.6M barrels (dec 27 2010)
http://www.google.com/hostednews/ap/article/ALeqM5idaLlTuDsX3vEHaNI_3Rff...
iraq up 300,000 bpd since november ?
Tupi production starts (oct 28 2010)
http://www.offshore247.com/news/art.aspx?id=17760
pearl gtl phase I startup early this year ? ~130 kboepd (gtl + ngl)
i think we will see a new annual peak in 'total oil production'(eia definition).
The big question is: what will be the OPEC quota for Iraq? Iraq is now outside the quota system but that would change once Iraqi production went beyond a certain limit and we don't know what the other OPEC countries will accept. Certainly they would not want Iraqi production to go up in a way that oil prices dropped.
i agree, i have a suspicion that opec has not increased quotas of late to make room for anticipated iraqi oil production.
the last time iraq had a quota, it was equal to iran's. in '88 when iraq's quota was set equal to iran's, iraq's quota came primarily at the expense of kuwait,libya,ksa and uae.
If all goes according to plan, here is how that is supposed to look (click for larger versions):
If they were further ahead by now, we might have seen this:
Stuart,
Thank you very much for your post. It is important that reality is discussed on the Oil Drum from time to time. The world is facing an incredible energy crunch due to rising populations and rising living standards, but the debate is ruined by the the constant screams of "Peak Oil was yesterday". As I have stated in many previous posts, oil production is likely to keep tending upwards for a considerable time to come and for now there is no absolute peak in sight. I have also, time and time again, attacked the "typical" oil drum production graph: This shows oil production falling sharply from "tomorrow" and never takes into account new production. One of the worst examples is of course the now ridiculous post from ACE posted on the 17th of March 2009:
http://www.theoildrum.com/node/5177
This post shows an expectation of crude oil and lease condensate production collapsing to 67 million bbls/day by the end of 2010. (Based on EIA figures). The real figure as you point out in your post is likely to be somewhere between 74-75 million bbls/day.
These predictions are not just wrong. They are completely wrong.
In order to have a productive debate about the future of world energy supply these posts are not just unhelpful, or stupid, but actually exceedingly harmful to the discussion. They make it far to easy for production optimists to point out the the "peak oil nutters" got it wrong again.
I have learned an incredible amount from reading the posts on the Oil Drum on a daily basis over the last three years. I have gone from not knowing much about Peak Oil, to being a true believer, to my current position where I see that providing energy for the world will be exceedingly challenging. The most important thing that I have learned is that it is extremely difficult to predict the future. No matter how complicated and brilliant your model is (WHT!), if the inputs are useless so is the output.
Iraq, Brazil, Saudi Arabia and perhaps others may have the capacity to increase oil production fairly quickly. Time will show by just how much. But I certainly think it unwise to rule out large increases in production from all three.
ps. The latest fad on the Oil Drum has been predicting that Russian oil production is about to collapse. Don't be suprised if it suprises us all and keeps tending upwards!
You made some good points, and I have frequently pointed out that North Sea producers were able to put new fields--whose first full year of production was 1999 or later--into production that had a peak of about one mbpd in 2005. These post-1999 fields had a production peak equivalent to about one-sixth of the 1999 production rate, and the new fields served to keep the post-1999 overall production decline rate down to about 5%/year.
In any case, as noted up the thread, a reasonable estimate is that the volume of annual global net oil exports not consumed by China + India dropped from 41 mbpd in 2005 to about 35 mbpd in 2010. As we have noted in our presentations, the data trends suggest that the US and many other OECD countries are well on their way to "freedom" from their dependence on foreign sources of oil.
But only in the rearview mirror are they wrong.
You make some good points, but then you fall to committing the same error your criticize:
I'm not trying to be rude, but you no more "know" this than the near-term peakers "knew" that production peaked in 2008.
If enough people broadcast predictions with enough variation among them, then someone is going to turn out to be "right" simply by default, by chance alone. How do you know you were right because you were right, and how do you know you were "right" simply by selection among the various outcomes "predicted"?
Reading Thomas Kida's book "Don't Believe Everything You Think" has helped me to forge this new agnostic view of predictions. Beyond a 48-hour window, even weather forecasters have to say "fat chance."
This is not some new-found "cornucopianism," either. It actually compounds our tragedy that we can't know the future better.
Two points: (1) Deffeyes and (2) Foucher
Regarding Deffeyes, his estimate for global conventional (C+C) URR was about 2,000 Gb, and his model put the global crude peak between 2004 and 2008, most likely in 2005, and he thought that slowly rising unconventional production would not be sufficient to keep production increasing. So far, he has been right on both counts.
Regarding Sam Foucher's work, following are the actual and predicted production, consumption and net export charts for the combined output from the (2005) top five net oil exporters, Saudi Arabia, Russia, Norway, Iran and the UAE. I presented these charts at the 2007 ASPO conference in Houston. At that time, we had actual data through 2006.
The charts have been updated, with the actual 2007, 2008, and 2009 data points shown with red circles, but not otherwise changed. Note that while Russia's production has been at the top of his projected upper limit, the top five combined net exports have been between his projected middle case and high case. This ongoing decline in combined net oil exports, relative to the 2005 rate, against a multiyear increase in oil prices relative to 2005, is in marked contrast to the rapid increase in net oil exports from 2002 to 2005, in response to rising oil prices. Finally, Sam's most optimistic forecast is that by the end of 2014, four years hence, Saudi Arabia, Russia, Norway, Iran and the UAE will have shipped more than half of their post-2005 combined CNE (Cumulative Net Exports).
Would that you had been the one the media focused on in the last decade or so.
But nuanced views like this aren't much esteemed.
I was contacted by producers for both CNBC and MSNBC in the past, but after I sent them some of our net export work, the producers decided that they didn't need me "at the present time." I don't blame them. If I were a producer for a MSM show, I wouldn't invite myself either.
In any case, it's not often that my views are described as "nuanced." It's probably more accurate to say that Sam Foucher, the smarter of the two of us, has more nuanced views.
Thanks WT. I was also resisting the urge to levee a wise crack about "nuances". The last geologist I saw with a nuance attitude was laying in a casket. Perhaps my nuance is too subtle and I should expand...na.
We'd all cheerlead for you to speak. ;-)
Maybe Charlie Rose should interview you. He interviewed all those gold bugs recently. Why not look into the high oil prices?
Yeah, but even though the building where I live in south Florida has survived every hurricane since it was built in the sixties, the bank that holds my mortgage still insists I carry wind insurance. Maybe I'll try to convince them that they can't know the future and that since the building has an almost 50 year track record of standing up to the forces of nature I really don't need the insurance, not to mention that our condo association just put in a brand new roof at our expense... The point is, that while we can't know the future we can still make some reasonable assumptions about it, given what we do know.
This is what happens: when confronted with the fallibility of our ability to predict the future, we simply change the definition of "prediction" to "make some reasonable assumptions about the future."
And here we are, concerned about when oil will peak, when we acknowledge we don't even HAVE the data....
Peak oil production, c & c. Peak all liquids production. Peak energy content production. Peak net energy production. Peak exports. Peak per capita production of whatever. Monthly peak or annual peak or decadal peak?
It is simply ridiculous to engage in a debate about the moment of peak oil production. It is an era and it began more or less a decade ago, we'll never know for certain.
So now how about we focus on the issue of peak conversion efficiency? That should be fun.
You're right, of course, but here's the thing. People on this site constantly accuse the EIA of overly rosy forecasts... I especially like this figure from a post by Gail back in June which shows how every year from 2007 to 2010, the EIA has predicted that *this year* is the year oil production is really going to take off, and every year they turn out to be wrong and revise their predictions downward ... but next year for sure! It's Lucy and Charlie Brown with the football.
Nordic_mist's point is that many peak oil folks are guilty of exactly the same crime, in the opposite direction. How many people who've posted oil projections have taken the time to produce a graph like Gail's, for their own predictions? I'm willing to bet that most of them look a lot like the EIA data above, flipped upside down.
As a handy rule of thumb, I believe that any prediction that suggests that *this year right now* is the start of a whole new ballgame, up or down, is probably wrong. For sure, one day soon one of them will be right, but given the failed predictions of the past, I wouldn't bet on any individual one.
Bayesian reasoning based on prior data will always push the predictions out. If the actual prediction is a simulation and you exist in the here and now, fluctuations in the past are discounted while fluctuations in the future can still occur. That generates a bias in the positive direction. You can't avoid this and the people that don't understand this simply don't have the insight into the way that counting statistics works.
Required reading:
http://mobjectivist.blogspot.com/2009/12/monte-carlo-of-dispersive-disco...
Nice post. Thanks. Out of interest how much deviation do you see if you alter URR?
Not much for peak position.
Thanks. Very interesting.
You are invited to come up with your own number crunching for future oil supplies, including tables and graphs. Just to say that previous forecasts were wrong is too easy in hindsight.
One analyst who was right about the 2008 crunch was Chris Skrebowski, former editor of Petroleum Review
22/10/2010
Megaprojects increments: next oil crunch 2012
http://www.crudeoilpeak.com/?p=1971
Moreover, even if we had another spike in oil production what would that matter? Would you delay all the projects necessary to get away from oil? We are already very late now.
And an increase in the production rate means an increase in the rate that we are depleting remaining oil reserves. On the net export side, Sam's most optimistic projection is that the post-2005 supply of top five CNE (Cumulative Net Exports) is being depleted at about 8%/year. Party on!
Chris Skrebowski work is very good and he recently said the global recession delayed peak oil by couple of years from 2010 to 2012.
What is important is when yearly global oil production exceeds 2008 which is believe it will in 2011 and 2012 this website will be open to attack by the likes of CERA.
The message of global oil production peaking will be even more difficult to get out.
jaz - I'll save westexas some time and point out his mantra: global oil production isn't the critical metric...it's global net oil exports. And beyond that figure the key qualification, as far as the US is concerned, is US oil import volumes: we can't buy what the exporters consume internally nor import what China has taken off the market by tying up reserves around the globe. Maybe global oil production will reach a new peak in 2012. But that won't necessarially mean the US has access to as much crude then as we do today.
Part of the problem is the definition of peak:
Does it include all liquids? Why is Ethanol part of the mix, since it's an odd mix of fossil derivatives and sunlight?
Does it include tar sands? Could it include shale? Bitumen coal-to-oil? If the point was "crude is peaking", then why include the rest?
Does it include the concept of energy density? Not all barrels are equal barrels.
Does it include net EROEI?
Does it include inport/export math?
Does it include some notion of affordability?
Any notion of production without some inclusion of cost of useful energy is quite pointless. Actually, even then the concept of usage efficiency makes a large impact in terms of utility. In the end, how much it costs to get something useful done is the key -- the rest are just variously correlated indicators.
I would argue that a new production peak at $90 versus the old $20 demand plateau is of questionable value. All it really says is "yep, conventional oil is getting pretty hard to get".
Time to start investing in efficiency, I'd say.
When I first started posting here almost 5 years ago (!!!), I revealed myself as the gadfly I am by saying peak oil would be easily predicted, if you had an agreed definition of "Peak" and an agreed definition of "oil". I am now more interested in peak hydrocarbons, because the cuttying edge of the crisis is now carbon release. Soon enough we must reach peak carbon, and we will, by mandate if that is what is required, because we now know the world is full of carbon, but if we accept the models as given, we cannot be allowed to burn it.
RC
Been a short five years, hasn't it?
Well, OK on the carbon thing. Except we don't accept the models, and we don't have any mandates, and nobody will stop us from burning it.
Still no globally accepted definition of oil or peak either.
Ahh, good times!
I'm afraid I have to agree with Paleocon, and if I read that as paleoconservative, then our politics are way far apart. The coal is there, it will be damn tempting to burn it, and it won't peak for a long long time.
I have two data points for getting depressed about this. #1, the metric system. Still haven't adopted it, I am sure that you can find people who think it is a commie plan to do away with our American measurements.
#2, the Whole Foods parking lot at Fresh Pond Mall, in Cambridge, Massachusetts. A blue city, in a blue state, and a yuppie/lefty grocery store to boot. I ride my bike there, on surface streets, a path, and a small number of sidewalks (not from Cambridge). There's a handful of places to lock it, and I almost always find one. The parking lot is usually mostly full of cars, and often enough, completely full. Cambridge is flat enough, and plenty dense. (Cambridge+Somerville are about the same as Groningen, only even denser, but Groningen is the place where most people ride bikes.)
So, no metric system yet, and everyone driving cars in leftist-yuppie-central. I'd bet on us putting a buttload more CO2 in the air.
To bring that on topic: if we cant agree on the metric system we will hardly be able to "agree" on what to count for liquid petroleum products in the production statistics.
It is amazing that our tax-paid authorities got away with switching to "all liquids" without a clear definition and an official conversion factor, at least. They made a successful coup-detat.
coup de stat...;-)
And I agree they got away with a huge hoodwink when 'oil' became 'all liquids'. Soon to be 'anything that will burn'?
In addition to Linc Energy's underground coal gasification (which appears to be quite successful), there is now a venture to biologically convert coal to methane for extraction by wells.
If we don't get over our anti-nuclear hysteria and start doing something, I'd bet you're right.
The best thing to start doing is powering down, not building alternative unsustainable energy infrastructure to try to keep this whole sad edifice going.
We could do both -- what if powering down turns out to also be unsustainable? In particular, what if we cannot power down quickly enough? And understand, I am a big fan of powering down, but I don't see that it covers the whole gap. In particular, what happens when the rest of the world wishes to approach (not attain, but approach) US living standards?
The other problem with powering down, is the social inertia. If all of us living in the non-boonies (i.e., those with an opportunity to do as much as 50 miles of utility cycling per week) became vegetarian utility cyclists tomorrow, it would cut our gasoline consumption by at least 10%, perhaps 20% (*). There is nothing technical preventing this from happening tomorrow; there's enough bicycles out there, right now, there's enough people living in built-up areas, there's enough trips even in less built-up areas to allow 50 miles/week of this sort of bicycling. So -- why hasn't this happened yet? We're not waiting on any technological breakthroughs at all.
(*) Note that even though I am an advocate of VUB, I am not vegetarian, nor do I use my bike for all bike-possible trips. I ride about 50/week -- all bike-possible trips, would probably amount to 120 miles per week. I'm pretty confident of the 10% estimate; 20% is a stretch, that is probably what you get if you do a purely technical definition of possible bike trips.
Liquid-thorium-salt reactors look a good deal nicer than the nukes that we are running now. Go read the wikipedia article, there are some tricky "watch out for this" parts, but overall, it allows a design that is much safer than what we have now. Almost every part of the nuclear story, is better. Reduced waste volume, shorter-lived wastes, easier to toss obstacles in the way of weaponization, reduced complexity of the reactor itself, lower pressures, inherently stable designs, possibility of higher temperatures (higher temperatures are good -- thermodynamically more efficient in conventional generators, provides interesting opportunities for chemical processes). It's not entirely sustainable, but instead of buying us 100 years, it buys us 10,000.
Would it buy 'us' 10,000 years of clean water, stable climate, species re-genesis, soil replenishment, etc? If not, then we'd simply drive ourselves and the planet to oblivion with more energy to hand.
Very good points and clearly demonstrate the futility of nuclear advocacy which concentrates on the technology instead of the big picture.
Not by itself, but it's a down-payment. The MSR/LFTR in particular helps a lot with the climate and may also be of great assistance with waste disposal.
If people burn everything they can't eat in a desperate attempt to make it through a crash (excuse me, "unplanned rapid powerdown"), I don't see this being good for the planet either.
what percentage of power generation do you see these being, and over what time frame built? i ask only because this issue has been discussed often enough here for us to know one thing for certain: you cannot ramp up production anywhere near quickly or cheaply enough to solve the problems we face. what size slice do you think nuclear can realistically cover in the 5 - 40 year time frame we have?
Well over 50% of total generation.
20 years or so.
Discussion here doesn't mean much in the grand scheme of things.
A serious (Manhattan Project) ramp-up would be much faster than you think.
If you look at 40-year timeframes, immense changes have happpened several times already.
I'm looking into the feasible ramp rates in nuclear technology. I'm barely started, but I will announce my thoughts when I have them.
dr2chase,
If the world tries to reach living standards of the US, or even Europe, then that, by definition, is not powering down. Now I can see why simply adding power sources, to take up the slack of reducing fossil fuel supplies is comforting - it allows little substantial change in lifestyles (or, at least, appears to do so) but trying to power an essentially unsustainable lifestyle is bound to end in disappointment. If you support nuclear to bridge the gap, why not support powering down to remove the gap?
I'm not aware of any liquid thorium salt reactors being built. It's common to hold out hope for some technology that is not yet commercially available but I don't think that's a good strategy, regardless of whether the technology is sustainable or not.
Do please look in Wikipedia, it looks like a relatively evenhanded and detailed discussion. There is a huge supply of thorium, compared to uranium. Suppose, hypothetically, just for the sake of argument, that it actually worked pretty well? Maybe not electricity-too-cheap-to-meter, but a solid supply that won't run out, and won't fill the atmosphere with CO2? Some of them have been built; their worst problems appear to be chemical, related to their use of fluorine salts.
And powering down can take several forms. Better insulation, LED lights, and bicycling around town, solar-assisted heat, are all ways of powering down, that do not reduce living standards. Suppose we could have that, with no CO2 footprint? I see no reason why energy conservation should entail freezing in the dark.
My impression from the technical reports is that the biggest identified issue was micro-cracking of the Hastelloy-N from tellurium (fission product) migration between grain boundaries. This was successfully addressed in later tests by alloying with titanium.
The MSR eliminates several major problems of light-water reactors outright.
The problem with the MSR appears to be that it was too cheap and threatened the large contracts for development of the uranium-based fast breeder. (Later, the FBR was killed in turn. Whether anti-nukes or coal interests paid for the hit we'll never know, but they both wanted it dead.)
This is a point we should all make more often. It's not extremely difficult to do, but replacing or refurbishing all our wasteful building stock is going to take decades. People aren't going to accept freezing in the mean time, so your choices are coal or nuclear.
Nor do I see why being ecologically-minded should entail powering exclusively from solar panels and windmills. Nothing else on the planet has learned to get energy from thorium and uranium, so it's rightfully ours; there's a great benefit to us and no cost to anything else.
It's a little hard for me to believe the "too-cheap" conspiracy theory. If forced to choose a conspiracy, I would choose the "not a good source of bomb fuel" theory, but I'd rather not subscribe to such theories.
What I am trying to do, when I read about this thing, is imagine how they would work in everyday use, where clowns do sometimes work for energy companies (example -- the NSTAR guy in the neighboring town, who hooked a 3psi residential gas feed, to a 60psi main line. Boom!). I'm not sure, maybe fluorine is a feature, that stuff will f*** you up plenty fast, and keep people cautious. Insoluble salts at atmospheric pressure, that's a damn good thing (though note the badness of exposure to moisture -- but HF will also f*** you up plenty fast).
In terms of slow change, and social obstacles, note that our building codes still suck. We're talking about improving them, but movement? Not yet. The bike thing drives me nuts -- "sensible people" know it won't work in this country, even when we have cities denser than Dutch cities that exceed 50% ride share. "Sensible people" cluck their tongues and tut-tut about lawbreaking unhelmeted cyclists, when the risk of death from sitting (not exercising, getting fat, etc) in a car is far, far higher. "Sensible people", I get really tired of them.
Some have been built? Are there any commercial examples? I've been reading of such things for the last six years but all of the projected new capacity uses uranium.
Much of the powering down you mention would have a big impact, if it is a significant powering down (if not, then it's not worth it) because we have economies built on waste. We need to re-engineer our economies to be built on positive, useful, stuff and activities. Ideally, we need sustainable economies though I doubt many who post here would want that as sustainability means not consuming any resource beyond its renewal rate and not adversely impacting our environment.
I have no idea where you got the freezing in the dark idea.
please do bear in mind fossil fuels are but one area of depletion we face. look at china's reduction in rare earths exports... then there's soil, water, phosphorus.... and more... more....
The only power we need to stop using so much of is fossil fuel. The entire USA could be run on the solar energy already falling on roofs and roads; our big problem is that we're 20-50 years away from being able to do it. Nuclear can buy us that time, and the people in charge then can decide if they want to get rid of it or run it out for the next few thousand years.
Nuclear can buy us the time if we start building those thorium reactors now. How many are in plan right now?
The ideal solution (e.g. fusion, or "wasted" solar energy) is always 20-50 years away. The actual solution is to organise our economies and lives differently - sustainably. The end result of that may be 20-50 years away, also, but at least we then definitely get a workable solution rather than keeping our fingers crossed that getting enough energy from some future energy source can actually solve all of the problems of living unsustainably. Not likely.
In the USA, none. A Manhattan Project-level effort could replicate the MSRE in 2 years at most. That's the timeline from when the country gets serious.
Thank you for confirming my point. If the ideal never appears, nuclear is good for the next X hundred or thousand years.
Define "sustainable" in this context. Uranium and thorium are gifts from supernovae no less than 4.6 billion years ago, but they can sustain our current society for at least thousands of years without emitting CO2 or other pollutants.
The peak of fossil chemical fuels will last tens of years at most. The peak of nuclear fuels will probably last generations. That's long enough for the issues of peak population and everything else to be dealt with.
Very interesting thread. Thanks to all for bringing Molten Salt Reactors to my attention. Looks encouraging.
Exactly, none are in plan right now and that's my point. Waiting for the magic elixir doesn't really achieve very much. The notion that some alternative power source (that is not infinite) can keep our unsustainable civilisation going is definitely in the magical arena.
Sustainable, in the context of human beings behaviour, is living on the annual budget afforded by our only known habitat and in a way that doesn't degrade that habitat. Simple, really. Sustainable means not eing the architects of our own downfall. Nuclear reactors of whatever flavour isn't going to save our asses and it is a waste of resources to try, unless someone invents magic that really works. But the stuff I've been reading, for years, about thorium reactors, fast breeders, and so on, is amazing. One would wonder why these things were not about to be commissioned in vast numbers. That they are not suggests to me that the hype we read about them is just that, hype. But, hype or not, they ain't gonna save us.
Are you for real? There's no such thing as an infinite power source. The Sun isn't infinite. Hell, the entire visible universe isn't infinite. Even if we get off this ball of mud and power ourselves using the longest-lived of red dwarf stars, the best we can hope for is a few trillion years before the lights go out.
If you're a nihilist, stop reading here and log off. Killing yourself over the pointlessness of it all is optional, but please... GO AWAY. The rest of what I have to say will only upset you.
Still reading? Here's the rest of the story for readers who can handle nuance.
No civilization on Earth has lasted more than a thousand years or so. Nuclear energy can support more than our current standard of living for longer than that; on the time scale of civilizations, that IS infinite. But more to the point, the century-scale supply of fossil fuels has bootstrapped us to the hundred-plus century scale supply of nuclear fuels. Even that's not the limit; we're on the edge of gaining inexpensive access to directly-converted solar energy. That will last as long as Earth can support life, and a few billion years beyond. The problem is that we've blocked the progression to nuclear power for political reasons, and now depletion of fossil fuels threatens to bring down the whole edifice before we can bootstrap the next leap.
People who say it's wrong to use nuclear energy make me think of some single-celled moralist not long after the emergence from the primordial goo, as everything else ate up the abiotic organics and were left with the "sustainable" flows of energy-rich chemicals like hydrogen sulfide from volcanic vents. "Stop trying", it cried. "Be content with what we've got." The rest said "Nuts to you, we'll evolve if we want to" and one went on to invent bacteriorhodopsin. Running its proton pump on sunlight, it went on to be wildly successful and beget uncounted trillions of photosynthetic offspring tapping the hitherto-wasted energy from the Sun. The rest is, as they say, history.
Nuclear energy doesn't take anything away from other things in our habitat, and can even give back (reduced use of land for energy). It's a net positive.
There is no "perfect", there is only "good enough". Nuclear energy is good enough; not even matter-energy conversion is "perfect" because you'll eventually run out of matter.
Because the people with political power wanted them stopped, that's why. Read this commentary on the WASH-1222 report to see what happened to molten salt reactors.
Natural laws are inviolable, but what politics has done, politics can un-do.
And, of course, it's always worth mentioning that wind and solar could each do the job, if necessary.
Would using just wind, or just solar or nuclear, be the low cost solution? Of course not. But any one of them could do the job, if necessary.
We have an enormous supply of sustainable energy available to us.
Since when are bottled butane and propane and corn ethanol indications of increased oil production.
Havent we just changed the definition of oil to please some corporate executives and investors who are too lazy to read between the lines? Or is this just hot-air press for the MSM to pump out?
Seems that Crude oil is still the best EROI out there and it is fading fast. Thus while we can make bottled gas and other liquids -- can the economy afford them?
Just to point out to everyone making some version of this point - I explicitly consider in my post what happens if you restrict your attention to crude+condensate. It's quantitatively different, but the picture is not likely to be qualitatively different.
Over the years, I've taken many shots at Deffeyes et. al. But the truth is they are referring to conventional crude oil. Laherrere had a piece on ASPO site a few years back where he mentioned how surprised he was when the EIA started to shift the definition of oil.
So even C&C as a measure doesn't cut it if we are going to be picky.
There definitely is good chance that even a very pure measure of oil production will show a new record soon. Anybody very convinced of this won't hesitate to use a narrow definition.
Yes I see the point in your nice presentation -- fudging the oil definition makes the peak appear slightly later.
By their including these small-chain hydrocarbons it hints of a problem and a cover-up of the problem in my view. Why change it up? Science is based on standards. The standard is changing, which is dubious. The changing of the standard is meaningful in and of itself.
I see it as an accounting issue -- like cutting something with a lesser material. Reminds me of shifting definitions of a foot or the number of grains of gold in a gold coin.
If we cut the energy content using less energetic short chains in the mix, then we are devaluing oil. And yet the price stays fairly high. Interesting things happening at many levels.
but the debate is ruined by the the constant screams of "Peak Oil was yesterday"
I really get tired of hearing this. It's rude and, as pointed out below, a bit hypocritical. Until it actually happens, your position is also a guess, and nothing more. Are we going to see your apologies on these pages if downward revisions and lower future production leave peak in '08 or '05? Have we not got bigger fish to fry than hats full of I told you so's?
In reality, the only people who are correct are those who realize it's coming, or has come, and mitigation is way late, regardless, so are bucking up and getting some stuff done!
I also disagree with this idea it hurts the cause to speak what you believe to be true. It may well save lives. Waiting till too late to speak up definitely will cost lives. I prefer to err with the one that has some chance of saving lives.
I really get tired of hearing this. It's rude and, as pointed out below, a bit hypocritical.
Sorry you feel that way, but how can it be rude to contradict people when you thick they are wrong?
Kindly read the report found on website below, it gives good reasons for believing peak oil to be in the 2011-2013 time frame.
Also giving a broad time frame for oil production plateau allows for many uncertainties and lack of absolute data.
http://www.peakoilconsulting.com/
A study by Uppsala University is a case in point, where they concluded that depending on URR of Russia in will peak at 10.5 to 13.5 million barrels per day. There are many countries in the same position so this is why I think a broad time frame gets the point over much better.
http://www.tsl.uu.se/uhdsg/Publications/Aram_Thesis.pdf
From page 11 of report.
The immediate conclusion from the analysis is that the peaking of
Oil supplies is imminent and will occur in the window 2011-2013.
Also it is better for friends of this website to highlight what they think are errors rather than the likes of CERA who will clearly say in a years time:
Look peak oil concerns are wrong again.
you've not added at all to your argument, just repeated it. my point still stands: the post I responded to is still just a WAG and there is no way to be sure whether a fast decline or longer plateau will be the reality, nor is there a way to measure which is likely to be the more effective message.
it's a waste of time to discuss it, and more a waste of time to castigate people for speaking what they believe to be true. what is wrong is to truly believe a terrible situation is coming and say or do nothing about it, so let us stop giving each other grief on this and simply work to solutions.
We can easily predict the future. Only because the vast majority of the data exists in the past.
And, au contraire, the real models are simple and straightforward, its just that the geology departments and the industrial infrastructure so brilliantly execute intentional complexity that everyone becomes dumbfounded when confronted with the obvious math.
suggests a degree of confidence in integrity of the past data. Also that the contextually meaning of the past data is either a constant or variances are understood mathematically?
new meta data about the past is being created in the present as it where?
Just about all discovery data is in the past. I have done my best to model this data, yet apparently Nordic_Miss deems it too complicated.
Back dated discovery is in the present. Using this method skews the discovery curve making it look like less oil is being discovered in the present. The time at which new technology increases the production from old wells is relevant for the global production curve. It may help to extend the plateau because the application of the technology is a function of the price for crude oil.
Backdated discovery is essentially the same as reserve growth. I have incorporated reserve growth dynamics into the discovery curve making it fatter than the typical curve.
Do you have references to your mathematical model? Otherwise it looks like more talk/bluster, which is about par for the course.
My gut feeling is that you guys have it about right
...How detailed is less clear and judging how important it is "politically" to be on the money over the details seems to result in a lot of overly exercised discussion.
I think the question here is not whether there is some new peak jumping out the plateau but if a new plateau range is possible?
frankly I am not sold on stu's Iraq thing at all but its good he sticks his head in as a devils advocate .
My concern is if a new decade of ramping up in c+c leads to a more HL style curve rather than a cartel rationed plateau
I find this info amazing--both the IEA and EIA--neither of which are independent organizations--both with dubious track records-- are believed as they are by folks that should have enough knowledge about the oil industry to know better. Common sense should prevail here. I have been following energy for over 10 yrs and every time the price of energy goes up we start getting reports of greater reserves and/or we have nothing to worry about for 20 yrs or more. Countries that have been producing since 1913-1917-1948 all of a sudden can increase their production and or reserves at will-at least on paper every time prices go up. 56 of the producing counties are in decline yet production keeps going up with seemingly no allowances made for depletion--amazing this old world of ours--I guess all these other reports we read of decreasing production in uranium--gold--copper--rare metals etc. etc. must be all wrong also. I guess that makes us all fools for even having websites such as the Oil Drum--or a bunch of Chicken Littles maybe. No wonder our friends and relatives give us the blank stare or the brush-off when we try to talk to them about the energy situation--they actually no more about it than we do !!
agree
at the end of the day all we really have is price, and price trends
Big Bear
The point is if people on this website keep saying 2008 was the peak and the next year or so proves them wrong then they look stupid and nobody will pay attention to them any more.
Can you name the 56 countries in decline?
Energyfiles are independent I would find it difficult to prove their production figures badly wrong on any country
http://www.energyfiles.com/americas/brazil.html
jaz - I agree with you about the pointless effort of calling a "peak" at any point in time. IMHO in matters very little if the final max peak came in '05, '08 or '12. What's important to me is whether we are really on a long term plateau which will have a generally declining running average in the future. The numbers seem to indicate we've entered the PP in the last few years. Only another 5+ years will prove that to be so IMHO. But as I mentioned up thread: IMHO Global Peak Oil/Plateau isn't critical to the US. What will have great affect on our economic future is PI...Peak Imports. IOW we can't buy what the producers consume internally nor what the Chinese have taken off the market with the resource acquisitions over the last 10 years.
The plateau is our friend.
it is accidentally a global rationing system where cartel price and production control has by default imposed a depletion protocol on the "advanced" economies.
The export land model etc will has resulted in a pressurized decline in consumption by the importers that in time will have transformative effects on the economies of the "west"..
IOW the importance is not peak imports but that the rate of import decline is not too drastic to break civilization but instead act as a catalyst for change. An uncompetitive market restraint that acts in our favour. Another build to a new peak would not be conducive to change as much as a remorseless grind on a somewhat more sustainable plateau..
I would prefer a lower plateau of 70mbd as opposed to one of 74mbd or whatever and in this regard the time-span on the plateau is important as you say. A 10-20 year plateau strikes me as an almost ideal outcome as this point in time.
Rockman
I agree, China will ensure they get what they need and can pay for it in finished goods and real money. Looking at all the trade deals China are doing around they world for oil, Gas, Coal etc they will do better than some think.
The U.S. will suffer due to its government debt, personal debt and trade deficit, not counting oil imports.
Countries will be affected in differing ways by higher oil prices, some importers will be able to adjust better than others. Not all exporters will behave the same way, some will keep subsidies, some will not. Those decisions will impact on net exports.
Guessing who will do what, is beyond even the most informed people.
Let's have a look where that additional oil came from (IEA OMR)
September to October 2010
NGLs + 100 kb/d
Norway + 400 kb/d (but - 100 kb/d in next month, we know they are in decline)
FSU + 150 kb/d
October to November 2010
Saudi Arabia + 100 kb/d
Canada tar sands + 300 kb/d
FSU + 100 kb/d
Brazil + 100 kb/d
A new factor is Iran's 4-fold increase of petrol prices in December. That must have socio-economic consequences. We still remember what happened in the last years of the Shah.
Next problem already here:
Iran agrees to get payments from India in Rs; Awaits RBI nod
2011-01-05 14:10:00
Iran has agreed to receive payments for $12 billion worth of crude oil it sells to India in rupees but Reserve Bank of India is yet to agree to the proposal.
RBI had last month said that oil payments to Iran can no longer be settled using a longstanding clearing house system run by the central banks of nine nations -- including India and Iran -- dubbed the Asian Clearing Union (ACU).
http://www.sify.com/finance/iran-agrees-to-get-payments-from-india-in-rs...
30/12/2010
Another warning on Iran's oil production and exports
http://www.crudeoilpeak.com/?p=2448
http://www.crudeoilpeak.com/?page_id=51
By the way, the July 2008 peak was caused by an extra 800 kb/d demand from China for those Olympic games. The US recession had started in Dec 2007. In August 2008 we had the BTC pipeline attack and the war in Georgia. yet, prices went down, not up. Lehman Brothers came later in September 2008.
In 2005 we had Katrina. So every year is unique.
Of course what really matters, and what some have alluded to above, but not emphasized enough IMO, is NET energy. When biofuels, particularly ethanol, are included, that is blatant double counting, as diesel fuel, at the very least, goes into producing ethanol. When NGLs are included, the BTUs per barrel are about 70% of that in crude, so the NET available energy is clearly less than it seems from the raw 'total liquids' figure. Same is true of CTLs, Tar Sands etc., as Step Back noted. Finally, the EROEI on pretty much all forms of 'oil' is declining, as we drill deeper, under more water, in harsher Arctic environments, and in more marginal fields. What matters is how much NET energy is available to society to accomplish anything other than acquiring more energy. As we bump along this plateau, we are deluding ourselves by not acting on the fact that NET liquid energy is clearly now well in the rearview. Oh, then add the fact that global population is growing by 75 million/year, and we have NET per capita liquid fuel in precipitous decline. Yes, precipitous is a loaded word. Chosen purposefully. Stuart, I'd like to see you apply your incredible analytic ability to doing a similar short, sweet post on NET per capital liquid fuels. Different looking graphs, methinks.
This is a good point. Using diesel fuel to make other biofuel fuel is sick, but what is this correction going to be though 100,000 bbl per day or 10,000 bbl per day? I doubt it is more than that but I am guessing. Of course, double counting occurs with oil drilling. Diesel runs those rigs and pumps right?
Edit:
Also to make corn ethanol, they are using natural gas so this is really as way to get natural gas into the liquid fuel picture. Kind of sneaky. The market is just causing all these mini-transitions. The cover up here in including biofuels and propane is to try and mask the crude oil problem.
The bigger picture is the overall net per capita. Simply extrapolating from the reported "100:1" return of early oil, to the more recent of anywhere from 12:1 to 30:1 I've seen used (it is an elusive figure, but undeniably much less now than prior to 1970), then throwing in the near unity return of ethanol, and the single digit return of tar sands, and ballparking the whole mess at, say, 10:1 (that is, today's 'total liquids' yielding a net return of 10:1, meaning we can use 90% of gross for something other than procuring more energy) yields a net per capita figure in the neighborhood of 4 barrels per person per year. In 1980, that figure was right around 5. By the end of this decade, it is likely to drop to about 3. Our future will largely be determined by this ratio, and our responses to it. But who's talking about it? Not even us techies and doomers on TOD...
Hi clifman,
I appreciate your insight and mostly agree. I think there is a great need to begin the kind of transition plan that the DOE (US dept of energy) talked about several years ago: that it will take about 20 years of planning/preparation before the actual PO date to mitigate the worst consequences of declining liquid fuel supply. I guess it is possible that the actual date of PO could be 10 years away - but highly doubtful that it is 20 years or more in the future. So, where is the urgency to start this plan?
However, I think the Bigger Picture has other significant components:
- Population growth (as you mention) is a major driver. Some people on TOD tend to discount this factor but the reality is that the US on target to go from 308 million today to nearly 500 million around mid century. Nearly every developed country is still growing population regardless of fertility rate statistics (think migration issues). http://chartsbin.com/view/xr6
- Oil supplies could significantly increase (Iraq, Arctic,etc) or significantly decrease for political reasons (revolution in SA).
- Technology: the US MSM, in particular, is almost totally convinced that the need for liquid fuel from oil will dramatically decrease in the next 10 years or so. They predict much higher MPG, electric cars powered by renew-ables and nukes. Nanotechnology producing fuel from algae, seawater, garbage, whatever. I doubt they are right but the public perception of these issues is critical for facing or denying the underlying problems.
- Political pressure from the GW perspective. It is even possible that countries could band together to condemn the US for its contribution to GW - this could lead to many serious issues including war.
- War itself for any number of reasons.
- Real energy break through - nuclear, bio, whatever. Doubtful it could happen in time, but lots of folks belief in this possibility.
On one hand, I think the Big Picture is very complicated and defies prediction. On the other hand, if one looks at this like basic business problem, the only prudent action would be to start planning yesterday for monumental challenges in meeting our basic energy needs in the next couple of decades.
I think we've actually had the breakthroughs, as much as 45 years ago; they've just been suppressed for political reasons. If we can get it together to act before the people who worked on them are dead, we can un-suppress them.
I'm referring to the Molten Salt Reactor (especially the Liquid Fluoride Thorium Reactor) and the fast breeder technology GE is currently calling S-PRISM. LFTR in particular can generate process heat at high enough temperatures to gasify most anything we've got lying around and yield roughly 100% of the original chemical energy in the products. "Anything we've got lying around" includes unrecyclable plastic, scrap tires, municipal trash, sewage sludge, green waste... you name it.
The products of gasification in supercritical water at 600°C are mostly C1-C3 alkanes, CO2, CO and H2. These can be used directly as fuels or as chemical feedstocks for other things (CO + H2 is AKA "synthesis gas"). S-PRISM only runs at 550°C so it can't achieve complete gasification, but it would do a fine job of turning our existing stocks of spent LWR fuel into short-lived fission products and electricity.
We have literally hundreds of years of fuel supply for both of them; S-PRISM won't even require mining a thing until around 2300. How's that for anti-doomerism?
I have asked many times about this technology. The answer is always politically loaded: the far left hates nukes, even for energy. They would cut off their collective noses to spite their collective faces.
During the last State Democratic conventions, I tried to introduce a plank supporting newer technologies - and was rebuffed. I tried a peak oil plank, and while it lost it was a close vote. I was approached by many other delegates asking questions, and offering personal support. And yet, there remains a faction for which anti nuke is a religion, not a science.
All of which reminds me in an eerie way of the right wing anti-AGW position. Both extremes reject good science. Both hold a position as a matter of faith, not to be questioned. Together the kooks will bring us all down, all the while smiling smugly in their victorious ignorance.
/rant off/
Craig
I have been reading some GE presentations on S-PRISM from the first Bush administration (2003 and thereabouts). I think it's significant that it didn't go anywhere despite both houses of Congress and the White House being held by Republicans.
The coal lobby? I have a feeling it was inertia for that Congress more then anything else
Goodness knows, but the environmentalist converts to nuclear power (including Lovelock and Greenpeace co-founder Patrick Moore) have certainly not been loud enough.
the far left hates nukes
Guess I'm not far left after all. The LFTR looks like a good bet. I can suggest one thing -- I see a recent article on "How to talk to a conservative about bicycling", and I think one issue with LFTR is that even though lots of problems are solved by design, it's still got plenty of "interesting" technical properties, and if you're talking to a non-tech liberal, that's going to put them off. A condescending tone is the wrong answer :-). Also, note that some of the ways it "works", are also "interesting" -- the fact that gamma rays in the waste stream ("gamma rays, aren't they bad?") make it unsuited for nukes, that's a hair subtle. Remember that the world is full of flim-flam artists, and who's to know that you aren't just selling cold fusion or a water carburetor?
May I suggest a compromise? Bikes (where appropriate, which is many places), and (thorium) nukes.
Putting in terms the average Joe/Jane will understand: It doesn't matter if I get a 10% raise if taxes go up 20%.
The fascination with volume seems an anachronism. We should lobby for IEA, EIA, CERA or Bob down the street to report in Joules gross and net. In the case of world production gigajoules or exajoules.
For the record, I've lost faith in any of these organizations to report objectively (except Bob of course). And that applies to the Iraq numbers also. They are all just political numbers intended to put faith and good cheer into the economic outlooks.
By Bob did you mean "Baghdad Bob" Someone you can believe in!!!
I think it would be interesting (tho I don't have time to do it) to graph global credit expansion vs oil production/price. The boost in liquids since 2009 is obviously in response to central banks turbocharging immediate consumption in lieu of currency health/future consumption. I would bet that price will be highly correlated with any easing up on aggregate govt credit growth (think austerity package or rejection of new debt ceiling etc.) And then production would follow suit. Ie. what is the elasticity of credit growth to oil price? I dunno but would guess its pretty high. (and pre-2008 it was linked to normal commercial bank practice of credit growth...i.e. it was viewed as business as usual)
One would see the impact of the North Sea peak around 2002, when oil prices left the 20-30 dollar band for good. I assume that oil importing countries took on more debt to finance the higher oil price. So this may have speeded up the accumulation of debt, a problem which converged with limited oil supplies after 2005 and caused the GFC.
In the case of Germany, for example, there is an upward kink in 2002/03
German government debt in billion Euros from here:
http://www.insm.de/insm/Themen/Steuern-und-Finanzen/INSM-Dossier-Konsoli...
The oil crises of the 70s also resulted in an increase of debt growth. However, there are other factors: after 1990 the cost of re-unification. So these graphs would be different from country to country, also reflecting the varying policies of different parties and governments.
what about the delta? e.g. change in debt vs change in production?
There was a mayor recession 2002/2003 in Germany, which was definitly not caused by high oil prices giving the high taxes on gas in Germany. Till oil went well over 80$, the price of gas in Germany wasn't really effected at all. To some degree the heating oil and oil for industrial usage, ok. I think Germany is general a very bad example, especially in 2002/2003. You can see that throught 2005 till 2009 the rate of dept growth decelerated, despite the rise of oil from 50 to nearly 150$! All things are very complex...
Check out what Oil analyst and energy consultant Michael E. Lynch, (not cornucopian Michael C. Lynch) has to say about OPEC production and world decline rates here.
Will 2011 see another crude oil price spike to $150/bbl?
Ron P.
In terms of public press relations, you only need one agency to report a new monthly peak to then use that as an argument point against peak oil.
That agency can be completely off in their accounting and the MSM and other anti-peak oil folks can use it to hammer on the exact prediction of the peak year, which is their favorite counter-argument it seems.
They are obviously stretching the definition of oil. At some point they will try to add in natural gas as oil, too -- I guess ethane is technically next to add -- ethanol is close enough to ethane although it is a liquid at STP.
But at some point you cannot have a hydrocarbon with less than 1 carbon. That is the technical limit of their questionable definition of oil. LMAO
Thanks for the thoughtful post, Stuart.
I agree with you by and large.
I am more pessimistic on Iraq, though. I've read DB's new report on PO(just like you did, judging by your blog) where the authors say that going beyond 6.5 mb/d will be very hard for Iraq. Also, the only country that has any significant reserves beyond Iraq in the ME - or so we are told - is Saudi Arabia.
The DB report calculates their - SA's - reserves at about 4.1 mb/d in extra capacity, about 1.4 mb/d lower than the Bloomberg estimates. Considering that world demand is about 1.5 to 2.5 mb/d per year, without Iraq we're fairly fried.
And add to this a very unstable country rife with political divisions and potential for violence and civil unrest(if not civil war).
I think that Bob Hirsch is still the closest. He predicted a real peak within the 2012-2015 timeframe and I think that all the data shows him to be correct.
The DB report also claimed that it mostly depends on two factors: Iraq's production and world demand. If world oil demand grows by 1.5 mb/d and Iraq does very well in their increase of oil then the peak will come at about 2014 according to the report. If demand is higher, at about 2.5 mb/d (which is close to the number that 2010 had) plus a less-than-stellar production rate in Iraq, then there will be a complete loss of exess capacity by 2012. And this is assuming the Saudis are not lying or overly fudging the numbers about their reserves(which is quite a leap of faith to make considering the weakness of the data).
I am curious what you think of all this? It appears to me that both DB and Hirsch are very close in their prediction view (2012-2015 roughly for both), but then both diverge after the de-facto peak. DB is actually predicting lower oil prices in 2017 and subsequent years later rather than in 2014.
An interview Hirsch gave a few years back is what got me interested in PO, I also think he is someone worth listening too.
Forgive my ignorance but whats "DB"? Deutsche Bank? The only PO report I found on the internet from them was published 2009. Gotta say these little shortenings are a pet hate of mine on TOD (there's one!).
I'd also like to hear Stuart clarify his opinion about Iraq, considering there's been wide scepticism about the 12mb/d target..
What concerns me about Hirsch is that he seems to rational on this issue, but is utterly irrational on other issues with even more scientific certainty. It says something about his analytical skills, no?
I think DB is Deutsche Bank, yes. http://earlywarn.blogspot.com/2010/12/deutsche-bank-125-oil-spike-in-201... has a link to the report PDF.
Re Iraq, I don't think Stuart wants to commit himself.
From reading between the lines on Early Warning, I'd say he was sceptical, but less so than most others. I (for instance) think Iraq will top out at less than 6 mmb/d , most likely 4.5 to 5 - but I have the impression Stuart thinks 7 is possible.
Technically and with present prices Iraq could produce 12 million b/d in 2020 - no doubt of that. All the difficulties are political: within Iraq's oil ministry, between the oil ministry and other government bodies, between Iraqi governments at all levels and foreign oil companies, within regional governments in Iraq, between regions, within the ruling national coalition, within the Iraqi national parliament, within and between political factions in the population, between Iraq and its neighbours, within OPEC, and globally.
12 MM b/d confers too much clout.
> DB is actually predicting lower oil prices in 2017 and subsequent years later rather than in 2014.
I'll stick my neck out and agree with Deutsche Bank, except maybe on the timescale.
Look at things from an economic point of view. You have the immediate run, the short run, and the long run.
In the immediate run, supply plans are effectively fixed so unanticipated demand causes a price spike.
In the short run, supply increases. Seems to be happening now - oil's lead times are much longer than most other industries', so the 'short run' has been seven or eight years rather than the usual one or two.
In the long run, substitutes come into play, people's behaviour changes, and the structure of demand changes.
We've had the spike. We're seeing the supply response. We are also seeing substitution creak into action: Coal to liquids. More non-corn biofuels. More patronage of rail. Electric vehicles. More telecommuting. Behaviour takes a bit longer to change, but we can expect more shopping from home, more daily trip planning (fewer trips and total miles), fewer driving vacations, and people living closer to their workplaces. Over time, we'll see increased urban density (more walking) and more investment in public transport. All of these are embryonic at present, but give us another five years of high prices... we'll hit the knee of the demand-reduction S curve sometime soon.
There's also the impending retirement of the Baby Boom. Demand could fall away quite dramatically.
Thanks for the pickup with the Deuchse Bank report gregvp. The timescale of lower prices due to reduced demand as alternatives take oil's place by mid decade seems way too short to me. Recession may reduce price and demand, but that's a diffferent story.
And thank you Stuart for the great contribution, and to the TOD editors for publishing it. Hope we see a few more from you in future.
Any chance for a graph showing NGL and other all liquids production minus oil and C&C ?
The original source website is not user friendly.
13/4/2010
Natural gas liquids and other liquids mitigate crude oil peak
http://www.crudeoilpeak.com/?p=1352
Needs to be updated
OK thanks well if NGL's really are alternatives to crude oil looks like they have been steadily increasing.
I'd argue that they should have driven the price of oil downwards. Add in all the other junk in all liquids and assume they really are alternatives to oil why would crude prices have much support at all ?
NGLS for the most part go right into gasoline which should allow higher diesel production pressuring crude prices.
I actually don't have a problem with this all liquids concept. If it burns in a motor well fine it burns.
However I don't see that the price action for crude matches will with true substitution of oil via the all liquids concept.
I'd argue looking at NGLS as alternative to a barrel of oil is wrong they replace a barrel of gasoline refined from oil which is what about 30% or so of a barrel. Looking at them as alternatives to gasoline then NGL's impact should be 3x its volume. The graph you linked has NGLS increasing by about 1.5mbd if so it should have offset oil by about 4.5mbd or so as a gasoline substitute. A similar argument applies to ethanol aka it should be matched with gasoline not a barrel of oil. And it should have also freed more barrels of oil for distillate production.
This should have enhanced distillate recovery per barrel i.e we should have been able to get a similar increase in distillate production for every barrel of crude i.e say 3 million barrels or so ?
Also perhaps use of NG and propane for transportation needs to be considered. As these grow they also offset.
Overall I'd argue that the all liquids alternatives could easily be modeled as replacing as much as 10mbd of effective crude oil demand if you agree that they are product replacements not crude replacements.
On top of this we know that refineries have become significantly more complex not only to handle the heavy sour crudes but also to become more flexible in their inputs and outputs. I'd argue this easily adds some significant increment to our ability to make diesel and gasoline.
If one assumes all liquids continue to increase even as oil prices fell through the recession well demand had to have fallen significantly more than is indicated by falling oil production alone.
On the product side one would expect price pressure not for gasoline and not for diesel but for the lower end heavy products that are not replaceable by all liquids. Perhaps this is offset by a decline in light sweet production ?
One can look at NGL prices vs crude in this article.
http://seekingalpha.com/author/elliott-gue/instablog/3
For example if you look at the graph after the collapse in oil prices in 2008 OPEC claimed it cut oil production to keep support prices. However NGL's where not cut. This should have resulted in what ? If the overall demand for gasoline simply was not there well NGL prices would I think have remained depressed and still be depressed ?
Or perhaps if oil was being held back and NGL's allowed to flow then we should have seen a premium develop for NGLS well before oil prices started to rise again ?
How did non-OPEC NGL production vary as its oil production increased ?
I don't know the right answer I'm simply posing some questions.
At the very least any fundamental driver for the oil price spike is highly suspect indeed I'd argue it was pure speculation. All liquids should have I think easily ensured that even as prices rose they would have stayed fairly well bounded as rising all liquids offset oil demand.
Indeed the "implict" oil demand using the product argument seems to be and astonishing 20mbd or so from 2002 if one includes the sharp jump in oil production.
This suggests that at least until the crash we had a global economy on steroids esp if ones also willing to include the implicit dampening effect of high oil prices.
For example if oil had stayed at 30 dollar a barrel the "implict" demand for 30 dollar oil was what 30mbd 40mbd ?
Figuring high oil prices resulted in unmet demand close to the doubling of price.
I would think this would have shown up in production stats.
http://oica.net/category/production-statistics/
Using that link totals in 1999 where 56,258,892
At its peak in 2007 it was 73,266,061 for a change of 17,007,169.
As a comparasion the US produces about 12 million cars.
The average yearly increment is a little over 2 million.
However what these numbers don't tell you is what the replacement rate is the US market is fairly
saturated of course so for every car made in general one is scrapped.
One can consider for a moment Cuba where every car that entered the country any time in the last century seems to still be on the road. Thats and extreme however although poorer countries used to not see a large increase in sales their scrapping rate was also very low well below the US. Transport stock stayed on the road for decades.
It makes sense to consider that as third world economies improved dramatically that the scrapping rate would have also soared. All these old cars where dumped in favor of newer ones. Instead of some dramatic increase in rolling stock once the money was available decades worth of old stock was scrapped rapidly over a period of a few years.
The average age of a car on the street in say Indonesia went from say thirty years to five practically overnight.
Also of course in general the newer cars would have had much better fuel economy.
Lacking the global scrapping rate its tough to know. I do however know from my visits to poor countries that practically every car on the street is new these days. All the old stuff I used to see is simply gone.
Perhaps not the best statistic but its very noticeable. Just like when I go back to Arkansas and notice all the old cars still on the road.
Regardless without a good handle on the scrapping rate its tough to know the overall change. If I'm reasonably correct about a sharp increase in scrapping rate well then the actual total number of vehicles on the road may have not changed all that much perhaps less than 1 million per year if at all.
Regardless the world seems to have bought a lot new cars. Without good numbers about the scrapping rate or at least average age of the vehicles on the road in various countries you can use these numbers to make any argument you wish.
If my concept that what happened was a massive scrapping of old inefficient vehicles is true heck oil demand could have even fallen sharply. We do have the changes in fleet fuel economy for the US as cafe standards took effect. And rising fuel prices coupled with lower wages suggest that those buying cars in the third world would make fuel economy a priority. Heck the general congestion in poorer countries and lack of highways ensures that the cars are often driven at low speeds. And of course the average mileage is lower.
Heck this study suggests that driving styles and congestion have a pronounced effect on fuel economy.
http://www.sciencedirect.com/science?_ob=ArticleURL&_udi=B6VH3-41360PK-9...
One wonders how the surge in new car ownership and rising gasoline prices effected driving styles in the third world. And at least in my experience driving styles vary wildly between the first and third world. Its very aggressive in one sense in the third world but also people don't accelerate nearly as hard. Its a game of chicken at a fairly constant velocity. They generally don't speed up or slow down no matter what happens until they are forced to stop. Nerve racking yes how it effects gasoline consumption dunno.
Any way I think lots of questions are plausible it seems that you can at least interpret the data a number of different ways esp given that we are missing a lot of critical data.
Indeed changes in the age of the fleet coupled with perhaps changes in driving styles as oil prices rose could alone have impacted demand to the tune of several million barrels a day. Real conservation efforts even more so.
And last but not least in many third world countries car owners often own a fuel efficient moped or small motorcycle less than 100cc's. Indeed this is the norm not the exception. Often the car is only used when the weather is bad or for special occasions the daily commute is often done using more nimble bikes. This gives many car owners in the third world a lot of flexibility in their oil consumption. Cars are more often than not a status symbol not general daily commuter vehicles as in the west. Thats not to say that some are not dedicated car drivers however again the relationship between car ownership and gasoline consumption is murky.
Your LPG calculations are far too optimistic
13 million LPG vehicles worldwide, 600,000 in Australia
http://lpgaustralia.com.au/site/#autogas
LPG comes either from refining crude oil or it is occurring naturally from gas fields. In Australia, the mix is 20% refined and 80% natural.
Fuel consumption in litres per 100 km is much higher than with petrol
e.g. Toyota Corolla petrol 7.69 ltr, LPG 9.94 ltr
http://news.lpgaustralia.com.au/link/id/27015924bc2b640761a0/page.html
NGLs do not for the most part go right into gasoline which should allow higher diesel production pressuring crude prices.
NGLs for the most part replace natural gas in places with no NG distribution system and serve as petrochemical feedstock. Only the heavier fractions (pentanes plus) go right into gasoline. For this reason I think the practice of the EIA and the IEA of including NGLs in their oil production numbers is highly misleading.
Butane is used in limited quantities in gasoline. They sneak more butane into the gasoline in the winter to aid in vaporization, but in the summer they are limited by the tendency of the fuel system to vapor-lock when hot if it contains too much butane. Mostly it's used as a fuel for cooking and camping.
Propane is mostly used for heating and petrochemicals, with a much smaller amount used for transportation. In third world countries it serves as a more environmentally-friendly replacement for wood (many third world countries are being deforested in the search for firewood.) It does serve as a replacement for fuel oil where natural gas is available, but where NG is available NG is the preferred choice due to its lower cost and better safety factors. Leaking NG is lighter than air and floats away into the sky. Propane is heavier than air and sinks into low spots, where it is a real explosion hazard. Most underground parking garages prohibit propane vehicles for this reason.
Ethane is generally considered a component of natural gas, and is much harder to liquefy than propane or butane, but they do strip it off and use it for petrochemical feedstock. Polyethylene and other plastics are made from it.
It is misleading to add the volumes of NGLs to the volumes of crude oil because it is an apples + oranges comparison. The energy density of NGLs is much lower than crude oil, so they should add them on an energy-equivalent basis.
true, but not all crude oils are equal either, especially on a net-of-refining energy equivalent basis.
not all crude oils are equal either, especially on a net-of-refining energy equivalent basis.
For a sufficiently big and sophisticated refinery, all crude oils are more or less equal. They will prefer to take the lower quality oils because the cost is lower. For a simpler "teakettle" type of refinery, oil quality is much more important because they can't do the molecular cracking and reforming needed to turn it into the products they want.
If you feed 100 barrels of crude bitumen into a sophisticated refinery capable of processing it, you can get 110 barrels of product out the other end. This is known as "refinery gain". If you measure oil in tonnes (as the Europeans do), rather than barrels, you don't have this effect because the balance is mass in = mass out.
Depends on the source of NGL's. Also of course simply assuming a healthy supply of propane from NGL's would allow you to optimize your refining to avoid propane production as much as possible.
I'd imagine that NGL's from oily gas or oil wells is very high in natural gasoline and the heavier components thus more valuable for blending in gasoline.
And to be fair I was also including some condensate in this argument depending on source anything that can be blended directly into a final product. Your ignoring the C5+ components. By definition I'm also including lease condensates in my argument. Anything that can be separated and minimally processed between the wellhead and the gas processing unit.
They tying of crude and condensate is itself a bit questionable when your looking at products as obviously the condensate goes right in while the crude has to be cracked. The general global optimization of using crude oil primarily for transportation and the scale of such use makes the production of gasoline and distillates against a give supply of various hydrocarbons important. Of particular importance is if you have NGL's and condensate in abundance you can optimize your crude refining for distillates as markets for the lighter fractions are met by natural products.
Indeed one can readily read papers about the issue.
http://www.eia.gov/pub/oil_gas/petroleum/feature_articles/2010/distillat...
Peak oil is a distillate crisis not a gasoline crisis. Rising natural gas production worldwide and associated condensates esp lease condensates has gone a long way to hiding if you will the underlying decline in crude production. However nothing can really hide falling distillate production forever.
Here is and example of the latest refinery configuration.
http://www.total.com/en/our-energies/oil/processing/projects-and-achieve...
If one considers distillate production from such a refinery vs from a simple refinery even one using light sweet crudes I'd argue that distillate production has been enhanced substantially. Getting exact numbers is very difficult but anywhere from 5% to 20%. Lets assume 10% for the sake of argument and further assume that gasoline production is not a problem because of plentiful condensate supplies from wet natural gas production indeed even what are nominally dry gas wells if production volumes are high enough.
If so then distillate production can remain high even if oil production falls. Just doing a simply calculation and assuming oil production is 70 mbd for illustration gives 7mbd with no change in product supplied.
The most important aspect is such optimization fails fast. It works to a point then its a sharp cutoff.
Optimizations can readily handle falling crude production up to around 7-10mbd however basically nothing can be done to prevent falling distillate production past this point.
The key point is the signature of peak oil what does it look like what should we expect. Especially if you don't believe the data. With rising natural gas production and associated availability of NGL's and condensate it will look like and extreme increase in demand for distillates esp middle distillates.
Thus the signature event that suggests the world has past its peak in crude production in my opinion looks exactly like a strong increase in demand for distillates. They are effectively identical.
Indeed
You would get almost exactly the same result as oil production fell beyond the optimization levels. Further declines in oil production would result in falling distillate output. In some ways its very similar to export land model similar dynamics. A steady optimization towards distillates allow their "exports" to remain high once the optimization wall is reached they fall practically off a cliff. Further more if we assume that the rate of growth in condensate production is itself finite shortly thereafter life gets even more interesting.
What happens is that falling oil supply eventually means not enough gasoline even with condensates.
Refineries optimized to produce distillates find that they have no choice but to move back towards gasoline production. This of course puts even more pressure on distillates even as gasoline demand is met.
Regardless of how you change your refining output your now intrinsically short of one or the other products.
When you reach this point the only solution seems to be to dial the knob first one way then the other.
Perhaps you also do your best to build storage of product the obvious choice is distillates since they are more easily stored. If so you get the paradoxical situation that when gasoline becomes a problem distillates increase in storage to provide a buffer for more real time gasoline production with its shorter storage lifetimes.
All of this can of course also be attributed to variations in demand not some underlying problems with supply.
Surprisingly I have not seen any real discussion on the oil drum about the details of peak oil and the likely changes that will happen as oil peaks. The intrinsic assumption seems to be that we will simply see official oil production numbers start to clearly fall. On top of this is at best some discussion of the economic impact.
I don't think I've seen one discussion about the impact of any number of upstream changes which can help lesson the impact. This I think misses some major points that adjustments can handle changes in crude production over a fairly wide range yet they also have an effective wall where they fail fast. They work till they don't.
and over the hill comes the calvary.........gtl. it ain't pretty, it ain't particularly efficient, but it is plentiful.
shell's pearl phase I project is currently in testing phase and should be onstream early this year. 70 kboe/d of middle distillates + 60 kboe/d of ngls. if the price of ng remains in the $ 27/boe range, more will be built, imo.
Actually I'm a bit surprised GTL has not taken off already. I guess the issue right now is that most of the NG production is already spoken for and in general with a few exceptions profitable esp LNG.
One of those catch 22 situations its hard to get a NG stream large enough to justify GTL yet lacking a traditional buyer.
I'd not be surprised to see this be a problem for GTL for quite some time.
Expanding NG use directly as a fuel may well prove more promising. For that matter I'd guess coal has the same problem.
The resource is plentiful but not developed without lining up buyers and you have plenty of traditional buyers.
The risks of a CTL solution cannot overcome the very low risk traditional markets.
I suspect that GTL and CTL solutions are probably non-solutions for a different reason. As GTL becomes viable more NG will be diverted to producing liquid fuels. The market is big enough to absorb a significant amount of NG production increasing the price of NG. Rising NG prices will of course have a negative impact on all the industry dependent on relatively cheap NG. This will slow down the economy causing demand for liquid fuels to fall and probably prices to fall. Rinse and repeat. Your really just robbing peter to pay paul if you will.
Perhaps coal resources are large enough but still I'd argue the same issue applies. Coal for liquids when if/when its finally done would easily out compete the traditional uses so again overall price increases stunt economic growth.
In a sense despite what people say corn and sugarcane ethanol have the same effect more fuel but also more expensive food. Food has not been cheap that often since ethanol production started to expand. I won't get into cause and effect I'm simply noting that so far agriculture has often shown this robbing peter to pay paul trap. Certainly a lot of this has to do with the vagaries of crop production but bad years are the norm not the exception agriculture is intrinsically dependent on the weather.
Indeed similar issues arise in the petrochemical industry all the time between using oil/ngls/ng as a transportation fuel or as a feedstock to make plastics or fertilizer or whatever. You may well get your combustion use to make electricity or whatever but you could well pay for it via higher fertilizer prices and higher plastics prices.
All kinds of these sorts of situations happen when you start introducing tighter and tighter couplings between markets that used to be fairly distinct. Your opening up competition that may well result in no real net gain in overall growth its simply shifting around costs. Perhaps in the end you accomplish nothing really.
How I learned to stop worrying and love the Saudis
by Steve LeVine, Energy Bulletin
Excerpts:Consider the current activities of Chevron. Vice Chairman George Kirkland told me about Chevron's findings in the Wafra field, a reservoir of highly viscous, heavy oil in which the company is using a method of steam-injection drilling to recover an expected 10 billion to 15 billion barrels of petroleum. (For perspective, the industry regards a 1 billion-barrel field as a supergiant.) Wafra reinforces a longer future delivering liquid hydrocarbons to the world economy." Meaning probably far into the second half of this century.
Encyclopedia Britannica: Supergiants: fields with 5 billion or more barrels of ultimately recoverable oil
ng - Interesting how they seem to be spinning the low recovery rate as a good thing. I.E.: 10 billion bbls of oil recovered over 25 years (although they seem to be implying it will take longer to produce this volume) adds 1.1 million bopd to global production. Not exactly meaningless but would represent an increase in global production rate of 1.3%. Wow...another 15 or 20 discoveries like that and they might be able to offset some of the established decline rates seen around the world. Maybe.
wafra is a pilot steamflood project, to the tune of $340 million. the decision to go forward full field won't be made until 2013. wafra produces essentially 'dead oil' but is capable of production from pore volume compressibility and fluid expansion alone. primary recovery is very low.
the iraqi army alledgedly set the wells on fire in '91, but the fires went out because of low pressure and very little gas.
The U.S. became a net exporter of refined petroleum products today:
http://www.eia.gov/dnav/pet/hist/LeafHandler.ashx?n=PET&s=WRPNTUS2&f=W
It looks like gasoline imports have really dropped making the big move.
http://www.eia.gov/dnav/pet/hist/LeafHandler.ashx?n=pet&s=wgtimus2&f=w
Consider the shape of the graph for a moment. First the sharp increase in production after 2002 is indicative of ample spare capacity being brought online. Price/Demand brought a tremendous amount of discovered drilled and waiting capacity into production.
Since these production graphs assume a spare capacity cushion exists I'd argue one should also include the capacity buffer when talking about crude production and peak oil. If so well perhaps all that happened was a tightening of spare capacity in 2005-2008. Assuming just a bit of flexibility given spare capacity well we have been near the current capacity range since 2000. Assuming that OPEC can pump a bit more depending on demand and a bit more from non-OPEC well production should be reasonable close to its current values or a bit higher in 2011 and 2012.
Indeed I'd argue that there is no end in sight might as well pick 2015 as the year we can reasonably expect production to be near its current values using this data set. If one even assumes that Iraq's claims are halfway reasonable and include production from Brazil and other deep water projects etc well it seems very reasonable simply using a lot of public data available today that oil production will be close to its current value as far out as 2020. Remember OPEC still has as decent spare capacity cushion demand might eat into it but they have ten years using this approach to bring more oil online.
Now lets consider modeling this curve. Indeed lets simply consider a symmetric model and the fact that steep declines using near term data does not seem possible supporting a symmetric production model.
If so then global peak oil seem to be at least a 30 year event. Given the above and starting in 2000 we can easily go to 2020 and the model suggests 2030 should work assuming symmetry with a possible peak in 2015 or later.
Total decline rates are incredibly small less than 1% per year indeed we seem to be on the upside esp if capacity is included with annual growth albeit at a very small rate on average less than 1% per year. Considering spare capacity and errors in the data well the changes in productive capacity outside of the surge as prices rose are probably at the noise level with no clear upward or downward trend evident.
I'd argue that this cannot be peak oil using any of the models I've seen. No model based on shifted discovery or past production history can yield a 30 year wide peak.
Now one can consider asymmetric models aka my shark fin that postulate that current production levels are driven by technical advancement aka super straws. You can even include or exclude a significant gain in recovery. In general even when new methods have been shown to increase recover the production rate is generally significantly lower than peak production using traditional methods. The exception is horizontal drilling and well work overs that allow you to target a thin oil column but these are by definition super straws.
However the technical record is known these advanced methods did not suddenly appear overnight just as oil production plateaued. They have been in development and deployment for decades. If technology is distorting the production curve its been in effect along the upside of the curve at least since the late 1980's. Next the asymmetric model assumes that the symmetric production models basically got the URR correct but technology is distorting production. Since the technology effect was in force on the upside well your also forced to not only use URR estimates from the symmetric models but also assume that its close to the lower end of these estimates.
Thats why I discount reserve growth heavily. Increased recovery rates also suggest a lot of oil would be produced after peak in a long fat tail. The asymmetry is caused by two very different production modes fast and furious using horizontals thence watered out stripper production.
No way can such a model result in a 30 year plateau or peak event. No matter how you slice and dice it. Its impossible. By definition production is held high well past 50% of URR thus the peak has to occur at 50%+ keeping it at that level for another 10 years means you produce more oil than you have. I think you can readily dismiss such a model given this data set.
Thus I think we have enough data now to safely say that all of the near term peak oil models are wrong. At best all thats happened is and imbalance between supply and demand with the oil industry simply caught by and unexpected demand surge in particular demand growth in India and China. The collective addition of what amounts to a new US as far as oil demand goes strained the industry. Also a lot of the new production is expensive thus a new price balance had to occur before it could be exploited. We have the oil just the world has to show it can pay the price. This issue is probably settled. Oil won't be cheap and incremental production increases will be small on an annual basis constraining the economy but not killing it. CERA's undulating plateau is the winner.
Or the data is wrong. I think its past time to consider the hard truth. Either the peak oil models are fundamentally correct or they are not. Either the production data is correct or its not.
Obviously if one makes the assumption that the data is wrong well which peak oil model is right is a hard question to answer and it depends heavily on why the data set might be wrong. Especially given the obvious that its wrong for political reasons.
If one assumes the data is correct well sure we don't have to throw the models out today but as each year passes I'd argue that basically every single model that not already invalidated will be invalidated. To be clear its not just short term peak oil models that are invalidated but also all the longer term ones i.e peak in 2030 or so. As its also clear with this data set that increasing production to levels projected using a peak in say 2030 is not going to happen.
In my opinion there is not a single model for world oil production that fits the current data set and is anything more than a simple projection of current and near term production regardless of the underlying assumptions of the model. I don't know of a single model that was predicting the large upward revisions to OPEC reserves for example.
If we take the production data as fact well we have to accept at least some of the revision data as fact.
I will say I predicted it because I did back when the BOE barrel of oil equivalent was adopted by the US I did predict that we would see a rapid inflation in reserve estimates. I can't find the dang post but it was back when the SEC changed oil accounting rules to allow BOE to be used. I wish I could find the post because I think its important to show at least one person recognized it would trigger a sharp rise in reserve claims.
This is not the exact post I'm looking for but the moment the SEC changed the rules I did several posts expecting we would see a round of upward revisions in reserves from OPEC.
http://www.theoildrum.com/node/4914#comment-454083
Another I found.
http://www.theoildrum.com/node/3403#comment-279188
I hope someone can find the posts made back when these accounting rules where changed because we certainly discussed that and inflation of OPEC reserves was going to follow the rule changes. As far as I know that was the only place that the current upward revisions where anticipated. I've searched a few times and cannot find the exact post I'm looking for. However I argue its important today. It was back in 2007-2008 if I recall correctly.
I remember distinctly the discussion that the SEC revisions would eventually lead to OPEC expanding its reserve claims.
So one more time either everyone got their models wrong or the data is wrong. I wish someone would at least try to do a critique of the public data. Methods do exist for detecting forged data.
Plenty of methods are at our disposal.
http://en.wikipedia.org/wiki/Data_Analysis_Techniques_for_Fraud_Detection
Given my opinion I'm too biased furthermore I simply don't have the background to discern which method or methods to are the ones that should be used.
Perhaps some fairly simple analysis makes sense say looking at production profiles vs wells drilled.
Do we have enough oil wells and did we drill enough new ones to at least support production claims.
If not for the world perhaps just the US ?
http://blogs.bakerhughes.com/rigcount/
We have good rig count data for the US how does it correlate with US production. What about the world ?
Why does it seem that I'm the only one suggesting that the peak oil community needs to do one of the most basic steps in science and verify its data ?
We have JODI
http://www.jodidata.org/
But it just seems to replicate other data sources. One would thing that this initiative would have at least resulted in some revisions if only to match methodologies and reporting standards. Yet in reading the website it seems that no physical audits are performed at all. Forget about fraud simple basic accounting concepts like real independent audits are missing.
PO is not really a monthly event. It is a period that commenced late in 2004, since when production has been on a plateau. The margin of error must be around 2-3m bpd and when C+C moves out of its current range by that sort amount we will know whether PO has happened or whether the current plateau has been broken. Production from tar sands and biofuels should be ignored, they are only useful for TPTB to confuse the general public.
One more day for the death-dealing auto culture. That one is living its last breath and has only moments until death.
More oil now will mean more suffering later. As such, I'm happy to see these new figures.
Yeah! Peak oil is a lie. I'm off to buy a Hummer.
LMAO..if only it weren't so sick and wrong. I was eastbound on the 210 in Pasadena this afternoon and some joker in a hummer blazed by me. That in itself wasn't a big deal, but the hummer looked to be an official Red Cross vehicle, repleat with 10 different radio antennae (sp?) and right proper red crosses on a white vehicle. Don't know what the driver was doing, but I suspect he was hurrying to
Trader Joes to pick up something essential for dinner.
it's an infinite paradise
-dr
I'm curious, then, about a recent article by Tierney in the NYT http://www.nytimes.com/2010/12/28/science/28tierney.html?_r=1
referencing two other articles in the NYT: http://www.nytimes.com/2010/11/17/business/energy-environment/17FUEL.html
and http://green.blogs.nytimes.com/2010/12/16/the-energy-future-aint-what-it... .
Their claim, roughly, is -- lots of new oil fields (but what's the cost to extract?) and more gas than anyone ever imagined. I'm plenty wary of anything Tierney writes because he is a bit of a cheerleader, but there are those two other articles.
Tierney is a columnist who learned that to sell papers that you have to grab the reader's attention with hooks. His latest hook is to place bets and thus get people interested enough to continue reading. And then he does some reporting of press releases. Not much more there. The NY Times Freakonomics columnists are not much better.
Tierney, meh. It's the other two articles that I'm trying to get a read on. To my taste, they were short on details.
A very good answer to Tierney and his acolytes (with the emphasis on the lyte) comes from Professor Brad DeLong, Economics, Berkeley, who begins by quoting the man he calls the "utterly remarkable John Tierney"
DeLong, a first class economist, then provides a rational response,
http://delong.typepad.com/sdj/
Delong's post is what sent me to read Tierney's article, and then to here. I like to cross-check my information. I know, I know, what a cynic, to not believe everything I read (even if I agree with it). My take on this is that Tierney is talking about "cornucopia-at-a-price" -- as long as we're willing to pay $90+ for a barrel of oil, these other sources will flow. But that's a guesstimate.
Yes, cost to extract. Is net energy of oil extraction permanently in the rear view mirror?
Yes. Without even having to get too deeply into numbers, as long as we remain on a relative plateau of all liquids, and the total includes more non-conventional sources, which all yield less net energy than light, sweet crude, then yes, peak net energy is in the rear view. It's simple, really. Elephant in the room.
And as I noted above, peak per capita net liquid energy is even more in the past, having peaked around 1980.
Why is it that almost every production graph ever posted to this site starts at year 2002? At best that is just plain lazy and at worst it is deliberately deceptive. In the context of the last 50 - 100 years of production data the current "plateau" is little more than a blip.
Furthermore, when seen in that context 50 - 100 years from now, the significance of current fluctuations of 1 or 2 mbpd in the yearly (or monthly!) data and the actual difference that will make in future curve fitting exercises will be SLIM to NONE (and slim just left town).
Yes, global oil production is roughly on track to follow a logistic curve that will eventually span some 200 years of data. Yes, if current estimates of global URR are in the ballpark, and based on historical discovery data they are, then we are roughly at the peak of that curve and it's probably all downhill from here, more or less. This despite heroic efforts to pour massive amounts of otherwise productive capital into "unconventional" hydrocarbons with manifest diminishing returns.
And yet, here we are, five years and counting on this site, arguing in ever more minute detail over "predictions" of what the exact moment of peak oil will be. Worse yet, all of it presented in the context of less than TEN YEARS of data.
If this was the intent of the recent changes at TOD then it is a sad day indeed because "irrelevant" doesn't even begin to describe it.
Cheers,
Jerry
Try this from the EIA, with 16 years of data. It sure looks like a plateau since 2005, but the 2010 number is a barely noticeable up-tick (probably due to the previous year's slight down-tick).
No need to wait for the EIA numbers, as the EIA's STEO shows historical estimates up to, and including, November 2010. The monthly figures for October and November both beat the previous high and 2010 is shaping up as the peak year so far (with November below October) - and quite comfortably so.
There's definitely some double counting going on, though, even though that will also inflate the demand figures. Does anyone know of analysis that shows the actual amount of net all-liquids produced for use in everything else except all-liquids production? That would be the critical figure, wouldn't it?
Yes. Throw in per capita and we would really begin to see our predicament.
A couple of things about the STEO:
In terms of going back and updating the values of the various liquids values, the STEO lags behind (or maybe they wait a couple of years to produce a "final" number).
Compared to the IPM for 2009, the STEO values are lower than the revised IPM (which, unfortunately, saw it's last publication in December when they clearly indicated what values were updated by bold and italicized values). However, beginning in May 2010, compared with the IPM revised values, the STEO values are higher by between 500-600 thousand barrels per day (Note the MER and the IPM show identical values, it just takes more work to see the changes in the MER).
I suggest that the nature of this difference is contained in the names: "Outlook" versus "Review."
I believe that the EIA attempts to avoid double counting. Seems like this was a question a few years back (.i.e., ethanol) and the addressed as a net value. Nonetheless, what is consistent and has been is that NGL's and to some extent process gains are becoming an ever larger percentage of the total liquids supply.
Those of us whom have tracked crude + condensate note that production has been flat, at best.
The one-month spike that was July 2008 was just that. Total oil production (C+C) for 2008 just barely exceeds the oil production for 2005, but only because 2008 was a leap year. On a BPD basis, calendar year 2005 beats out 2008 but not by a huge margin. Using a centered moving average method, as Stuart (and I) do shows that a peak occurred in the December 2005 timeframe.
But there is an ever widening divergence between C+C and the total liquids and that can hide the decline in oil production, at least for a little while.