| Oil Limits, Recession, and Bumping Against the Growth Ceiling | The Oil Drum | Tech Talk - The Oil and Gas of Southern Alaska |
The US Energy Information Administration's Faulty Peak Oil Analysis
Posted by Rembrandt on August 19, 2011 - 3:04am
This is a guest post by Eric L. Garza. Eric recently earned a PhD at the University of Vermont in Environmental Science with a focus on Energy Systems. Eric blogs at Path 2 Resilience.
Introduction
Crude oil provides 35-40% of global primary energy and is a vital driver of economic productivity. The question of when oil supply will reach its global peak is an important and controversial question that is gaining increased attention from a wide array of researchers, commentators and policy makers. Many analysts, including now even the International Energy Agency in its 2010 World Energy Outlook accept the possibility of a near-term peak in global oil supply. The United States Energy Information Administration (EIA) however, based on a report published in 2004, remains optimistic about the future of global oil supply and maintains that global peak oil will not likely occur before 2030. How does the EIA remain optimistic given the growing trend throughout the world towards energy pessimism? This post will explain the methodology that underlies the EIA's optimistic oil supply vision, and will point out two important flaws in this methodology that call their results into question. It will finally replicate the EIA's forecasts using a simple methodological correction and demonstrate the the agency's oil optimism is unfounded.
US EIA methodology and its shortcomings
The EIA uses a variant of the reserves to production ratio (R/P ratio) to predict the global peak in conventional oil. The reserves to production ratio divides proved reserves (R) by that year's rate of oil production (P), and is a ratio commonly used to estimate a resource's static lifetime, or the length of time proved reserves will last assuming a steady production rate. The EIA turns to the R/P ratio rather than use the Hubbert method to predict global peak because the agency believes the Hubbert method yields forecasts that are consistently too early, and because the R/P ratio does a better job of incorporating non-geological factors into a production forecast. The theory behind using the R/P ratio to predict peaks relies on the ratio falling from a higher value early in a region's resource production cycle until it reaches a threshold value at which a production peak emerges. After the production peak the R/P ratio levels off and production rates decline. Figure 1 illustrates this relationship.
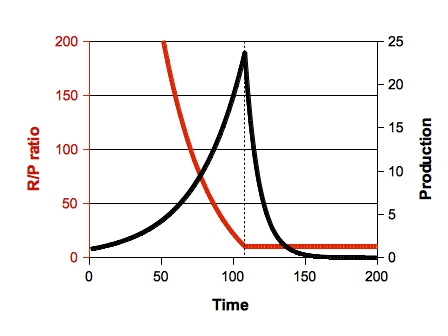
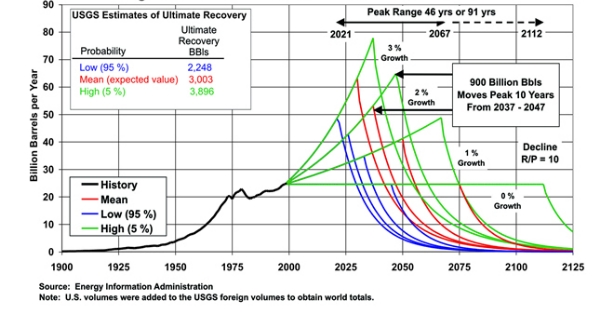
As in Figure 1, the EIA uses in its forecasts a threshold R/P value of 10. It derives this value from the United States' oil production, which reached its peak roughly at an R/P ratio of 10. The EIA reasons that since the United States represents a mature, prolific, geographically diverse petroleum production region its threshold value of 10 can be generalized to the world as a whole and thus used to predict when a global peak may occur. Global oil production forecasts are calculated for several scenarios based on resource estimates from the United States Geological Survey's most recent World Petroleum Assessment, and delivers the optimistic vision of the global oil future shown in Figure 2. The EIA's results are the most optimistic published, and appear to drive the unwillingness of the EIA and the US Department of Energy to take the issue of peak oil seriously.
Two issues cast doubt on the EIA's optimistic analysis. First, the agency calculates the US' threshold value of 10 using proved reserves statistics (R) in the R/P ratio's numerator, but then uses USGS estimates of technically recoverable oil (R') in the ratio's numerator in its scenario calculations. This leads to internal inconsistency between how the R/P ratio threshold value is calculated and then applied in scenario analysis. The difference between proved reserves and remaining technically recoverable oil is substantial, since proved reserves often represent only the portion of technically recoverable oil that has been discovered and documented well enough to meet government reporting requirements. Oftentimes the proportion of a region's technically recoverable oil that can be reported as proved reserves is quite small, sometimes less than 10 percent in regions that have not yet been thoroughly explored or developed. In order to make the EIA's analysis internally consistent, it must either use proved reserves to both calculate the threshold value and in scenario calculations, or it must used estimates of remaining technically recoverable oil. The agency cannot use these disparate estimates interchangably.
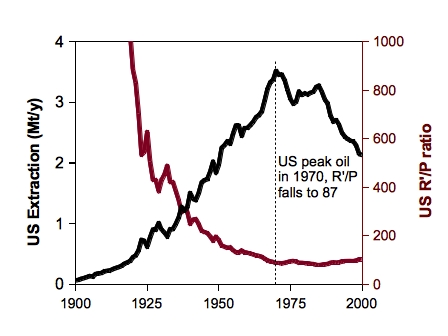
Beyond issues of internal inconsistency, the threshold value of 10 that the EIA applies to their global forecasts is questionable. Historical statistics in the United States show that the US R/P ratio was hovering near 10 for several decades before US oil production peaked in 1970 (Figure 3). This reality diverges starkly from the theory underlying the use of the R/P ratio as an indicator with which to predict oil production peaks. One can only conclude from this that, at least when formulated using proved reserves in the ratio's numerator, the R/P ratio was not able to predict US peak oil production and shows no promise in predicting global oil production.

Luckily, using remaining technically recoverable oil in the R/P ratio's numerator is easy enough to do, and it solves both of the above problems. Figure 4 illustrates what the new R'/P ratio looks like based on estimates of remaining technically recoverable oil from the USGS and Minerals Management Service. This alternative formulation of the R/P ratio falls until the US peak in 1970, after which it levels off. This mirrors the original theory underlying the use of the R/P ratio (Figure 1) reasonably well, but yields an estimate for the US R'/P threshold value of 87 rather than 10, as the EIA had assumed. Since the R'/P ratio falls over time as oil resources are extracted, this difference becomes extremely important. If one assumes a threshold value far lower than the actual value for the purpose of forecasting, predictions of peak will necessarily be more optimistic than what would actually occur. In other words, the EIA analysis, by virtue of its internal inconsistency in calculating the threshold values used for it scenarios, unwittingly biased its forecasts towards optimism.
Replicating EIA's scenarios with the alternative indicator
To gauge just how overly optimistic EIA's scenarios are, I largely replicate their analysis by calculating the R'/P threshold value for the United States as described above and applying this threshold value to scenarios to calculate when global peak oil may occur. I begin forecasts in 2000 as EIA did, but use actual historical statistics for global annual conventional oil production from 2001-2010 and only use EIA's 0, 1, 2, and 3% growth assumptions thereafter.
In their analysis the EIA ignored the distinction between conventional and unconventional oil, even though the USGS resource estimates they used were explicitly for conventional oil only. This is not a big issue when calculating the R'/P threshold value for the United States since the US' unconventional production is negligible, but unconventional supplies from Canada are significant enough that they need to be accounted for in scenarios attempting to predict the peak of global oil supply. I use statistics from the Canadian Association of Petroleum Producers to estimate the amount of unconventional oil produced from Canada's tar sands and subtract this from global crude oil production statistics to estimate global conventional oil production. Canada's unconventional oil production is not the only unconventional oil produced globally, but it dominates by volume by far. After subtracting Canada's unconventional production, I assume all other sources of unconventional oil are negligible.
The results of this new analysis paint a much less rosy vision of the future of conventional oil than that offered by the EIA. Table 1 shows the EIA's estimates for the year of global peak oil for all scenarios in its original report, and for those same scenarios using the corrected method discussed above. For all scenarios using USGS low estimates of recoverable resources, global R'/P threshold values first fall below the threshold value of 87 in 1979. This prediction is very early. However, the low resource estimate is the lower edge of a 90% confidence interval about the mean so it is far from the most likely resource availability scenario. All mean estimates of resource availability, which are the most likely levels of resource availability according to the USGS, predict a peak in 1999. Only when USGS high resource estimates are used (which are just as unlikely as USGS low resource estimates) does the analysis predict global conventional peaks beyond the present day, but much nearer in time than predicted by EIA in their original analysis.

The revised, internally consistent R'/P method, when used with USGS estimates of technically recoverable resources, suggests that a peak in global conventional oil supply should have occurred in 1999 or thereabouts. At present, global conventional oil supply appears to be on a very bumpy plateau with the most recent peak, as recorded by statistics, set back in 2005 or 2006 depending on which agency's annual statistics one adopts. While it remains to be seen whether a new conventional peak will emerge, this paper shows the flaws in the EIA methodology that underlie the agency's optimistic outlook on global oil supply and shows that a corrected application of EIA's approach agrees well with many reports suggesting the likelihood of a near-term or historical peak in global conventional oil.
Contact
- Content: editors at theoildrum dot com
- Tech support: support at theoildrum dot com
License

This work is licensed under a Creative Commons Attribution-Share Alike 3.0 United States License.
Strange. What is the argument behind postulating that this R/P ratio should saturate at some constant value, that is the same for all types of oil, in all environments, in all geological layers, independent of the type of the way the oil is extracted?
Also.. is it not much more reasonable to separately model all the oil producing regions of the world, and then adding those curves in an attempt to model the oil production of the whole world?
Which methodology is used by the IEA (International Energy Agency) to predict these things?
Is there any geologist at all working at IEA?
Probably they are all economists. Too bad.
I don't know what skills are represented, but I am sure they are all government employees. Someone higher up makes sure the answer they arrive at agrees with policy, first - or it doesn't get published at all.
Yep. Interestingly, in the EIA these "higher ups" were excanged each time the US had a new president. For me this is a clear sign that the "Information Agency" doesn't provide information but government propaganda.
Doesn't the steady R/P simply imply that operators of all sizes, operating in all basins(in the usa) have been more or less successful in replacing their reserves and production for a long time ?
No. Production has been declining in the US. Assuming a constant R/P, declining production requires declining reserves to make the equation balance. This is basic math. Example:
R=100, P=10, R/P = 10
R=80, P=8 , R/P = 10
R=50, P=5, R/P =10
R=10, P=1, R/P =10
Reserves and production decline at the same ratio, R/P is constant.
Jeff
Doesn't the steady R/P simply imply that operators of all sizes, operating in all basins(in the usa) have been more or less successful in replacing their reserves and production for a long time ?
You are thinking of the reserve replacement ratio, which in the US has been less than 1:1 for generations.
In a mature producing area, the R/P ratio tends to fall to a certain minimum level, e.g. 8:1. As the reserves decline, the production rate declines, while the R/P ratio remains constant. It is determined by constraints on how fast you can pump oil out of the ground.
You can spend a lot of money to increase production and thereby reduce the R/P ratio, but there's no point because all you are doing is wasting money producing the same total amount of oil faster. At this point all the wells are becoming marginal and controlling costs is the most important goal, so producers don't want to spend money unnecessarily.
Operators in the US are extremely good at controlling costs, which is why US production is as high as it is. In other countries, most of the oil fields would have been shut down long ago.
WestHubbleTelescope does not seem to be with us these recent days.
I am not qualified to stand in his stead but draw attention to his methodology (and graph) handling the EIA Reserve & Production data for the USA, post and prior peak. The R & P run in parallel? Does this square with the excellent sounding arguments in this post?
WHT's updates (May 2011)using EIA data are at http://www.mobjectivist.blogspot.com/atom.xml
Until a few years ago the German geological service BGR had displayed graphs of the R/P trends of global coal production. They had a clear downward trend, which should reach zero in about a decade. The BGR however stated that the R/P ratio only gives a hint of the need for new mining projects but doesn't tell anything about geological shortages. Meanwhile they have stopped to display this graph.
Hi Nichol, the EIA doesn't do a particularly good job justifying the universal applicability of their R/P indicator over all spatial scales. I think coming up with predictions (to the extent possible) for smaller production units like countries or states and then adding these together to estimate total production is a much more sound approach.
I'm definitely not implying that the R/P indicator is necessarily a good indicator when applied this way, just demonstrating that the way they use it to come up with their optimistic vision of the future of oil production is flawed.
The most 'optimimistic' estimate of global oil supply shows that supply dropping off the edge of a cliff in less than 20 years. In no sensible political environment would such an emergency justify complacency.
The USGS model appears to have been absolutely disproven by historical data - global crude production has been virtually static for six years in spite of a six-fold increase in average price. You have to ask yourself, 'do these people genuinely not care about the future?'
Or you have to ask yourself "do these people not have a strong understanding of science and understand the consequences of the decisions they make?"
You'd have to ask yourself, though, a question along the lines of "Hmmm. That prediction we made 10 years ago is proving wildly optimistic. Where did we go wrong?"
Or you have to ask yourself "do these people's salaries depend on their not understanding the science or the consequences of the decisions they make?"
You don't seem to understand the purpose of the EIA. You seem to be operating under the illusion that it is there to provide guidance to policy makers. This is not true. All you have to do is go back over time and look at their results and methodology to see that this is not what they are doing.
What they are doing is providing a plausible scenario to prevent the bond markets from melting down. Because without a quasi-rigorous looking analysis that gives some sort of underpinning to the notion that business as usual will have the energy to fuel itself for the next thirty years our long term debt is not sustainable. Forget future debt, the debt that is already accumulated cannot be serviced. So, the whole thing would come crashing down if it became conventional wisdom that the energy for future sustained growth will not be available.
It is the EIA's mission to weave a tale that makes the basis for this growth plausible. Regardless of the hokus pokes required. Because the alternative is not some crisis in the future. It is a financial crisis right now. Once the bond market figures this out, the whole house of cards circles the drain. We are actually quite close to this condition right now. I am sure that they would consider an honest analysis at this point to be something like shouting 'fire' in a crowded theatre.
I've spoke with folks within the EIA. I don't think they're all in on some sort of massive conspiracy to protect bond markets. I think they're a group of primarily economists who've been trained to see the world in a particular way, and their analyses reflect the way they've been trained to see the world. Some people (myself included) might disagree with some tenets of how they see the world and how they carry out their analyses, of course...
It hardly matters what the individuals in the organization believe. You get the result you get by determining the nature of problem, the staffing decisions and managerial and editing decisions. The easiest thing in the world to do is to disparage any sort of coordinated effort to operate in secrecy as a 'conspiracy theory'. The fact of the matter is that our government has been operating in just this manner for nearly its entire existence and using that label has become a handle tool to deflect inquiry.
I think you just might have "stuck the landing" on this interpretation, sw.
SW - you might want to google and then study carefully "Modern Money Theory" (MMT). Don't reject it out of hand because it invalidates what you have always believed. It stunned me too. But after many hours of study I can't find where it is flawed, at least at the macroeconomic level. It does have the flaw of nearly all economists of assuming no limits to resources, but that doesn't invalidate it's view on debt for sovereign currency nations. Murray
Murray,
Thanks for this comment on MMT. It was new to me. I've googled MMT and spent the last couple of days reading their blogs. Currently they are in a major kerfuffle over something Krugman wrote, but otherwise they appear to be a sober thoughtful bunch of academics.
From what I am reading you are mistaken about limits to resources. I gather that they make a big deal of a distinction between "financial resources" and real or tangible resources. The distinction is that financial resources are limitless, whereas tangible resources clearly are limited.
Far from being a thing they share with other economists, it is a thing that seems to keep them from being part of the larger crowd.
URLs:
http://neweconomicperspectives.blogspot.com/p/modern-money-primer.html
http://neweconomicperspectives.blogspot.com/2011/03/modern-monetary-theo...
This is exactly what I said here a couple of weeks ago. There is no debt crisis because bonds can always be exchanged directly for dollars with no inflationary effect at all, since bonds are money. No new money is created by paying off bonds with a printing press.
SW, excellent analysis IMO. I first learned about PO in 2002 as a commodity trader - not because of what the government was reporting, but what they were covering up. The USGS suddenly stopped reporting a lot of oil data, we were building for war in Iraq but hiding this from the public, and in the late 1990s we changed policy on the Iraq embargo in clear response to tightness in the market.
It is not some strange conspiracy for the economic establishment (or the government they control) to hide information - it is BAU, just look at history. Does anyone seriously expect the establishment/government to come out and tell the public, "your way of life is probably ending - oh and better dump those stocks and bonds ASAP"? No, we will continue to hear a consistent unquestionable message that global warming necessitates energy conservation and development of new energy sources. Ask yourself why, after 20 years, GW theory suddenly gets so much publicity and is incorporated into policy. Ask yourself why there is a unit of the CIA devoted to analyzing oil production but their work is now off limits to the public. The CIA reports on the probability of Soviet oil peaking in the 1990s were public and high quality - but suddenly their analysis of Middle Eastern production is hidden due to "national security".
I'm sure the average bean counter at the EIA has no idea of the agenda, but this organization clearly has a culture of putting the most optomistic face possible on the situation. Anything else would be unacceptable and lead to management changes.
The world is rarely as straightforward as our social conditioning would have us believe.
glennn - Just one little anecdote to go along with your observation. About 30 years ago while visiting D.C. I met my friend's friend: a CIA geologist...one of those guys that fed the White House the "facts" on the world's oil supply. Turned out it wasn't an accidental meeting: he wanted to recruit me for a gig with the agency. Not that I was any great catch with just 5 years experience but because the oil patch was booming and the GS scale was having a difficult time competing with private industry paychecks. He was a nice guy...strong academic background...at least 30 years experience. And he couldn't find oil on his garage floor if his life depended on it. LOL. Virginia seemed like a very nice place to live but I was just becoming a useful mammal in the oil patch and didn't want to give up future experience.
As has been said: don't confuse ignorance for deceit. In both cases you're getting bad info. But in one case it's unintentional.
Thank you for this post. Every other non-government group seems to claim peak oil will happen within the decade, if it hasn't happened already. I was quite confused when I read the EIA's update pushing it off for another 20, 30, even 40 years. Now it all makes sense.
I'm guessing that you are correct with your analysis of the EIA as a group of economists without a real understanding of the geology and science. Being as connected and involved in federal politics as I am, I can safely say that it is not and orchestrated conspiracy to help the financial market. Both SW and Eric Garza are correct in that the management stacks the program (that's the conspiracy) with people who see the world from a certain view (so it doesn't look like a conspiracy). But the EIA isn't concerned with the financial markets as it is with the politics of its leaders. No political figure wants to run for election when people are upset and scared. So, they get people who see the world in a convenient way to work for them and say that since the government says peak oil is 30 years away it must be true. But's it's not for financial reasons, it's all political.
Of course, this is all ironic since the EPA is screaming about energy armageddon unless we all buy Prius's and CF light bulbs -- as if those don't use energy...
FOR ALL
I hesitated a bit to join the wolf pack here tearing apart the EIA. LOL. I kept studying the report to figure what I was missing. But I can’t begin to understand the R/P ratio. I’ve specialized in analyzing production curves for over 36 years. There are exploration geologists who tend to care little about such data and production geologists like me who live and die by this info.
Let’s start with the simple basics. I’ve never seen anyone in the oil patch use that metric per se. Start with a single well. A well comes on at 300 bopd and declines little for 5 years. And the water reaches the perforations and the oil rate declines quickly. But as the water percentages increase this rate of change levels out. So the R/P changes significant at least 3 times. The initial high oil rate is no indication of URR. A well producing 300 bopd for 2 years might recover 100,000 bo. And another well IN THE SAME RESERVOIR that starts at the same rate could recover 1 million bbls of oil. Just depends where each well is in the reservoir.
Let’s jump to field level R/P. Now there are 20 wells whose individual URR and decline rate range from the example above and 18 different variations between them. An addition complication: time lag. Not all 20 wells come on the same day. It may take several years for all the wells to be drilled.
Now jump to a trend with 100 such fields in it. Same complication as described and one more: those 100 fields are developed over a time span of 20 years...or maybe 40 years. One more complication: the bigger fields/higher flow rates tend to be discovered early on.
Now jump to a country level: same complications as above and one more biggie: there may be a 60+ year span between when one trend begins to be developed and a new one begins.
Now jump to global scale. This is easy: the huge E. Texas Oil Field with billions of bbls of oil was discovered over 60 years before the billions of bbls of DW Brazil oil were discovered…and with little of it on production even today. And now the EIA wants to use the R/P to predict future discoveries?
Let’s jump back to metrics. I use a metric every day to project URR from mature fields: log normal plot of cumulative production vs. time. BTW: Mother Earth love log normal distribution...she uses it everywhere. On the vertical axis you plot the data on a log scale: multiple of 10’s: first line = 1, next line = 10. Nest line = 100, etc. The horizontal scale is linear: 1. 2. 3. Etc. Within the first few years the oil cum curve shoots upward very fast, then drops fast as decline kicks in and then develops a fairly level and slow increase. Once the level reaches this steady state relationship the URR can be estimated rather accurately...just lay a straight edge on it. The key take away is that the early cum plot or R/P are absolutely worthless in estimating URR for an individual well. Now imagine during a field cum curve with all the above complications. Now jump up to trend, country and global. To be honest I’ve seldom seen anyone in the oil patch take it beyond the field level…just not practical value.
But it’s worse than that. I can promise you that using any metric comparing cum US oil production history to almost any other country (and all global production) is meaningless because of a completely different factor: small independent US operators. Our oil fields have produced much longer (and thus greater cums) than you will ever see from countries where the NOC’s control development. We are the 3rd largest oil producing country on the planet and our wells average less than 10 bopd. Even in the jaws of deep PO decline I doubt you see anything like that in the KSA and almost all the other major oil producing regions. Same reason the Big Oil has given up on much of the US: inefficiency. They can use the limited manpower to produce small wells. OTOH, a small operator at the other end of the spectrum has no employee over head: he has no employees…he does all the work himself. Sweat equity. In between are operators with a small number of workers. But the equity comes from private ownership of the mineral rights and the production operations. This is non-existent in most of the world.
So even if the USGS, EIA or Rockman comes up with meaningful metric for US oil production it’s difficult to believe it would have any value in analyzing the rest of the world IMHO.
ROCKMAN,
As always, you are the voice of sanity. And you come with plenty of industry cred and a plainspoken manner that makes even the most complicated things easy to understand.
What would we do without you?
Best Regards,
Jon
jonathan - Mucho thanks. But the really sad part is that you don't need my 36 years of experience in the trenches to come up with my little dialog. A production geologist with just 4 or 5 years experience could lay it out as good (or even better) than me. And it doesn't take a firm grasp of log/normal distribution or subsurface fluid dynamics. Just look at the anecdotal history of the oil patch for the last 80 years. As far as I can tell they are just using made up metrics to avoid explaining a fairly simple situation in simple language Joe6pack could under stand. As they say: if you can't dazzle them with the facts blind them with your BS.
Hi Rockman, I don't disagree with you. By replicating the EIA's analysis, I'm not necessarily saying I think their method (using a threshold value calculated for the USA to predict global peak) is necessarily the best way to predict global peak. Again, I just wanted to debunk their methodology based on its internal inconsistencies.
Eric - Understood. I think their approach might be a lot more viable if they understood and incorporated the variables. The curve cannot be projected based on past shape. But that would be a daunting task IMHO. You analysis shows that IMHO. As you show it's not difficult to take the wind out of ther sails. Generating a credible quantitative model is a very different matter. That's why I like to stay on the qualitative side of the analysis.
The "real reason" is that there are people in the EIA who believe the global URR is more than 8 trillion barrels.
No joke.
They literally told me that if we could "see all the data that they have seen" that we'd be convinced there was a lot more oil out there than what we would be led to believe from the production curve.
Ironically, at the time (just a few years ago in 2008 if memory serves), that would been quite a large R/P
May I presume that "all the data that they have seen" is undocumentable or is "if they told you they'd have to kill you" data?
Something like that.
As we pointed out, if you can't find it (they hadn't yet) and you can't extract it at a rate that makes a difference then it might as well not exist at all.
They literally told me that if we could "see all the data that they have seen" that we'd be convinced there was a lot more oil out there than what we would be led to believe from the production curve.
I've seen a lot of data that they haven't seen, and am a lot less confident than they are.
I worked for a company that ran a drilling fleet of 26 ships in the Arctic Ocean for decades, and while they found a lot of oil, none of it was producible at any price a normal consumer would want to pay. There was a lot more natural gas than oil, some of it relatively cheap to produce, but there's an awful lot of cheaper gas in more southerly climes, too. In general, I don't think the Arctic is going to replace the Gulf of Mexico as a major supplier of US oil.
I also did some oil sands research in Canada, and while we didn't get anywhere, other researchers got some processes working. This is great from Canada's perspective, but doesn't do much for the global picture. The current operations scare the living bejeezus out of people who see them - they are like something from a science-fiction movie. If you scaled them up to supply the world, you would have an open-pit mine the size of Great Britain, and I don't think that would go over well with the Canadian government or public. They don't need money that badly.
The US oil shales are nowhere near as developed as the Canadian oil sands - there isn't even a working pilot plant at this time. If a project was built and was scaled up to supply the US, it would be a mine the size of Britain, requiring the entire military budget of the US to fund the capital and all the water in the Great Lakes to process the oil. I don't think that would go over well with the US public.
It isn't conspiracy, nor is it chance. I'm becoming convinced that this kind of thing is emergent behaviour in a self-organising system.
Excellent work, Eric,
I'd like to pin down exactly where the EIA method can be proven inconsistent, i.e. I'd like to see the exact source, which states that "the agency calculates the US' threshold value of 10 using proved reserves statistics (R) in the R/P ratio's numerator, but then uses USGS estimates of technically recoverable oil (R') in the ratio's numerator in its scenario calculations."
This is a bit hard to find with the weblinks you provided, as
http://pubs.usgs.gov/dds/dds-060/
has a lot of documents and
http://www.eia.gov/dnav/pet/pet_crd_pres_dcu_NUS_a.htm
doesn't say what these data are used for.
Can you provide us with more specific weblinks here, Eric? Thanks a lot!
I can. I thought I linked directly to this in the text, but perhaps I made an error. Try checking here. This should lead you directly to the report I got the scenarios and analysis from. I think they have a printer friendly PDF version there as well.
Eric, Rembrandt, this is an excellent post that strikes deeply at the supply side of the TOD mission. Kudos, and please consider this the beginning of a series on this subject. i.e., Is it possible to include in future updates to this article the same level of investigation into NGL to provide a glimpse at the bigger picture?
The inclusion of non-conventional would also be helpful, though the criteria would likely be significantly different. Any idea what parameters would be the best to use?
Looking at the graphs 1 and 2 I am somewhat surprised that the IEA takes the peak issue that seriously: In other occasions they still seem to see the possibility that even a mature country like the US can rise its production. An example from a lengthy discussion in an IEA workshop in 2009, which actually showed that oil production is getting tough almost everywhere in the world - except in the US:
I think in arguing about the details the bigger picture gets lost. Does it really matter whether the peak is 2015 or 2030 from a public policy perspective? For a Republic that has been existence for 235 years what difference does 15 years make? Is there some technology that we can count on for being there in 2030 that is not going to be there in 2015? If not then 15 years here or there is irrelevant.
Seems to me the key issue is that oil is peaking and it provides 35-40% of the worlds energy.
You raise a good point, but one challenge is that in the United States the government, at least in an official capacity, won't acknowledge that oil is at or near peak and won't consider peak oil policies until the wolf is at the door. My hope in doing this little study is to debunk the main official source of oil optimism in the United States, in hopes of inching us a little closer to the possibility of discussing peak oil policy in a formal way.
(I also submitted this short article to a few peer-reviewed journals beforehand, but, not surprisingly, none expressed interest.)
Good luck with that...
Michele Bachmann Promises 2 Dollar A Gallon Gasoline When She Is President!
http://www.youtube.com/watch?v=mYRfjKq2Ydg
However I'm pleasantly surprised by the fact that the MSM pundits almost seem rational in their criticism of our future madam President's delusions. On the other hand she might actually be right, if she did become Prez, a major depression is almost guaranteed to bring the price of gas at the pump down to $2.00 gal, no matter what she does...
FM - Or as they say: the enemy of my enemy is my friend. LOL. After all the MSM doesn't knock President Obama for preaching "energy independence". Hey...at this point the MSM doing the right thing for the wrong reason is probably the best we can hope for.
In my opinion, the EIA is designed to maintain the status quo. Like other politically hamstrung institutions, they seem to be incapable of making bold predictions as they are constrained by the special interests its forecasts support. I appreciate all of the data that the EIA gathers, it really is quite excellent, but when it comes to predictions I would treat them as I would treat an equity analyst's research report - a good place to get started and familiarize yourself with some of the basics, but then you have to branch of and conduct your own analysis.
I also appreciate the thorough debunking of the EIA's methods, but like other commenters, I am not convinced by the veracity of the R/P method in general (although I would certainly consider Rembrandt's implementation better than the EIA's). To me, as posited in a recent and excellent Oil Drum post, the more telling sign of peak oil is that it is repeatedly failing to respond to pricing signals with production largely flat despite rising prices.
While everyone is focused on oil, I wonder if we are not also beginning to see the first signs of peak coal. Coal used in the American power sector (and therefore in the American economy more broadly) has been declining since 2007. With coal production in the Eastern US also falling amid rising prices, and China struggling to supply its massive fleet of coal plants, it seems a similar story could be playing out in coal right under our noses.
RE, I'm definitely not defending the R/P or R'/P ratios as indicators of peak necessarily. Demonstrating their efficacy as indicators of peak oil would be another project entirely. It's a project I'm working on, one that compares the R'/P approach to the Hubbert method, but that would end up a different guest post altogether if I offered it to TOD.
The goal of this article is simply to debunk the EIA's past application of the R/P ratio and its delivery of optimistic scenarios. This unfounded resource optimism is, in my view, an important suit of armor that protects policy makers from bringing up the issue of Peak Oil in a meaningful way.
>This unfounded resource optimism is, in my view, an important suit of armor that protects policy makers from bringing up the issue of Peak Oil in a meaningful way.<
I couldn't agree more.
Additionally, I'd say your article was quite successful in your stated goal - I don't think anyone reading it could credibly think that the EIA analysis is accurate.
It seems that an artifact of assuming that the production peak occurs at a fixed R/P
threshold is that this leads to a forecasted production curve that is highly asymmetrical. As drawn in figure 1, or in the EIA scenarios of figure 2, we have a gradual rise up to the peak, followed by a very sharp decline. In contrast, the Hubbert-type analysis leads to the production curve that is roughly symmetrical about the peak. This a consequence of assuming that production peaks once about half the extractable oil has been produced. So we can ask, for mature production regions which approach fits the data better? I would say the Hubbert approach does. We just don't see a precipitous decline in US production following the early-70s peak, likewise for the North Sea, or other mature regions.
Good observation Patrick. EIA assumes an R/P threshold of 10 which gives the production profile a highly asymmetric shape with a relatively gentle rise and sudden fall. A higher R/P threshold value, though, could yield the opposite: a relatively steep rise and a gentle fall. And if you did a little algebra, you could also find an R/P threshold value that yielded a symmetric profile with an equal rate of rise and fall. So the method itself doesn't determine symmetry.
When you look at real production profiles, asymmetry is the rule rather than the exception. Even in the United States, the production profile is asymmetric. The rise is obviously faster than the decline has been. This is why I've come to prefer the R'/P method over the Hubbert method, because it allows for asymmetric production curves without forcing me to use complicated curve-fitting programs to do calculations (you can make the Hubbert curve asymmetric too, but it requires fairly complicated mathematics that I'd hesitate to do in a spreadsheet program).
Thanks very much for the clarification.
Eric,
I'd say there's a very obvious and compelling explanation for the EIA's difficulty in producing accurate forecasts: it would have a direct, large and immediate financial impact on the oil industry.
The oil industry must show replacement of reserves in order to maintain company stock prices. If the EIA officially stated that this was impossible there would be immediate and fierce blowback, perhaps from congressional hearings started by sympathetic congressmen, or indirectly from lobbyists. Heck, from 1980 to 2008 there was an oil-man (Bush Sr or Jr) in the Whitehouse for all but 8 years.
The people who run the EIA know this extremely well, so as SW states things will be arranged that way one way or another: through choice of policies, managers, or staff.
The Obama administration understands Peak Oil - they don't think it's TEOTWAWKI, but they think it's very important. That's why they're pushing sharp increase in the automotive CAFE regs, renewable electricity, etc.
Nick - And maybe the current administration doesn't condemn the EIA for the same reasons the previous R administrations: they don't want to be responsible for the loss of $trillions of oil company stock value (much owned by millions of citizens in their retirement accounts) as well as possibly the worse stock market crash and probable depression of all time. Yeah...improve CAFÉ et al. IMHO sorta like passing out life preservers to the HMS Titanic passengers who didn’t have seats the life boats: they’re still going to die but more slowly from exposure than drowning.
Well, I doubt this administration thinks PO will cause TEOTWAWKI, and I certainly don't think so.
An aggressive CAFE, for instance, will push the car companies to electrify vehicles. An hybrid like the Prius needs 40% as much fuel; an extended range EV like the Volt needs 10% as much fuel (and that little can come from ethanol); and an EV like the Leaf needs none.
We don't need oil: the faster we kick the habit, the better off we are.
Sigh! Rolls eyes!
Nick, man, give it up already, this electric vehicle fantasy is based on pure pixie dust and is not viable in the real world! Not form a resource limits, chemical, physical or economical point of view it is 100% bogus. Even electric assist bicycles and velomobiles are dubious when it comes to true sustainability. Perhaps after a massive global die off.
http://www.suntimes.com/business/7108510-420/interest-in-chevy-volt-lose...
25 miles without gas is laughable! I can pedal that far in a velombile without any assist in about an hour.
this electric vehicle fantasy is based on pure pixie dust and is not viable in the real world! Not form a resource limits, chemical, physical or economical point of view it is 100% bogus.
How do resource limits make EVs impractical? They can be manufactured from recycled materials and renewable energy.
25 miles without gas is laughable!
Actually, it's 25 if you drive badly, and 50 if you baby it. A 40 mile range covers 80% of the average driver's miles!
Do the math yourself, do you really think we can substitute the current private automobile fleet with EVs? I don't see EVs making up anything but a tiny fraction of our future transportation options.
http://www.autoblog.com/2010/01/04/report-number-of-cars-in-the-u-s-drop...
Disclaimer: I work in metals recycling and have high hopes that this industry contributes greatly to a future sustainable civilization. Having said that my view is that EVs such as the Chevy Volt and Nissan Leaf are just an attempt at a glorified technocopian continuation of BAU. In my opinion we must get away from the private automobile transport model, the sooner the better!
Do the math yourself, do you really think we can substitute the current private automobile fleet with EVs?
Sure. Easily. Why not? EVs don't take substantially more resources than ICE vehicles to manufacture, and renewable electricity can power them.
Yes, the total US fleet contracted a bit recently. I'm not at all surprised - the US has a vast number of old cars, many of them one step away from being propped up on blocks in the front yard. Heck, many of those that were scrapped recently were in fact up on blocks.
The fact is that the US car market is over saturated - there are more cars on the road (or in the front yard) than are needed.
Well, in a way that's precisely my point! We no longer have the resources to continue producing and fueling a fleet of 14 million new ICE vehicles every year and if EVs such as the Volt or Leaf take just as many resources to build then we don't have the resources for them either. That's why I say they are an attempt at continuing BAU. Won't work! We need a profound paradigm change away from the private auto transport model. We need to make better use of what limited resources we will have available. More cars, ain't the answer!
We no longer have the resources to continue producing and fueling a fleet of 14 million new ICE vehicles every year
1) we don't really need to produce 14M vehicles even under something vaguely like BAU. Cars last much longer than they used to, current production numbers are propelled by fashion and marketing, and the current light vehicle inventory is much larger than needed - many are badly underutilized. We could reduce personal vehicle production numbers by 50% and be fine.
2) What resources are you concerned about? We can recycle steel and plastic, and power both the manufacturing and the vehicles with renewable electricity.
Nick said " we don't really need to produce 14M vehicles even under something vaguely like BAU."
It is even more interesting than that: If you divide the number of new cars by the total horsepower (or kilowatts) the engines now produce, the number is surely very high. It is very possible that we have already hit "peak car" as far as production in the U.S. goes (for our home market) and Europe likewise. The aging of the population, some demographic changes requiring far less miles per year making vehicles less needed and last even longer etc. mean that much of the auto fleet will be become essentailly "recreational" more than in years past, meaning the purchase of a new car is an discretionary expense. And these vehicles can do the job at far less horsepower per car than has been the case over the last 40 or so years, even if you discount electric cars and plug hybrid cars completely (don't, because their impact will be huge).
Think of this way: A brand new Honda Accord, a very modern and usable car in the late 1970's was able to deal with interstate highway speeds in relative comfort. I know people who still use them! They produced 68 horsepower new in 1976. The newest Accords with the V-6 produce 275 horsepower. By way of comparison, a new Nissan Leaf electric car produces 110 horsepower (oh the horrors of a fuel limited world!)
The technology is already here to crash oil consumption through the floor. It is just that oil stays so damn cheap, no one is interested. Let the price go up, the end of the oil age will arrive almost without being noticed. Our corrupt banks will cause us to suffer far more than peak oil ever will.
RC
Yair...from my point of view, living in a benign climate vehicles such as the Volt and Leaf make no sense at all...I am talking here of basic transportation.
What I need is an EV a bit bigger than a golf buggy with tall skinny model "T" size wheels and a compliant suspension...and a realistic price tag.
Maybe we should just realize, that the US EIA sees "soothing the public" as it's major job, rather than accurate forecasting?
Hello everyone. Great discussion.
I have a general question/comment:
Doesn't the "super-straw effect" have enough of an influence on the worldwide oil depletion pattern to make the Hubbert curve less relevant than we are still treating it in this thread?
I know the world's oil supply is a lot bigger than just KSA & Cantarell, but the whole industry seems to be basically running on this kind of thinking. They tend to work at prolonging the production plateau while uncomfortably avoiding discussion of all the evidence that this will lead to a steeper fall afterward. Furthermore, whenever I read anything that tries to factor in the pricing of oil in the future and the probable economic effects . . . the picture usually gets gloomier still, with talk about abandoning fields after less oil has been extracted than the classic Hubbert curve would even suggest. (Texas's zillions of low-producing stripper wells are not a relevant example for much of the rest of the world during the tertiary recovery stage, etc.)
My point is that the Hubbert depletion curve may not be steep enough. Some other threads on TOD seem to have treated this thinking as almost a given.
Spec – First, if you go back to Hubbert’s original work he doesn’t offer the depletion side of his curve. In fact he specifically says there are too many variables to predict the decline side accurately. Lots of folks offer their own projection of the downside but that’s their model…not Hubbert. His model focused on the exploration side (adding production) and not the depletion side.
Superstraws: can't offer a specific number or link but the vast majority of wells are not horizontal. OTOH the impact you describe is more attributable to Deep Water fields IMHO. Whether they are developed vertically or horizontally offshore ops require very high rate completions. Thus the rapid depletion you describe. Additionally, offshore wells are abandoned at much higher rates than onshore fields: the fixed ops costs are just too high.
Even worse depletion profile for the fractured shale plays like the Eagle Ford in Texas. Lots of wells coming on at 500 to 1,000 bopd. Unfortunately the typical decline rate appears to be 80-90%. A recently touted well that came on at 950 bopd and recovered 181,000 bo the first 12 months produced less than 90 bopd during the 13th month. The play can maintain its current high rate only if more wells are drilled quickly as the earlier ones go into steep decline.
Future decline? For the US it’s easy…we’ve been there for 40 years. Very gradual due to the efforts of all those small independents as you describe plus a boost from the DW and shales. IMHO the global decline will be steeper. But I hesitate to put a number to it. So much critical data that won’t be made available to us. Given the ever changing international exploration game it difficult to estimate when we’ll pass the max. But my guess is that we’re on a plateau now that may be on a sustained upslope. But for how long? I won’t guess. But as others say: rust never sleeps…and neither does depletion. We needed to add around 30 billion bbls of oil to the reserve base just to break even with production over the last 12 months. And as long as consumption sits where it’s at another 30 billion bbls every year just to stay flat re:reserves. But even if we do that doesn’t guarantee the production rate will stay flat.
Thanks for the prompt reply ROCKMAN.
I had not realized that the downslopes of the Hubbert curves were not part of Hubbert's original forecast. When the prediction on the way up is such a clear bell curve it just naturally lends itself to the belief that the downslope will be similar. Looking at the situation now, it scares me now to think that tons of people are probably making the same wrongful inference that I did.
The high extraction costs on deepwater wells are very troubling to me. I'm sure the people involved with the deepwater industry are well aware of the difference (from conventional older wells), but I wonder if it has really affected the mindset of the energy industry's power brokers (and by inference, everyone who takes advice from them) as much as it should. The most expensive deepwater wells are the newest in general. Many of these expensive deepwater fields' eventual sharp decline rates (and sharp cutoffs once the price barrier is hit) are still predictions on paper rather than experienced events. IMHO that has to have some effect on their thinking no matter how intelligent & educated a person is. A middle-aged or older person today has grown up in a world where aging fields normally depleted at a much slower rate.
spec - Actually in general terms none of the DW players are working with "paper predictions". They are working with the most detailed and accurate 3d seismic in the history of the oil patch. And million $ reservoir modeling programs. Which isn't to say they're accurate down to 5 decimal places. But the future decline rate of any particular DW fields isn't much of a mystery to the folks that own it.
Yep: I recall a someone long ago posting Hubbert's exact words: in effect just too many unpredictable factors to draw the backside of the curve. And if you think about it there's a logical physical reason why the front and backside aren't strongly related. The front side is the discovery model. Granted technology changes over the decades do mess with the distribution a bit but in general the big fields are discovered early on because, quite simply, they are easier to find then the small ones. And given 10 prospects and only enough capex to drill 5 I'm going to go after the bigger ones first. Another factor: shallow fields are easier/cheaper to find. And there is a depth window for oil: the deeper you go the less likely you'll find crude oil. Below a certain depth/temp you have almost no chance of finding crude oil. So as the shallow (and more likely) oil fields are discovered what's left is the deeper (and more likely NG) fields. And they get drilled last.
Now jump to the backside of the curve. It's shape has little to do with discovery especially when you past the peak. The backside rate is a combination of fewer (and smaller)fields being discovered with the decline of previously discovered fields. It's mostly a function of the decline of existing fields with one big exception: new trends being dicovered. This is why we see the current plateau in oil rates in the US: DW and some of the shale plays.
In my 36 years I've never seen a single oil well that came anywhere close to having a symmetric decline curve. Usually very asymmetrical. Long period of higher flow rate followed by a sharp drop off followed often by a very low and long decline rate period. Look at an entire field and you see a similar picture: lots of wells drilled early on pushing up the production rate fast, then relatively stability, then rapid decline and then rather flat. Now jump to all the reservoirs in one geologic region. This region's decline profile will be dependent to some degree with how fast new fields are discovered. But individual fields will still have very asymmetric declines.
Thus there really isn't a reason to expect the decline side to be predictable from the discovery side. A simple model: as you enter the work force you salary tends to increase in time until you start to flatten and even top out. Now consider your spending habits. Are you going to spend money (i.e. like a field producing oil) in the second half of your career based upon how fast you earned money in the first half?
Yeah...I know...an odd analogy but the best I could come up with. LOL
Well heck...the obvious just occured to me: Is Hubbert's USA curve symmetric? Just look at it:
http://www.overthinkingit.com/wp-content/uploads/2008/09/rs-500-us-oil-p...
Not very symmetric. Of course that's just for the lower 48 of the USA. And only out to 2007. We've had some gains from DW and the shale plays making it even less symmetric. But I've highlighted before why I don't think the curve from other regions of the world will look like ours. private mineral ownership, small indepedents and essentially a non-NOC structure should result in a different backside curve to some degree. Who knows: a non-USA Hubbeert curve may be more symmetrical or less. Different factors pushing the curve in different directions. Giving me a headache.
It seems unreasonable to confuse a dislike of their models with assigning ulterior motives. What evidence do you have that those who built the models sat around prior to their release, and decided to jimmy either the methods they used (to generate the results they wanted) or the results themselves because of the motive you assign to them.
Eric,
I believe the mathematics are faulty too. The level of the R/P cure has nothing to do with where the peak lies. Rather it is the first derivative that matters. I have determined that the peak occurs where the first derivative equal -1. I'll outline the mathematics below, but this result does make intuitive sense as well. Specifically, if you interpret the reserve to production ratio as the number of years remaining (constant extraction at current rate), then once you get to the point when a year of extraction reduces the number of years remaining by a year or more, you have reached the peak. Furthermore, this critical -1 slope will be reached well before the R/P curve levels out. The curve begins with a highly negative slope. Before the slope can reach zero it must pass -1.
I assume in my mathematical model that the reserve to production curve has a continuous first derivative. Real data of course are noisy, but it is the underlying trend that matters. So let's proceed. Let g(t) be a smooth R/P curve. Those who are familiar with survival analysis will recognize that the reciprocal of reserve to production is a hazard function, h = 1/g. Production refers to the density function f, while reserve refers to the survival distribution S = 1 - F, where F is the cumulative density of f. (Note S' = f.) The hazard function is defined as h = f/S. We are interested in peak production, which in this set up is simply the maximum of f(t). This maximum occurs at time t where f'(t) = 0. Let's derive f'.
f = h*S
f' = h'*S + h*S' = h'*S - h*f = h'*S - h^2 *S
Setting this first derivative to 0 and noting that S is strictly positive within an interval of maximal density, we obtain that the peak occurs when
h'(t) = (h(t))^2.
Since g = 1/h and g' = -h' / h^2, the critical condition holds g'(t) = -1. QED.
Now let's use this machinery in an interesting example. Looking at the charts above, it seems plausible to model the R/P curve as a sum of a constant plus a decay function that converges to 0, such as 1/t or exp(-t). Let's go with the latter,
g(t) = a + b*exp(-c*t).
Peak time occurs when
g'(t) = -b*c*exp(-c*t) = -1
Thus,
t_peak = -log(b*c)/c.
Note well that the constant lower limit of g, namely a, has absolutely nothing to do with the timing of the peak.
For kicks all show the distribution functions that obtain from this choice of g. It is sort of a generalized logistic distribution that allows for asymmetry.
h = 1/g
= exp(c*t) / (a*exp(c*t) + b)
S = exp( -Integral{ h } )
= ( a*exp(c*t) + b )^(-1/a/c)
f = h*S
= exp(c*t) * ( a*exp(c*t) + b )^(- 1/a/c - 1)
The hazard function begins at h(0) = 1/(a+b) and rises smoothly to 1/a. This rise in hazard is suggestive of a production ramp up. As the hazard function levels off near 1/a, production goes into exponential decay. Year after year proportion 1/a of remaining reserves is extracted. It is as if you are always a years away from full depletion (if you could maintain the same production level). Too make the parameters easier to interpret, you can set a and b such that S(0) = m, your full recovery amount at the outset of production, t = 0. Thus, a + b = m^(-a*c).
A final observation I would make is that the density, i.e., production curve is rounded at the peak. This simple model does not have pointed peak as the EIA model does. If one begins with a smooth R/P curve or hazard function, then the peak will be smooth as well. I can think of no reason why you would expect a discontinuity in the R/P function a the very moment that production peaks. Basic mathematical models do not need kinks. but lead rather to smooth peaks. Some sort of shock or disruption seems to be presupposed where there is no obvious causal mechanism to account for this. It may simply be an uncritical artifact of an overly simplistic modelling.
So to recap, the EIA model is mathematically flawed. There is no way to set a critical R/P threshold that informs when the peak happens. Rather, it is the slope, first derivative, that determines the peak. The peak happens when the slope of the R/P curve is -1, and this point must come before R/P levels out, if indeed it does level out. There is precise mathematical linkage between the R/P, R and P curves. Knowing any one curve completely determines the other two. Any model that does not explicitly derive one curve from the other is likely not to be internally consistent. Having not reviewed the mathematical development of the EIA models, I cannot state conclusively that their model is mathematically invalid; however this is my strong suspicion. That the methodology does not correctly link peak timing to the first derivative of the R/P curve betrays a failure to grasp basic calculus. The mathematics behind this work is not up to making any reliable forecast and is likely to yield predictions that are too far into the future.
James
Hi James, your math and reasoning are interesting. I have a couple questions:
First, are you talking about R/P or R'/P? The difference between these two is important.
Second, if you're talking about R/P, then how can you justify saying that the peak will come before the indicator levels off? Historical data from the United States directly contradicts your assertion.
Third, if you're talking about R'/P, again how can you justify saying that the peak will come before the indicator levels off? Historical data from the United States directly contradicts your assertion.
Yes, to all the above.
There's a chart at:
http://tinyurl.com/3v6xg6v
from:
http://the100metreline.blogspot.com/2011/08/how-long-do-we-have.html
This chart is our view of the future of oil supply, especially for small nations that are net importers of oil.
The chart uses two sources of data:-
Declining production data from the IEA World Energy Outlook 2010's expected crude oil production from 'Existing fields' plus part of the IEA's 'Fields yet to be developed' and 'Fields yet to be found'. (Quite generous, really.)
and
Consumption data from the CIA World Fact Book:
https://www.cia.gov/library/publications/the-world-factbook/rankorder/21...
The net-exporter's consumption is incremented by a modest 2.9% per year from 2010 levels.
The premise is that net exporting nations will continue to favour supplying their internal consumption over exporting their oil during the next 20 years. These nations will thus become prime locations for global manufacturing as oil supplies to the net importing nations become more tenuous. At the same time their production capacity will be affected generally in the same way as the rest of the world, as depicted by the IEA's WEO2010.
The suggested rate of increase in consumption within exporting nations of only 2.9% per year is likely to be very 'conservative', but things get quite bad enough fast enough with that rate; people can make their own assessment of the more likely rate and the subsequent implications. (Saudi Arabia's internal consumption is rising at about 5.5% per year, for example.)
The largest oil importers (say the top ten importers including USA, China, Japan, Germany, South Korea and India etc) will make (have made) agreements with other exporters to assure supply of their import requirements over the same period - at any cost.
This leaves 'what's left' of global oil exports for the other 140 net importing nations, including many nations with little or no internal oil production at all.
The 'what's left' for these 140 nations is depicted on this chart as what could be termed a 'Triangle of Hope' spanning on the y axis from about 22 to 52 million barrels per day for them today (providing them with about 30 mmbbl per day today), running out to zero available to them in ten years time.
ZERO. TEN YEARS TIME.
And the internal demand of the net exporters crosses the declining global production curve in about 20 years time. At which time there is nothing left to send to any of the importers.
At that stage, 20 years out from now, this chart suggests that the only oil that will be available to any nation will be the oil it produces itself; with the caveat that IEA predicts that generally all production by then will be down to about 40% of present-day levels. It appears that there will not be any nation with a surplus of supply over demand.
Its my guess that past that date any global oil movements will be by way of private treaty between parties with something of value to trade rather than within any open market.
I'm not arguing with your math, nigwill. But it's hard for me to swallow the idea that there will ever be NO oil on the worldwide market. If there isn't enough to go around then the stronger will take it from the weaker in whatever way they have to. I don't believe things can't get that bad, I just believe that people will always remain that greedy. Stolen property is never very hard to move when it's valuable.
So Spectator, you're suggesting (for example) that when you and your family (Say Mr and Mrs Russia and family) cannot get enough of a life-supporting commodity and are slowly starving THEN you suddenly become all altruistic and start sharing what little you have with others?
Not Pygmalion-Likely in my view!
I fear you are correct in saying that the strong will simply take from the weak, and in this case the strongest are the net oil exporters, and the weakest are the smaller net importers with no indigenous oil production, followed by the small exporters whose exports are in the hands of foreign multi-nationals or governments.
To be honest I cannot see it working out any other way, and the time frames are very short - only ten harvests and we are in deep trouble.
I just said that I think there will always be some kind of worldwide oil market. The specifics of the situation do not need to be anything like what we are used to. Most of us may not get access to cheap oil like we are used to but that does not mean there won't be any way to buy decent quantities of oil on the worldwide market.
Look at some of the messed up African countries today. People are starving because all the foreign aid we send just gets snatched up by the bad guys with machine guns. Same principle. There is not always much correlation between a country's resource wealth and the standard of living for most of its citizens. (Put another way - would the House of Saud deprive the Bush family of a gallon of oil so they could help out a struggling village of their own underclass in KSA? Not bloody likely.)
And in the bigger picture, the fact that oil will have gotten scarce is not necessarily going to make oil THE big decider of who is rich and poor at that time. It's the same reason that we can have PO's plateau starting to wreck the economy right now and yet oil still remains reasonably priced. Demand destruction prevents oil from going to skyrocketing prices (at least for very long). We still suffer, we still use much less oil overall, but a gallon of oil is not worth way more than it was a few years before PO.
Don't mean to annoy, Spectator. :)
There are quite a few commodities in the current global market that are in short supply and would not fit the term 'decent quantities', but they are not quite critical because there are parallel commodities that can replace them to some degree. Copper pipe can be replaced by plastic pipe etc. This gives us the false impression that a replacement is always available.
But mineral energy is a commodity that (we are finding to our chagrin) is not yielding readily to the technological fix of near equal equivalence.
With irregular fuel supplies I would imagine that a country will rapidly get to the point where nobody could use oil if you gave it to them because a little is useless. We will have made other arrangements (reduced population intensity, learned to survive (or not) on what we have etc) and the travelling oil salesman will be greeted with amusement, and a few pints will be taken off his hands to burn in oil lamps as a curiosity.
Eventually, when no one has any practical use for it, the Price of Oil will become irrelevant - we will have moved on.
You make the point that that there will be a widening divergence between those with oil (produced or bought or stolen) and the rest. I agree. Initially power will reside with those who can put oil into their Tanks and Fighter-bombers, but eventually power will transfer to those who figure out the way forwards without oil fastest. Those hanging onto the old way will become fossils in their own way soon enough.
I somewhat agree with you about that. I do think most people will move away from huge steady oil consumption in daily life, but I don't think it will ever be anything too close to useless for anyone.
I don't think reducing oil supplies will make "winners" out of people who learn to live with less of it. IMHO that's a nice hope but I don't think it meshes with reality enough. Oil is like money or any other kind of wealth. If you abruptly subtract a big chunk of it from a society, it just means the few will steal a greater portion of the total from everyone else. Conservation will make you a bit less poor but it won't make you anywhere near rich.
Except that there really are good substitutes for oil: PHEVs, EREVs, and EVs will work very well.
Did you try to produce a graph like figure 4 for any other post-peak regions besides the U.S.? Would be very interesting to see.
Maybe the R'/P ratio could be a useful metric after all.
I have, but don't have them handy to post. Other countries show similar trends, i.e. a falling R'/P until peak, after which the decline levels off. It doesn't always level off at the same number that the USA does, though, in fact there's quite a bit of variation. Exploring some of that variation might be worthwhile. I can write it up for another guest post, if anyone's interested.