| ASPO-USA Conference, November 2 - 5, Washington DC | The Oil Drum | Tech Talk - Pipelines in and from Canada |
Deepwater GOM: Reserves versus Production - Part 1: Thunder Horse & Mars-Ursa
Posted by Luis de Sousa on September 30, 2011 - 11:13am
This a guest post by Jean Laherrère, a long time guest contributor to TheOilDrum. Jean thoroughly analyses field production data for the Gulf of Mexico (GOM) in several posts. The goal of this series is to compare the evolution of reserves estimates in the GOM with the actual production figures that show the oil decline. Thereby the reliability of reserve estimates can be investigated. This first installment shall look into Thunder Horse and Mars-Ursa fields.
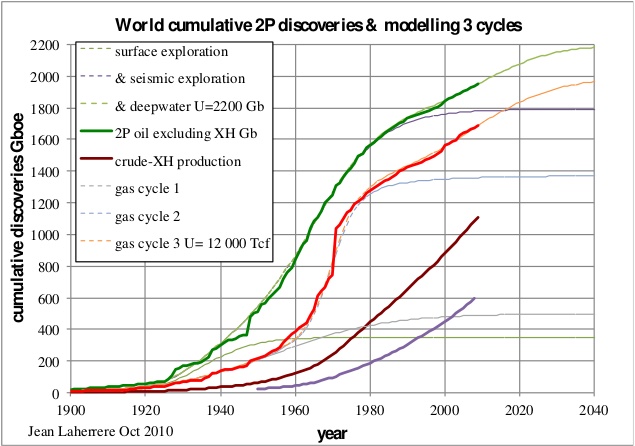
The world oil and gas 2P cumulative discoveries can be modelled with 3 cycles [NE: 2P discoveries represent those resources proven as reserves plus those that probably shall become reserves; more details here]. For crude excluding extra-heavy oil, the first cycle corresponds to surface exploration (1900-1950); the second cycle to seismic exploration starting in 1930 and a third cycle corresponding to deepwater starting in 1990. Deepwater refers to oil resources that are found under water columns of 500 meters depth or more. This late coming discovery cycle has had a very important impact in several economies around the world, especially those of the OECD, that depleted their conventional resources much earlier. This 3 cycle oil discovery model trends towards an ultimate of 2200 Gb (crude less extra-heavy oil) against a cumulative production already past 1100 Gb.
Figure 1: world Oil (excluding extra-heavy oils - XH) and Gas cumulative discovery and production with respective models. |
|
The importance of Deepwater Oil Discoveries
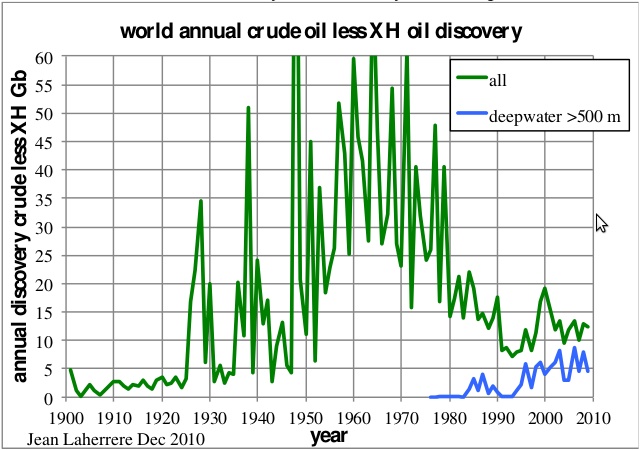
Deepwater discoveries are now making up a large part of the world crude excluding extra-heavy oil discoveries.
Figure 2: world annual crude less extra-heavy oil discovery and including deepwater. |
|
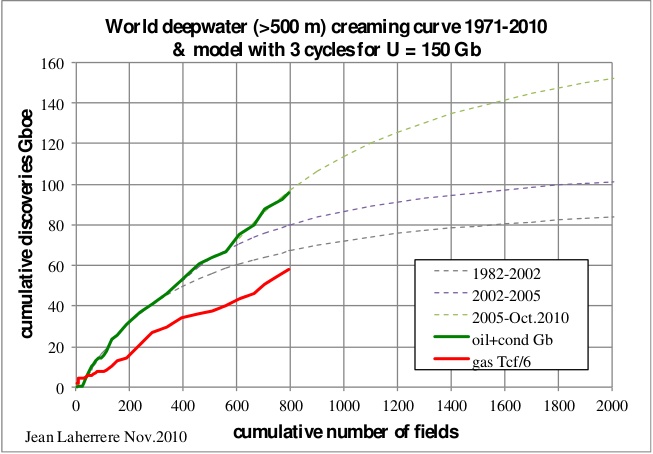
The ultimate for deepwater oil can be estimated at around 150 Gb from the creaming curve versus the cumulative number of fields. Deepwater oil is mainly found in the Gulf of Mexico (GOM), Brazil, Nigeria, Angola, and Congo. The model is made with three cycles; the last one, starting in 2005, is associated with subsalt plays. A fourth cycle could occur if a new deepwater plays are found, as it occurred for natural gas in Israeli waters.
Figure 3: world deepwater oil & gas creaming curve modelled with an ultimate of 150 Gb. |
|
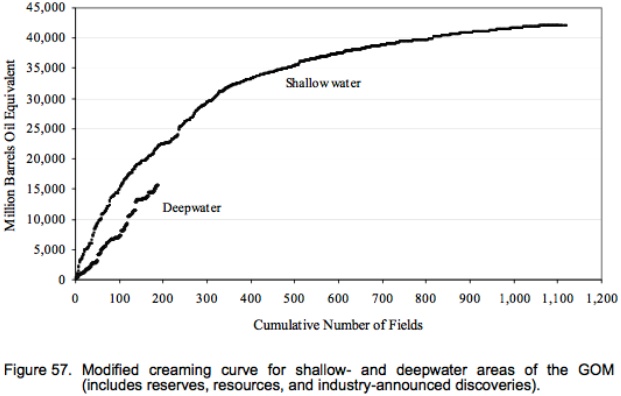
The MMS 2004-021 report entitled “Deepwater Gulf of Mexico: America’s expanding frontier” displays a similar creaming curve for the GOM comparing shallow water and deepwater (>1000 ft). The shallow curve is really hyperbolic close to the asymptote; the deepwater curve seems to follow it, but lower.
Figure 4: GOM oil & gas creaming curve for shallow and deepwater derived from the figures reported in 2004 by the MMS. |
|
Zooming in on The Gulf of Mexico
But deepwater reserves estimates are questionable because they have not been yet confronted with long-term production (the same being true for shale gas). International oil companies are the main operators in deepwater plays and they are reluctant to revise their reserves estimate.
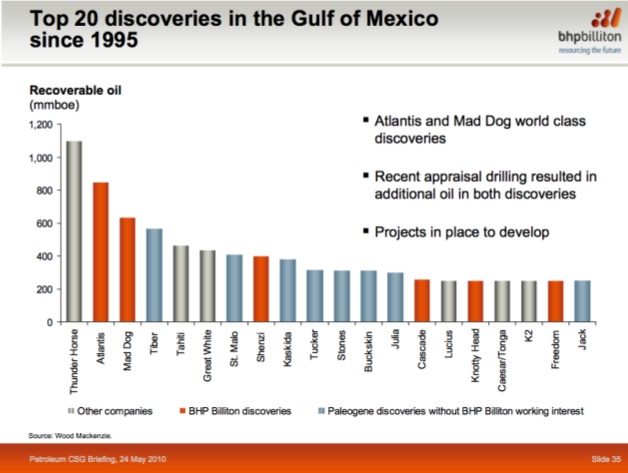
The GOM is the best place to study field data because there are numerous big fields and also for the monthly production figures (oil, gas and water) are available on BOEMRE's (formerly MMS) site. BHP Billiton (2010) has published the top 20 discoveries in the GOM since 1995 but the largest field (for MMS) is Mars-Ursa found in 1989
Figure 5: top discoveries in the GOM since 1995 from BHP. |
|
The goal of this series is to compare the evolution of reserves estimates with the actual production figures that show the oil decline. Let’s start with Thunder Horse operated by BP, followed by Mars-Ursa operated by Shell.
The Thunder Horse complex
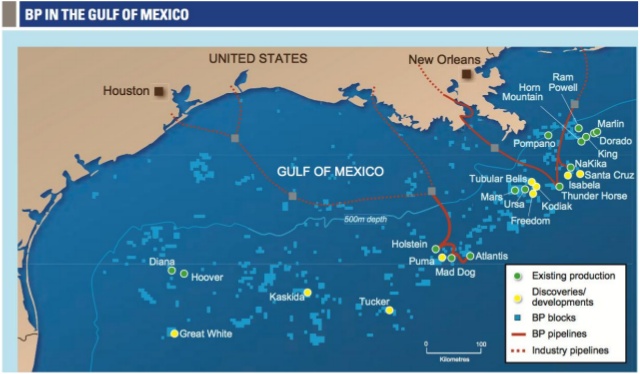
The Thunder Horse field was found in 1999 in deepwater (near 2000 m water column) in deep subsalt sediments (over 7000 m) with high pressure (1200 bar), 125 miles southeast of New Orleans. The field is operated by BP (75%) with partner Exxon-Mobil (25%). The discovery was first called Crazy Horse, but the name was changed quickly at the request of the descendants of the Native American warrior of the same name.
For BP (Frontiers Aug 2009) the field consists of two reservoirs, Thunder Horse South and Thunder Horse North produced by only one semi-sub platform.
Figure 6: map of BP discoveries in the GOM. |
|
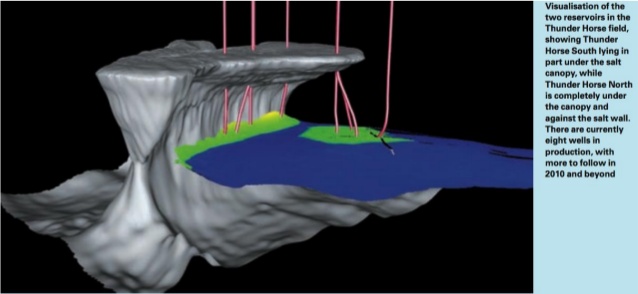
Thunder Horse South (called main or Thunder Horse) is a four-way structure in part below salt canopy, while North Horse North is a trap against the salt wall as shown in the following graph:
Figure 7: Visualisation by BP of the South & North Thunder Horse reservoirs showing the salt wall and the canopy. |
|
From this graph, it is obvious that there are two fields located in blocks MC 775, 776, 777, 778, 821 and 822, but for some it is reported as one field, because production comes from a single platform in block MC 778. For the MMS there are two fields, MC 778 (main) and MC 776 (north):
The largest of the subsalt discoveries was made by BP and ExxonMobil at Mississippi Canyon 778, the “Thunder Horse” prospect, (OCS-G-09868 #1) in 6,050 ft of water in 1999. Thunder Horse is one of the largest deepwater Gulf of Mexico discoveries to date, with estimated reserves of 1 billion BOE. A second discovery, “North Thunder Horse” at Mississippi Canyon 776 (OCS-G-09866 #1), was made in 2000 in 5,636 ft of water. Industry press releases report that the entire Thunder Horse and North Thunder Horse field complex may have reserves of 1.5 billion BOE. Thunder Horse is scheduled to commence production in late 2005.
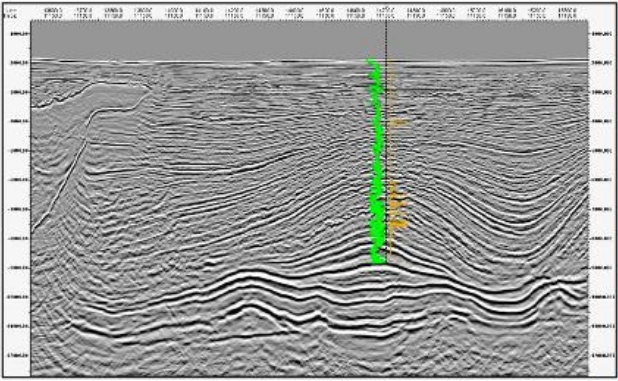
The following seismic line shows both the Thunder Horse plain structure in the middle with the log in green and on the left the north trap against the wall of the allochthonous salt (from Abu Chowdhury and Laura Borton, 2007, ”Salt Geology and New Plays in Deep-Water Gulf of Mexico”, Search and Discovery article #10132)
Figure 8: Seismic profile across Thunder Horse and Thunder Horse North (left). |
|
Figure 9: Thunder Horse semi-sub platform from Korea to GOM. |

|
The Thunder Horse complex was brought on production with the largest semi-submersible platform ever built (130 000 t), assembled in South Korea and transported to the GOM on September of 2004.
But in July 2005 before production actually started, hurricane Dennis forced the development crew to leave and when they returned the semi-sub was tilting by 20-30°.
Figure 10: Thunder Horse platform tilted after Hurricane Dennis in 2005. |

|
Due to a faulty ballast valve, water entered the ballasts and expensive work had to be carried out to remedy all the damaged parts.
BP (Frontiers August 2009) was planning 28 production wells and 5 water injection wells, with a lifetime projected between 20 and 25 years (Dan Replogle). The facility is designed to process 250 000 b/d of oil and 200 Mcf/d of gas. Production eventually started in 2008.
BOEMRE provides field data for the GOM in their “Estimated oil and gas reserves” series, but the most recent report dates back to 2009 (MMS 2009-064) and only includes numbers up to the end of 2006. This report is very complete and can be freely downloaded in pdf format or as a series of spreadsheets. BOEMRE provides an annual report (updated every month for 2011, with the August issue presenting data up to the end of May) providing the monthly well oil, gas & water production as the number of days per well, sorted by field, lease and API number. But there are several other sources (the annual report is to over 7000 pages), all in pdf:
- by unit
- production by lease - PBP9152A: OGOR/9152, reporting separately crude and condensate, gas-well gas and casing gas and water
- production A sorted by lease - PBOGORAL : OGOR-A report 4081
The highest resolution source is per unit (I found later that it is incomplete, see part 2 of this series). The best source is production A per lease (OGOR A-well production data) but it is heavy and the necessary conversion from the pdf into a spreadsheet would a take a long time.
It is a nuisance to have several reports on the same data with sometime different values! Furthermore, these reports should be available in some spreadsheet format, or in plain text to make their usage on statistics/calculus software practical. The best report to deal with field data without bothering with individual wells is the “Estimated oil & gas reserves” series, but the latest issue is only contains data up to the end 2006.
Thunder Horse (main or south) MC 778
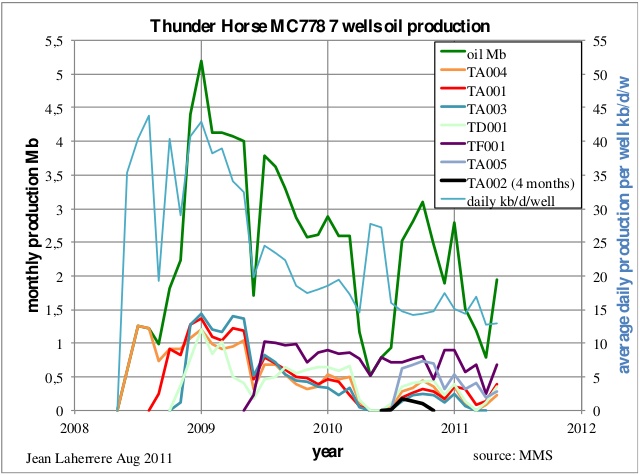
BOEMRE reports 7 producing wells, though one of them, TA002, only produced during 4 months in 2010, despite no water being produced; the production of each individual well varies widelly. The monthly oil production peaked in January 2009 at 5.2 Mb (168 000 b/d) with 4 wells, the average daily production per well peaked in 2008 over 40 000 b/d. In the next figure the wells are sorted by decreasing cumulative production at the end of May, 2011.
Figure 11: Thunder Horse MC778 oil monthly production: total and 7 wells individually plus average daily production per well. |
|
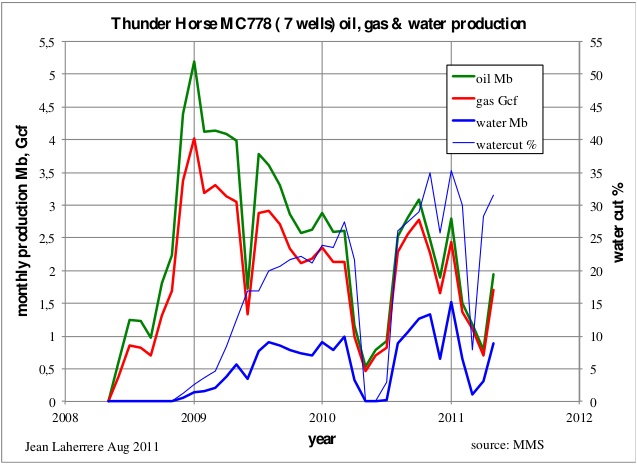
The production of oil, gas and water drops during periods of work over and also due to the Macondo oil spill in April of 2010.
Figure 12: Thunder Horse MC778 monthly oil, gas & water production. |
|
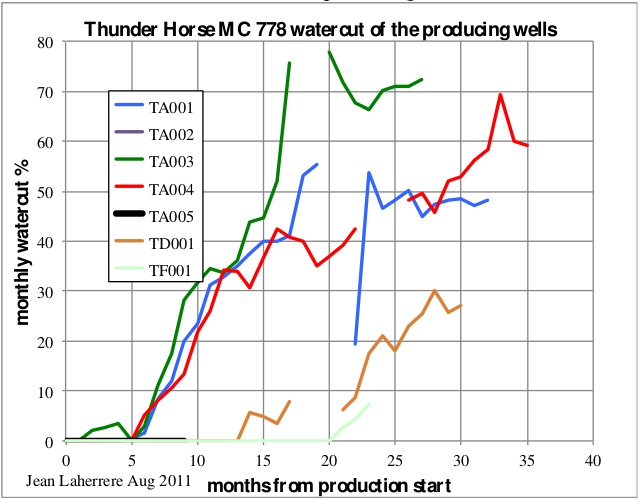
The individual well watercut from the production start varies widely: 20 months after the start it is still at zero for TF001, while for TA001 it is already over 70%.
Figure 13: Thunder Horse MC778 watercut of the producing wells from start. |
|
The Thunder Horse oil production decline plotted versus cumulative production trends towards an ultimate of less than 150 Mb, when original reserves were estimated by the MMS at 757 Mb in 2002, 653 Mb in 2004 and 643 Mb in 2006 (the last estimate). It is obvious that these estimates were too high, though this field needs yet more wells drilled. BP in its turn does not publish enough data on the real potential of the field, no reserves have been reported by this company, and neither by Exxon-Mobil.
Figure 14: Thunder Horse MC778 oil decline, watercut and ultimate. |

|
North Thunder Horse (MC776)
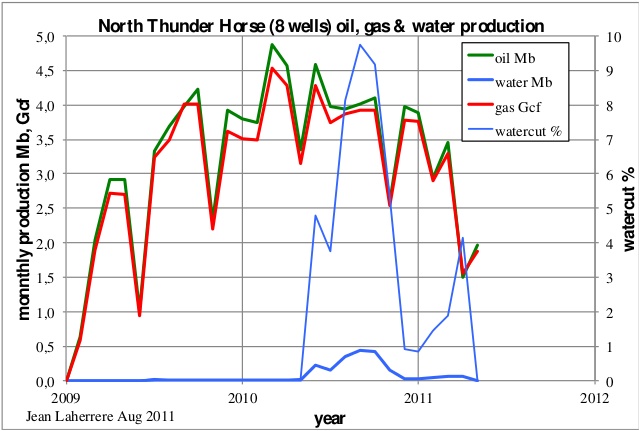
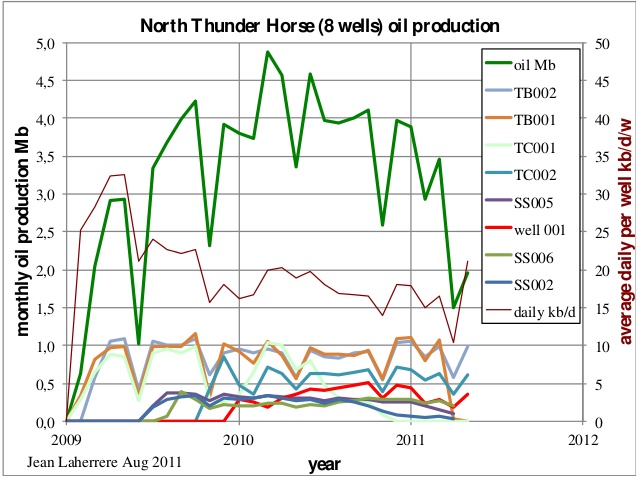
The MMS reports 8 wells with overall oil production declining in 2011 after a bumpy plateau; surprisingly, the water cut is also declining.
Figure 15: North Thunder Horse MC776 oil, gas and water monthly production. |
|
Oil production figures per well are bumpy and the average production per well peaked at 32 000 b/d, less than the main field data, which peakead at over 40 000 b/d.
Figure 16: North Thunder Horse: total and individual well monthly oil production plus average daily production per well. |
|
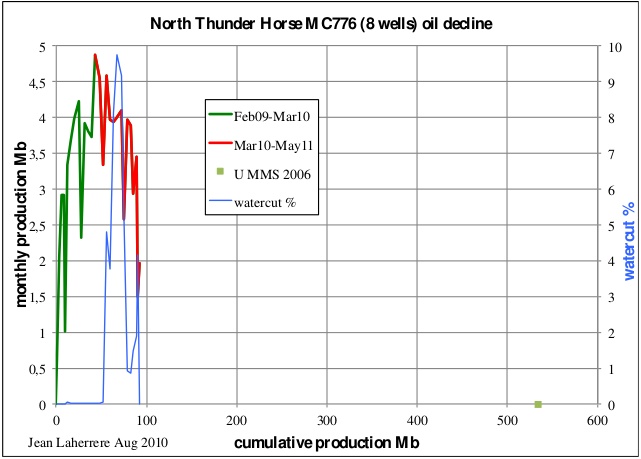
The monthly oil production versus the cumulative production displays a decline hard to extrapolate towards the ultimate value, which was estimated at 534 Mb by the MMS in 2006 (440 Mb in 2005 data, 365 Mb in 2004 data and 347 Mb in 2003 data). The watercut is also erratic.
Figure 17: North Thunder Horse MC776 oil decline, watercut and ultimate. |
|
Thunder Horse main & north
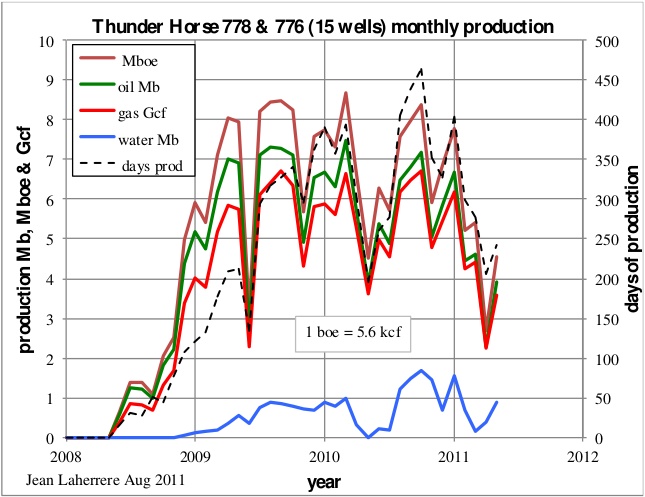
The two fields are produced by the same platform (a semi-sub); their collective oil production displays a bumpy plateau with a peak above 7 Mb per month (about 240 000 b/d). The Macondo blowout (April-July 2010) has disturbed the production, which resumed in the Fall of 2010. There is a strong decline in 2011 due to the natural decline of the existing wells and the lack of new wells because of the drilling moratorium due to the Macondo oil spill.
Figure 18: Thunder Horse MC778 & MC776 monthly production and production days. |
|
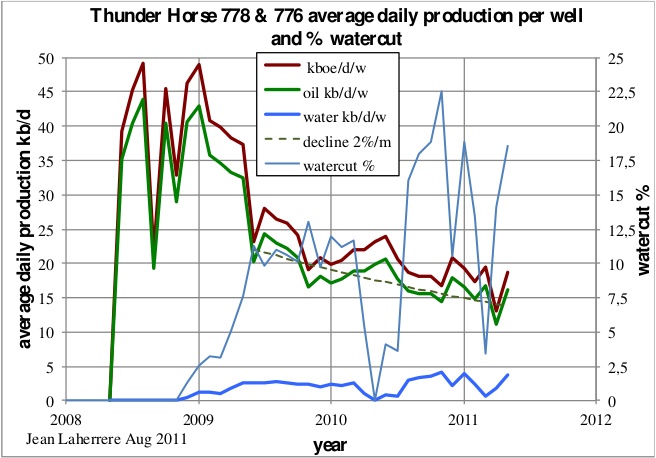
The total number of producing wells in May 2011 is 15, when the designed development was to consist of 25 wet-tree subsea wells, tied to the floating platform. More wells could be drilled, but BP has been very short in explaining this decline and its future planning. The average oil production per well shows a peak in 2008 at about 40 000 b/d/w, with a decline of about 2% per month (over 20 % per year).
Figure 19: Thunder Horse MC778 & MC776 daily production and Watercut |
|
-------------------------------------
Water production varies with the opening of new wells and the closure of some.
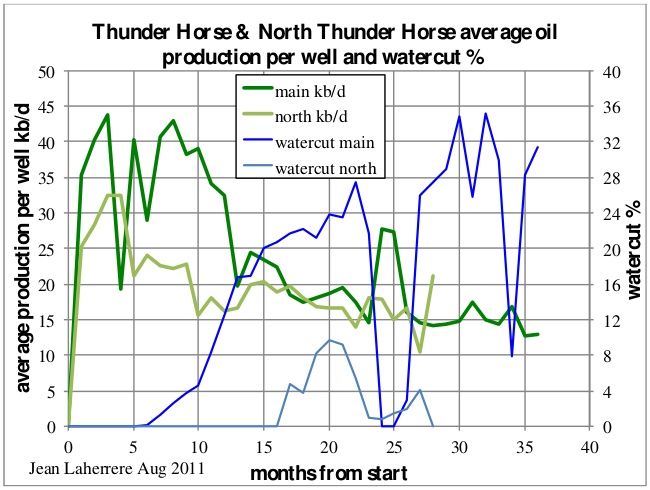
The comparison of the two fields (MC778, the main field and MC776, the north field) average production per well and global watercut starting from first production shows some difference, in particular for watercut likely due to the difference in trapping, but less for oil after the first year.
Figure 20: Thunder Horse: average daily production & watercut for MC778 and MC776. |
|
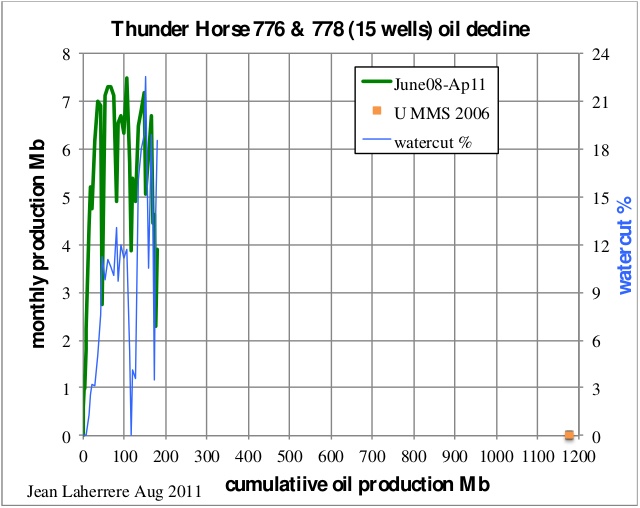
The plot of monthly production versus cumulative production, together with the watercut, does not present an easy extrapolation towards the ultimate, which was estimated at 1177 Mb in 2006, up from 1000 Mb in 2003.
Figure 21: Thunder Horse MC778 & MC776 oil decline and ultimate. |
|
The lack of data from the operator on the future development of the Thunder Horse platform beyond the actual number of producing wells compared to the initial project, prevents a reliable forecast at this time. It is obvious that present producers are in steep decline, but the watercut varies widely. The future production depends mainly on the drilling of new wells.
A report by GlobalData (2010), “Thunder Horse, Gulf of Mexico, Commercial Asset Valuation and Forecast to 2035 or 2038", (which costs 2800 $) includes the following in its description:
The field life of Thunder Horse is expected to be around 25-30 years with abandonment to start during 2036 without EOR or 2033 with EOR. The field is expected to generate $111.38 billion without EOR or $111.57 billion with EOR in revenues (undiscounted) during its remaining life (starting 1/1/2010) and is expected to yield an IRR of around 18.43% without EOR or 18.46% with EOR.
Like I always say: when more than 3 significant digits are given, it means that the author has a very poor knowledge of the accuracy of the reported value - the second digit surely must be wrong, and also likely the first digit. These 5 significant digits for the present net value of a field for a life of 25 years comes of a Monte Carlo simulation with many assumptions (in particular oil price) and the inaccuracy of such estimate should be at best 20%; the only conclusion is that EOR (which one?) does not change the result.
To conclude on Thunder Horse, there is not enough public data from the operator on future drilling to get a reliable extrapolation from the past production. But it is likely that the latest MMS estimates (MMS 2009-064 for 2006 reserves) are optimistic. It will be interesting to see the new estimate by BOEMRE, lacking data for the last two years!
Mars-Ursa
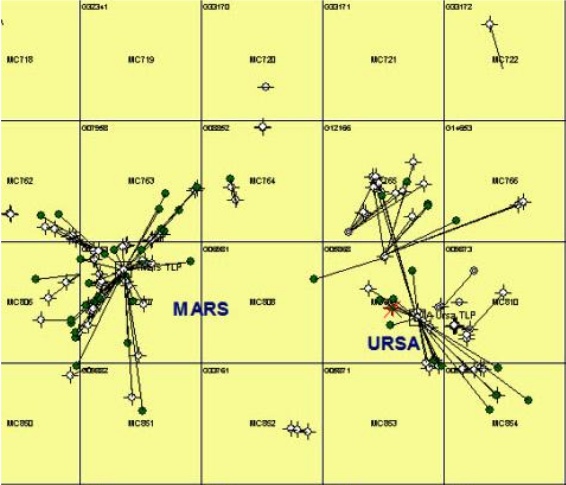
Shell publishes more and better data than BP on their GOM production. The two fields, Mars (found in 1989 on MC 763 at 966 m water depth) and Ursa (found in 1990 on MC 854 at 1225 m water depth), are grouped by BOEMRE under the name Mars/Ursa or MC807 as being the largest oil field in the GOM. Nevertheless, these two fields are clearly separated. They are both produced by Shell, but from two Tension Leg Platforms, being Mars on MC 807 since 1996 and Ursa on MC 809 since 1999. The Mars unit encompasses 6 OCS leases in the Mississippi Canyon Area - blocks 762, 763, 806, 807, 850 and 851 operated by Shell (71.5%) in partnership with BP (28.5%). The Ursa unit encompasses blocks 808, 809, 810, 852, 853 and 854, operated by Shell (45%) in partnership with BP (23%), Conoco (16%) and Exxon-Mobil (16%).
Figure 22: map of Mars and Ursa wells and platforms. |
|
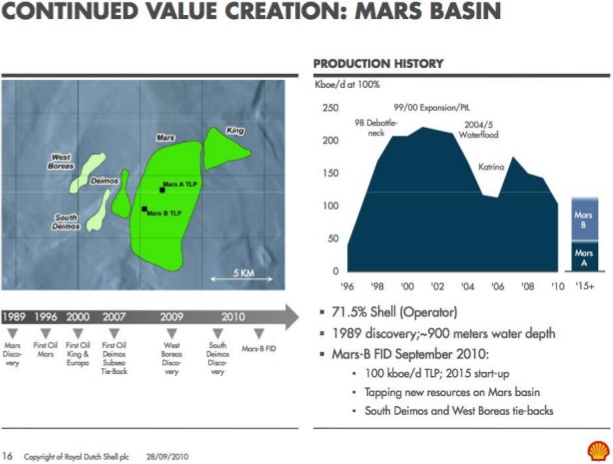
In 2008, Shell has achieved the Ursa/Princess waterflood project. In 2010 Shell announced that the present Mars A platform will be joined in 2015 by a new one: Mars B (called Olympus TLP), because of new close by discoveries: West Boreas & South Deimos. The Mars B development will draw production from eight Mississippi Canyon blocks: 762, 763, 764, 805, 806, 807, 850 and 851.
Figure 23: Mars-B future development for 2015. |

|
Harris et al. in the article “Mars Life Cycle Field Development – Maximizing Recovery from a Deepwater Giant” (AAPG 2011) wrote:
The Mars Field is comprised of a thick sequence of stacked Plio-Miocene turbidite deposits trapped within a salt-flanked basin, with charge access to a prolific source rock. This geologic sweet-spot generated a field comprised of more than 70 individual reservoirs stacked in a 10,000 foot sequence. In-place volume estimates exceed more than 4 billion BOE.
The recent Near Field Exploration discoveries of West Boreas & South Deimos, along with the redevelopment study, yielded a 2010 decision to deploy a second 24 well Tension Leg Platform, “Olympus TLP” at the Mars Field. Addition of new infrastructure, complementing the existing facilities, provides a combined 48 well slots and over 7350K BOEPD processing facilities to optimize recovery from the Mars Field beyond 2050
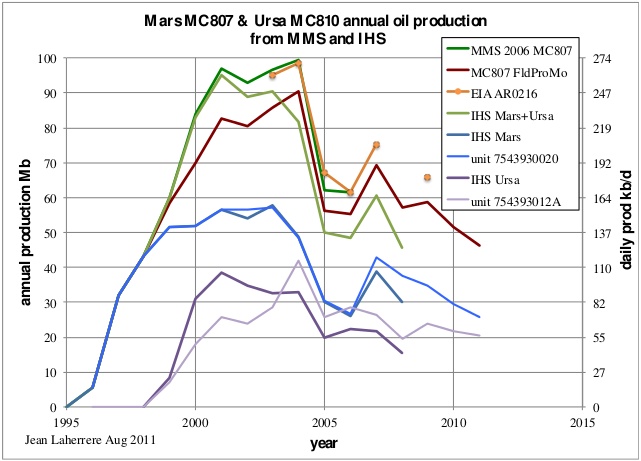
MMS annual reports includes only the combined production, while IHS reports both fields separately. Oil production was disturbed in 2005 by the Katrina hurricane, with production halted for the repairs of a damaged platform. The BOEMRE monthly reports (there are several, per unit or per lease) are slightly different. Mars (MC807) corresponds to unit 7543930020 and Ursa (MC810) to unit 75439012A. The annual oil production from MMS and IHS also differs, though both datasets show a clear decline disturbed by Katrina in 2005. The Mars field is declining faster than Ursa, possibly due to the Princess water flood.
Figure 24: Mars and Ursa annual oil production from different sources. |
|
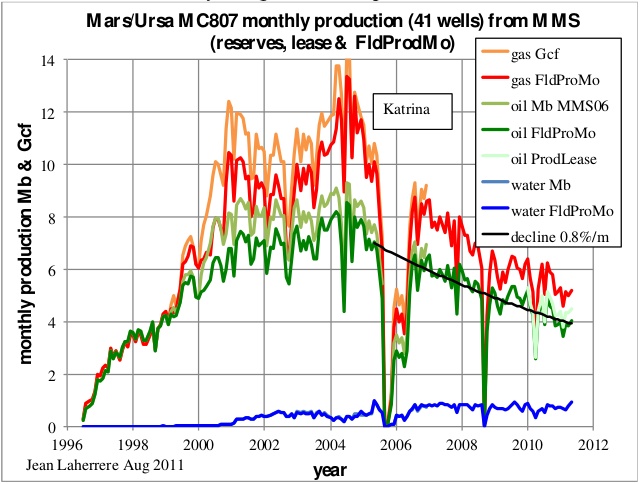
The monthly oil, gas and water production differs also slightly from the different MMS sources. The decline since 2007 is about 0.8 % per month or about 9 % per year, which is less than half the decline at Thunder Horse.
Figure 25: Mars/Ursa MC807 monthly oil, gas & water production from different MMS sources. |
|
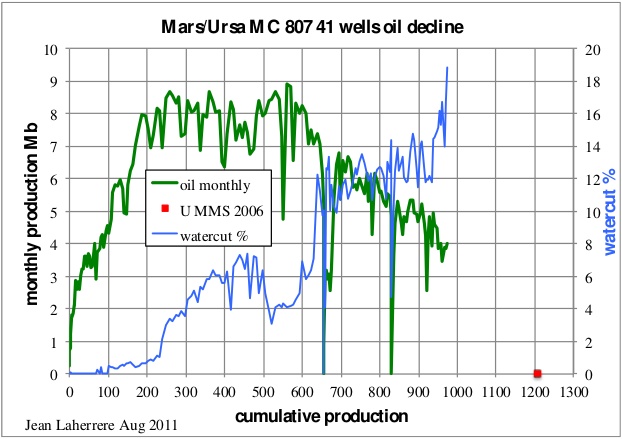
The monthly oil production versus cumulative production with watercut shows a decline in line with the reserves ultimate of 1208 Mb estimated by the MMS in 2006. Shell indicates that the new Mars B will bring secondary recovery (by waterflood as in Ursa) and access to new fields.
Figure 26: Mars/Ursa MC807 oil decline, watercut and ultimate. |
|
Shell (M.Odum 2010) presented the development planning for Mars.
Figure 27: Mars map and planning. |
|
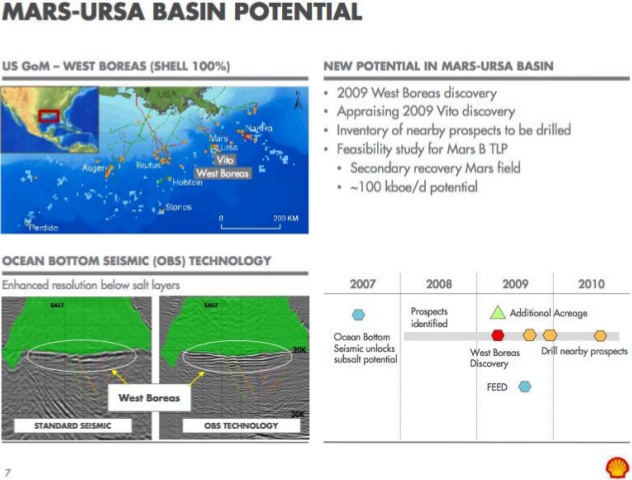
The planned Mars B Olympus platform, starting in 2015, will slow the decline but part of its production will come from new discoveries, West Boreas (2009 on MC 809) and South Deimos (2007 on MC 806). The West Boreas field is trapped below the salt and the seismic profile is not easy to interpret, even with the new technology of ocean bottom recorders (Shell M.Odum Credit Suisse Feb. 2010).
Figure 28: West Boreas seismic profile from Shell |
|
Conclusions to this installment
Regarding Thunder Horse, there is not enough public data from the operator on future drilling to get a reliable extrapolation from the past production. But it is likely that the latest MMS estimates (MMS 2009-064 for 2006 reserves) are optimistic. It will be interesting to see the new estimate by BOEMRE, lacking data for the last two years!
As for the Mars/Ursa complex, the monthly oil production versus cumulative production with watercut shows a decline in line with the reserves ultimate of 1208 Mb estimated by the MMS in 2006. Shell indicates that the new Mars B will bring secondary recovery (by waterflood as in Ursa) and access to new fields.
Following posts in this series shall present graphs on the Atlantis, Mad Dog, and other fields.
Deepwater GOM: Reserves versus Production - Part 1: Thunder Horse & Mars-Ursa
PDF version
71 comments
Deepwater GOM: Reserves versus Production - Part 1: Thunder Horse & Mars-Ursa
PDF version
71 comments
Contact
- Content: editors at theoildrum dot com
- Tech support: support at theoildrum dot com
License

This work is licensed under a Creative Commons Attribution-Share Alike 3.0 United States License.
I find this a bit confusing, with all of the acronyms and multiple lines posted on the same graphs.
Basically, as I understand the post, there are two pieces of Thunder Horse. The production history of the main portion is given by the green line in Figure 11. The production of Thunder Horse North production is represented by the green line on Figure 16. The green line on Figure 18 adds these together. On these graphs, amounts are given in terms of barrels per month, as opposed to barrels per day, which I tend to think in terms of.
Mars/Ursala extends over a longer period. The data most comparable to the Thunder Horse data would seem to be the Green Line in figure 25, which again is monthly production.
EIA data on a monthly basis for the Gulf of Mexico is given by this data. A graph of it is as follows:
Thunder Horse (combined) hit its peak around 2009 amounting to about 7 million barrels a month (230,000 barrels per day). Mars/Ursala hit its peak around 2004-2005, at a peak also of about 7 million barrels a month (230,000 barrels per day). Comparing these amounts to the Gulf of Mexico totals, each of these amounted to something like 15% of the Gulf of Mexico production at their peak.
This is a graph from a guest post from Glenn Morton that I edited, regarding Thunder Horse. I made the graphs for that post.
[my emphasis]
Is there an extra zero in that number or am I just a dunce--I read that as over 7 million barrels oil equivalent per day--WOW
Luke - I think Gail caught it: it's bbls/month and not bbls/day.
maybe ROCK, but I went to the source linked and pulled this from the abstract
30.4375 (average days/month including leap years) times 350K BOEPD comes to 10653.125K Barrels Oil Equivalent per month. (I know I'm being ridiculous with the decimal placement-something the Jean rightly criticizes in this post) Curious where the blockquote in the key post I copied in my first reply came from, since it has a 7 in front of the 350K BOEPD I copied out of the linked abstract.
Aside from that head scatcher I did find the meananderings of the water cut in figure 15 interesting--I was hoping someone like you with real hands on experience with this sort of thing might add a little flesh to that.
Luke - With re: to water cut the chart can be explaoned several ways. But the key factor is oil/water seperation capacity. All platforms have a designed capacity limit. As you know space offshore is limited/expensive. When water cut increases (either as anticipated or at a greater rate) the max is reached. The first fix is simple: reduce production rates of all wells. Or if a few wells are producing much higher w/c's shut them incompletly and increase rates on the better wells. There are down hole chemical treatments used to reduce w/c on an individual wells but they are seldom very effective. Likewise it's typically not possible to expand the infrastructure.
Looking at the chart it's difficult to tell exactly what they've done. But one thing is clear: they either greatly reduced rates of one or more high w/c wells or completely shut them in. That's the most likely way to explain that big drop in water production. Not a good sign for those wells...they are essentially "depleted" whether there's a significant amount of oil left around those wells. "Premature" w/c is the primary reason for lower than anticipated URR espcially from offshore water drive reservoirs. Rarely can that "lost" oil ever be recovered.
BP Thunderhorse has never gotten close to their designed capacity limit.
Thunderhorse Field Factsheet:
http://www.bp.com/liveassets/bp_internet/globalbp/STAGING/global_assets/...
Maximum water production was 53,000 bwpd in Oct. 2010.
Thunder horse has slots for 22 (or maybe 25) wells. So far the maximum number of completions is 13. Figures 11,12,15 and 16 implies a total of 15 wells on production continuously. Completions have gone up and down. Currently (6-2010) there are a total of 11 completions producing.
More likely, in my opinion, development of Thunderhorse is far from complete.
One of the features of Mars is flexibility, I see no reason to believe BP/Exxon didn't build flexibility into Thunderhorse development.
b - A couple of points. All platforms are built with an excess number of slots. More importantly they most likely would have drilled all the wells they planned before they went to the production phase. Drilling wells afterwards is very time consuming and typically requires shutting in all the wells for an exteded period. They may have zones behind casing to produce at a later date when the current producing perfs deplete but I doubt they have future drilling plan.
And you misunderstand my capacity limit. I'm talking oil/water sepeation capacity...not oil production capacity. The platform may have the capacity to produce 300,000 bopd. But if doesn't have the capacity to seperate the water and oil to net more than 200,000 bopd than that's what the platform will produce. The drop to 11 completions producing would support their shutting in wells with very high water cut.
Production history from Thunderhorse main(G14658)doesn't support your theory:
http://www.gomr.boemre.gov/homepg/fastfacts/production/master.asp
I don't have an explanation - I don't work for BP or Exxon. For now, I will go with Laherrere's conclusion:
This post went through various versions (which I was not involved with this time).
Jean LaHerrere writes in French. Luis de Sousa's first language is Portugese, but he speaks French, and worked on the translation into broken English. Other folks (Jon Callahan) helped with the translation into standard English.
It is possible that something got missed in one of the translation processes.
Sorry if I sounded so too nitpicky-I appreciate that lots of work go into these presentations even more than I thought when translation is part of the mix. Just the huge number jumped out at me and comments were slow in coming. I did learn quite a bit from the rest of the thread as it developed.
Here is the critically key question, which I haven't been able to figure out. Over the life of Thunderhorse ,or any other deep water project, what is the approx. cost per barrel of production? When billion $ in divided by production...what is the extra cost per barrel of deep water development?
That will be the key question for the world's future as we shift to deeper sources. Anyone have any light they can shed on this?
Good question! There are a lot of costs that need to be added in--projects that didn't work out have to be paid for too.
I think that at one point there was an EIA report that tried to look at this, based on financial reports. I am not sure where to find the report on the new EIA web site, though. (It may have been discontinued, also.)
Is production from any of these fields accessible? If so it should be a simple division...extra cost of field (ie. 1 billion /expected or actual productiion). While that may exclude some hidden costs (ie. hurricane wrecks a project) it is the most important prediction of where we are going and our entire future that anyone can make.
Anyone can take a guess/approximation on this?
I don't even know how much these deep sea fields produce over time?
Here is something I found from 2008
The International Energy Agency (IEA) -- in its latest
November 2008 world energy outlook -- gave the following
estimates for the all-in costs of producing oil from various
types of hydrocarbons in different parts of the world:
Oilfields Estimated Production
/source Costs ($ 2008)
Mideast/N.Africa oilfields 6 - 28
Other conventional oilfields 6 - 39
CO2 enhanced oil recovery 30 - 80
Deep/ultra-deep-water oilfields 32 - 65
Enhanced oil recovery 32 - 82
Arctic oilfields 32 - 100
Heavy oil/bitumen 32 - 68
Oil shales 52 - 113
Gas to liquids 38 - 113
Coal to liquids 60 - 113
Source: International Energy Agency World Energy Outlook 2008
(Compiled by Martina Fuchs, Christopher Johnson, Karen Norton,
Joe Brock and Barbara Lewis, Editing by James Jukwey)
Shortages could drive prices higher of course but this in current dollars would be the production floor per barrel plus a profit margin (perhaps 20% is my uneducated guess).
wse - Even with all the public available info for US projects it's still difficult. First and for most you can't do the calculation until a field is nearly depleted. You can use the company's reserve estimate and anticipated production rates but now you added a big variable. Consider how Thunder Horse appears to be missing the mark big time.
And then you have to split the analysis into two big parts. The costs to develop each field and the total costs for all DW efforts in the GOM. Individual field: lease bonuses, staff/consultant overhead, th tens of $millions in seismic costs, hundreds of millions in dry hole cost (my last DW well was a $148 million DRY HOLE), expendable discovery wells: not all wells that find commercial reserves are produced. And then there's a question of the time value of money. Mant hundreds of $millions are spent 5+ years before the first bbl of oil is sold.
Now regional costs: more dry holes that lead to no new discoveries, more hundreds of millions in seismic and other overhead costs, tens of $millions of bonuses from leases that won't ever produce a bbl of oil. And lastly the feds take 1/6 of all the revenue off the top.
But you also have to ask what would be the value of the number if you coud estimate it other than curiosity and a measure of how good we are at doing it. Let's say it works out to be a flush: industrywide we produce exactly as much revenue as it cost us. So we stop trying to develop DW GOM reserves? No. Companies drill dry holes all the time and lose money. No one drills a well anticipating a break even deal let alone a loss. Drill enough losers and you go out of business. But no company starts with that plan.
Governments are in increasingly bad financial straights. Oil and gas companies are some of the few local companies making a reasonable amount of money, so they are popular tax target. But raising the taxes may very well make new production non-economic, or cause marginal old wells to be shut in. Taxes are part of the reason oil prices are high. (Saudi Arabia and Russia are very dependent on oil tax money, also.)
Thanks Rockman,I thought it was very difficult.
That actually says something. If I am an oil and gas co. then I need to anticipate a pretty high price before I invest 1/2-$1 billion or why bother when I can just buy assets from existing companies (ie. take over a mid-cap).
I think the conclusion to draw from this posting is that costs are much higher for the new generation THorse-Atlantis deep Miocene fields than for the older Mars-Ursa Upper Miocene fields developed in the 90's, but the recoverable volumes in the new deep Miocene discoveries are also less certain, well costs higher. Despite all the hype, THorse may be the dog and Tahiti and Atlantis may be the jewels. Still and all, Mars-Ursa might still reign as the real DW GOM jewel - the gift that keeps on giving. OTOH, Mars B will probably cost 3X what Mars A cost.
Murphy Exploration and Production also has a platform on N. Thunderhorse, Lease No. G21718 on MC 819. That lease has produced about 17e6 barrels since 6-2009. Water/Oil ratio is about 0.4 for 6-2011.
Murphy has a non-productive lease, G27312, on N. Thunderhorse, MC 734.
Deepwater Natural Gas and Oil Discoveries and Fields
http://www.gomr.boemre.gov/homepg/offshore/deepwatr/deeptbl2.html
Production Data Online Query
http://www.gomr.boemre.gov/homepg/fastfacts/production/master.asp
Figure 1 is kind of a mess but it looks like the top-line URR is 2200 GB.
The oil company Total S.A. also has an accounting of yearly discoveries. I overlaid their data with Laherrere's data in the figure below:
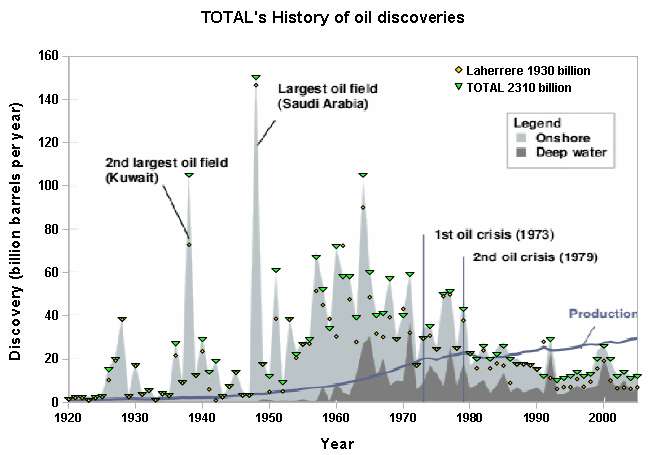
Total must do a bit of a different backdating because their data is consistently above Laherrere's for the majority of the years. As of about 2005, their cumulative is at 2310 GB while Laherrere is at 1930 GB.
This leads to the following asymptotic graph for cumulative oil according to the Dispersive Discovery model. In this case I assigned a URR of 2800 GB to the model, with a model value of 2450 GB as of 2005. In other words, the Total discovery data may hit an asymptote of 2800 GB, which may be a bit generous:

This is really for comparative purposes as I next plotted what Laherrere's discovery data looks like against the same model.
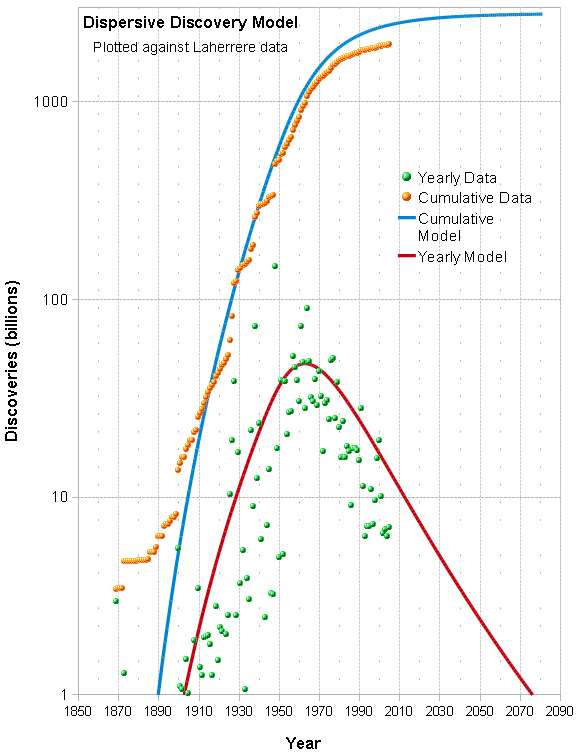
You can see that Laherrere's data likely won't hit that asymptote.
Discovery data for crude oil is hard to come by. Perhaps Laherrere is using 2P probabilities and Total is applying possible reserve growth so that it is >2P? Or perhaps Total is using barrels of oil equivalent (BOE) to inflate the numbers (which Shell oil does)? In the greater scheme of things, does this really matter?
The following chart is the Shock Model applied to the Total discovery data, whereby I tried to follow the historical crude oil (not All Liquids) production rates by varying the extraction rate until the year 2000, then I kept the extraction rate constant at about 3.1% of reserves. This is lower than the currently accepted 4% to 5% extraction rate from reserves.
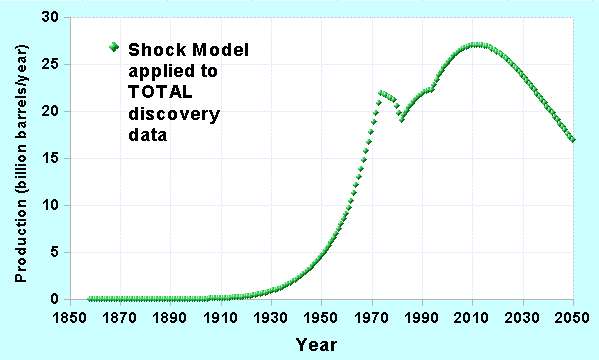
If Total does use BOE maybe this should actually fit an All Liquids curve, in which case the extraction rates would need to get increased to match the higher levels of All Liquids production.
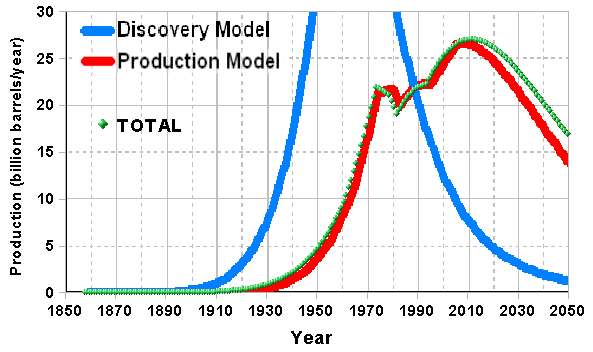
Bottom line is that the peak plateau might extend for a couple of years and we will have a fatter decline tail if we believe the Total numbers. If it is an All Liquids discovery model, then it is a wash. As if everyone didn't know this by now, peak oil is not about the cumulative, it is about the extractive flow rates, and this is a good example of that.
In general, the URR is incrementally getting pushed up with time. Laherrere had used 2000 GB for a crude oil URR for some time (see this curve from 2005) and now likely because of the deep water oil it is at 2200 GB.
As for going through the trouble of evaluating the Gulf Of Mexico data, that is just noise on the overall curve IMO. It's getting to the point that we have enough historical data that global predictions for crude oil are really starting to stabilize. And the Dispersive Discovery model will anticipate any future discoveries. The longer we wait, the closer all the estimates will start to converge, and any new data will have little effect on the projected asymptotic cumulative.
Thanks for putting that up. First time I have seen your Shock Model applied to total discovery data. For all practical purposes that puts us on the top of the hill at this moment with production in 2030 about equal to that of the mid 1990s. Seems there could just be enough time to give us all a chance to get our collective heads out our butts...or maybe not. I found this 'peak oil is a liberal hoax' article linked in a reply to Euan's 'Peak Oil: Now or Later' post. I didn't have the stomach to more than skim it.
This is really all about disambiguating information from different sources.
The data from Total is from this source http://www.aspo9.be/assets/ASPO9_Wed_27_April_Mauriaud.pdf,
which was originally analyzed here http://www.theoildrum.com/node/8001.
I don't know if they got the data independently because the original plot on slide 3 of the presentation has an attribution to IHS Energy 2006, which is Daniel Yergin's outfit. The forensic trail stops there because CERA and IHS are known to manipulate the data and who knows how much money I would have to pay IHS/CERA/Yergin to get it raw. What I did was painstakingly transcribe each data point on the curve so that I could estimate a running URR. I then used the Dispersive Discovery model to project an asymptotic URR. Asymptotic defines a future limiting value for those that don't understand what that word means.
So that is how you get at IHS internal data: You find one of their clients, in this case Total S.A., who pay big money for it, and then they probably violated some nondisclosure agreement and publish it as a public document. If you happen to run across this particular data, then you essentially have the IHS data free of charge.
But the big contradiction is that on p. 17 of that presentation, Total shows a very broad peak for oil production that extends to 2030 with a value at least 95 million barrels per day. It is hard to read exactly, and 2030 is where the plot ends.
The upshot is that the discovery data that Total published can not possibly meet the production projections 20 years out unless they add in all sorts of extra liquids in addition to the crude oil base.
This is my own previous rather generous URR which approaches the Total value as it is halfway between Laherrere's 2200 GB and a Total S.A. URR of 2700 GB.
The differences are pretty subtle even for changes of 100 GB as the peak plateau only shifts slightly with most of the excess going into the tail.
The basic computations for the dispersive discovery model and the oil shock model are very straightforward. What is not straightforward is keeping track of different versions of the historical data and making sense of that. But uncertainty is what the industry wants to propagate -- as long as slop exits in the historical data, we end up chasing a moving target.
WHB
always like your posts although you always push my maths ability to the breaking point and some of the stuff I don't understand . This link is off topic, and I hope it does not get terminated but I just can't get my head round it a reaction less motor using Microwaves energy. Something for you to puzzle over for a few hours.The British Government has pumped money into it, enjoy.
http://emdrive.com/
It may be the same technology as a Rail Gun. http://en.wikipedia.org/wiki/Railgun
WHB certainly not the railgun
I give up. Crookes radiometer?
http://upload.wikimedia.org/wikipedia/commons/thumb/1/1d/Crookes_radiome...
WHT There might be something in that, there is certainly radiation pressure in the equation from somewhere, but a Crookes radiometer is a kids toy. The Bloody thing seems to work, as far as I can see it is nothing more than a sophisticated microwave oven switch it on and it moves
http://emdrive.com/DMtest188.wmv
Call me stupid but I was always brought up to think that you could only get movement if you had mass ejection from a rocket motor before you could move in the opposite direction but the mass contained in microwaves from this Microwave rocket motor would be so small as to be negligible, which begs the question why the hell is it moving? The British Government has put money into it and Boeing are buggering around with so are the Chinese, so there must be something in it. As you are the resident maths wiz at the oil drum I thought that you might like to scratch you head a little and ponder the problem because it is way over my head.
There is little friction in space so once you get the craft moving and no longer deal with gravity, it dosn't take a lot of energy to build up speed. But then it would take a lot of time to correct course as well. There must be an order-of-magnitude estimate to figure this out.
Weird. There appears to be no accounting in their theory link for the forces acting on the tapered section itself. So if the closed vessel ("waveguide") were simply pressurized with compressed air instead of electromagnetic energy, one end plate would still be larger than the other, and it should still take off, and rather more quickly, since one could almost instantly attain more than 330 millinewtons even with a bicycle pump. But, again, that fails to consider the pesky tapered section, consistent with the very first diagram in their PDF. So I don't suppose this device will be, say, bringing methane or anything else back from Titan anytime soon.
By analogy to the oil-industry GOSP, I propose that it might be a Money Separation Plant. Many ways to separate money from investors have already been invented; surely there will always be more. And governments, when they play at investing, are on the whole famously bad at picking winners.
round and round we go, where we stop nobody knows....
Its pretty obvious why this happens. None of the analysts is actually working with a model that can project future trends. They stop with current data and have nothing that can generate a fat-tail or predict what kind of reserve growth there may be. For example, Hubbert Linearization is a thin-tailed projection. These kinds of projections always get short-sheeted because without a model of the diminishing returns that can support a fatter statistical tail, the numbers will always be pessimistic.
And so when the new numbers come in, the predictions always fall short. The only good thing is that these tend to converge over time, but then it is too late, and so what was the purpose of doing the projection in the first place? The original heuristics by Hubbert and others had some unintended consequences. They were intuitively correct, but they almost always fall short. That is why I came up with the Dispersive Discovery model, in that it gives extrapolations that match real mechanisms for a diminishing return search.
It is. I suppose that generates the question, how many more times will it happen?
It will keep on happening, but the difference between the predicted and the actual will continue to get smaller. That's the path a prediction takes before it becomes part of the historical record.
Great, but some clarification:
In the text in the main article "deep water" is defined as "below 500 meters". In your first graph there are two fields "onshore" and "deep water". So where are the "shallow water" (1-499 meter)? Is it included in the deep water or the onshore? I'm not sure deep water exploration was that big in the 1960ies.
the first cycle corresponds to surface exploration (1900-1950); the second cycle to seismic exploration starting in 1930 and a third cycle corresponding to deepwater starting in 1990.
Any thoughts about shale oil (aka tight oil - e.g., Bakken)?
The Bakken resource has been estimated at 400Gb. The reserve estimates have risen from IIRC 100Mb to 4Gb to currently 11Gb.
We're seeing things like the following:
"Amy Myers Jaffe of Rice University says in the next decade, new oil in the US, Canada and South America could change the center of gravity of the entire global energy supply.
"Some are now saying, in five or 10 years' time, we're a major oil-producing region, where our production is going up," she says.
The US, Jaffe says, could have 2 trillion barrels of oil waiting to be drilled. South America could hold another 2 trillion. And Canada? 2.4 trillion. That's compared to just 1.2 trillion in the Middle East and north Africa."
http://www.npr.org/2011/09/25/140784004/new-boom-reshapes-oil-world-rock...
Any idea what she's basing that on?
I wouldn't say, "Just waiting to be drillled." Maybe, "Just waiting be drilled, fracked, and then dribble out, hopefully over a long period." There would be a squirt initially, but then a long dribble.
But production would still be huge, if there's really 6.4Tb of oil that can be produced. Heck, the latest reserve estimate for the Bakken is about 67x the current annual production: at that rate, 6.4Tb in reserves in the Americas would allow production of 262Mb per day....
So, again - anyone have any idea where these estimates are coming from??
Well see how the the effort in the Bakken plays over time. Few at this time are talking of production exceeding a million barrels a day-If the other fractrued shale oil plays (I like ROCK's terminology, it brings downright visual clarity) proceed in a similar fashion and are all brought on line before Bakken starts to play out (we need twenty more years production to see just what effort maintaining output will take) as much as 16 million barrels a day might be coming from that kind of rock at once (400MB is 1/16 of 6.4TB)
--but it seems more likely some fractured shale oil plays will fade before the bulk of world's store of such are brought on line. If 8-10 MBPD are produced from those sources for a long time it will indeed be significant but still will only lengthen the fat tail of the production curve some. My 'analysis' is no doubt simplistic but it does put those big numbers more or less in perspective.
Well, is the 400Gb number comparable to the 6.4Tb number?
The largest estimate of reserves for the Bakken is about 11Gb. If we count the 400Gb of resources, the US has more oil than Saudi Arabia. That seems unlikely on the basis of the Bakken alone, but there are indeed a number of similar plays in addition. Does Rembrandt need to add a large 4th curve?
So...again, does anyone know what Jaffe is talking about?
FOR ALL
I hate to act like that mean school teacher making someone stand in the corner but I'll once again explain why I couldn't really care less about how much producible reserves are left out there in the whole wide world. PO has nothing to do with the volume of oil that might be produced under whatever circumtances one can imagine. PO is about oil flow rate. All well and good for someone to say XXX billion bbls of ol will be produced from the Booger Booger reservoir. Now show the future production curve we should expect from this trend. Then we'll have something to discuss. Honestly: I couldn't care less if someone could prove to the world there are 200 billion bbls that will be produced from the Bakken. Folks want to debate that issue have at it but it has no bearing on PO. SHOW ME A CREDIBLE FUTURE PRODUCTION CURVE. Then we'll have a basis for discussing its impact on PO. Until someone does that the volume of oil recoverable from the Bakken et al are not relevant to the future of PO IMHO.
Sure, you can narrate the story until the cows come home, but at some point someone has to put the pen to paper and do some calculations.
This is a curve I did today that takes the Total S.A. discovery data (I believe Laherrere's former employer) and extrapolates the future discoveries with a dispersive discovery model. The final discovery URR is 2700 billion barrels, which is quite a bit higher than the one Laherrere plots. This is higher because I am making the assumption that Total S.A. is including backdated NGPL and other liquids along with the crude oil. Which means I had to fit against the production data that also used these liquids.
To model the perturbations in production levels, which is necessary to accumulate the reserves properly, I used the Oil Shock Model. In the inset, you can see the changes in extraction rate that occurred over the years. The extraction rate is essentially the same as the Production/Reserve ratio. Notice that the extraction rate was steady until the 1960's at which it ramped up. It started to level off and drop down during the 1970's oil crisis and didn't really start to rise again until the 1990's. I am extrapolating the extraction rate from today to match the peak extraction rate of the 1960's by the year 2050.
This is largely a descriptive working model, which essentially reflects the data that Total S.A. is providing and then reflecting that in terms of what we are seeing in the production numbers. The current plateau could be extended if we try to extract even faster (as in Rockman's words "PO is about oil flow rate") or we can start including other types of fuels to the mix. This latter will happen if the EIA and IEA add biofuels and other sources to the yearly production.
The bottom-line is that it is hard to come up with any scenarios, based on the data that Total and IHS supplies , that can extend this plateau the way that Total suggests it will, peak to 2020. That is what is maddening about this whole business and you wonder why drivel such as what Yergin continues to pump out gets published.
Rockman, WHT,
Thanks for the input, but that's not what I asked.
I'm asking: what specifically is Jaffe talking about?
I don't know, ask James Baker or whoever hired her. She obviously doesn't teach or do anything technical, she just writes policy papers fitting the agenda for whoever her boss is. AFAICT she is a lobbyist for industry and works at a policy think tank within Rice so you have to take what she says with a grain of salt. All the numbers are manipulable and unless we understand the stochastic flow rates and distributions and do a full probability and statistical mathematical treatment, the industry will send their people out putting their own spin on the situation and continue to deceive us.
An example:
As Rockman says, fracturing has been known for decades! It’s just that the average energy price has increased enough that the cost of fracturing is now worth it.
I hang out on Climate Etc where I ran into a geophysicist working for the oil industry trying to sell Bakken shale oil as a long-term cure. This is how I responded to his points.
How long will that rate last? According to the North Dakota Dept. Mineral Resources, https://www.dmr.nd.gov/oilgas/presentations/ActivityandProjectionsWilliston2010-08-03.pdf, slide 17, a typical rig will drop from 1000 barrels per day down to 200 barrels per day in 2 years. That is the nature of these reservoirs, in comparison to a longer-lived traditional reservoir.
OK, it will for one (1) year.
The USA consumes like 20,000,000 barrels per day. So we need 20,000 of these that might average 1000 barrels per day drilled to match our current consumption. And then 20,000 new ones will have to be drilled again every 2 years, and so on, ad nauseum.
But, the actual plan is to create only 20,000 new wells in the next 10-20 years, so at best it will cover only 5-10% of our oil consumption at any one time, and 2000 new ones will have to be drilled every two years to meet demand. That is not considering how much liquid and other energy will be required during the extraction.
We do it because you people in the industry won’t. The oil business can’t stand to see the truth spoken. They just keep on deceiving us with marketing blurbs.
I then told him based on his deception in revealing the actual oil outlook, how can I even begin to listen to what he says about climate change.
Well, thanks for the thoughts. It would be nice to know where she's starting from....
As to your specific thoughts, here are a few of mine:
fracturing has been known for decades!
That seems a bit...superficial. No one anticipated what's happening with shale gas, or what we might call "tight oil". If anyone did, they could have gotten rich shorting gas futures.
we need 20,000 of these that might average 1000 barrels per day drilled to match our current consumption.
The US might need another 5M bpd, not another 20. Conventional production isn't going away completely, and consumption is falling.
the actual plan is to create only 20,000 new wells in the next 10-20 years
Where does that come from? That appears quite low. Of course high decline rates increase costs, but...do you remember the TOD article a couple of years ago which confidently asserted that high decline rates would limit Bakken production to a peak of less than 200k bpd, with a fast overall decline thereafter? We're now at 450k, with reasonable forecasts of 700k.
“you people in the oil industry”
That phrase simply suggests a "us vs them" mind set, which generally causes very simplistic thinking. I strongly suspect that's what he really means.
It's not superficial - hydraulic fracturing is not new technology. The oil industry has been fracturing wells since the 1950's. The only thing which has changed is the prices, which now allow companies to spend much more money to make wells produce.
When the Pembina oil field, the largest oil field in Canada, was discovered in 1953 the oil companies had to fracture the discovery well to get it to produce, and just about all the other wells, too. It was economic to fracture all the wells at that time because of the sheer volume of oil a vertical well could produce, because of the fact the formation was just so thick and consistent.
Today, with the much better seismic and horizontal drilling techniques, they can target their fracturing much more accurately. The Cardium formation, which is the one the Pembina field produces from, is currently the "hot new" conventional oil play in Alberta because at current prices companies can afford to fracture the living bejeezus out of oil wells even in areas where the formation is thin and inconsistent.
Similarly, companies I worked for were fracturing gas wells decades ago, too. It's been standard operating procedure for long before the mainstream media heard about it.
And who owns more than 1/2 the Pembina Cardium play? Penn West Petroleum the company I recommended
and my number one holding. They bought it at cheap prices and haven't even booked most of their reserves.
Today, with the much better seismic and horizontal drilling techniques
So you do feel that technology and/or techniques have improved??
So, really we're talking about a combination of the effect of price incentives and tech improvement, right? Care to hazard an estimate of the rough % contributions of price vs improved tech?
That explains it then: She de-v'eye-an'd it, just like the supreme court de-v'eye-an'd that bush would be president, 5 to 4.
Slide #17 in the ND Dept. of Mineral Resources presentation that WHT linked to shows a pretty wicked decline curve on the Bakken wells - 33% from the initial production rate the first year, 75% the second year from IP. After that, it starts to level off, but after 10 years it is only producing about 7% of what initially did. A well that starts off at 1000 bpd will only be producing about 70 bpd after a decade.
This has implications for future production in the Bakken. At some, point they won't be able to drill wells fast enough to maintain production, and that point will come much faster than the pundits seem to believe.
Slide #16, I believe, shows what the ND DMR thinks that means. If the oil price is $120/bbl, they think ND production will peak at about 350,000 bpd, and if it is $200/bbl it will peak at 450,000 bpd. At least, that's what I think it is trying to say.
This appears to be what ND thinks the future holds, and their experts are working with the raw data, running decline analysis and economic models on them. Usually they are good at this kind of thing because income from the oil is going to help pay their salaries.
350-450,000 bpd is pretty good for ND, but it's no Saudi Arabia of production. Saudi Arabia was producing around 10 million bpd at its peak.
That curve (#17) is optimistic. That sort of decline may apply to a single widely spaced well.
If Parshall Field is any guide, wells producing in a competitive reservoir will have a much steeper decline than implied by the NDDNR.
Parshall Field is fully developed with a few locations to be drilled around the edge. EOG developed Parshall mostly on 1 well per section. EOG tried some infill drilling early in the development and apparently decided more wells were not needed.
Since early 2010, Parshall has shown about a 30% decline, even with the addition of ~40 new wells. I'm not making this up:
Month---oil----wells
Jul-11 843130 209
Jun-11 838090 211
May-11 909915 209
Apr-11 881032 211
Mar-11 991687 210
Feb-11 918401 209
Jan-11 1026912 209
Dec-10 1035831 206
Nov-10 1036619 204
Oct-10 1149233 202
Sep-10 1225116 195
Aug-10 1277485 195
Jul-10 1344916 195
Jun-10 1343254 188
May-10 1445796 179
Apr-10 1382433 172
Mar-10 1451893 169
Feb-10 1262549 168
Jan-10 1337524 168
Parshall has been producing since 2006.
If the oil price is $120/bbl, they think ND production will peak at about 350,000 bpd, and if it is $200/bbl it will peak at 450,000 bpd.
uhhmm...hasn't ND production already reached 425k bpd, with absolutely no sign of a peak in sight?
https://www.dmr.nd.gov/oilgas/stats/historicaloilprodstats.pdf
And prices for ND oil are around $90....
https://www.dmr.nd.gov/oilgas/directorscut/directorscut-2011-09-12.pdf
Hi WHT,
I have played around with your models a little and it seems to me that a scenario that could extend the plateau to 2020 could be devised using the oil shock model. The extraction rate after 2011 might increase non-linearly from 2011 to 2020 and then remain constant. Maybe it would do something like the following:
Extraction rate/Year
0.040/2011
0.041/2013
0.043/2015
0.047/2017
0.053/2019
0.053/2050
These values are guesses, but a scenario could be created which would give a longer plateau along with a steeper decline when the end of the plateau is reached. This may look very different from the scenario that Total proposes, I am only suggesting that future extraction rates are unknown so the shape of the curve beyond the present has many possibilities so that an envelope of curves might be shown to make this clearer.
DCoyne
Yet they also have plateau well above what we have now. So the extraction rate inncrease has to both get it up there and then keep it there.
I do think you have the essence though, which is great to hear.
Nick – I’ll modify that tale a bit. It’s correct but can be better detailed IMHO. 1st (1900-1930): surface and gravity geophysics; 2nd (1930-1950): subsurface with some geophysical help…drilling wells based on previous drilled wells; 3rd (1950-present) strong seismic geophysical methods. The 3rd phase is what really opened up all the offshore trends…both shallow and Deep Water. One could split the 3rd based on engineering advances but even drilling in 5’ of water over 60 years ago took new engineering abilities just like getting out to 5,000’ of water. But it was all driven by seismic technology.
I don’t consider any of the fractured shale plays a “new phase”. And to keep the nomenclature clear none of those are “oil shales”. I’ll reserve that name for the shales containing kerogen that no one has figured out how to make oil from commercially yet. Thus the Eagle Ford, etc are fractured shale formations that produce oil/NG…not “oil shales”. Sounds picky, I know. But that confusion remains rampant with the MSM.
The fractured shale plays are anything but new. The oldest commercial NG trend in the USA is the New Albany Shale in the NE. They were using NAS NG to run street lights in Louisville, KY in 1900. The biggest drilling play in the country in the early 80’s was the Austin Chalk (a fractured carbonate shale) in Texas. And it’s first boom was done with vertical wells…not horizontal. I made my first Eagle Ford Shale completion over 30 years ago. I don’t have the fact but I would be willing to bet someone was producing EF oil for the first time at least 50 years ago. Same thing with the oil sands. I’m sure some Canadian fur trapper was lighting his cabin with that oil 150 years ago.
Horizontal bore holes and massive fracs have been a big help but they are not the reason we’ve been able to add these plays to our new reserve tally. If oil were selling for $30/bbl very little if any of these fracture shale reservoirs would be developed. I feel it’s critical for folks to understand that it isn’t new technology (seismic, horizontal drilling, Deep Water engineering) that’s allowed these gains. But the huge DW oil volumes didn’t need quit the same high oil prices. It’s the increase in oil price that has caused the boom. A secondary cause is the fact that the oil patch, and in particular public oils, doesn’t have enough conventional prospects to drill. They either play the shale reservoirs or shut their doors.
And that should have strong implication with respect to folks who offer new tech or future undiscovered trends as a way to offset PO. We are where we are today because of high prices. Over 30 years ago when I was a pup at Mobil Oil we clearly saw the Deep Water potential on our GOM seismic. But at that time “Deep Water” was below 600’…and out of our reach. But we knew it was there. Just had to wait for the engineers to catch up with us. Every international oil company knows where every potential DW trend is and they’ve shot them all with seismic. It’s just a matter of time before all have been adequately tested. The polar regions will be the last to be fully evaluated for obvious reasons.
hmm. So, your feeling is that the old "raise the price, and the reserves will appear" concept is essentially correct?
Would the USGS have assessed the Bakken at 11Gb in reserves 20 years ago, if they had assumed $100 oil?
Now, what about the following claim?
"The US, Jaffe says, could have 2 trillion barrels of oil waiting to be drilled. South America could hold another 2 trillion. And Canada? 2.4 trillion. That's compared to just 1.2 trillion in the Middle East and north Africa."
Nick – "...your feeling is that the old "raise the price, and the reserves will appear" concept is essentially correct?". No...they won't just appear...they appeared decades ago. Only just us geologist nerds knew about them.
Probably not the USGS but any geologist who understood the Bakken could have come up with an estimate of IN PLACE RESERVES. I emphasized that term for a reason: we’re getting a little sloppy with terminology. The term “reserve” is meaningless. Does it refer to in place, technically recoverable, potentially recoverable, economically recoverable (if so at what price/cost assumptions). And we won’t touch “resource” right now. The in place reserves in all these fractured shale reservoirs have been known for many decades. There have been unconventional oil reserves known centuries. Same for the Canadian oil sands. An estimate of their in place volume could have been made 100 years ago. Maybe not very accurately but it could have been done if someone had a reason to do so.
That was the point I’m trying to make. None of these plays are new. With current technology we can make a more accurate estimate of in place reserves. We can make a fairly good estimate of drilling costs if we assume exactly how we would drill the wells. Technically recoverable (i.e. regardless of costs) and economically recoverable reserves can be estimated but that’s a good bit more difficult. Drilling two wells the same way at the same cost in the same play just miles apart could have widely different flow rates and URR. Until a very significant number of wells are drilled in a trend we can’t really characterize this aspect of any trend.
As far as X trillions of bbls "of oil waiting to be drilled" I have no problem with the statement. It’s just as true as saying there are X trillions of ounces of gold just waiting to be recovered from the world’s oceans. All it will take is a high enough gold price. I can point to a billion bbls of proven oil within 50 miles of where I’m sitting right now that are ”just waiting to be drilled”. Honestly. It will just take much higher oil prices. But they are just sitting there waiting. And probably will be for a good while.
The term has been misused to the point of being meaningless in popular usage, including here on TOD. The term 'reserve' has a specific meaning: Remaning oil and gas that can be recovered economically with current prices and operating conditions.
That's certainly useful information, but you seem to be speculating that Jaffe is talking about in place "resources". It would be nice to nail down more specifically what she's talking about, and get beyond guessing.
Again, she says:
"The US, Jaffe says, could have 2 trillion barrels of oil waiting to be drilled. South America could hold another 2 trillion. And Canada? 2.4 trillion. That's compared to just 1.2 trillion in the Middle East and north Africa."
Exactly what is Jaffe referring to, and what are her sources of information?
Jaffe holds a B.A. degree in Near Eastern Studies and Arabic from Princeton University. I don't see anything resembling an M.S. in Petroleum Engineering or a Ph.D. in Petroleum Geology in her resume. I don't really think she has the creds to talk knowledgeably about it.
Anyhow, based on having coffee with guys who do have M.S. degrees in petroleum engineering and Ph.D's in geology, I would say she is taking about what are laughingly described as "oil shales" (i.e. kerogen marlestones) of the US, notably the Green River formation; the bituminous sands of Canada, notably the Athabasca oil sands; and the extra-heavy oil deposits of Venezuela, notably the Orinoco oil sands.
Certainly those deposits are there, but what she is talking about is oil-in-place volumes, not recoverable oil volumes. Oil isn't much use if you can't get it out of the ground.
Aside from that, the "oil shales" of the US contain kerogen, not oil, and the OIP (or KIP or BIP) numbers are inflated to boot. The only way you would get to 2.4 trillion barrels for Canadian oil sands would be to add in the Carbonate Trend associated with it, which, which although it contains bitumen like the oil sands, is actually carbonate rock rather than sand, which makes extracting the bitumen much more difficult.
She claims to be talking about new oil.
"Amy Myers Jaffe of Rice University says in the next decade, new oil in the US, Canada and South America could change the center of gravity of the entire global energy supply.
"Some are now saying, in five or 10 years' time, we're a major oil-producing region, where our production is going up," she says.
The US, Jaffe says, could have 2 trillion barrels of oil waiting to be drilled. South America could hold another 2 trillion. And Canada? 2.4 trillion. That's compared to just 1.2 trillion in the Middle East and north Africa.
Jaffe says those new oil reserves, combined with growing turmoil in the Middle East, will "absolutely propel more and more investment into the energy resources in the Americas."
http://www.npr.org/2011/09/25/140784004/new-boom-reshapes-oil-world-rock...
The OIP/"resource" in the Bakken has been estimated at 400Gb, with tech/economic reserves of 11Gb. What might the other "fractured oil" plays add up to? Seen any sources??
Nick - I'm not sure if we should knock her credibility for this little slip: "Some are now saying, in five or 10 years' time, we're a major oil-producing region..." But it seems Ms.Jaffee is unaware that the US is currently one of the 3 largest producing regions on the planet. Granted many of our Joe6Packs miss that point. But they don't put themselves out there as "experts" either.
But to her credit I fully agree: in the near future the USA will be a major oil producing region. Just as we are today.
Nick, you constantly say "seen any sources' and then quote numbers from a lecture circuiteer like Jaffe--thats one heck of a poor 'source' to be working from. 'New oil' is an interesting term--my forest floor carpet of birch leaves looks to generate new oil (run water on them and there is a sheen) after they have mouldered a year or few. Last I heard we were drilling for oil that was millions of years old ?- ) Next thing you'll be bringing abiotic oil back into the discussion.
You questioned if the 400gB of the Bakken and the 6.4TB mentioned by Jaffe were comparable type numbers. Awful hard to say but we do know that trillions or barrels of "new oil" don't just appear-except maybe on radio talk show host scripts or maybe on the lecture circuit.
Here is a picture of what one company's (Brigham) fractured shale oil production looks like--its all about the cummulative flow. The effort is huge and being undertaken where there already was a mature rail and road transport system linked to manufacturings centers and port, not in a third world frontier area. The steep slopes at the top of this chart merely indicate how fast the average earlier drilled wells production has declined and this is only after three years.
you constantly say "seen any sources' and then quote numbers from a lecture circuiteer like Jaffe--thats one heck of a poor 'source' to be working from.
I'm not suggesting she's a source - I'm curious what she's talking about. I'm wondering if anyone knows anything specific, as opposed to guessing.
I greatly appreciate your and other efforts at guessing - I'd just like to go further. It appears that someone has made an effort to inventory and add up all of the "fractured oil" plays - I'd like to know who?
Yes Bakken is producing more than one poster here said it would-but the numbers I threw out in my little summary were fairly generous.
Yes, they were. If fractured oil" in the Americas produced that much, that would make a big difference - plausibly enough to create a 20 year plateau, certainly enough to make a dramatic difference for national economies. So, it would be nice to nail this down. I'm not debating Peak Oil here, I'm trying to get info.
You then questioned if the 400gB of the Bakken and the 6.4TB mentioned by Jaffe were comparable type numbers. It certainly appears the handful of oil guys commenting here today feel they are. Trillions or barrels of "new oil" don't just appear-except maybe on radio talk show host scripts.
Yes, and I agree that's likely. OTOH, Rockman talked about kerogen, tar sands and heavy oil. I'd like to get more specific info.
The steep slopes at the top of this chart merely indicate how fast the average earlier drilled wells production has declined and this is only after three years.
1) I think we're all agreed that "fractured oil" has steep decline rates.
2) Those steep slopes at the top of the chart are misleading: the chart adds all of the curves - if you add enough declining curves, the total will show a sharp decline for the topmost elements.
So, again - does anyone know what Jaffe is talking about??
If fractured oil" in the Americas produced that much, that would make a big difference - plausibly enough to create a 20 year plateau
??I was only suggesting a sustained Bakken production maybe reaching 1 million barrels a day-RMG mentions above that very credible sources are only predicting it to reach half that at best. I'm guessing you mean it will help maintain a plateau not create one on its own. [You might have noticed that on second thought I pulled much of the paragraph to which you replied-I wouldn't have posted my initial reply so carelessly but was I kind of watching something dear to your heart-a comeback by Detroit--well not exactly--this one was by the Lions and not the Chevy Volt ]
2) Those steep slopes at the top of the chart are misleading: the chart adds all of the curves - if you add enough declining curves, the total will show a sharp decline for the topmost elements.
I'd say those steep slopes were misleading if we were looking at ten or twenty years worth of wells. In this case its basically three years worth--the graphic if far more enlightening than it is misleading.
So, again - does anyone know what Jaffe is talking about??
Well she is talking about 'new oil' like you said. We here talk about old oil.?- )
Seriously, though it would be nice to see a workup of potential fractured shale oil production world wide--I'm guessing the numbers she quoted were from the most cursory attempt at generating such.
One outfit is talking about producing that stuff from the tight source rock on the North Slope--lots of hyped talk last year, maybe a well or two this winter will actually be sunk to take a look at it. To give you an idea of how superficial estimated fractured shale oil numbers might be at this juncture:
that was part of what Paul L. Decker, Alaska Department of Natural Resources, Division of Oil and Gas, was going to cover at a luncheon last month.
I was quoting a slide from the North Dakota Department of Mineral Resources when I mentioned a peak of production at 450,000 bpd assuming the price goes to $200/bbl. This may or may not be accurate, but it sounded more convincing than the usual media pundits picking numbers out of a hat. The Bakken play is very sensitive to economics, so the rate of future production of oil very much depends on the future price of oil.
The ND DMR has the raw data from all the wells in North Dakota, so they could do a pretty accurate estimate if they really wanted to. I used to design software for oil companies to do this kind of thing, so I know it's possible to be quite accurate about it if you have enough data and enough time. I don't have the data and I don't have enough time so I just have to look for a source that seems more reliable than most.
Looking at a graph with an exponential curve going up and assuming it will go up forever is a very bad technique for estimating future production, but it is one frequently used by people who are going to lose a fortune in the markets at some point in the future.
It will be interesting to see how it progresses. Looking at the figures Nick linked some noticeable trends jump out at my untrained eye. Not the least of those was that per well daily production hovered between 24 and 31 barrels per day with only a few odd outlier months between 1990 and 2005 when it appears to have embarked on more or less steady increase through late 2010 and is now hovering in the 67-70bpd range . At the same time as the per well production jumped the number of wells producing has increased from around 3200 (a level that remained more or less static from 2000-2005) to 5500 in July. One would have to overlay the total wells drilled in these time frames to make more sense out of it--but those numbers don't show average well production declining of late.
[edit add in]
Of course a big increase in drilling bringing more of those fast declining wells on at once would show that increase in average well production. If the number of new wells drilled a year becomes constant then we should immediately start to see a drop in the daily BBLS per well number. Only working more and more rigs can hold the per well average production constant. Increase the rig count exponentially you might even get the daily BBLS/well average to rise higher--Yahoo!
Well its just a tad more complex than that--we need to know how many miles of oil producing horizontal pipe are going into each of the new wells-longer runs can get you more oil per well--up to some physical limit--but don't mention that limit to an economist, it will ball up his whole model
?- )
[end edit]
Well this has been a long birdwalk from the deep water GOM. One thing near certain--the sort of drilling effort North Dakota is seeing could only be done on land.
I think she's talking about stuff you can find in any geology textbook - the "oil shales" of the USA and the "oil sands" of Canada and Venezuela. We've known about most of them for a century or more. The volumes are of the right size.
The only thing is, she is talking about "oil-in-place" volumes rather than "recoverable oil" volumes. The fundamental problem is that we do not have the technology to get the vast majority out of the ground or turn it into usable form that a refinery can process. That has always been the problem with these non-conventional resource deposits.
As I said, she has a BA in Arabic, not a geology degree, so the problems may be new to her. It's not new to the old hands around here.
And there's the new issue of confounding "oil shale" with "shale oil". I prefer to call the former "kerogenic marlestone" so non-oil people realize they don't have a clue what I am talking about. Neither is new, but there has been recent progress in developing the "shale oil" deposits, which are the "fractured oil" you have been talking about. These are nowhere near as large as the vast deposits of unrecoverable and unusable "oil shale" that the US is blessed or afflicted with.
Confused enough? We can make it more confusing if you want.
Well, no, I know what you mean.
The question is - what does she mean?
Sure, she's probably referring to OIP. And yes, she might be referring to kerogen, tar sands and heavy oil, but when you consider that the OIP for the Bakken is very roughly 400Gb, maybe she isn't.
Altho' this is off the topic of the GOM, I draw readers' attention to a tab on Brigham Energy's website
http://www.bexp3d.com/Wellresults.pdf
Williston Basin Bakken and Three averages:
North Dakota 37 Bakken and 3 Three Forks
IP 2803 BOPD
First 7-day average 1739 BOPD
First 30 day average 1062 BOPD
First 60 day average 850 BOPD
In the Montana Territories, 6 Bakken wells
IP 1576 BOPD
First 7-day average 892 BOPD
First 30 day average 519 BOPD
First 60 day average 412 BOPD
You've highlighted an 'average' well (North Dakota)still declining at 99.92 %/year (in the 30 to 60 day period). Wells on production for this short time are almost certainly in 'transient flow'. I find the data essentially useless, except to !!wow!! the investors.
Averaging high production(1 day) with lower production(60 days)makes it appear the decline is moderating. The decline is moderating but not much.
Well, Puddy Pudin' Cat of Eastside Penthouse Suites says:"Amy Myers Jaffe is full 'o' sh*t".
An error, not related to the topic of the article, but relevant, since the figure is used: The caption to Figure 10 is not correct. Dennis was really innocent in this accident.
The Thunder Horse tilted several hours before it was hit by hurricane Dennis. The tilt developed in calm weather, a few hours after it was abandoned by its crew. When Dennis hit, the tilt was already around 15 deg. The tilt increased with steady rate until it was stopped by the deck edge dipping into the water, providing an uprighting moment.