| Thoughts on why energy use and CO2 emissions are rising as fast as GDP | The Oil Drum | The Bakken Boom - A Modern-Day Gold Rush |
Geologic Resources Supply - Demand Model (GeRS-DeMo)
Posted by Gail the Actuary on December 9, 2011 - 2:52pm
This is a guest post by Steve Mohr, who recently received his PhD in Chemical Engineering at the University of Newcastle in Australia. He now works as a research consultant at the Institute for Sustainable Futures.
Last year I placed a summary of my PhD thesis on The Oil Drum. The thesis described a new model that projects fossil fuel (coal, conventional oil, unconventional oil, conventional gas, and unconventional gas) for all countries to determine the world’s fossil fuel supply and demand. At the time I did not make the model itself public, as it was written partially in C++ and partially in Maple. C++ is free; Maple, however, is expensive. In 2010 I was lucky enough to work with Dr Gavin Mudd and by extension the Institute for Sustainable Futures (ISF), and I was able to add a recycling component to the model enabling the model to be applied to the projections of metals.
In 2011, I commenced work at the ISF. Recently the ISF very kindly allowed me time to convert the model out of Maple and into Excel, in the process making the model easier to use, and freely available. As a result, the model was placed on the ISF website. It can be found at this link.
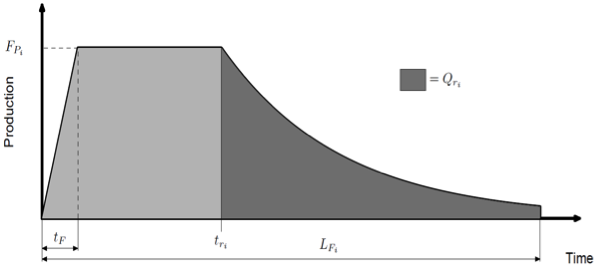
GeRS-DeMo - or Geologic Resource Supply - Demand Model estimates the demand, production (from mines or fields) and recycling of any geologic resource. The production from mines works by bringing idealised mines online throughout time and over time the supply and demand interactions allow more or less mines to come online and also mines to shut down earlier than expected (and restart later) or upgrade the mines (by doubling the mines production). The production from fields works by putting idealised fields online as shown in Figure 1. The sizes of the fields vary, with initial fields being relatively large, and a final fields being relatively small. Due to the variability in sizes, all fields in a given region are assumed to have two constant ratios (inputted) one between the maximum production to the Ultimately Recoverable Resources (URR), and the other for the URR remaining when production begins to decline relative to the URR.
The model has been used to successfully on coal (black and brown), oil (conventional, shale, natural bitumen/tar sand and extra heavy oil), gas (conventional, tight, coalbed methane, shale) phosphorus, lithium, gold, nickel, copper resources. It also can and has been used on world, country and regional levels.
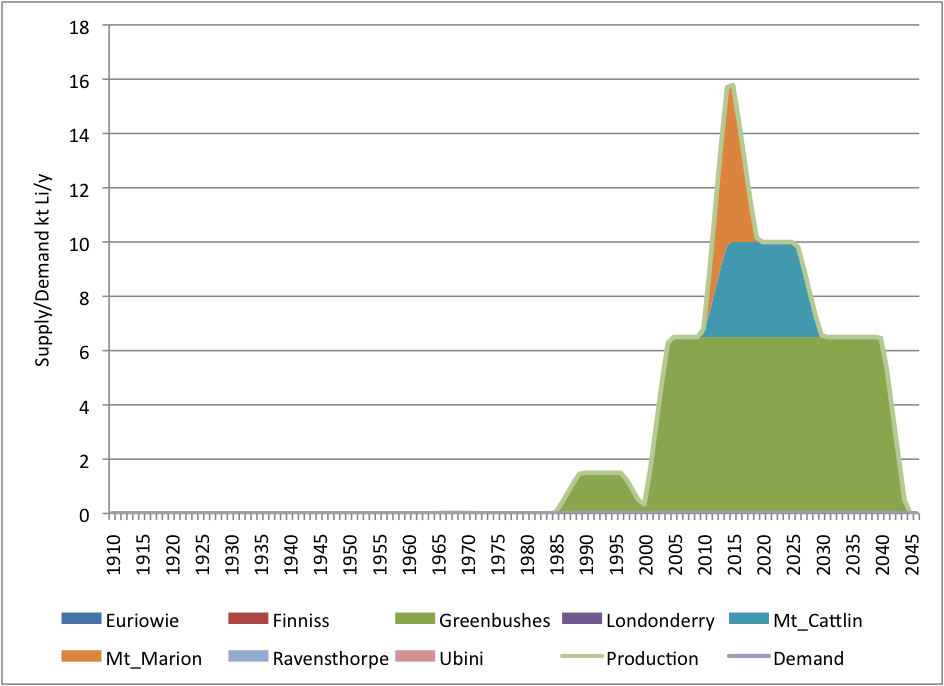
Specifically, it can be used to predict the historic and future production, amount of recycling and demand of a metal, fossil fuel, or mineral. The simplest example (included in the link) shown is lithium production in Australia. In this case the projection is made by inputting likely mine productions and lives for actual current and historic lithium mines in Australia. When the example is run the graph shown in Figure 2 is generated.
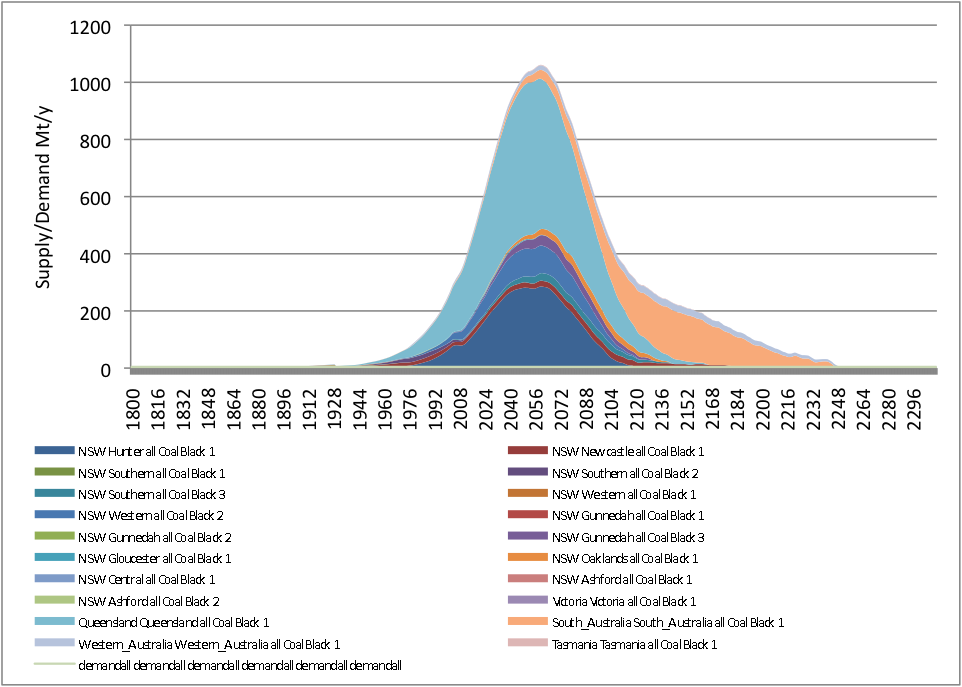
The next step up in complexity is shown in the Australian black coal projection. In this example, realistic average mine sizes and lives when production began and finally ceases are inputted into the model, with a couple of disruptions to account for small glitches in the historic production statistics. The outputted results from these projections show that without any supply demand interactions, but many mines (or many oil or gas regions (OGRES)) then the production for a region is very similar in appearance to a Hubbert bell curve.
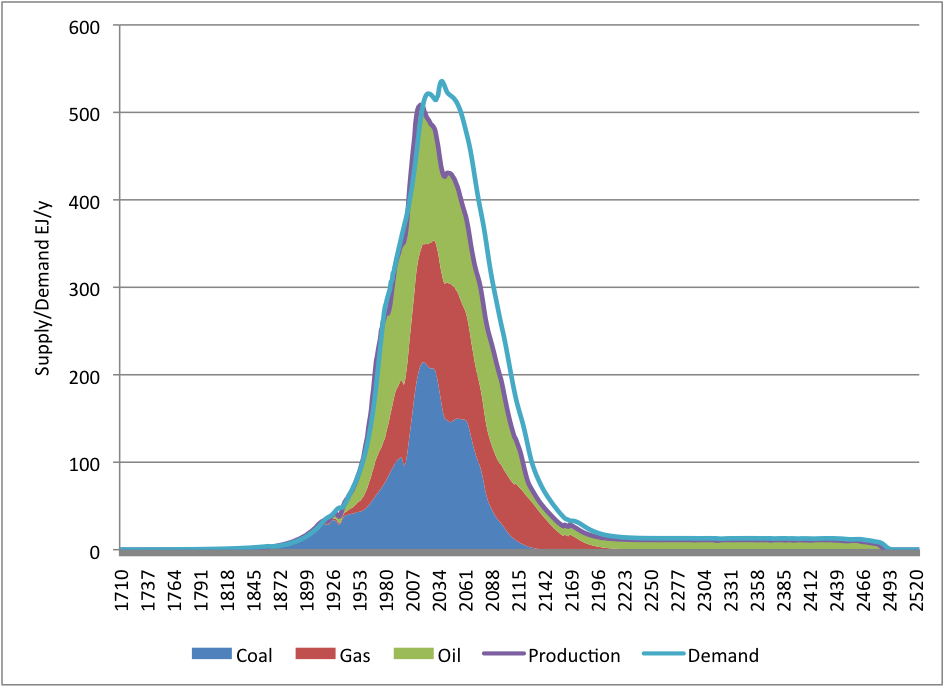
The link also includes what I consider to be the most realistic fossil fuel projection from my PhD (Case 2 dynamic) as a very detailed working example of how the model works. It includes supply and demand interactions, fields’ production for oil and gas, mines production for coal and unconventional oil production. After running the PhD example, the graph shown in Figure 4 is generated.
There is a detailed illustrative step by step guide on how to install GeRS-DeMo, and Input.xlsm contains information on the model, and the inputs required as well as a blank input file ready for your use. The model currently only works on Windows 32 bit, and excel 2007/2010; it does NOT work on excel 2003 or other operating systems. It is necessary to close other excel programs before running the macro.
I had considerable enjoyment creating the model and believe passionately in the need for detailed projections of key resources. I hope that you may consider using this model to develop your own projections of key resources, and I hope that the input sheet explains the inputs required in a clear fashion.
Contact
- Content: editors at theoildrum dot com
- Tech support: support at theoildrum dot com
License

This work is licensed under a Creative Commons Attribution-Share Alike 3.0 United States License.
Commendable dealing, above, with some detailed complexities -- but, some stark, simple realities for huge numbers of Earth's humans are described by the the two graphs at the end of http://ourfiniteworld.com/2011/10/19/kidding-ourselves-about-future-mena..., about how world food prices coincide with oil prices, & how riots tend to coincide with food prices
A little at a time, the evidence accumulates to the effect that the Hubbert curve applies across the board to just about anything that comes out of the ground.
Yes. But, it seems the hard evidence on the ground will wing-in unmistakably very shortly.
Perhaps other things to look out for?
No further (net) industrialization?
What happens to global urbanization trend over next very few years?
Other indicators?
Cars, flying in Chindia?
Food, water and purchasing power across MENA?
I'm out of my depth on this stuff
fig 4
I am confused with fig 4 vs case 2 dynamic at the link http://www.theoildrum.com/node/6782 . Is that shale oil and gas as well?
Steve is in Australia and will respond back Saturday morning his time (Friday evening our time).
Hi Mididoctors,
Fig 4 and case 2 dynamic should be almost the same with two minor differences (first, the x axis in the phd was limited to 2200 (so the long shale oil production from the US is more obvious in Fig 4) - US shale in the scenario was assumed to have a max production limit due to limited water in the region. The other difference is that the Qatar gas production is very slightly modified - due to a very minor bug found in the model (which is now fixed).
thanks
Do the mathematical models include attributions for "above ground" factors?
(i.e. Arab Springs and Iranian Nuclear Winters?)
________________________
edit: see also this recent EB post: When oil disruptions lead to crises: Learning from the Arab oil embargoes 1967 and 1973-74
I suspect not. I do not think psychohistory has actually been invented.
IIRC, they did it in the Foundation Trilogy series.
Now that we have computers, it should be a no-brainer ;-)
One could imagine that "above ground" factors might just help to prolong the undulating plateau for a bit, as the oil will still find the surface at some point. And, the longer the undulating plateau lasts, the more skeptical people will be about any real life changing event.
I have a question for Steve Mohr, or anyone who has read the thesis; Which IPCC 2007 total emissions scenario does the case 2 dynamic projection correspond to? What is the most likely ultimate CO2 concentration and temperature rise?
Thats quire a good question... you should cross post to the relevant CC sites
pages 154 - 156 of the thesis - B1TMessage.
Would it be possible to post the Maple source for the model as GNU Octave does very similar things? And there's probably a Maple2Octave utility somewhere!! C++ isn't a problem of course.
Regards, and Thanks, James Albinson
At least Maple has source code. Excel (and note that a new version is required, on Windows only) requires the software in order to even read the algorithms used in the calculations. Though I suspect .xlsm file could be decoded without too much effort: it is supposedly a zipped XML file, and XML is plain text.
I do not understand why it is necessary to use an expensive package like Maple, or a business program like Excel (famous for amateurs creating indecipherable behemoths which are not even understood by the author) for this kind of modeling. I've done some of this sort of thing myself using both Perl and Python, either of which is quite capable of handling the job, and both of which are free, and in the case of Python easily understood by someone looking at the source code.
it's because the proprietary software has already been paid for, and certain people were paid very well to make the decision to pay a lot of money to certain companies, and that represents an investment, even if they hadn't the first idea about technology to begin with, and now the justification for their entire career rests on the continued use of software that's the private property of some secretive company, which hasn't seen fit to provide a useful update in three quarters of a decade, but they'll be damned if they're going to let you up and reformat your work into a platform that anyone can access or use anyway, because they're the gatekeeper protecting a valuable investment, and that's what they're paid to be.
Hi James and others, the model is completely free from Maple now, it has excel to insert the inputs and create the graphs but the model itself lives entirely in C++ (The C++ source code is not publicly available). The model had many significant changes over it's life and began as a very maths heavy model - hence the need for and use of Maple. As the model evolved it became possible and necessary to get the calculations out of Maple and it was rewritten into C++, however due to time constrainsts the graphing and input side of things were left in Maple. Thanks to the ISF the remaining Maple components have been removed and added to the C++ code and excel macro. You can if you wish open the macro easily enough... (google excel macros for how).
Your curves PLURAL all either go to or approach zero in a geologically miniscule period of time. How realistic is that and what does it imply? Repeat: WHAT does that imply?
The Hubbert "curve" may go to zero, but that is because it is allowed to ie, we can/will substitute other less energetic material for sources of raw energy, and the population will follow.
All these curves can not go to zero and stay there, unless....
...you're on the road to the Olduvai Gorge
The Gorge was so...2008.
Those curves do, however, more or less imply a malthusian catastrophe.
Hi Steve,
It looks great and thank you for making the source available!
I would be interested in seeing another version of Figure 4 with the chart focused on 1900 to 2010, so that we might see more detail on the model output vs historical production data. I am curious how well the two agree / disagree and why you feel this run represents the most accurate version.
Hi JonFreise, just download the file, and run the phd input file and change the axis yourself :-)
The historic data is not included in the projections (I ran out time). however the excel ouput creates the models production, and you can download coal statistics from my coal article, and I think I added historic gas production stats to the gas article that came out earlier this year. Fig 4 represents Case 2 dynamic in the thesis, Case 2 was my own view of what the URR is for each country, and dynamic allows supply and demand to interact - and (was intended atleast) to be the most realistic.
Hi Steve,
It seems that the most difficult thing to model is the substitution of one resource by another due to either a big change in relative price( example copper ) or new technology (example silver used in photography.
So for oil consumption we could guess that the technical improvements in EV's as well as improvements in renewable electricity production could intersect rising oil prices. We seem to be getting close to that point now, the major issue will be how long will people hold onto old investments( ICE vehicles) rather than replace with new cheaper to operate investments(EVs). With cameras the shift was rapid because digit cameras decreased in price rapidly.
I love shale. I really do. I think it is utterly admirable what the drillers have done. Very clever and very productive. Unfortunately, a distraction:
One must not confound project enthousiasm with industry outlook. Many projects look great no matter how hard you scrutinize. However, the industry is a whole 'nother kettle o'fish.
Optimists say the Bakken has 20 BBoe, the Barnett and Marcellus likewise. The Bakken is producing 400 kB/d, enough to distort WTI until Enbridge bought and reversed the Seaway ppln. Fine. The Bakken might ramp to 2000 kB/d and Marcellus & Barnett likewise, best case.
That only makes 6 million B/d out of 18 MB/d US and 85 MB/d world. Not much considering 5-10%/yr depletion on existing wells. And that is best case -- which we cannot guarantee. Shale may have fast depletion curves (seen on the Barnett).
Of course, the Poles will drill theirs, the Germans might, the Chinese certainly and the Russian less likely.
I'm still unconvinced shale adds up to much more than a pimple on the backside of Hubbert. However fabulous the individual projects look. Please remember, Hubbert did not assume straight depletion decline, he did have post-peak additions. Just not big enough.
I am still skeptical... Hubbert's guess may have been correct, but rates of production are much higher than H considered. In which case, we have a true 'blip' of production, and those optimistic addition figures are just that. And Hubbert might even have overstated additions.
Actually, I guess we should be rooting for the cornucopians, at least short term. We can use the uplift, even if temporary, to get our own ducks in a line. That's what I plan on doing, at least. Positioning in the short to mid term for the advent of long term events hearlding the end of the industrial age. And, hoping (not expecting) that we are able to turn it around in time to salvage most of our civilization.
Best hopes that the new civilization is a good one.
Craig
Not if we have continue to have 7 billion plus humans around who all think resources are infinitely available and are theirs, bestowed upon them by their individual deity as a fundamental birth right...
The only possibility for any good, future civilization, is if the founders of any such a civilization recognize the fundamental limits imposed by nature and incorporate that knowledge into the very core of the foundations of said civilization.
Best hopes indeed!
Fred
Cool stuff. Contrary to the rather crude heuristics of Logistic modeling, Steve has demonstrated how the stochastic (fancy word meaning random) placement of the production/decline curves has a greater impact on the shape of the peak oil curve than most people think.
Yawn.
Any references? Citations?
I like to bring this up because I think that the climate change crowd is using global warming as a smokescreen, inadvertent or not, to push alternative and renewable energy strategies. The GW skeptics then attack the climate scientists for uncertainty in their math models, thus reducing the credibility of GW as a real threat. Yet the global warming smokescreen actually hides the real concerns of fossil fuel depletion. And should depletion rise above AGW as more of a practical concern, those same skeptics will come after the energy crowd with the same vengeance.
I realize the Malthusians amongst us have completely given up on technology, including math, but not all of us are Malthusians, and we can stifle a yawn.
Your math is not right.
Pretty Damn Vague
I would like to apologize for being vague - and possibly wrong.
WHT, your math may or may not be correct, I am not going to review the math.
The calculus is wrong. You are attempting to model human behavior {mining, money, production and consumption}. These models are unable to handle exogenous events, nonlinear behavior, phase change or altruism. The models appear to have some skill in the rearview mirror, but show little or no skill when applied to real life or used predictively.
The depletion curves for my deposits are not smooth, do not tail off and are likely to have several "peaks". There are "vertical lines" where there was bad weather, illness, cost of fuel, lost or broken tools, lack of hamburgers, winter. The aggregate isn't anywhere near smooth either, showing discrete steps particularly when November arrives.
Exogenous events are the norm in resource extraction and you are going to have to account for that or your models are modelling the past as a continuum and unable to be used to predict future production with any real meaning.
Because of the nature of mining, different than that of energy production, we can substitute materials, close mines, etc. These real world actions result in stepwise curves which are quite distinct from your generated curves. This is discrete math and therefor your calculus is wrong.
Well I haven't done the analysis for mining, so by definition your implication that I am wrong is wrong.
In any case, look at the situation this way: I am way more right than any economist will ever be. Resource depletion is only about counting beans and these beans can't magically appear or disappear. Compare that to economics where money, credit, and derivatives of money and credit can magically appear or disappear at any time, with the aspect of game theory thrown in the mix.
There is no game theory associated with fossil fuel extraction, just steady greed driving the monotonic decrease in available crude oil.
If you want to verify that I don't do the mining analysis that you think I do, check http://TheOilConundrum.com
The reason that HL shows some skill is because of the large amount data (aggregate of fields, producing wells) and the fact the there is no substitution for liguid fossil fuels.
These models fall completely apart when applied to minerals. Empirically, the "curves" are really "picket fences" (discrete) and production and demand can go to zero instantly. Theoretically.
WHT, the GW "crowd" and the Peak Oil "Crowd" have similar agendas. One is not necessarily a smokescreen for the other.
Every indication I have seen tells me that the science of AGW has been intentionally muted, and as I recall it was directed to so do by the IPCC in reaction to pressure exerted by the US neo-cons in charge during 2000-2008. Not that the previous administration would have done anything else or better.
Now, though, the initial report's conclusions are being shown to have understated their predictions, to the extent they did any more than merely report substantially clear data. The errors in models seem to have fallen to the side of the doubters, and reality is somewhat worse.
The real problem is that the AGW "crowd" are real scientists. They do not speak in absolutes, but in probabilities. To the fanatics of the left or of the right, they sound wishy-washy, and are protrayed in the media in the way that distractors challenge Mitt Romney or Newt Gignrich, or any other politican who changes his mind after being convinced by evidence that he was initially wrong.
Only with science, they always are open to change. Heck, the law of gravity is only a theory, and if you ask a physical scientist she will tell you so. Given evidence that the "law" is wrong, and they will support the 'side' having the most reliable evidence.
You then have the problem of AGW theorists having to explain science before they can discuss their theory. And, because it is a 'theory', the 'skeptics' equivocate and use their definition of theory to deride real science. All to make a damned dollar.
Best hopes for mathematical proofs.
Craig
I agree with what you say in terms of speaking not in "absolutes, but in probabilities", because that is all I do in depletion modeling.
I just have different opinions on how the discussion is being carried out.
Typical response is 'yawn, gibberish, wrong' as by the mining guy above.
Because these curves don't even come close to reality at least in my district either forward or backward.
Minerals and metals are fundamentally different than our one source of energy, fossil fuels. They are substitutable, for one. They are recyclable. This was mentioned by the author, accompanied by the term "idealized" applied to a mineral deposit. There really are NO "ideal" mineral deposits, rather they tend to rather non ideal.
That is pretty much why, when you visit a university, tech or mining school, you will be able to find the geology dept, geochemistry dept, geophysics dept., petroleum engineering, but not the mathematical geology department.
Geology is primarily an empirical science, so instead of endeavoring to make the data match the predictive charts, you should endeavor to make the predictive charts look more like reality which is discrete. Good luck with that....
xxxxxxxxxxxxxxxxxxxxxxxxxxxxxxxxxxxxxxxxxxxxxxxxxxxxxxxxxxxxxxxxxxxxxxxxxxxx
On a side note, sort of:
Hurricane predictors admit they can’t predict hurricanes December forecasts are too unreliable, experts say
Read more: http://www.ottawacitizen.com/news/Hurricane+predictors+admit+they+predic...
And that is just the weather. If you were to model human behavior, ie. mining, consumption, or in the case of hurricanes, human reactions to the hurricanes, you would have to provide variables and inputs for that.
Well you aren't talking about any analysis I have done then, which avoids discussion on renewable resources, such as precious metals.
So you basically attacked me for no reason. Read http://TheOilConundrum.com to understand my perspective. I am trying to change the way people think about the topic, in contrast to what your typical geology or petroleum engineering department offer, which is essentially paying lip service to the math.
The science of resource depletion is a gaping hole in research and academia. If anyone can come up with a name of any analyst that has done a complete and comprehensive study of oil depletion, I am all ears. For an industry that has made trillions of dollars over the years and forms the energy backbone for manufacturing and transportation, I find that very odd. There is no “bible” or standard reference to speak of.
Name some people associated with depletion analysis and I will give you an opinion of their strengths and weaknesses.
Check James Hamilton’s update for a start:
http://dss.ucsd.edu/~jhamilto/handbook_climate.pdf
Oil Prices, Exhaustible Resources, and Economic Growth, 12-9-2011,
Prepared for Handbook of Energy and Climate Change.
This is gibberish.
The headline now reads:
The story now says (at the end):
It was NOT that any of their forecasts were unreliable, it was just the early one made in December.
HAHahahahaha
One thing I might point out is that (based on my limited understanding) is this modeling does not take into account the likely impact of declining EROI / rising price (which I consider to be pretty closely related). It also does not take into account Liebig's Law of the Minimum. In other words, if one necessary resource is in short supply, it will hamper the operation of the economy as a whole. This necessary resource could be something unrelated to the model, such as the amount of fresh water available from aquifers which is not included in the model at all. It also does not take into account the impacts of sinks for pollution being filled, as more fossil fuels are used. Furthermore, it does not take into account the huge human population that has built up during the phase when fossil fuel use was rising, and who must still be fed and clothed in the declining phase, or political revolts are likely.
So, in my view, the modeling as illustrated in these examples gives something which is closer to an upper bound for fossil extraction than a best estimate of future extraction.
Based on the information provided, there is no way to gauge the probabilities of the answer because the uncertainties involved are not provided. You have referenced but a few. Without them, you don't know if the answer is high, low, middle of the road or pure BS.
Fill in appropriate Box and Draper quote here.
I know the Box quote you are talking about and it is always taken out of context. I have the full paragraph on hand and unless you too have the book it was taken from, you probably haven't a clue about the context.
If it weren't off topic, I would love to read your in context pontificating. The problem is, when I say "Box and Draper", I am referring to more than just whichever one you have clairvoyantly decided is the one I used, rather than a more generic term for several of their quotes (individually as well as collectively) expressing the same basic idea.
Hi Gail,
No the model does not account for these uncertainties. That is why I provide three scenarios in the PhD (and articles), Low, Best Guess, High. The model was an attempt to move the argument away from a simplistic equation, and instead attempt(albeit simply) to place more theory into why or why not the production is symmetric and if not how asymmetric.
I have been curious about this for awhile.
Can you take 1980 Data and prehistory.. plug it into your model..
Then Take 1990 Data and prehistory.. do the same..
2000.. do the same..
I want to see what the model puts out. Is it the same exact curve, but showing we hit peak, etc.. and going down after a certain amount of time only the years are behind us that this has happened?
Or do they show, the "We knew there was another 500 billion of reserves to be discovered!".. No way, a lot of people thought the Gulf of Mexico was played out, but technology changed that. Brazil? Offshore Africa?
These models are way too simple. They can only predict a KNOWN and are always ADJUSTED AFTER THE FACT as the KNOWN CHANGES.
I almost feel like it's like the end of the world speech from various religions. The models are incapable of predicting the unpredictable. Human ingenuity, practicality, technology, or discoveries. What if for example the Arctic/Antarctic hold 1 trillion barrels? I know it's a what if.. but, these charts never put in the odds of finding a huge field or new frontier. What if fracture technology can open up the deep wells in California? Etc, Etc, Etc...
That Isaac Asimov reference is priceless. I love the Foundation Series, but it too had the unpredictable of an unknown group.
I would be willing to bet that if you tried to account for the complexity you mention, and input the proper levels of uncertainty, you will discover why predicting something, particularly the future, is so difficult.
The backcasting you mention is something normally done as a course of business in any engineering study (or even more basic we get the "gee Johnny, that cement didn't hold up at all last time, why are we using it again this time?!" effect), and this type of quality control is hard to find on this topic. Probably for good reason, imagine how much less fun it would be if preceding the next version of the model you had to issue the following disclaimer, "So far this model hasn't worked in a predictive manner on any past data, but lets ignore that and talk about all the interesting things it predicts a few decades from now."
Gee it looks like you only want back to 1980. That is too easy!
The problem is that we can't go back in time and explain to King Hubbert the innovations that have been made in the theory of stochastic processes. You see, the probability models were only starting to get accepted in the 1960s, via books by Feller, Parzen, and Doob, to name a few. Hubbert back in the 1950's made do with some graph paper and a few heuristic models. If a few scientists were diligent about the analysis and kept at it through the years, passing on knowledge to the next generation, we would have an excellent accounting of current and projected supplies. The problem is that no one seemed to care and the effort languished as a set of heuristics, maintained only by a few of Hubbert's disciples including Deffeyes.
You talk about "what ifs", including a trillion barrels in the polar regions. Well it would seem that out of several billion people on the planet, at least a few would have the intellectual curiosity to analyze how long the supply would last.
Impressive model, Steve.
It would be helpful to have some more information about the assumptions you made for this model, especially the assumptions about demand (including demand destruction, substitution, recycling etc.) and perhaps other above-ground factors, which are rather complex and not easy to predict. Did you publish this somewhere?
Unfortunately the model doesn't work on my PC (Win XP, Excel 2007).
Using the Inputs_Australia_blackcoal.xlsm the output stops with an error message (Error in Line 1003), and the Excel debugger highlghts the line
"WRawSum.Cells(ii, jj).Value = RawSum.Worksheets("Raw_Summary").Cells(ii, jj).Value"At the second try it stops with a different error message. Using Inputs_PhD_example.xlsm it stops without error message (creating several spreadsheets but no graph).
Hi Drillo,
The assumptions and all equations can be found in my phd (which is on the oil drum).
Re bug: it sounds like the c++ code ran then died in the macro coming out which is strange (usually if it is going to fail it dies calling the executable). Was the excel input sheet the only one open at the time? was the path to the folder less than 200 characters? sorry - I haven't seen this behaviour before so I'm not sure what went wrong - feel free to email me a snapshot of the screen and I'll see if I can reproduce (and then fix) the bug.