| Tech Talk - Production from Abqaiq, an Aging Queen | The Oil Drum | The Solar Envelope: How to Heat and Cool Cities Without Fossil Fuels |
What the New 2011 EIA Oil Supply Data Shows
Posted by Gail the Actuary on April 12, 2012 - 10:36am
The US Energy Information Administration (EIA) recently released full-year 2011 world oil production data. In this post, I would like show some graphs of recent data, and provide some views as to where this leads with respect to future production.
World oil supply is not growing very much
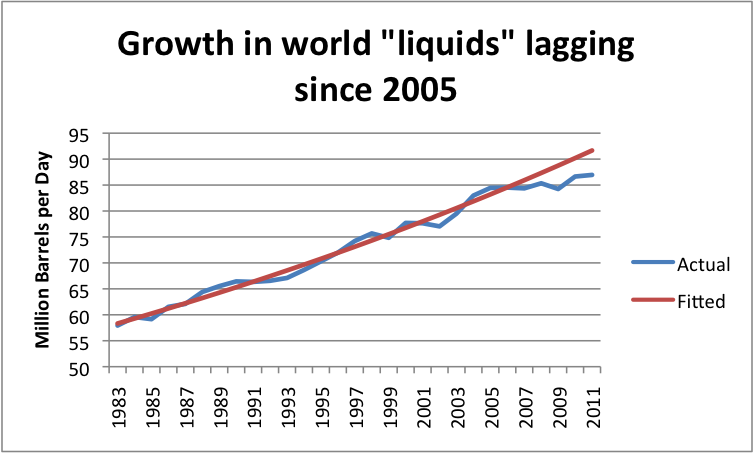
The fitted line in Figure 1 suggests a “normal” growth in oil supplies (including substitutes) of 1.6% a year, based on the 1983 to 2005 pattern, or total growth of 10.2% between 2005 and 20011. Instead of 10.2%, actual growth between 2005 and 2010 amounted to only 3.0% including crude oil and substitutes.
The shortfall in oil production relative to what would have been expected based on the 1983-2005 growth pattern amounted to 4.7 million barrels in 2011. This is far more than any country claims as spare capacity. This is no doubt one of the reasons why oil prices are as high they are now. These high oil prices tend to interfere with economic growth of oil importing nations.
The shortfall in growth especially occurred in crude oil. Figure 2, below, shows crude oil production separately from substitutes.
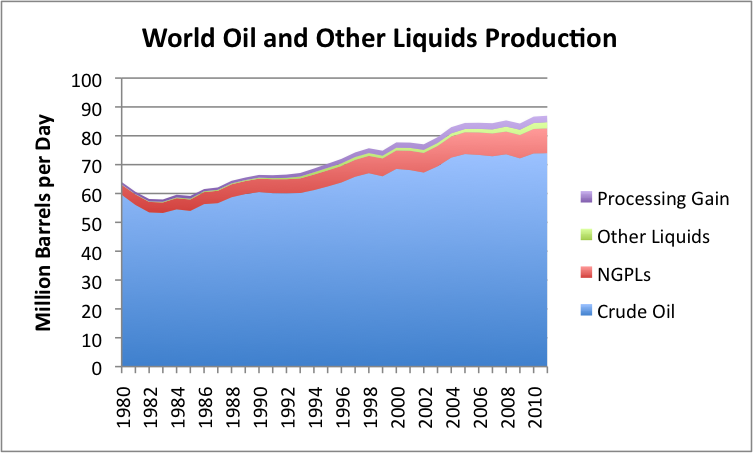
Between 2005 and 2011, crude oil production rose only 0.5%. It was mostly the substitutes that grew.
Top Oil Producers
The top five crude oil producers in 2011, based on the new data are
- Russia – 9.8 million barrels a day (mbd)
- Saudi Arabia – 9.5 mbd
- United States – 5.7 mbd
- China – 4.1 mbd
- Iran – 4.1 mbd
The top five producers when substitute liquids of various kinds are included are the same countries, but in a different order. On this basis, the US also appears to be closer to catching up to the top two.
- Saudi Arabia – 11.2 mbd
- Russia – 10.2 mbd
- United States – 10.1 mbd
- China – 4.3 mbd
- Iran – 4.2 mbd
While substitute liquids are OK, they are not really crude oil. Natural gas liquids are the largest category. In the US, they sell for a little less than half as much as crude oil, based on the composition and costs shown in this post. On an energy content basis, they provide about 70% as much energy per barrel as crude oil.
“Other liquids” has also been growing. It is mostly ethanol, which has about 60% of the energy content of crude oil per barrel. This category also includes biodiesel, liquid fuels made from coal or from natural gas, and even a mixture of water with very heavy oil called “Orinoco emulsion“.
There is also growth in “processing gain”. This term refers to the extra volume that is gained when long hydrocarbons of heavy oil are”cracked” into shorter molecules. The EIA assigns this growth back to the country doing the refining. The US comes out ahead in this comparison because it imports a lot of heavy oil, and uses its complex refineries to crack it into shorter chains, such as diesel fuel and gasoline. If the heavy oil imports were to go to another country with complex refineries (such as China), the processing gain would go with it.
Looking at the Top Five Oil Producers
Of the top five oil producers, only the US and China have been growing very rapidly, and China’s growth now seems to be hitting limits. Let’s look at the five largest countries individually.
Russian Oil Production
Between 2005 and 2011, Russia’s oil production (including substitutes) grew by 7.5%. This is better than the world average of 3.0%, but still falls short of the expected growth between 2005 and 2011 of 10.2%, mentioned above, based on the 1983 to 2005 world growth pattern.
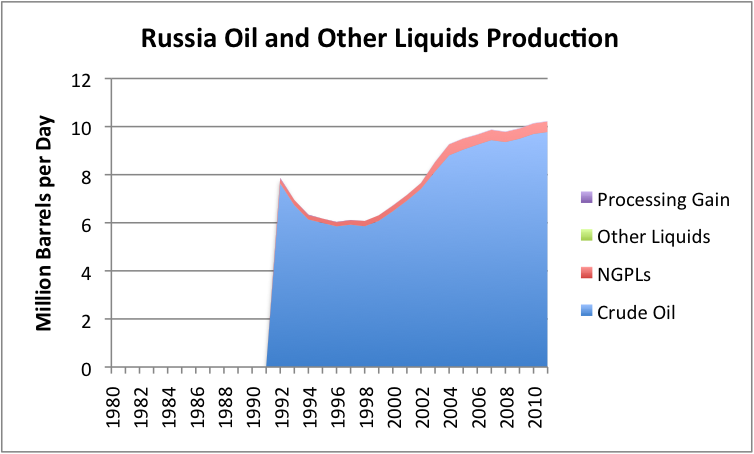
In 2011, Russia’s crude oil production grew by 0.6%. Growth may be slowing even further in the future. Russian Economic Minister, Elvira Nabiullina, was recently quoted as saying that Russia’s possibilities for crude oil growth have been exhausted and that Russia’s oil output will stabilize at the 2011 level for the next 20 years.
Saudi Arabian Oil Production
Figure 4 (below) shows that Saudi Arabia’s oil production has not increased much on an annual basis since 2005.

Looking at crude oil only, Saudi Arabia’s production is down by 0.8% since 2005. If one includes natural gas plant liquids (mostly ethane, propane, and butane), Saudi Arabia’s oil production for the year 2011 is up by 0.6% since 2005. This is less than the world average of 3.0%.
Saudi Arabia’s oil production bounces around. Admittedly, for some individual months, Saudi Arabia has broken its own record for crude oil production, but there is no pattern of continuously increasing production, such as is needed to increase world oil supply.
United States Oil Production
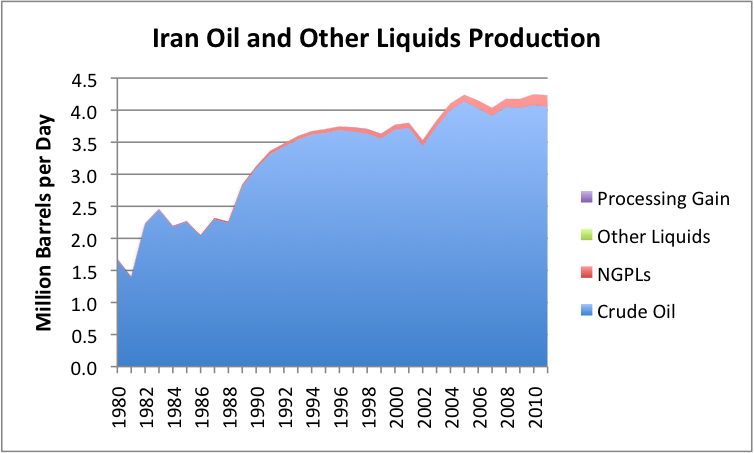
US oil production is growing (total liquids supply increased by 21.2% between 2005 and 2011), but the major portion of the growth is coming from oil substitutes.
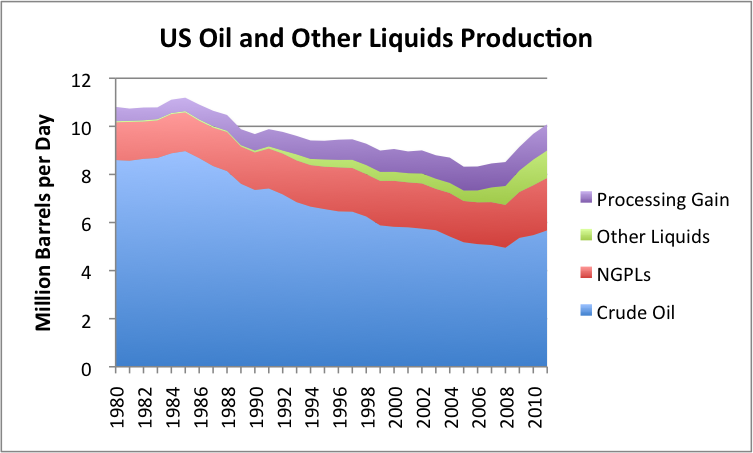
A comparison of the thickness of non-blue bands on the US graph with those of the world (Figure 2) and with other countries shows how disproportionate the US mixture is.
If we look at US crude oil production by area of the country, we see that while Bakken production in North Dakota has been growing, it is still a small proportion of US total production.
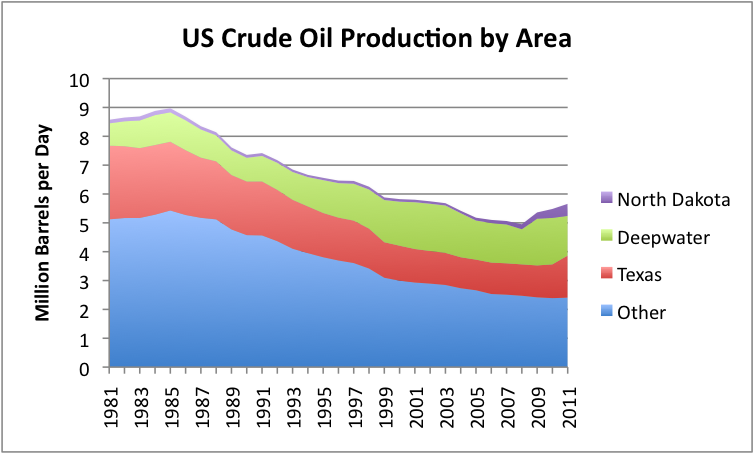
Before the shale oil rush, the biggest growth in US oil production had been from what I have called “deepwater”(what is called “Federal Offshore” in the EIA data). This production is down by over 200,000 barrels a day in 2011, more than double the growth in North Dakota production.
The other recent area of oil production growth is Texas. While EIA data does not break the production out by field, higher production from the Eagle Ford shale and the Permian Basin are likely major contributors.
China’s Oil Production
China’s oil production plateaued in 2011, after many years of strong growth.

Figure 7 shows that China’s oil production for 2011 slightly decreased. The Financial Times recently reported that part of the problem is an outage of over 150,000 barrels a day in the Penglai 19-3 field, which reduced production starting in September 2011, but is now coming back on line. But even apart from this, China is reported to be struggling to find new production to offset declines in aging fields. The Financial Times calls the outlook “challenging”.
If China’s oil production fails to grow in the future, or declines, it means that China will need to import even more oil than it has in the recent past. This will put even more pressure on world oil supply.
Iran’s Oil Production
Iran is constantly in the news with discussions of more sanctions and the possibility of cutting off Iran’s oil exports. While it is listed above as fifth in world oil production, it is almost tied with China for fourth in world oil production.
Iran’s oil production hit a high point in 2005, and is down slightly from that level. Its exports are down even more:
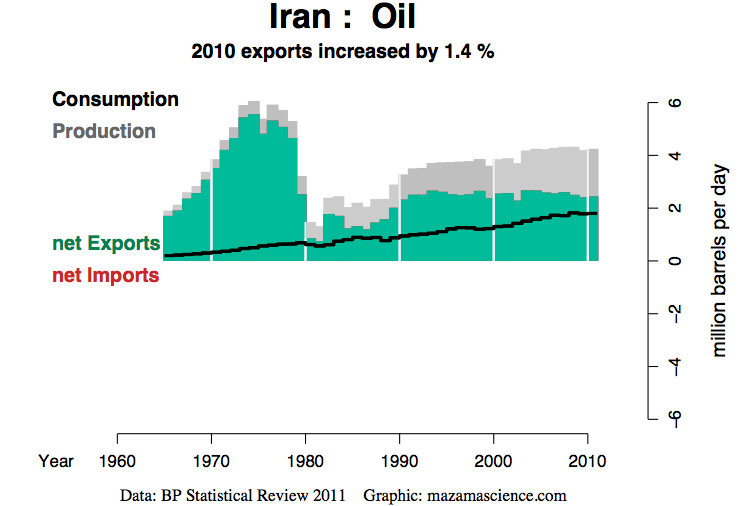
The fact that Iran’s oil production is not growing is no doubt one of the reasons it is interested in electricity production from nuclear energy.
In my view, Iran’s oil exports of over 2 million barrels a day are very much needed to maintain reasonable stability in world oil prices. We would be better off finding a different way to settle our differences with Iran than cutting off exports.
Other Areas of Interest
The North Sea has been a problem area, with declining production. EIA data does not show this grouping separate. Instead it shows data for Europe in total.
Europe has surprisingly low oil production. On a crude oil basis, Europe’s 2011 production is below that of Iran (3.4 mbd for Europe, and 4.1 mbd for Iran). With the various substitutes included, Europe’s production is approximately equal to that of China – 4.3 mbd, and slightly ahead of Iran’s at 4.2 mbd.
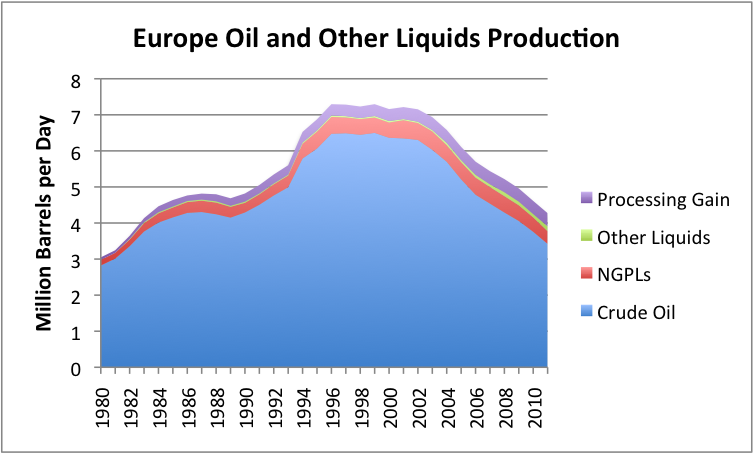
Clearly Europe has a very serious problem with falling oil production. In 2011 alone, crude oil production was down by 8.9%, and more broadly defined liquids were down by 7.4%. Europe’s declining oil production is no doubt contributing to it financial problems.
In contrast to Europe, there are a number of bright spots with respect to world oil supply.
Canada’s oil supply is increasing:
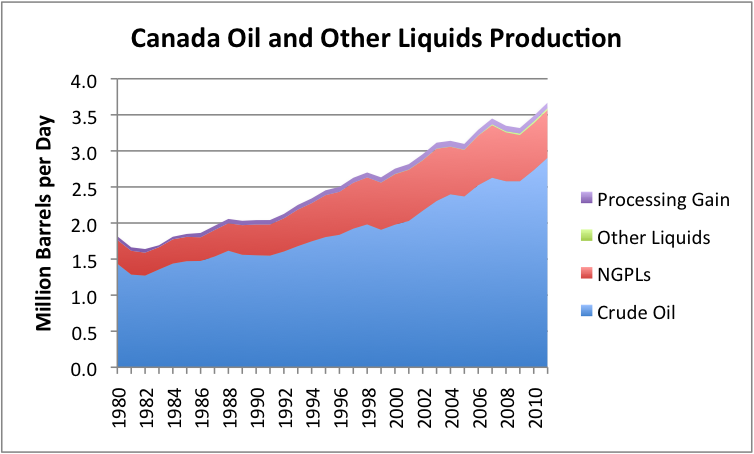
Of course, one of the issues relating to Canada is that quite a bit of the increase is from the oil sands. This production is of concern for environmental reasons.
The Former Soviet Union excluding Russia is another area where production has been increasing, at least until recently.
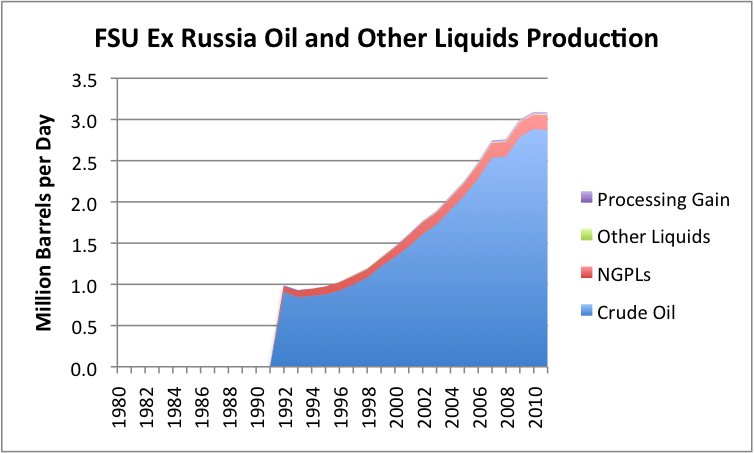
The graph would seem to suggest that production may have plateaued in this area, as well.
Qatar is a small country, but is showing rapidly increasing production from a small base:

Iraq is often mentioned as an area which may have increased production in the future.
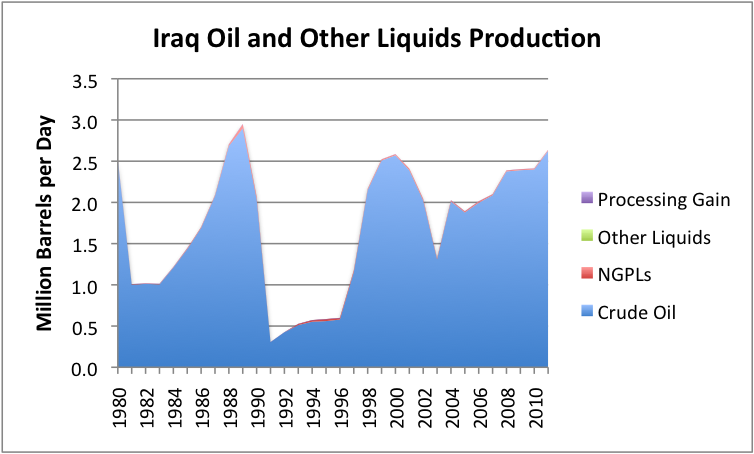
Figure 14 shows that there really hasn’t been a huge increase in production so far. Past history is so unstable that it raises questions about Iraq’s ability to ramp up production in the future.
Libya is mentioned as having a possibility of increasing production, at least relative to the drop off in 2011.
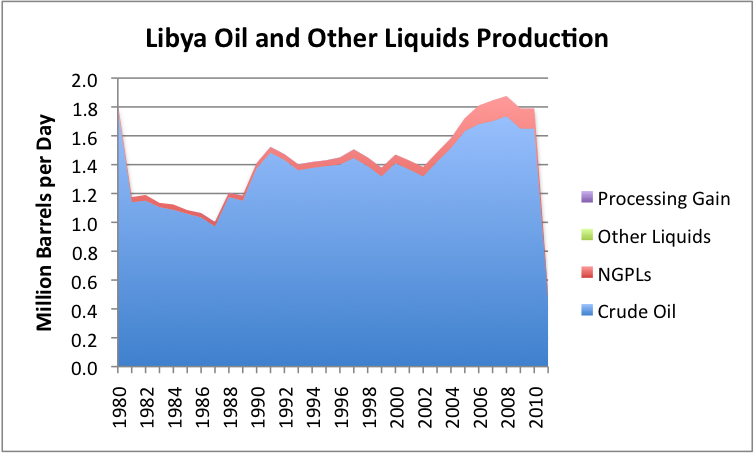
While some increase from the 800,000 barrels a day production EIA reported for December seems likely, it may never fully get back to its old level. A recent analysis says Oil Production Still Unstable in Libya. According to this article, security concerns are likely to hold back future investment by outside companies in Libyan production, and sluggish political decision-making is likely to hold back actions of Libya’s National Oil Company.
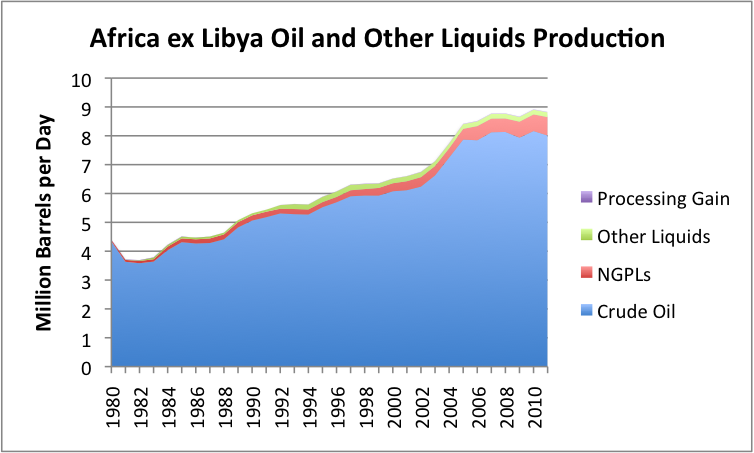
Various African countries are mentioned from time to time as providing new sources of production. But when we look at African production, excluding that of Libya, we see that at least so far, African production, excluding Libya, is on a plateau.
Brazil is also mentioned as a growth opportunity.
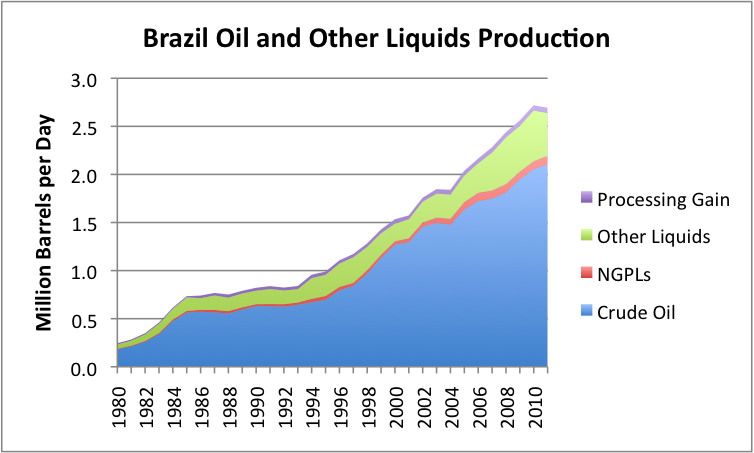
The actual increases to date have been small, however. Crude oil production in 2011 increased by only about 51,000 barrels a day over 2010. Ethanol production decreased, so that total liquids production decreased slightly in 2011.
Conclusions
It is easy to find small opportunities where it looks possible to increase oil production, but on a world-wide basis, it appears likely that at best, very slow growth will continue. The oil production of China and Russia were previously increasing, but now seem to be hitting plateaus. Even smaller groupings, such as the FSU excluding Russia, seem to be hitting plateaus.
Future prospects for oil supply look to be worse, especially if Iranian exports are taken off line, or if there are unexpected surprises on the downside. One concern is that political disruptions may take oil production offline in additional countries. Anther is that financial disruptions (perhaps related to European debt defaults) may lead to lower oil prices, cutting off some marginal supply.
On balance, it would appear that at best, oil production in the near future will be virtually flat, leading to more spiking of oil prices and greater world economic problems. Another possibility is that world production will begin to decline. The likelihood of decline would appear to be increased if more oil exporters encounter political disruptions, or if the world enters a major recession leading to an oil price decline.
This post originally appeared on Our Finite World.
Contact
- Content: editors at theoildrum dot com
- Tech support: support at theoildrum dot com
License

This work is licensed under a Creative Commons Attribution-Share Alike 3.0 United States License.
Gail,
You are confirming what has been known by many that conventional crude has peaked around 2005, and that "growth" in the supply is being achieved by NGL's, unconventional oil and limited biofuels. Not a conforting prospect and probably still not enough to convince deniers, of which there are many. A few missed predictions seem to have convinced some TOD readers that Peak Oil has gone. It has not, and it is real. Unconventional oil will never be produced in the large volumes that conventional oil allows.However , politicians and various other "learned souls" mistakenly believe that a few billion barrels of new finds will fuel us for decades to come. The sad fact is that there is a growing, almost polemic, belief that shale gas and "shale oil" and "new technology" will allow BAU, as the world burns through 32+ billion barrels per year.
Why then is the oil price so high and showing no sign of decline. Then examine the consumption growth in producing nations. Factor in the true spare capacity (probably next to zero) and then consider the volumes that are really available for export, and the answer is " Houston we have a problem, a big problem".
What matters is not the oil resources( as opposed to reserves) in the ground, but how readily that they can be extracted and brought to market. That process is becoming progressively more difficult, more energy intensive (EROEI), and more expensive in real terms.
The end result might be uncomfortable to some, but the reality is that the are real "Limits to Growth" and we will see it very soon, because every technical solution to date has only deferred the inevitable, not solved it.
I agree. I think we are reaching Limits to Growth, caused to a significant extent by limited oil supply.
What we are seeing now is that oil production is not rising enough to keep up with world demand. This is the first step in the short fall. The effects of the short fall hit the economy of oil importing nations, through higher prices and debt defaults. Even oil exporters can have problems, especially if their oil exports are dropping, and the country was counting on the revenue to fund programs for the population. It is these indirect impacts that feed through the system, and can influence future production. For example, governments (of both oil importers and exporters with declining exports) find they need more revenue, so they raise taxes on oil companies. This leaves less money to fund future development, and may make marginally productive wells no longer profitable. Another impact is revolution in countries where government programs are not keeping up. All of this feeds into Limits to Growth.
Professor Charlie Hall goes into the Limits To Growth in great detail in this new interview....
http://fromalpha2omega.podomatic.com/
OK. My 2c worth.
Oil production is still rising and thus we haven't hit Peak Oil yet. But:
1. There's been a break in trend for production, with production rising far more slowly after 2005 than before; and
2. The price of oil has gone through the roof, provoking massive spending on exploration.
Therefore, we can deduce that, without the massive price rise, there would have been no increase in production at all, and probably a decrease. A recent cornucopian prediction of US oil production (reported on TOD), had a very interesting assumption in it - that oil prices would be significantly higher than they are now. Newt Gingrich's $2.50/gallon petrol pledge is hogwash, because the only way the US will become self-sufficient in oil is if the price of petrol is $5 or $6/gallon.
On the world scene, the US & Iraq are the only two countries which show signs of perhaps being able to increase production significantly. With the US, besides the price issue, there is also the issue of how sustainable this rise will be. With the sort of decline rates that are being talked about in the wells producing tight oil, the increased production could be very short-lived. With Iraq, the opposite issue exists. While there is reason to believe that it has the potential to be a large producer for a long time, the timetable for it reaching that status is doubtful. We've seen optimistic predictions consistently blown away. My estimation is that Iraq will contribute to slowing the decline of global production rather than increasing production further from where it is now.
Finally, I'd like to reiterate my belief that increasing efficiency of use of oil will cushion the decline in production. Capitalism is a very nasty socio-economic system, but nobody can argue that people don't respond sooner or later to price signals. While George Bush famously said that "The American Way of Life is not negotiable", he was wrong. People will find it is very negotiable when increasing prices make it uneconomic. It mightn't look like that to many Peak Oil people at the moment, but that's because the factors that drive oil consumption are deeply embedded in society and can't be turned on & off like a switch. Instead, it's like turning around an ocean liner. At the moment, we're seeing responses to price increases of a few years ago, while we haven't yet seen the responses to current prices. Unless prices collapse, I would expect US consumption to continue declining.
Ablokeimet, imagine what prices would be at if US consumption was not declining.
Yes, quite a bit higher, I would say. But, as I said before:
Joe Sixpack: That old SUV of yours has had it - time to get a new one.
Jessica Sixpack: It's sending us broke, hon. I had to fill that beast up again yesterday. We'll have trouble meeting the mortgage and the car loan if we keep that up.
Joe: Can you get by with a compact?
Jess: I'll miss the cupholder, but I could borrow your SUV on Saturdays to take the kids to soccer.
Thanks Gail! This is a fantastic article reminiscent of the old oil watch monthlies you guys used to post. For my part, I feel these were very valuable. Although, maybe a quarterly report would be more appropriate to the glacial speed at which these large and powerful forces tend to move (at least for now).
I did have one point to make RE North Dakota oil production. January 2011 shows a little more than 350,000 barrels per day and December 2011 shows a little less than 550,000 barrels per day. So, for 2011, the growth in North Dakota was a little less than 200,000 barrels per day. In any case, the shale oil fracking and growth in other US oil production due to rampant drilling has led to a net gain of about 1.2 million barrels per day in the US from a low of around 4.9 million barrels per day.
I have so many concerns about this fracking. The first of which is that the decline rates for the extraction process seem pretty amazingly high. Not what you would normally see for oil or even natural gas which tends to be a naturally rapid decliner. And though the shale oil resource base in the US seems to be rather large, the extraction rates seem to be very low. USGS/EIA estimate 1-2 percent extraction rates, with 5-10 percent being very optimistic. But even if we did get to 10% you're talking about 100 billion barrels of 1:6 EROEI fuel. Say this happens and world liquids push to 95-97 million barrels per day on balance in a best case. What is the shape of the curve, then, in 2025 or 2030 when those really extreme decline rates kick in?
Conventional, non-fracked, non-tar sands oil is already in decline. I mean, you really have to take the fracked stuff and the tar sands out if you're going to be honest in accounting. Yes, it may be the same stuff at the end of the pipe. But it's nothing near the same at the beginning. Some people here have been calling the tar sands syncrude. And I think that's a pretty apt comparison. And while fracked oil is still 'crude' it's non-pressurized EROEI 1:6 crude not the dome oil that generated 1:100 energy. It's just not the same stuff from an energy perspective and we're talking about energy, right?
So let's think about this. We have tar sands producing about 2 million barrels per day. We have fracked tight oil producing about 1.5 million barrels per day. And the other low energy return oils, deep water, are producing about 7.5 million barrels per day. So if you have world crude plus condensate production at 75 million barrels per day since 2005, that 75 now contains an 11 million barrel per day fraction of low energy oil. The fraction of this oil in 2005 was about 5 million barrels per day. So for non low-energy oil, we've gone from about 70 million barrels per day to about 64 million barrels per day since 2005. When you look at the all liquids number, that's 24 million barrels per day of stuff that's mostly 1:6 EROEI or lower.
In fact, the energy content of this 'oil' is less than the energy content of electricity produced from wind or solar energy. I would think that this has implications for peak oil, because this low energy oil indirectly affects price. It also, as Gail keeps mentioning, directly affects the ability of civilizations to function. So I would think that as we keep depending more and more on this low EROEI oil we will see more countries collapsing (including some oil producing ones), more income inequality and political instability, more expanding deficits and potential defaults as growth dependent monetary systems teeter, and a continued lessening in the ability of countries, on aggregate, to invest in maintaining and expanding their civilizations.
The visible end of the plateau in crude and related small increases in liquids production will happen once the entropic factors of increased cost and difficulty to access new oil, declines in large traditional producers (Saudi Arabia, Russia), demand destruction through expanding poverty, 'locked in capacity' when governments destabilize (Lybia, Syria, Iran [?], Iraq), and structural damage due to the dwindling export/import market overwhelm the forces that are now pushing small gains in all liquids production. It's really just a question of how far the low energy oil can push out the plateau and how long civilization can cope in a low energy oil environment.
Directly fighting these forces are increased efficiencies, replacement of new sources of energy (wind, solar, etc), and transformative technologies and practices that make the world less reliant on BAU energy and materials sources. But these solutions are being suppressed in political systems around the world. And this is why fracking scares the living daylights out of me. It gets us dependent on energy that will wreck us in ten to twenty years, multiply the effects of climate change, and draw money away from the alternatives to BAU that could result in a degree of sustainability.
I wouldn't compare EROIs among types of fuels, because to me, they are not very comparable. EROIs of wind and solar in particular to not take into account enough of the systems of which they are part, to calculate a truly comparable value. Also, the front-ending of costs in wind and solar is not adjusted for in the calculation.
The other issue with EROI is that such a calculation makes most sense when all fuels are equally abundant. Years or so, this was sort of the case, and prices per unit of energy were much closer than today. The situation in the world today is that oil supply is more or less maxed out, and its price much higher than natural gas or coal. In today's situation, it makes economic sense to use natural gas to extract oil from the tar sands, even though its EROI is low. What doesn't make economic sense is to use oil in ways that produce substitutes for natural gas or coal.
I would argue that at this point, we should be looking at financial indications (without subsidy) more than EROI. CO2 issues need to be considered separately.
Well, then, I have some thoughts in return --
Cost of wind per watt installed: 98 cents (less than new nuclear, only slightly more than new coal, less than new natural gas). Costs for new solar installations are still high but, in many cases, are now less than new nuclear.
I'm surprised you'd support use of natural gas to generate tar sands. Just one more dependency on a depleting fuel. Merging nat gas and oil, as is currently happening, results in ever more rapid depletion and escalating climate impacts.
As for climate change and costs, both the recent $40 billion dollar flood in Thailand and the following quote come to mind --
"On planned policies, rising fossil energy use will lead to irreversible and potentially catastrophic climate change. We are on an even more dangerous track to an increase of 6°C [11°F]... Delaying action is a false economy: for every $1 of investment in cleaner technology that is avoided in the power sector before 2020, an additional $4.30 would need to be spent after 2020 to compensate for the increased emissions.” IEA
We will need to transition to clean energy to avoid high temperature increases and a resulting severe damage to world civilizations. As the IEA notes, delay is a false economy from the climate standpoint. Looking at the increasing marginal costs of fossil fuels, it would seem that delay is a false economy from the depletion perspective as well.
Now I know you're in the camp of doomers that believes alternative energy cannot replace fossil fuels. But if fossil fuel EROEI is on the continued slide down, there comes a point when alternative energy makes economic sense as well as environmental sense. And, from my view, that time is starting in around 2008 through 2015. To my mind, it becomes increasingly clear that dependence on fossil fuels is merely a political constraint foisted on us by special interests who are doing their best to milk the most profit out of a depleting energy resource. But this is a very dangerous game of chicken both in the economic and the environmental sense. The 1 trillion dollars in profits in the oil and gas industry over the past decade is being paid for with economic and environmental pain and suffering. It really is, as the IEA says, a false economy.
Finally, one last point... If China can invest 30 billion dollars and pump out solar panels for less than 1 dollars per watt and declining, then it shows that investment can really change the cost paradigm. Though not magical, economies do scale and I think we would be better served to start scaling them now and not fifteen or twenty years down the road. In any case, unless we start comparative investments to China's, we're almost certain to see our lunch eaten once climate change starts to bite harder and it becomes clear as day we need to rapidly transition.
Gail, thanks for the informative post as usual. Although I'm still on the upward part of the learning curve when it comes to the various aspects of energy production there are some worrisome things that I'm beginning to notice. First is that you noted that not all of the liquids have the same energy density. If you were to plot all of the liquid production in terms of energy rather than barrels, would we in fact be in a decline as opposed to to our curent undulating plateau??
OldLeatherNeck,
Liquid fuels net BTU production up until 2010 on this link (oilwatch monthly, see page 4):
http://www.peakoil.nl/wp-content/uploads/2010/04/2010_April_Oilwatch_Mon...
Rising production but stagnating net energy production. Data dates from 2010 though.
Xardas,
Thanks for prompt response.
What might be more enlightening still would be net total energy from liquids (after EROEI approximations), net total energy per head of population and net total energy with some allowances for present pollution and future cleanup impacts. I've seen charts for volumes of oil per head but not against net energy and I can see there would be inevitable controversy in how the EROEI and pollution allowances were included; but they would give a more realistic and global picture of the issues.
I took your suggestion and used the new EIA data to make the following graphs. I didn't do anything with pollution, though.
I used these assumptions:
C&C yields 5.9 MBTU/bbl;
NGPL yields 3.8 MBTU/bbl;
Other Liquids yields 4.0 MBTU/bbl;
EROEI declines linearly from 25:1 in 1980 to 15:1 in 2011.
I used world population figures from Angus Maddison, updated with 2010 and 2011 numbers. I omitted refinery gains since they don't add any energy.
First the gross production:
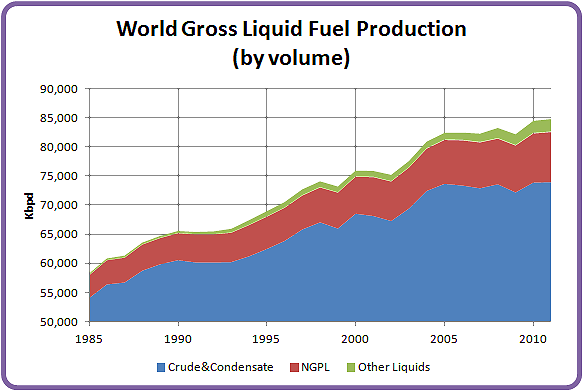
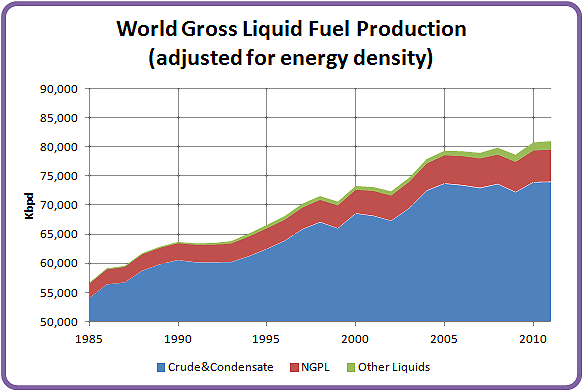
Now the gross production adjusted for energy density:
Now the net production accounting for energy density and EROEI:
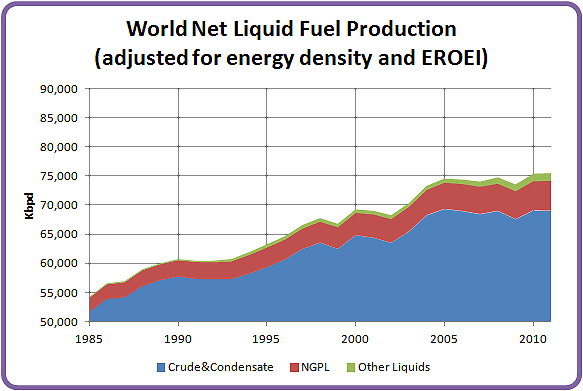
Finally, the total net energy derived from the above graph divided by world population:
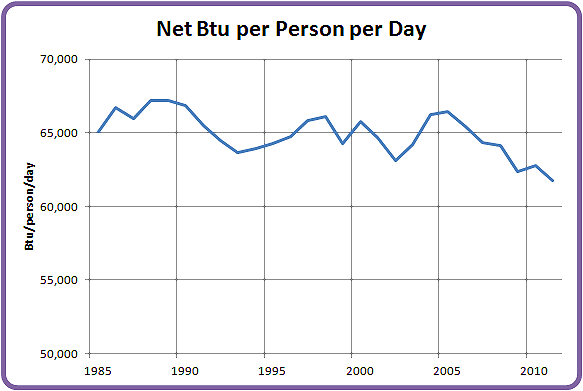
The story is quite clear: net energy from liquid fuels plateaued in 2005, and net energy per capita has been dropping rapidly ever since.
Net energy per capita dropping but the pundits talk about people using more energy. So if some are using more then who is using less?
NAOM
i think it must be the poor people in various (oil importing) countries in the world who cannot buy fuel with current prices anymore. also since net exports outside china and india has decreased significantly this leads to the same conclusion. however, i have not seen any hard data how this diminishing consumption is distributed around the world. does anyone know of such data?
The largest decline in energy use is in the USA. Imports are down about 4Mbpd but domestic production is up by only 0.5Mbpd.
Europe as a whole comes second.
Most other parts of the world have rising energy consumption.
This is really no surprise because the US is by far the most profligate user of energy of any large, oil importing nation. Lowest hanging fruit.
Toyota is introducing a hybrid version of the Yaris this year, quoted at 81mpg (imperial). It is using a 1.5 litre engine in a car which could be powered by a 0.8 litre engine, so further efficiencies are clearly possible. (My car is larger than a Yaris, has a 1.2 litre conventional diesel, and gets 83mpg (imperial) (with very careful driving. I did 350 miles yesterday in it and got 78mpg ).
Consumption is about having the funds to buy oil products. In my view, oil tends to go to where the jobs are. There are two reasons for this:
1. Oil is used in manufacturing and transporting products.
2. Employees who are earning good salaries have the money to purchase products made with oil, and goods that are transported with oil.
As a result, countries struggling with job loss are the ones with the biggest reduction in oil use. Ones that are adding jobs tend to increase their job use. The WSJ recently had an article about how multinational firms had emerged from the recession more profitable. Their technique was to lay off more US workers and hire more overseas workers. The article is For Big Companies, Life is Good Large Corporations Emerge from Recession Leaner, Stronger—and Hiring Overseas.
Apart from jobs, federal spending can help keep oil use high as well, if the government can continue to borrow money, and thus keep up their expenditures. Part of this goes to salaries, and thus helps for jobs. But part also goes for things like highway funds and military expenditures, which use oil products directly. Countries like Greece that are having trouble borrowing are doubly hurt on oil use.
Ralph you need to consider two points about the Toyota hybrids. Firstly making comparisons between diesel and gasoline engines by volumetric terms is not accurate.Specific fuel consumption Comparisons should always be made on a mass basis. Per Kg gasoline has a slightly higher calorific value, typically 43-44 MJ/ Kg and diesel 42-43 MJ/Kg. Gasoline has a density of about 0.75 Kg/Ltr and diesel about 0.84 Kg/ Kg.. Thus on mass basis the gasoline is much closer to diesel in specific fuel consumption. In your example the Yaris is 23.7 miles/Kg and for your diesel example 20.4 miles/Kg. The Toyota hybrids use a special engine that operates in the Atkinson cycle which over expands the power stroke. This is done by some clever valve timing where part of the induction air is expelled form the cylinder into the induction system. This allows the engine to a hive higher thermodynamic efficiency but requires typically a larger displacement.
New gasoline direct injection technologies will further close the gap between gasoline and diesel which on a spefic fuel consumption basis will make gasoline engines more attractive. I have a foot in both camps. My wife drives a Yaris diesel and I drive a Prius. My Prius is averaging 18.0 miles/ Kg over 12500 miles or 64.5 mpg imperial.
Glider--what you have shown is net energy from oil and other liquids, per capita per day.
Energy use from coal, natural gas and hydroelectric is rising to offset this decline, even on a per capita basis.
This is my image of long-term world per capita energy consumption from my post World Energy Consumption since 1820.
I don't think there is enough data out to calculate per capita energy consumption for 2011 yet. The EIA puts out world energy production and consumption in Btu (see International Energy Statistics), but that data is available only through 2008. BP puts out consumption data in barrels of oil equivalent. That data is available through 2010. (The later, plus estimates of traditional biofuel not counted based on Vaclav Smil information, is what I used in the above graph.)
On a year by year basis, this is what total energy consumption per capita looks like through 2010, using BP data converted to joules (without any addition of missing biofuel data), from the same post.
Correct. I'm looking just at the net energy from liquid fuels - C&C, NGPL and Other Liquids. I think it's important to separate out electricity and fuel energy, and consider them independently.
I don't think electricity will offset that much fuel use over the next decade or two. Instead we'll see a slight growth in fuel efficiency and a (perhaps dramatic) decline in VMT.
I am curious about some of the non-traditional sources now being explored.
Recently BP announced a US $7.2B deal with Reliance Industries to explore off-shore oil and natural gas blocks in India.
Also off-shore explorations in Mozambique has recently been announced.
While these will take time to fruition, how would they change the medium term supply outlook?
If history serves as a predictor, the deepwater wells will take a long time to fruition, and will probably not have a very large impact on world oil supplies.
Quite a lot of new production in recent years has been deepwater, but world oil supply has not been growing by much at all. You can see how much deepwater I am showing for the US in Figure 6. Deepwater production did help slow the decline in the 2000 to 2004 period. Deepwater production is down quite a bit in 2011, after the ban on new drilling--you have to keep drilling, or it drops off quickly.
Angola is a star in the deepwater production area. Their production hit a high of 1,981,000 barrels a day in 2008, but was down to 1,786,000 in 2011. Deepwater takes a long time to develop, produces for a fairly short time, and then drops out.
If production is flat and oil production has been rising in the USA then where has it been dropping? A quick look at the graphs shows that Europe seems to have had quite the drop-off. I guess that helps explain their financial troubles as well.
Any other places where there has been a significant production drop off?
"If production is flat and oil production has been rising in the USA then where has it been dropping?"
Per the graph, "dropping" isn't really the right word, because it was still rising, just at a much slower pace. But there are plenty of areas in which production has fallen. I usually look to the BP Statistical Review for what's happening on a country-by-country basis.
Declining oil production is a very common situation.
Among trading partners of the US in the Americas, the following come to mind. All have had deteriorating political situations:
Mexico reached a peak of 3.5 million barrels of oil per day in 2004, and now is down to 2.6 million barrels a day. It was one of our major import partners.
Venezuela's oil production declined from 3.3 million barrels a day in 1997 to 2.2 million barrels a day in 2011.
Ecuador's oil production reached a peak of 536,000 barrels a day in 2006, and is now down to 500,000 barrels a day.
Around the world, countries with reduced production are often ones with political problems:
Egypt's oil production declined from 921,000 barrels a day in 1996 to 512,000 barrels a day in 2011. It is now a net importer.
Syria's oil production declined from 582,000 barrels a day in 1996 to 301,000 barrels a day in 2011.
Yemen's crude oil production declined from 441,000 barrels a day in 2001 to 249,000 barrels a day, before the pipeline problems (related to security issues) in mid 2011.
Libya's production hit a high of 1,736,000 in 2008, three years before the oil supply disruption in 2011.
Some others with declining production include:
Australia's production has declined from a peak of 722,000 barrels a day in 2000 to 359,000 barrels a day in 2011. This may be part of the reason for ramping up coal and natural gas exports--to pay for oil imports.
Indonesia's oil supply has been declining since 1996, when it hit a peak of 1,547,000 barrels a day. Its supply was 896,000 in 2011.
Malaysia hit a peak of 755,000 barrels a day in 2004, and is now down to 508,000 barrels a day.
Viet Nam hit a peak of 403,000 barrels a day in 2004, and is down to 309,000 barrels in 2011.
Thanks for the list. Other than Venezuela and Mexico those mostly seem like small players . . . but I guess it all adds up to significant production declines.
Also, looking at that list, I get a little bit more sympathy for the "above ground factors" argument from the Cornucopians. I suspect many of those countries could stem declines or maybe even rise a little if they were more politically stable, allowed outside investment, and applied the latest technology to their fields. But from a consumer perspective, it really does not matter one iota whether the problems are above or below ground.
I can definitely see resource wars brewing though. If you are a little country with good oil resources and you are not exporting it for whatever reasons, I could certainly see importing nations leaning on them and trumping up reasons for regime change.
Your post make me think of the resource curse problem. If there are valuables (oil, dimonds, metal ores etc) in the ground, you will attract many problems: foreign invaders (military or corporation), corruption, civil war, organized crimes, despotic and inefficient regimes (E Guinea) and so on. So my question is; are not these unstble oil exporters unstable because of oil in many cases?
No way. No Australian government thinks like that. Exploration & production in Australia are regulated by the market, pure & simple*. As far as the various governments in the country are concerned, there is only one policy setting when it comes to mining & oil: put the pedal to the metal. Uranium used to be an exception, but they've decided to go all out for that, as well.
Because of Australia's huge reserves of coal & natural gas, there has never been a serious push to look strategically at oil supplies. When politicians and senior public servants have looked at the issue at all, the thinking has been "We're a net energy exporter and will continue to be for the next century at least. We profit from higher energy prices, so we're not worried".
* Except when the Great Barrier Reef comes into it. The Right-wing populists, who think greenies are perfect candidates for spit roasting, turn around 180 degrees when there's any threat to the Reef and become its most ardent defenders.
"Australia's production has declined from a peak of 722,000 barrels a day in 2000 to 359,000 barrels a day in 2011. This may be part of the reason for ramping up coal and natural gas exports--to pay for oil imports."
The ramp up of coal and natural gas is due to increasing demand from our Asian neighbours - but, you are right that it certainly helps our balance of payments.
I think part of the reason for the high demand from the Asian neighbors for these fuels is because oil is so expensive. Another reason is that the OPEC countries and signers of the Kyoto protocol are pushing industry their way. As a result, they have the need to use more coal and gas to support their increased manufacturing. The additional coal and gas also supports the higher standard of living that they can maintain, because of all of the new jobs they are getting from outsourced manufacturing.
Once again, Gail is attributing central planning to market capitalist economies - without evidence to back it up. People who pay attention to what political actors are doing know that governments in every industrialised country are doing all they can afford (and, in several cases, a few things they can't) to keep manufacturing within their borders. If industry is shifting to China and other Asian countries, it is despite the intentions of OECD countries, not because of them*. The only deliberate decisions reducing greenhouse emissions that were connected in any way to the Kyoto protocol were:
(a) Britain's closure of its coal industry;
(b) Germany's closure of its brown coal industry after re-unification; and
(c) The de-industrialisation of Russia after the collapse of the USSR.
In each of these cases, these things happened, or became inevitable, before the Kyoto Treaty. Because they were locked in, though, Russia & the EU could afford to sign the Kyoto Treaty without having to take any other measures to ensure compliance. The actual compliance measures incorporated in the Kyoto Treaty were quite minor in comparison and were mostly in the nature of facilitative actions, which would help substantive actions to be effective, but the substantive actions on which they relied have been too long coming. Surprise, surprise.
* Indeed, we can see the glee with which the US capitalist class is reacting to a resurgence in US manufacturing on the back of newly-cheap natural gas.
To be frank, some companies in Asia are running in a different way (maybe) to their western counterparts. They are politically motivated instead of profit motivated. That is, their leaders can only maximize their personal benifit by persuing some political goal instead of maximizing profit. Like persuing "100% homemade (or made by homeland) parts" is something very common in Asia, althrough this practice is not as profitable as having a global supply chain.
This is a tricky issue. Pursuing 100% local supply chains is typically driven by governments, not corporate policies. And it often a way of enriching local tycoons who may well have paid for the priviledge. In that regard, it is very profitable, it just doesn't show up on the P&L of the company making the purchases.
Corporate leaders (and government regulators) have a whole range of ways that they can and do "maximize their personal benefit" through creating side businesses and hiring them, taking bribes for contracts, etc.
Yes, the overall economic structure is different in a lot of ways, but it is naive, in my view, to look at this as some form of overarching benign social policy (not that you necessarily are).
Did you guys noticed that most of your Asian neighbours up north are building LHDs and LHAs like crazy?
Presumably the Australian Government does. It's having two Canberra class LHDs built itself:
. http://en.wikipedia.org/wiki/Canberra_class_Landing_Helicopter_Dock
US Crude oil production broke the 6 million barrel per day level two weeks ago. It is now at about 6.1 million barrels per day. The highest level in twelve years.
http://nextbigfuture.com/2012/04/us-crude-oil-production-back-over-6.html
Texas is up at around 1.15 million barrels per day and various discussions (some from the Texas railway commissioner) are talking about 2-4 million barrels per day by 2016.
http://nextbigfuture.com/2012/04/oil-production-for-texas-alaska.html
Another record month in North Dakota. February at 558,254 barrels of oil per day
http://nextbigfuture.com/2012/04/north-dakota-oil-in-february-at-record....
Iraq oil production was at 3.1 million barrels per day and they expect to end 2012 with 3.4 million barrels per day and have a 4 million barrel per day target for 2013.
Exports were at a record 2.3 million barrels per day and will export 2.6 million barrels per day by yearend. The 2013 exports should be about 3 million barrels per day but they will have to start OPEC negotiations.
http://nextbigfuture.com/2012/04/iraq-exports-2317-million-barrels-of.html
All true, but I'm not sure what the point of your post is. Isn't it a shame that the increased U.S. production is being refined and exported? Exports of refined petroleum products are up about 2 mbd since 2006 when the U. S. started tapping all that oil. I know it's good for the refiners who are making a good profit, but I sure wish they would leave some of the stuff in the ground for my kids and grand kids -- unless you actually think the growth in production is going to continue. Do you?
Iraq and the U.S. are about the only countries in the world that have the ability to increase production -- Russia is flat and likely to decline, China is flat and likely to decline, Saudi is flat with declining exports (your cue, WT), everybody else appears to be producing flat out. The only thing that will really matter going forward is how steep or flat the world decline curve will be and how much we can adjust to continued high prices.
The USA is a net crude oil importer. Those refiners are essentially importing crude oil, refining it, and then re-exporting it.
Isn't it a shame that the increased U.S. production is being refined and exported?
A lot of the refined products currently being exported are made from imported crude oil, and re-exported.
The point is that there is more up to date information.
Saudi Arabia – 11.2 mbd
Russia – 10.2 mbd
United States – 10.1 mbd [10.42 mbd now]
China – 4.3 mbd
Iran – 4.2 mbd
So the US is probably number 2 after Saudi Arabia on oil liquids.
If Texas delivers the increases that the commissioner is talking about and North Dakota continues its trend and the other oil shale areas increase as well then it is very plausible that the US could become the #1 crude oil producer. It can also mean that there will be a new peak in US oil production which runs counter to the peak oil theme of it peaked in the US and will peak for the world and never get back to those levels.
US biofuels and synthetic fuels will also be increasing.
Canada's oil is increasing.
Technology for oilsand extraction and horizontal drilling are both improving.
The tight oil is also in China, Australia and other countries. This is being adopted elsewhere. California also has a lot of tight oil. Once Occidental sells to more aggressive companies like Continental then California oil production will go up in spite of the lack of offshore drilling.
World production could stay high and slightly increasing for quite a while. The US no longer being a big importer means that the export land problem will not hit the US. The collapse of some countries production means problems for Ecuador and those other countries who were never critical to the global economy. It will be bad for them. Europe and Japan have to figure something out. But Germany and Japan are screwing themselves with how they are handling the nuclear situation. Europe will have to shift to more gas. Either they get their own for shale which they have in France or they get it from Russia. I am sure Russia has a lot of oil shale and shale gas, which they have not bothered to look for yet.
I am not sure what you mean exactly - perhaps shutting down current nuclear power facilities in light of the Daiichi-Fukushima disaster?
On a related note, new nuclear power installation for countries have several constraints that are not much talked about - aside from the public perception issues. In US the application process takes a minimum of 4 years. In India, the country of my birth, while the regulatory processes are probably sped up, there are production issues - that go across countries. From a 2008 article in Bulletin of Atomic Scientists by Matthew Wald:
I don't know what the solution is to the power needs for developing world countries like China, India, Indonesia, etc.
We at Caltech are working on a new concept of powering the planet with water: using sunlight and catalysts to split water into H2 fuel, and using a membrane to separate H2 and O2 at source generation. Then H2 can be combined with atmospheric O2 in a fuel cell to produce electricity at will, with water as byproduct. It is C free. See NSF Center for Chemical Innovation: Solar Fuels
A "nuclear" disaster that killed no one.
It was the tsunami and earthquake that killed people.
Definitely make it safer. Have diesel and fuel tanks in underground tanks that cannot be washed away.
But reducing the nuclear that was supplying 30% of electricity has spiked oil and gas imports.
They are choosing to mess up their own energy supply balance and ramping up their imports and dependence.
But what about the long term radiation effects ? How about the increase in cancer from air pollution from cars and trucks. Why only care about one kind of death and health impact ?
Japan will remediate the soil
http://nextbigfuture.com/2012/01/toshiba-has-device-that-removes-97-of.html
"A nuclear disaster that killed no one" - YET. Cancer takes time.
"Japan will remediate the soil" - I'll believe it when I see it. The linked device is primarily for water. I rather expect that they will figure out very quickly that they can't afford to remediate the forests and fields of Fukushima and will do what the Soviets did - fence it off and wait it out.
I would like to remind you that Japan is a small place, and can't afford to lose its land in nuclear disasters. The tsunami can be cleaned up, and people can always prevent a similar level disaster by moving to higher ground (several villages in the area actually had no fatalities, because they heeded their ancestors warnings which are ALL OVER THE PLACE and did not build on lower ground). The nuclear disaster can be avoided by not building nuclear plants.
They can use less electricity. In fact, that's what is happening in Japan. Nobody thinks it's worth it to have a nuclear disaster for the sake of advertising and vending machines. Yet, that's what it amounts to.
you have outdated information about nuclear.
There are many heavy forgers now
http://www.world-nuclear.org/info/inf122_heavy_manufacturing_of_power_pl...
Over 30 heavy forging set can be produced per year now. A bunch of makers in China, Russia as well as Japan. South Korea as well.
Also, the fact that the US is slow to license and build nuclear reactors is not what matters to World nuclear.
China, India, Russia and South Korea are making the most new reactors. China and India are the countries adding the new power of all kinds. When you have 10% GDP growth then you add 8-10% power. Be it coal, hydro or nuclear.
The US adds 1% and Europe may 0-1% on energy each year. So of course the US and Europe are not making many new reactors.
China and South Korea have mastered the new building block approach and have reactors constructed in 4 years. 300 large factory mass produced pieces that are assembled like large legos on site.
China is developing factory mass produceable pebble bed modular reactors.
China will start exporting nuclear reactors in 2013.
Then the China and South Korea prices for nuclear reactors will dominate export markets like the middle east and other emerging (growing) economies.
The CPR1000 and variants of that reactor are the ones that China will export.
The price are about $30 per MWh to build.
Hi All,
This thread is veering off-topic due to a casual mention of nuclear.
That conversation should go to the current Drumbeat.
Best regards,
Kate
well... at least Koreans (Doosan) can make reactor pressure vessel for AP1000:
http://www.cec.org.cn/hangyeguangjiao/kejixinxi/2011-07-25/60497.html
and we Chinese are start to make them on our own:
http://www.chinaequip.gov.cn/2009-06/17/c_13147226.htm
(the first few from CFHI didn't past QC test and have to ask Doosan for help, which delayed powerplant project for few monthes. But after a while it is getting better)
That is not crude oil production that you are citing. That is total liquids. US is producing around 6mbpd C+C, see figure 5. The US would have to nearly double production of C+C to be the #1 crude oil producer. As Gail mentioned, these other liquids that are substituting for oil have lower energy density. The US will not reach 9.6-10mbpd of crude+condensate production again.
A disinformation campaign has also ramped up into high gear. Please do not confuse liquid fuels with crude oil + natural gas condensates. EIA data is also suspiciously higher than other sources. The EIA has a reputation of releasing production data that is revised downward months and years later.
I really wonder about these short term (and for that matter, long term) EIA production numbers, since many state regulatory agencies, example the Texas RRC, don't report data for several months, and in fact the RRC has not provided a 2011 annual crude oil production number.
In any case, if I don't count my dry holes, I have a 100% success rate, and if you only look at countries and regions with rising production, we are showing a substantial increase in global crude oil production. Come to think of it, if I don't count my monthly expenses, I have one hell of a disposable income.
Here are recent annual net export numbers for Iraq (BP, Total Petroleum Liquids):
2005: 1.3 mbpd
2006: 1.5
2007: 1.6
2008: 1.8
2009: 1.8
2010: 1.7
2011: 1.8*
*Estimated based on EIA production data, and extrapolating current rate of increase in consumption
And a look at Consumption to Production ratios:
http://www.theoildrum.com/node/9110#comment-886600
The key thing about increased US oil production rates is that it is moving the oil production from the future into the present. What could have been produced and consumed in the future is being produced and consumed in the present, instead. However, on the international scene the supply is tightening up and imports are becoming less affordable because of increased competition for limited supplies.
The US always had the option of restraining its oil production and leaving it for future generations, but it never did. The result is that future generations will have to get by on much less oil than their parents. I get the impression that the younger people are adapting to this situation by moving to inner city areas, not buying cars, and sometimes not even learning how to drive. Their lifestyles will probably be quite different from their parents - no more big house in the suburbs and two SUV's in every garage.
The positive factor about it is that younger people are much more adaptable than their parents, and will probably have no problem with walking, bicycling, or taking transit to work, shopping, and recreation - while their parents will be horrified at the prospect of not being able to drive.
Certainly Texas and North Dakota are up recently, but over the last 10 years (2001-2011), Alaska crude oil production dropped by 364,000 bpd; California production dropped by 178,000 bpd; and Federal Offshore production dropped by 218,000 bpd. The net result is that US crude oil production was down 142,000 bpd over the last 10 years.
This last monthly uptick in production was quite large, so you have to go back to 1998 to find a year with as much production.
It doesn't help to look only at the bright spots, you have to look at the overall picture.
As noted up the thread, I have a 100% success rate* in my drilling efforts.
*If I exclude my dry holes.
Gail,
it was not clear to me whether when you add up the various components you adjust for the different energy content of the components i.e do the numbers reflect volume not energy content? If so what would the charts look like if the numbers were based on energy equivalent of a barrel of crude. I recognize that every barrel of crude doesn't have the same energy content but are the variances greater than between crude and ethanol or NG
The amounts are volume, not energy content.
The ethanol and NGPL could be adjusted by 60% (ethanol) or 70% (NGPL) to bring them down to a more realistic energy-based figure.
I am not quite sure what you do about the processing gain. My inclination would be to leave it out, since it doesn't generally add energy content, and it arguably belongs to the country whose oil expanded in volume, rather than the country which happened to process it.
Since no one else wants to play the contrarian troll here, allow me:
Total world oil production is still rising --now up to the highest level ever in history-- and all you Doomers can say is "World oil supply is not growing very much"? Good grief! What will it take for you people to concede you were wrong and that Peak Oil is a liberal Luddite myth? Julian Simon and the technocopian optimists were right and always have been --eat that, Doomers!
/Troll off
Harm, I agree. The sky is hardly falling. Not yet, anyway :)
>Not yet, anyway.
That's the key. Harm makes some valid points, but I'm looking a bit farther into the future than right now. I'd be very surprised if you could make the same statements 30 years from now, and that's in my lifetime (hopefully) and certainly in my children's lifetime.
Just because the sky's not falling yet, it doesn't mean Peak Oil is dead. I find it's relatively easy to communicate that idea, even to non-technical people. As long as no new oil is being made in them thar rocks, we can't keep pumping it out faster forever. That's an inescapable fact, not a theory.
Thanks for the giggles...
Harm and JN2
That sky remains just high enough for individuals to prep and make plans for personal adaptations for best guess scenarios. IMHO. I am surprised that the plateau remains so benign; of course I am still lucky enough to have a job and my life still seems everyday.
I thought the results would be worse by now, and am somewhat thankful for the delay, Climate Change noted, of course. It is easy to assume that doom outlooks appear wrong given the short attention span folks have and the plateau. Maybe it will continue to unfold slowly and allow time for individuals to adjust.
I still cannot believe predictions of 9 billion for the not to distant future. Surely, limits are obvious to social scientists and our leaders.
Do you think that accepting limits to growth appears doomer to the boosters of infinite growth and rising GDP? I must live on another planet some days.
Regards...Paulo
Yes. But don't take my word for it, go check out Conservatopedia, Club for Growth, American Enterprise Institute, Heritage Foundation, Cato, etc.
HARM - Valid point IMHO. I suppose you might classify me as a schizophrenic peaker. Short term (4-8 years) I'm rather optimistic about increasing oil supplies. I should be: just in the last hour I sold my owner on an EOR project targeting over 1 billion bbls of residual oil in a Texas trend. In fact you might call me a raving oil increase fanatic. But just short term. My owner's most pointed question: why hasn't someone already did my project? Very easy answer: $100+/bbl oil. And as long as oil stays up there most of the shale plays will keep bumping along. But eventually all those projects that required $100 oil to be developed will be developed. Then what...wait for $200 oil and go after what's left?
I don't see long term relief. The difficulty in sustaining the shale plays by the pubcos is becoming more obvious to me. Chesapeake may be making some profit from their operations but their own press release seem to paint a clear picture of insufficient capex to keep going at their current rate. As a result, IMHO, they have sold off at least $5 billion of the hot shale trends in order to keep drilling. That just doesn't smell like sustainability to me.
Deep Water oil development also seems to have a bright future. But it takes decades for the oil from those fields to hit the market. In the meantime depletion and ELM don't stop. New areas are being tested and some will certainly turn up some large discoveries. But I think it's very unlikely we'll find enough to come close to repeating what we've done globally the last 80+ years.
I've always been more of a plateau guy than a Peak guy. And I have trouble seeing a cliff in the future for that plateau. What I see is a bumpy but generally declining plateau when viewed in 10 year increments. I see the political/economic/military aspects having as much or more impact of our energy future than geology will have. But those aspects and geology are ultimately connected at the hip IMHO.
I just turned 61 yo today. I see a very rosy future for me with respect to energy. But my years are limited. OTOH I wish I could be more optimistic about the future of my 12 yo daughter.
Happy Birthday. Thanks for all the info and may you have many more good years to share.
Thanks Paulo. If I had known I was going to live this long I would have been an engineer and not a geologist. LOL.
Well, happy birthday to you sir! Hope you're right about the bumpy plateau. But, doomers or not, at least we're Americans with much better options than most of the world's inhabitants --have to be optimistic about that!
Rockman,
Happy birthday! Re: plateau - not such great news because Asia is going to take a larger and larger share of the oil - meaning, in practical terms, our remaining share is smaller and smaller - and, probably, oil prices are going higher. Combine that with the increasing appetite for oil consumption by the oil exporters and we may have a real problem.
On the optimistic side the US seems to have reduced it's appetite for oil significantly without that much pain. Also, I believe at a high enough oil price many more GTL and CTL plants will come online and perhaps lessen the slope of the liquids decline. A high oil price will also encourage more ev use, use of ng as a fuel, and more efficient vehicles.
I wish I could say that your daughter won't face a prolonged worldwide recession/depression - but to me the numbers look bleak.
I wonder what you mean by a high enough oil price. GTL is still an expensive route to fuels and always will be. The thermodynamics will ensure that as plant costs are off the scale, in excess of $75k per installed barrel. Gas at $5 per million BTU is equivalent to $250 pmt. At that price the economics of a GTL plant are marginal, and as oil prices rise so will the demand for gas. If Arthur Bermann is correct, and I certainly believe he is, then the prospect of cheap shale gas lasting for 100 years will be a dream.
Look at the evidence to date. The number of GTL plants is still miniscule and is likley to remain that way. The total installed capacity is still less than 500 kbd and many of these plants are producing speciality products of which there is only a small market. A 10 fold increase in cpacity would saturate these markets and destroy margins.
Looking at the process also introduces limits as to the size of each unit. They do not scale well and the limit is about 70 kbd per train, and it would be doubtful if they could go much bigger.
Happy Birthday Rockman, my husband shares your view, he is 67 this year, with 14 year old triplets....
Hi Rockman, I'm half way through my 61st year, it's been great so far and I hope yours is a good one too!
$100 oil, aye there's the rub.
I spend about half my reduced online time reading TOD and the other half looking at TAE. If Stoneleigh and Illargi are on the ball, and their predictive track record is pretty good so far, then we are in for one heck of a global compressive deflationary contraction which would see a big fall consumption, a fall in the demand for oil, a collapse in speculative oil positions and probably a big fall in its price.
What would your owner be saying to you if oil fell to half its current price? If the true cost of producing the marginal barrel today is around $90, would you still be be working? I remember your stories living on peanut butter sandwiches when the oil price collapsed in the 80s. At $50 a barrel would we be left with just the depleting giants?
How do you see the interaction of peak oil and peak debt panning out?
I too worry about my kids, my youngest is just into her 20s, but I'm not as doomerish as I was 6 years ago when I first started with TOD, but then I'm not fixated these days with my online reading as I used to be (ever since my wife described my obsession as 'Disasterbation')
Now I'm in the garden about 10 hours for every one in front of the computer and healthier and happier for it. And if the apocalypse arrives early at least I have lots of cabbages!
Hi i hope you are not following only Stoneleigh's suggestion for any investment because if so you are being not diversified enough. It is likely indeed that there will be a temporary deflationary contraction but this will be quickly turned into hyperinflation when the central banks around the world intervene. Although i am quite young (30+) and should be full of energy, i am feeling more apprehensive over the past few years.
It seems that we are precisely following the standard case of the limits to growth. The recent 40 years limits to growth anniversary video is worth looking at. Dennis Meadows said that it is too late for sustainable development and we could only try to increase the resilience of the system. It would seem that even if we succeed in increasing the unconventional oil for a 5-10 years oil plateau bubble the consequence of the increased pollution of CO2 emission and water scarcity and many others would lead to far reaching consequences.
ps - So far so good this year. My owner's biggest complaint is that we aren't finding enough prospects to spend his money on. The drop in NG has made that situation much worse. Were it not for the condensate yield from our NG wells we wouldn't be drilling any NG prospects. If the price of oil (our condensate is selling for Light La. Sweet...$120+/bbl) drops significantly we might not be drilling anything but pure oil prospects...and those are very rare these days. One reason he decided to jump on my EOR project.
I think the capex availability situation could have a huge impact especially if there's any softness in oil prices. Many of the new projects (Deep Water, fractured shales, and remote exploration) require large capex exposures. The capex sources may restrict exposure for fear of another recession pushing consumption (and thus oil prices) down. It can then develop into a self fulfilling prophecy: less consumption/lower prices lead to less drilling that leads to less reserves that leads to higher prices that hold back economic growth etc, etc.
Let me give it a shot and say maybe Peak Oilers are wrong but that's doesn't solve the energy problems. Ok I'm a Peak Oil guy even though I don't know if we are there yet, maybe I'm a Peak cheap oil guy, but the real problem is excess capacity and the quickness that bottle necks can affect the oil market. The lack of belief in the oil markets of a true moments notice excess capacity thats available at the flip of a switch, means that even the perception of a possible future stoppage of oil production or shipment causes wild swings in energy prices.
If speculators think Iran is getting ready to get bombed it doesn't matter if we are at peak oil or not and the price jumps, because we don't have excess capacity. If a cat-5 hurricane is coming into the Gulf of Mexico ditto the last sentence. So Peak oil or not the price mechanism in economics makes extreme adjustments for even minor shortages or even percieved shortages in the future.
I think it was Matt Simmons that often said that a 4% decrease in oil production during the 1970's oil embargo caused a 400% increase in oil prices. So a narrow just in time shipping strategy for oil can get tricky when the unexpected happens.
I think the short answer is price, that little detail that every peak oil contrarian likes to overlook, distort, or marginalize. Ignore price, and like magic, supply will always meet demand. This is in spite of the generally accepted fact that we can't sustain the growth to which we've become accustomed at $100/barrel. At some point the dents in growth due to rising oil prices accumulate until they add up to global economic contraction; the tipping point where all bets, especially financial ones, are off. I don't know what that tipping-point price is, or how long we need to pay it before the checks start to bounce. Maybe we're already there. Maybe we can raise that price through efficiencies and substitutes and stretch this plateau out for another generation or two. But the price alone should give one plenty of pause in attempting to deny Peak Oil, regardless of production or even the finite nature of the resource.
So, show me oil at $80-$90/barrel for a year or so without some serious demand destruction and I'll admit the whole thing was for suckers.
Peak oil will come, but seemingly not in the near future.
By defintion everything that is finite in quantity (and cannot grow) will reach a production peak.
In 30 years we have more problems to face with rather than oil.
In 30 years controlled nuclear fusion MAY become a reality and the human race can solve the energy problem once and for all. Who knows? Of course then comes the global warming problem, maybe.
Don't attack me on that, once on the web I see some experimental production fields growing oil from algae at $800 per barrel. That is of course too expensive, but it is not the end of the world.
What is the price per barrel of ethanol (growing from corn) now? Is a $200 / per barrel a good guess?
Taking precaution is always a good thing, but keep screaming for doom days like the end of the industrial world, in my opinion, is not a healthy attitude. That is healthy if you want something to believe, or if you are long oil futures at the futures markets.
That $100 oil price is high, but I just wonder what todays's $100 worth, for example, in the 1980s, after taken into account inflation? I am amazed how successful the western world have robbed the middle east of cheap oil for decades.
Keep wake up tomorrow and watch the beautiful sun, HARM, because the sun will also end someday.
That $100 oil price is high, but I just wonder what todays's $100 worth, for example, in the 1980s, after taken into account inflation? I am amazed how successful the western world have robbed the middle east of cheap oil for decades.
Here are a couple of inflation calculators. They don't agree with each other perfectly but do well enough...enjoy, but be careful they can be very depressing tools if you happen to have had fairly stagnant income for a while.
http://data.bls.gov/cgi-bin/cpicalc.pl
http://www.westegg.com/inflation/
Thanks for the links. Messing around a little I looked up an old McDonald's menu to test them out.
McDonald's Amazing Menu____1960_____westegg_2010_____CPI_2012
Pure Beef Hamburger________$0.15_______$1.09__________$1.16
Tempting Cheeseburger______$0.19_______$1.38__________$1.47
Triple-Thick Shakes________$0.20_______$1.46__________$1.55
Golden French Fries________$0.10_______$0.73__________$0.77
Thirst-Quenching Coke______$0.10_______$0.73__________$0.77
Delightful Root Beer_______$0.10_______$0.73__________$0.77
Steaming Hot Coffee________$0.10_______$0.73__________$0.77
Full-Flavor Orange Drink___$0.10_______$0.73__________$0.77
Refreshing Cold Milk_______$0.12_______$0.87__________$0.93
Based on these numbers(if I haven't made any mistakes) it kinda looks to me like the amount of inflation has been understated.
Remember that governments take the time of year when inflation is at a minimum to use for their annual inflation figures. The figures may be higher for other months.
NAOM
Thanks, that helps explain it.
The CPI measures inflation of a basket of goods. Prepared food is a small part of that basket, and a single small part of the basket may have chqanged at a substantially different rate than the basket as a whole. Also, when discussing prepared food--portion size has also changed since 1960.
a bare to the bones pickup truck (that pretty much is all there used to be) seems to follow inflation pretty close since the 1950s--but I haven't checked on that in about five years. You'd find things like TV sets showing a remarkable counter inflationary trends... earlier this year (out of memory) I worked out my parents' first 13" or 17" (memory not flawless) diagonal color set purchased around 1970 and found it came in at the price of a good sized flat screen this year.
Since the non CPI (westegg) calculator goes back to 1800 the two together can be helpful. It is interesting to look at prices from about 1860-1880. I used the westegg to get to 1913 where the CPI begins and then the CPI to get to 2012
1860-$1.00 *1913-$1.10 *2012-$25.49
1865-$1.00 *1913-$0.65 *2012-$15.06
1870-$1.00 *1913-$0.78 *2012-$18.07
1875-$1.00 *1913-$0.90 *2012-$20.85
1880-$1.00 *1913-$1.02 *2012-$23.63
The prices between 1860 and 1880 are interesting. I was wondering why they showed deflation so I did a little searching. I'm guessing it's caused by something called the Great deflation which may have been caused by the Long Depression or maybe by the Second Industrial Revolution. The exact cause was a little unclear to me. Still, I learned something new which is always a good thing.
I just happened into that deflation fiddling with the calculator years ago-I had the vaguest remembrance of learning of some fiscal turmoil during some of those years in a history class.
I'm guessing the big inflation surge during the Civil War had something to do with the govt. printing a lot of unbacked currency and borrowing a lot more to pay for war goods, but it may have had something to do with the fact a whole lot of assets seceded with the South and that a lot of manpower was sucked in and that a lot of assets were flat destroyed by the war as well. The inflation calculator may be less than perfect but it shows it took over twenty years of deflation, until 1885, for the dollar to return to the value it had in 1861 (same as 1860). Inflation lowered the dollar value to a bottom of
1664-$1.00 *1913-$0.63 *$2012-$14.60
so the in three years of war it had lost nearly 43% of its purchasing power. The economics of the Civil War and for that matter monetary policy for the whole period seems worth a good hard look.
http://www.theoildrum.com/node/5177
What factors that make the above forecast fail?
How much years later will peak oil comes, 4 YEARS AFTER THE PROPOSED PEAK, taken into account of these factors?
Will there be any more new factors in the next 4 years?
More:
http://www.theoildrum.com/story/2006/6/8/155013/7696
Quote from that link:
"As we know, natural gas production has already peaked in North America."
"prof. Bakhtiari is forecasting Peak Gas to the 2008-2009 time-frame: After 'Peak Oil', 'Peak Gas' too"
Enjoy.
I dont know why people have such a blind spot when it comes to the distinction between Crude & Condensate versus Total liquids. The two are NOT THE SAME. The difference on a factual basis is there for all to see. On the other hand the numbers for total liquids easily fit into the BAU meme, so its seemingly used to disprove peak Oil. For me, who is neither invested emotionally or professionally in any "side" of the argument, it appears to be a very black and white issue. I can evaluate the difference between tight/tough/and lower quality liquids which are NOT OIL, very easily. I see it purely for what it is.
Crude production is struggling to grow and is statistically flattening on the present plateau, despite TWO DOUBLINGS in price since @ 2002.
Why is it that so many people cant grasp this? I think it goes to the heart of the problems we will deal with moving forward, not only as countries, but as humans on this planet. There is far too strong a Normalcy/Recency bias in humans. Its going to get in the way of any solutions IMHO and it troubles me as we face the future.
Fyi - my earlier "troll" post was tongue-in-cheek.
While we can all haggle over the exact date and what specific % of "proven reserves" can be economically extracted, I long ago accepted Peak Oil as proven fact. Nonetheless, I can predict with complete certainty that 99% of the population will look at that top graph as proof we *haven't* hit peak oil, and many a paid spokesman will use it as proof that Peakers are all full-of-it.
Perhaps it might be more useful to lead with a graph that shows only conventional crude production (minus unconventional -shale, tar sands, etc.). That might make it a bit less confusing for the casual reader.
How about maybe creating a graph that shows conventional crude (or even liquids anyway) year-on-year growth instead of absolute supply? People understand that when economic growth doesn't keep increasing year-on-year or even stay the same, that it's a bad thing. Certainly we can show how growth year-on-year has been tepid since the early 2000s, which maybe would better demonstrate the gravity of the situation.
We have seen two annual Brent crude oil price doublings since 2002, from $25 in 2002 to $55 in 2005, and then from $55 in 2005 to $111 in 2011.
In response to the first price doubling, we did of course see a substantial increase across the board in total liquids production (inclusive of biofuels), in total petroleum liquids, in crude + condensate (C+C), and in Global Net Exports (GNE) and in Available Net Exports (ANE). GNE and ANE numbers are calculated in terms of total petroleum liquids. ANE are defined as GNE less China and India’s combined net oil imports.
In response to the second Brent crude oil price doubling (2005 to 2011), we have so far seen a very slow rate of increase in total liquids production (up 0.5%/year from 2005 to 2010), virtually flat total petroleum liquids and virtually flat C+C production (through 2010), and a 1.3%/year and 2.8%/year respective decline rate in GNE & ANE (through 2010).
GNE fell from 46 mbpd (million barrels per day) in 2005 to 43 mbpd in 2010, while ANE fell from 40 mbpd in 2005 to 35 mbpd in 2010. (Top 33 net oil exporters in 2005, BP + Minor EIA data, Total Petroleum Liquids.)
Five annual "Gap" charts follow, showing the gaps between where we would have been at the 2002 to 2005 rates of increase, versus the actual data in 2010 (common vertical scale):
EIA Total Liquids (including biofuels):
http://i1095.photobucket.com/albums/i475/westexas/Slide1-18.jpg
BP Total Petroleum Liquids:
http://i1095.photobucket.com/albums/i475/westexas/Slide06.jpg
EIA Crude + Condensate:
http://i1095.photobucket.com/albums/i475/westexas/Slide05.jpg
Global Net Oil Exports (GNE, BP & Minor EIA data, Total Petroleum Liquids):
http://i1095.photobucket.com/albums/i475/westexas/Slide07.jpg
Available Net Exports (GNE less Chindia’s net imports):
http://i1095.photobucket.com/albums/i475/westexas/Slide08.jpg
I would particularly note the divergence between the first chart, Total Liquids, and the last chart, Available Net Exports (ANE).
Thanks, those charts are good for people already modestly chart-literate and P.O.-aware. However, for newbies I was thinking something more along the lines of this:
So how unconventional will the oil be when superfracking brings the cost of horizontal wells down from $2.5 million to $750,000 per well ?
http://nextbigfuture.com/2012/01/more-details-on-super-fracking.html
Thanks Harm, I love this chart (where have I seen it before?) Does anyone have the same data showing cumulative oil discovery and cumulative production? Cheers, Phil
AP
Your point on C+C and total liquids is valid and understated. They are not the same. Not at all.
To keep our creaking transport system and food chain functioning we need conventional crude. NGL's and biofuels are not going to make up the shortfall. Remember that most gasoline, jet and diesel is produced from conventional oil. Biofuels make up very little of the diesel supply, as does GTL, and yet the whole food chain is almost solely reliant on diesel.
There is no easy way of converting NGL's (propane, butane)to drop in transport fuels. Cars can be converted to LPG, some butane (reducing due to ethanol) can be blended into gasoline, but that is about it. CNG can be used in vehicles but there is no infrastructure of any consequence so it is limited. LNG can be used on vessels, but is not really practicle for road vehicles.
Processing NGL's and unconventional oils to current transport fuels is far more energy intensive, requiring signifcantly more energy in the upgrading process. A case of more is less. The more processing steps the less net energy available in the transport fuel.
Two weeks ago I attended a fuels conference and listened to offerings by Boeing and Airbus. These were deluded people, believing that biofuels would be able to provide them growth with zero increase in net carbon emissions, and yet be competitive with current jet fuel pricing. Only with subsidies in my view or a governement mandate for biofuel blending which is unlikely. Biojet is probably the most difficult biofuel possible and the current only real route is veg oil hydrogenation. Veg oils are not only expensive but supply is limited already and the much muted Jatropha is not working out as hyped. Try Googling New Mission Energy.
What concerns me most is that because Peak Oil does not appear to have happend on cue it is dead. What were most people expecting about Peak Oil. A precipitous decline? "Running Out" like an empty fuel tank? That was never the case. It might have been the view of some idiots but most serious Peak Oil followers recognised that a flattening of supply would precede the overall peak. We are seeing a Peaking in conventional supply, which is being moderated by stranded oil development , shale oil and ngl's, but as Rockman states they will be short term solutions and prices will rise to bring into play more short term solutions. But for how long. Depletion will still be there and eventually demand will outstrip the supply. We could have a decade of a plateau in supply but not at constant pricing. Look at the past decade and the supply growth has been modest for total liquids and weak for conventional oil but the price has gone up more than 5 fold. Is $200 oil likely. Yes. Can the US cope with $9 gasoline . Yes. We do already in Europe. Get used to it because it will happen.
The real issue that has not been discussed is the transfer of wealth from consuming nations to producing nations. Take Europe that consumes about 13.2 million bbl/d and produces 3.2 million bbl/d meaning an import of around 10 million bbl/d. You do not have to be too clever. The import bill is $1 billion per day at $100 barrel and 1.2 billion at $120 barrel. Ouch. Goods or services have to be produced and sold outside the EU to offset those purchases. Not an easy task for an EU that is bordering on bankruptcy for many member states. THe US is not much better.
Supply, Supply and more talk about Supply.
The world’s energy problem isn't going to get solved until the Demand, Demand and more Demand issue is addressed.
The new Obama regulations of 54.5 mpg by 2025 is a start. Hopefully it will help push the rest of the world with it.
55 mph highway & 35 mph city max speed should be a no brainer. But then again, we are talking about Americans with their rush to get to their early graves and stop lights.
The answers to the world's energy problems will only come from moving the demand curve to the left, not moving the supply curve to the right.
In OUR FINITE WORLD of supply the END will come sooner or later. I prefer later.
Now beam me up Scotty !
Don't forget that consumption = per capita demand x population. Even if you can somehow convince all of N. America and Western Europe to become energy misers (and good luck selling that to "Our way of life is non-negotiable" Red Staters), if the Third World keeps growing by about 70 million per year and continues efforts to "be just like us" (join the middle class and consume like Americans), then any savings in consumption will be utterly swamped.
I want to be more hopeful, but I see little evidence that the vast majority of the population "gets it", much less is keen on the solutions that might avert disaster. When it comes to the "science" and "evidence", we are literally inhabiting different worlds from your average American. As a former VP famously once said, "We create our own reality".
That's exactly right Harm. Population control is a must. Also, there is no future without the world becoming misers. It's a must and the "Red Staters" need to be educated. The BS needs to stop. It's not free speech to yell fire in a theater. Make it a terrorist act to lie about our energy situation and climate change, it's that important. The rest of the world isn't going to become what the west is today because there is not enough energy. Education of the population is a must.
We will create our own reality and it's not going to be pretty if there isn't change from BAU. Jimmy Carter had it right and look what happen to him. I'm not hopeful either.
Scotty, I need you to beam me up now !!
Wishful thinking. See my other post. The transfer of wealth will bankrupt the OECD nations but before that the developing nations will fail even earlier. Take a look at the ME and Africa and rising oil pricing will precipitate civil unrest, mass starvation, and probably mass migration. One only has to look at Yemen, Sudan, Somalia and the situation there is dire. But that is only the start. Mass migration of displaced people will place untold strains on already stretched developed nations, and there will be conflicts between the present and arriving population. How do you stop them? Meanwhile the oil producers of the ME will see their populations explode until their entire oil production is consummed within their borders; it is not that far away. They will then too collapse.
Selling population control will be nigh impossible. Even harder than Peak Oil. When God is the guiding principle for most, rational thought goes out the window. Irrespective of how much you try and educate the masses they will be more interested in their daily survival than listening to the need of living within the carrying capacity of the environment, and controlling population growth. Indeed population growth migh even increase as societal collapse takes hold. It's the 4 Horsemen I am afraid.
From the viewpoint of the Red-Staters, you aren't saying "stop wasting fuel". You are saying "Get poorer for the rest of your lives at a disproportionate rate compared to the rest of us who are forcing this upon you."
Demand will be regulated by price. And as supply remains tight and demand grows in China, the price will rise.
A key difficulty though lies in the fact that we "bake in" some 16+ years of a demand level each time we buy a new car. And sadly, most people can't seem to see climbing oil prices or realize they will continue to climb. So people buy cars based today's gas prices and will be regretting it 5 years from now when prices are much higher.
Push? What push?
My VW Golf from 1998 (classified as compact car) averages 40 mpg on the highway at 80mph. If it was a diesel I could get it down to about 50 mpg.
VW already built (and discontinued) a reasonably equipped small car averaging >60mpg (my aunt drives one of those).
This law is about 20 years behind what's commercially available today!
You're right about the demand issues needing work.
With the US needing more work than most other countries: http://en.wikipedia.org/wiki/List_of_countries_by_energy_consumption_per...
I still don't understand why so few businesses realise the huge profitability that can be achieved by conserving energy. Maybe they're still dreaming of 5$/barrel oil...
We all know other nations get better fuel economy with different standards. I would expect technology improvements to meet American new standards will spill over to other nations and raise their fuel economy.
SCOTTY, what to you mean you have no more power. Divert the power from impulse engines to the transporter and Beam me aboard. This plant is ready to burn up. Stat.
No more impulse engines power either. How about the auxiliary engines?
We used that up too. Oh Fu
I hear complaints that our current problems are partly due to Obama's restrictions causing a decrease of drilling on federal lands. Elsewhere I have read that oil production from federal onshore projects has always been relatively trivial. Does anyone have historical data on such exploration and production - as well as future potential?
http://thehill.com/blogs/e2-wire/e2-wire/206473-gop-counters-obama-on-dr...
Unless Obama is keeping 10 or 20 million barrels per day off the market (1-2 Saudi Arabias), it's not going to affect the consumer prices in a meaningful long term way. I would be surprised if the restricted lands had the capacity to produce more than 1/10th of that figure.
We're talking about the GOP. Obama could allow drilling everywhere in the USA and commission an exploratory well on the White House lawn, and they would still find something to complain about. They would probably start griping that he's putting hard-working owners of tertiary Texas stripper wells out of business by flooding the market.
Thank you for the run down Gail. A couple of the breakouts left me slightly confused as Europe/Former Soviet Union/Russia, have some significant overlap on the physical map. I assumed the Europe breakout excluded Russia-and I have to be honest even having recently read HO's series I can't remember how much Russian production originates in Europe. Does Former Soviet Union only refer to the Asian countries? Or are the Eastern European countries included as well? Possibly the Europe breakout only refers to EU and I missed that.
I agree that taking Iranian exports off line would create quite a pinch, but I really can't see China and several other countries turning down somewhat discount priced Iranian oil if the embargo starts to take hold elsewhere. However I do see a much graver situation if Israel or some other party attacks Iran and the oil flow through the Straits of Hormuz is stifled, or worse smothered, for any length of time.
I was using the EIA's summaries, from International Energy Statistics. They give a list of countries, and a summary at the top. The Europe list is disjoint from the list I have called the Former Soviet Union. The EIA calls the FSU "Eurasia".
For what it is worth, the Europe list includes the following, some of which have zero production. (Also, some categories are used for only a few years.)
Albania
Austria
Belgium
Bosnia and Herzegovina
Bulgaria
Croatia
Cyprus
Czech Republic
Denmark
Faroe Islands
Finland
Former Czechoslovakia
Former Serbia and Montenegro
Former Yugoslavia
France
Germany
Germany (Offshore)
Germany, East
Germany, West
Gibraltar
Greece
Hungary
Iceland
Ireland
Italy
Luxembourg
Macedonia
Malta
Montenegro
Netherlands
Netherlands (Offshore)
Norway
Poland
Portugal
Romania
Serbia
Slovakia
Slovenia
Spain
Sweden
Switzerland
Turkey
United Kingdom
United Kingdom (Offshore)
I have seen a number of theories as to what is behind the Iran situation. One view is that North Korea is getting quite a lot of benefit from its nuclear arms (more respect, more foreign aid). If Iran follows suit, it is in a better negotiating position as well. Another idea was that maybe Iran's production is decreasing, and putting an embargo in place (regardless of who embargoes whom) helps cover up for oil that isn't there in the first place. I am not sure that either of these theories are right, but I also don't think we can take what is said at face value.
Thanks Gail, I had a feeling it was an interesting grouping . I actually had that EIA page loaded but hadn't scrolled down. Very instructive collection of charts you put together for this post, thanks again.
Is there pretty good access to Iranian reserves data, and how recent and of what quality is the data being analyzed? I don't have much of a handle on how the major oil companies and Iran have been interacting the last decade or two.
When it comes to possessing nuclear weapons no doubt our kid glove approach to North Korea and heavy handling of Iraq help set the key for the tune, but then Kazakhstan's success after giving up a nuclear arsenal it inherited adds notes to the composition as well.
I agree that we can't take what is being said at face value, but I think it goes much deeper than that, none of the players seem to be able to see the situation from other players point of view, that is almost never a good thing. And it would seem quite uncomfortable to be in Israel's position, that fact makes me nervous as well.
One thing US policy certainly has done to strengthen Iran's position has been to shred its most powerful enemy in the region, Iraq.
One article by George Friedman suggested that Iran is smart, and helped mislead the US into thinking that Iraq would be easy to defeat, precisely with the intent of getting the US to disable Iraq.
Edit: I fixed the link. Try it now.
link doesn't work
But mislead who? Policy had been to keep Saddam contained for a solid decade before GW and crew rolled columns across the border. No fly and somewhat sieve like sanctions weren't ideal but the policy which replaced that was? I'll have to read the whitewash--ere article--to see what George Friedman is saying (might have tipped off my less than open mind on the topic). GH and company didn't think Saddam's Iraq would be all that hard to defeat when they stopped our troops at the border, but his crew did know figuring out what to do with the place afterwards would be a real challenge...and they were aware of how a far weaker Iraq would change the balance of power in the region. Heck that was obvious to me.
I always stared dumbstruck at the politicians who railed (for years) that enforcing no fly zone was eventually going to get a plane shot down and a pilot killed. No chance of worse happening during the invasion/occupation they were touting? Iran may have tried to nudge a few of the blindest along, I certainly would have if I were them, but I doubt their efforts influenced the thinking of Wolfowitz back in 1992. GH shelved those ideas deep in the closet but Dick, Don and GW dusted them off and put them on the mantel first chance they got--interesting since it was GH that was deep into the Iran/Contra thing when he was VP.
But it is all still very fluid and we may never really know if father or son's policies served our long term interests best. One thing about the game though, there are no 'do overs.'
all in all not a bad article by Friedman (as drawing room conversations over cigars and scotch go) but you did manage to focus on the whitewash.
The Islamic republic proved more successful than the shah. It conducted a sophisticated disinformation campaign prior to the 2003 Iraq war to convince the United States that invading Iraq would be militarily easy and that Iraqis would welcome the Americans with open arms. This fed the existing U.S. desire to invade Iraq, becoming one factor among many that made the invasion seem doable. In a second phase, the Iranians helped many factions in Iraq resist the Americans, turning the occupation -- and plans for reconstructing Iraq according to American blueprints -- into a nightmare. In a third and final phase, Iran used its influence in Iraq to divide and paralyze the country after the Americans withdrew.
Give me a break, the NBC anchor Brokaw was as personally responsible for the the misinformation campaign as any, and his small town 'Greatest Generation' fawning underpinnings explain the reason for that much more than anything Iran did...
I especially like
and plans for reconstructing Iraq according to American blueprints
as code for neocon drawing room idealism. Having built a building or two I've familiarity with blueprints and the detail into which they must delve and how they accommodate what is to be built to the landscape on which it is to be built. GW's administration had no plan that could be considered anything close to a blueprint at any time in the process. No doubt reconstructing Iraq was going to have to be a design build process but that still requires facts on the ground to be assessed thoroughly and reassessed constantly...Iran may have helped to muddy the picture all they could but idealistic blindness born out of something akin to an ivory tower mentality is what Friedman is calling a blueprint. Apparently Friedman felt he had to pay it some homage.
He does support my point about none of the players being able to see the world from the other's point of view, though we just have to take his word for it
It viewed the United States as extremely powerful and unpredictable to the point of irrationality, though also able to be manipulated
What Iran would view as irrational unpredictability the US would see as reasonable trial and error type action far from its core and continent spanning ocean protected borders...the very point of view which Friedman's whole article says has been Iran's goal to be to obtain but one which it certainly would find difficult to comprehend at this time.
That said Iran still sits in the middle of some of world's largest oil puddles and we and our com padres still need to suck them up to keep on rolling...all the players know that.
I will have to admit that all of the political intrigue is not my "thing". I have too many other things to look at/worry about.
Exactly right. The Iranian ayatollahs are a bunch of ratbags, but they are neither idiots nor madmen. They saw what happened to Saddam when he got rid of Iraq's WMDs. They have also observed that North Korea hasn't been invaded, despite its outlaw activities, and despite the fact that, apart from the little matter of a few nuclear weapons, they would be a military pushover. It is therefore perfectly rational for the third member of the George Bush's Axis of Evil to decide they'd prefer to take the North Korean road than the Iraqi one.
Has anyone else noticed that the latest IEA data indicates that non-OPEC supply has been falling since its recent peak in November?
http://www.gtforum.com/gtf/news/2167306/iea-cuts-global-refinery-through...
"On the crude supply side, the IEA reports that non-Opec supply dropped by 0.5mbpd MoM in March to 52.7mbpd. This triggered a 0.4mbpd drop in global crude supply, with the difference due to higher Opec NGL and crude production. According to IEA data, non-Opec supply has been in decline since December 2011 and is currently down 0.7mbpd from the recent peak of 53.4mbpd seen in November. Opec supply “held near three-and-a-half-year highs”, growing by 135,000bpd to 31.43mbpd."
The EIA does break down US production by field here though:

http://www.eia.gov/oog/info/twip/twiparch/120314/twipprint.html
Thanks! You are right. I remember seeing the chart now. It is not exactly by state, but a person can pretty much figure out the states by the play.
Eagle Ford - Texas
Bakken - North Dakota, Montana
Monterey - California
Bone Spring - Permian Basin in Texas, New Mexico
Niobrara - Colorado, Kansas, Nebraska, Wyoming
Woodford - Oklahoma
Granite Wash - Oklahoma, Texas
Spraberry - Texas
Austin Chalk - Texas, Louisiana
I think we can be optimistic about Iraq production in the short term, the limiting factor in 2011 has been the export infrastructure (pipelines and oil terminal), this is about to change in 2012 with the completion of the Basra terminal.
It is doubtful that Iran will allow Iraq to increase production to such an extent that oil prices will come down
Good point!
It is also doubtful that Iraq would wish to increase production to such an extent that oil prices will come down. If there is any slack in the system, they will first try to thrash it out at OPEC. And, of course, if there is significant slack in the system, us Peak Oilers will have to put the date of Peak Oil back a few years even further.
The crude component is still on a plateau. Based on the model I use, it looks like a URR for crude-only of 2 trillion barrels is a thing of the past. That is the value that Laherrere had calculated based on his accounting of previous discovery estimates and backdated numbers.
I suspect that the actual URR is closer to 2.4 trillion and that has been evident if one factors in a better model-based extrapolation of discoveries.
The issue with always under-shooting estimates for URR no doubt comes about from the lack of anything better than a heuristic. By definition a heuristic will always chase the tail of the data, in other words, it will always be trying to catch up to the latest numbers. The cheapest navigational heuristic, that of dead-reckoning, suffers from the same problem. All modern navigation aids use a model-based update mechanism instead of dead-reckoning, and the interpretation of oil reserves should be no different.
Trying to predict the numbers for all-liquids is more tricky. I like the way that GliderGuider approached it in this thread. Including the EROEI and energy density is vital if one wants to place the numbers on a level playing field.
Another point to make is that the URR heuristic known as Hubbert Linearization is about dead. The longer that crude stays on a plateau the worse the HL estimate gets.
I think that it was pretty clear that Deffeyes' estimate of 2,000 Gb was for conventional only. His point was that increasing unconventional production would not be sufficient to keep total crude production on an upward slope, and he has so far been right.
That's what I said, "crude only", which is a category that the EIA site provides.
Now the issue is whether the data that gets tracked only includes conventional crude or does it also start to include more and more unconventional crude over time?
We already have the situation that the numbers include natural gas liquids, which often come along for the ride from conventional sources. Whether those should or should not be included is a moot point because that is the way the data is delivered, as a mixed volume of crude and NGL.
What will be interesting is how any of these models will retain credibility when more and more of the unconventional crude starts entering into the picture.
I think that is the point that I am getting at, and what I tried to extrapolate with my 2.4 trillion barrel number. This assumed that there will be "bottom of the barrel" crude reserves of lower quality that will come along for the ride. These were volumes that the original estimates of discovery did not include, but that reserve growth should account for.
Shell Oil also made a prediction which amounted to a cumulative of 3.5 trillion. This was something they called "barrels of oil equivalent" which I always assumed included non-conventional and anything else they can think of. This would go into the "all-liquids" category.
So there are two categories of models floating around.
(1) The model of crude-only which gives a ceiling of around 74 million barrels a day, and has a URR of around 2 trillion if a peak was assumed around 2004, but will have to be closer to a URR of 2.4 trillion as the plateau extends for 7 going on 8 years now.
(2) The model of all-liquids which gives a ceiling of higher than 80 million barrels a day and a longer production tail. How much higher than 80 can this go? How creative is the accounting that goes into all-liquids?
This is the model I included in the book, which used the 2.4 trillion barrel URR number and modeled crude-only:
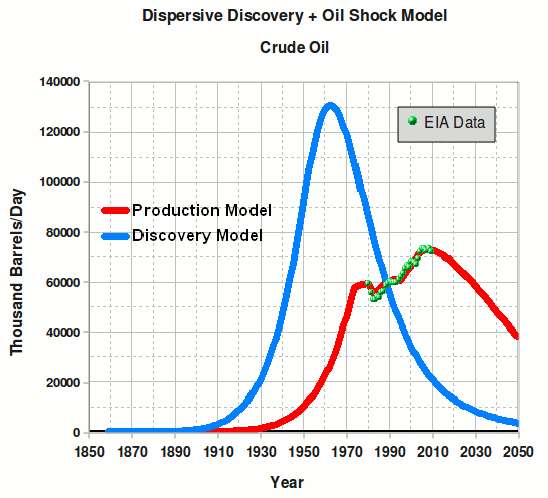
The recent 2011 point is perched precariously on the edge of the rough broad peak that is shown in red. That number should start going down if the URR of 2.4 trillion is on target. If it stays on a plateau, then likely more and more of the unconventional crude sources are being used to make up for the decline, and the 2.4 trillion number will creep up.
It is amazing what a mathematical model based on physical principles can provide in terms of intuition. The hardest part is trying to keep track of all the creative book-keeping that goes on in the reported data. I give it my best shot and then the classification changes and of course there is a scramble to reinterpret the model in terms of the new data categories based on oil grades. In other words, we have really nice and clean intuitive models, described by the dispersive discovery and oil shock models, but the empirical data is a mess. The data is kind of like that file folder that you keep in your drawer called "Miscellaneous".
Deffeyes was responsible for popularizing Hubbert Linearization, which assumed that the peak would look like an inverted parabola. HL was in fact what analysts call a "brain dead" model, as it made some heuristic assumption that couldn't adapt to reality. The reality is that production could maintain a plateau.
My point of course was that if one subtracts crude oil produced from bitumen sources, which weren't really reflected in Deffeyes' estimate of 2,000 Gb for cumulative global crude oil production, we have seen a decline in conventional global crude oil production.
And can you please tell Sarah Palin that God has not created underfoot for us multiple billions of barrels of oil that we can freely use without worrying about it? See http://mediamatters.org/mmtv/201204130021 .
EIA World Crude Oil Plus Condensate Production from January 2000 through December 2011 with a rolling annual average in green and captions indicating significant world events.
Note that you might add the Gulf Coast hurricanes in 2005. Incidentally, apparently the EIA has downwardly revised some of the annual global production numbers that are shown on my chart.
Hi newbie here. No expert on this oil stuff but that graph for Europe looks reaaly scary!
Welcome aboard!
K.