| Energy Supplies and Climate Policy | The Oil Drum | New IMF Working Paper Models Impact of Oil Limits on the Economy |
Norwegian Crude Oil Reserves and Production as of 12/31/2011
Posted by Rune Likvern on May 9, 2012 - 10:47am
In this post I present an updated view on Norwegian crude oil exploration, sanctioned developments, discoveries, production, reserves and what these now suggest for the future of Norwegian crude oil production.
The content for this post was originally published in Norwegian here and here.
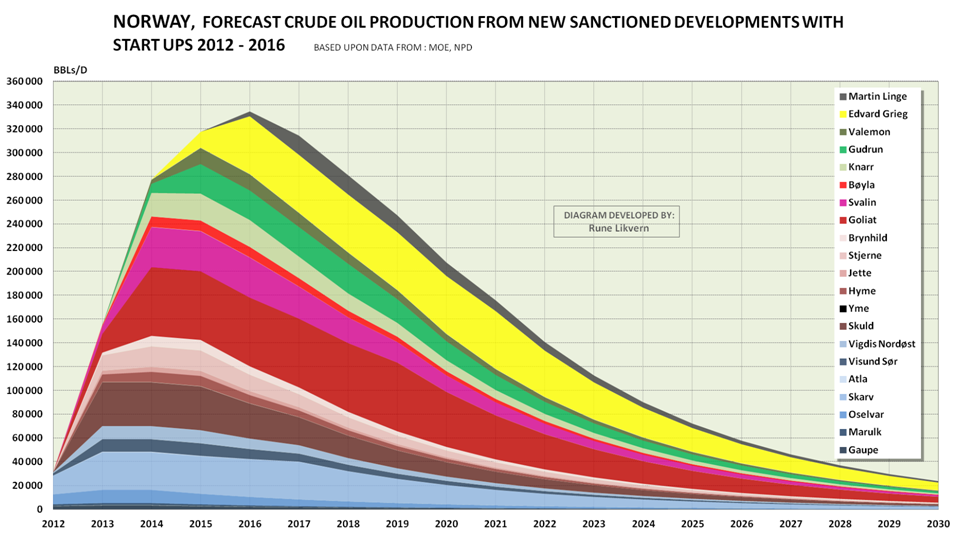
Figure 01: The chart above shows a forecast for crude oil production from the 21 discoveries presently sanctioned for development on the Norwegian Continental Shelf (NCS) and which are scheduled to start flowing from 2012 to 2016.
In Figure 5 these and a forecast for Johan Sverdrup are shown as parts of a forecast of crude oil production from NCS. Click on all charts to enlarge and to open in a new window.
After oil prices moved upwards and settled at a higher level starting around 2005, a new wave of exploration resulted in sanctions for developments of several new and known discoveries that previously had been on hold due to lack of profitability.
These new developments are expected to add up to 350 kb/d of additional oil production, reaching a peak in 2016. This is by itself impressive given the location of the discoveries (offshore, water depth), their size and the total efforts required to bring these to fruition. These 21 developments have been estimated to hold total recoverable reserves of 1 Gb crude oil, 140 Gcm (Gcm = Bcm: Billion cubic meters) of natural gas, around 23 Mb condensates and around 164 Mb NGLs.
These 21 new developments are "small fields". What characterize “small fields” are rapid buildup and a short plateau followed by aggressive (high) decline rates. Total investments for these 21 developments are now estimated to be around 225 billion NOK (2011) or US$40 billion. Most of the developments shown in Figure 1 have been estimated to be profitable for crude oil prices ranging from US$40 - US$90/bbl.
HISTORY OF NORWEGIAN CRUDE OIL DISCOVERIES

Figure 02: The chart shows the history and status of total annual discoveries (stacked columns) of crude oil from the start of oil exploration on the NCS in the mid 60’s until the end of 2011.
The light green columns show what has been sold and delivered. Dark green shows estimated total remaining recoverable reserves. The yellow columns show total discoveries that have not been sanctioned as of end 2011.
Furthermore, the chart shows annual extraction (thick black line) of crude oil since oil production started back in 1970. In the chart is also included a table identifying the year of discovery and name for all fields with more than 1 billion barrels (Gb) of recoverable crude oil.
Figure 2 shows that:
- The bulk of discoveries on NCS was made in the early years of exploration (see also Figure 3 where total discoveries are sorted by decade) and these presently heavily depleted fields still contribute a major part of total Norwegian crude oil production (see also Figures 6 and 7).
- 1979 stands out as the year with most total crude oil discoveries on NCS including amongst others: Oseberg, Troll and Snorre.
- Until 1987 more oil was annually discovered than what was extracted. Then, with the exceptions of 1991, 1992 and 2010 (Johan Sverdrup) more crude oil was extracted than was discovered. The depletion of the oil reserves is also illustrated in Figures 4 and 5.
- The number of and total amounts of discovered oil grew after oil prices moved above US$50/bbl in 2005. This suggests that oil companies have had several prospects in the drawer that became economically attractive to explore with the increase in oil prices and the income growth that allowed for drilling them.
The discovery in 2010 of Johan Sverdrup (formerly Aldous Major South/Avaldsnes), which saw its reserves number soar following an appraisal well in the fall of 2011, is very much an "outlier" relative to the size of the discoveries in the last two decades. Figure 2 also shows that new discoveries that are found to be profitable are fast tracked for production development.
The growth in oil prices in recent years has resulted in a positive economic climate for exploration, allowing more prospects to be drilled and thus establishing more reliable estimates of recoverable volumes from these discoveries.
Based upon data in the public domain from the operators and the authorities (NPD), it has been estimated that the recent discovery of Skrugard will be profitable at an oil price around US$60/bbl (340 NOK/bbl) at a discount rate of 7%. Skrugard is now estimated to hold 250 - 280 Mb of recoverable oil and the field is located at 72 degrees North at a water depth of 390 meters (1,300 feet) and 200 kilometers (125 miles) offshore.
One way to look at these recent developments is that Norway in general is about to run out of discoveries that are profitable in the US$40 – US$60/bbl range.
Could a new wave of exploration and developments be set off at an even higher oil price, say US$150/bbl?
Food for thought is that future discoveries and developments are likely to be smaller than those that set off the past and present waves. If new discoveries are smaller, we are likely to need both a higher price and a larger number of field developments to combat depletion and decline from a growing number of ageing fields.
If this is viewed together with the extraction costs for oil from shale (tight oil) mainly in the U.S. and oil sands in Canada which both require an oil price in the range of US$60 - US$90/bbl, this very much documents that the price for the marginal barrel has now moved higher.
There is a catch here. Buyers of oil do not care about the development costs (or required breakeven prices). Instead the market sets the price as primarily based on the supply/demand balance. If the crude oil price were to temporarily retreat this would threaten the economics of some developments and also defer investments in new capacities.
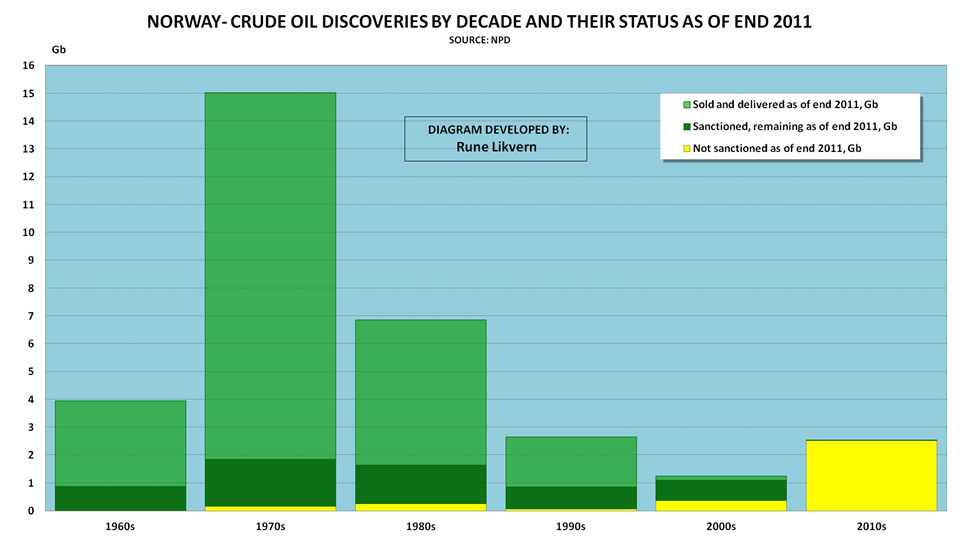
Figure 03: The figure shows the discovery of crude oil for each past decade of oil operations in Norway. The light green bars show what is sold and delivered. Dark green is estimated total remaining reserves. The yellow bars show discoveries that have not been sanctioned as of the end of 2011.
The figure shows that most of Norwegian crude oil was discovered in the seventies and that total discoveries slowed until the discovery of Johan Sverdrup, Skrugard and Havis, and there are still some years left of this decade.

Figure 04: The figure shows the history and total discoveries of crude oil by year (stacked columns) from oil exploration started on NCS and as of year-end 2011. The figure is also referred to as a "creaming curve". The light green bars shows what has been sold and delivered. Dark green is the total remaining reserves. The yellow bars show the total of discoveries that presently are not sanctioned.
The discoveries from the 70s presently yield more than 28% of total Norwegian oil production, (refer also to Figures 6 and 7), and these will continue to make a significant contribution to the total Norwegian oil production.
Figure 4 shows that discovered Norwegian oil reserves are now around 75% depleted.
Figures 4 and 5 below should be useful for understanding the time horizon and level of future Norwegian crude oil production.
ACTUAL AND A FORECAST OF NORWEGIAN CRUDE OIL PRODUCTION

Figure 05: The chart shows actual crude oil production by field from the NCS for the years 1970 to 2011. Furthermore, I have prepared a forecast until 2040 based upon the reserve and resource data from NPD as of end 2011. The forecast is based upon each field's R/P ratio, projected decline rates for each field, estimated remaining recoverable reserves, sanctioned developments (those shown in Figure 1) and NPD estimates of recoverable reserves for recent discoveries (such as Johan Sverdrup, Skrugard, Havis etc.). The forecast does not incorporate effects from fields that may be closed down as these become unprofitable. The forecast is subject to changes from revisions in estimates of recoverable reserves in producing fields and discoveries, new commercial discoveries in mature areas, the Barents Sea and later Lofoten/Vesterålen.
UPDATE 05/10/2012: The owners of Johan Sverdrup today announced plans for first oil from Q4 2018. The forecast has been revised to reflect this (previous forecast had 2017 for first oil).
The parameter that will most influence future Norwegian crude oil production is and will continue to be the oil price. Figure 5 also illustrates that the biggest discoveries are made early, rapidly put into production. Then, with time, as prices rise to a high enough level, the smaller discoveries are developed. Figure 5 shows that the decline in Norwegian crude oil production continues to defy the strong price growth in recent years. The growth in crude oil prices has helped offset the fall in Norwegian crude oil production and stimulated increased exploration activity and made some past discoveries profitable.
In discussions about the time horizon and levels for the Norwegian crude oil production there seems to be a deficit of realistic and unbiased understandings about future production levels relative to what is now publicly known about estimates of remaining recoverable reserves, discoveries and yet to find.
Norwegian crude oil production peaked in 2001 and as of 2012 it has declined about 50% from the peak. This fact has been overshadowed by the oil price growth in recent years. This increase in prices has more than compensated for the decline in the amount of crude sold and delivered (and natural gas volumes), and has helped to maintain and grow annual Norwegian gross income.
Norwegian Petroleum Directorate's (NPD) has forecast that crude oil production for 2012 will decline to 1.61 Mb/d from 1.68 Mb/d in 2011. Norway also produced 0.08 Mb/d of condensates and 0.28 Mb/d of NGLs in 2011. Norwegian domestic oil consumption is now around 0.2 Mb/d and present expectations are that Norway will continue to be a net exporter of crude oil, albeit at a diminishing rate, for the next 25 to 30 years.
OIL PRICE AND GROSS INCOME
A production level that only meets Norway’s domestic needs will not leave anything for exports. Norway presently has an annual trade deficit, excluding income from the petroleum sector, of around US$20 – US$25 billion.
To run a balanced trade and cover domestic consumption Norway needs to produce 0.7 – 0.8 Mb/d at current prices. This level is presently expected to be reached within 15 years.
(Admittedly, income from Norwegian natural gas sales needs to be included, but in 15 years these sales are also forecast to have substantially declined.)
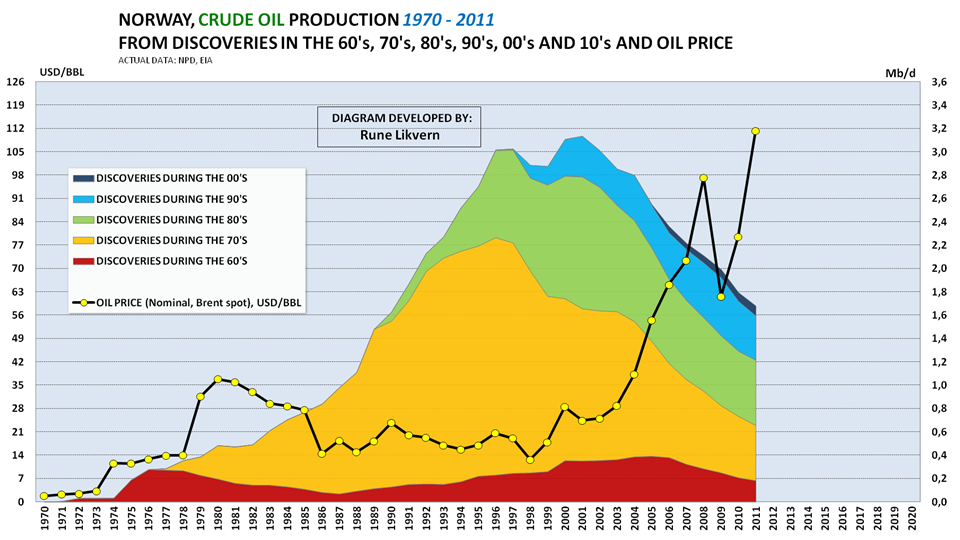
Figure 06: The figure shows the Norwegian crude oil production divided into discoveries by decade. The figure also shows the development of the annual price of oil.
The figure above illustrates the effects from discoveries by decade and that the major discoveries in a new oil province are made early.
The chart could also leave the impression that oil prices really took off as Norwegian oil production started to decline.
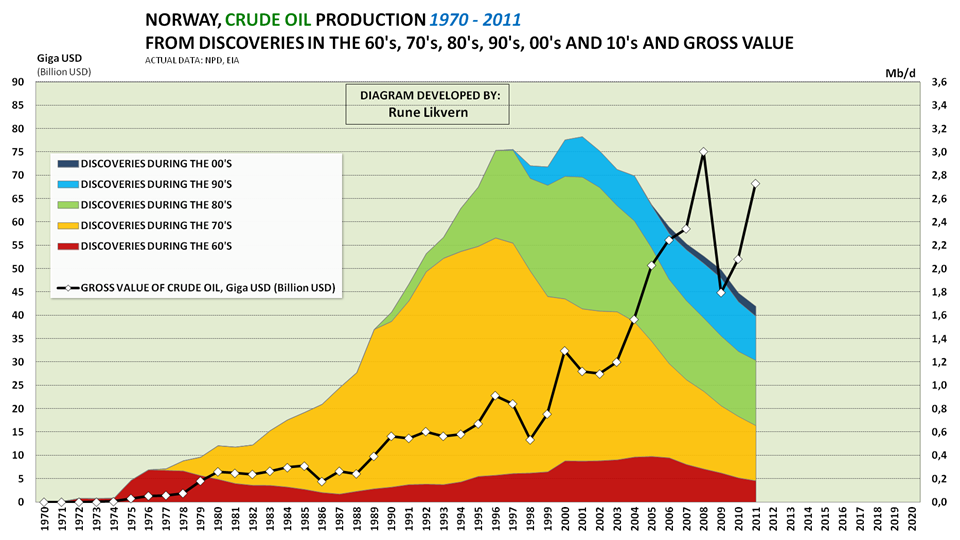
Figure 07: The figure shows Norwegian crude oil production divided into discoveries by decade. The figure also shows the development of the annual gross value of the Norwegian crude oil production in U.S. dollars.
As the oil price moved strongly upwards, it also pulled gross incomes from crude oil sales up. What is often overlooked with this increasing revenue is the decline in volume. The price increase for oil in 1979 gave a boost to the gross income from the Norwegian crude oil sales. Later, the increase in gross income was driven primarily by volume. A tighter global supply/demand balance in 2004 ushered in a sharp rise in prices of oil which more than compensated for the decline in oil production and thus sent the gross income from the Norwegian crude oil production to new heights.
Average crude oil price was around US$97/bbl in 2008 and in 2011 US$111/bbl. In 2008 the Norwegian crude oil production was 2.11 Mb/d and by 2011 it had declined to 1.68 Mb/d.
Predicting near term developments of the oil price with any precision is difficult. The growth in total debt in the last three decades caused aggregate demand (also for oil) to be pulled forward, and debt growth also provided price support. A wide spread deleveraging and introduction of austerity measures, which now seems to be in its infancy, could be expected to affect oil demand in the near term and perhaps reduce oil prices.
Contact
- Content: editors at theoildrum dot com
- Tech support: support at theoildrum dot com
License

This work is licensed under a Creative Commons Attribution-Share Alike 3.0 United States License.
Thanks for a great article Rune. Figure 5 says it all. That is, these new discoveries will slow the decline down for a couple of years but there is no real game change in them. I have used the EIA's Crude + Condensate numbers below to show Norway's decline rate since their peak in 2001. The decline starts off slow at first then speeds up as more and more fields go into decline. The average decline rate for the last seven years, 2005 thru 2011, is 7.77 percent. That is the total decline of all fields meaning that any new fields coming on line during that period would subtract from the total decline, bringing the average decline down to 7.77%.
Norway C+C production in kb/d according to the EIA.
From examining the decline rate of fields all over the world it is obvious that the new discoveries, due to their small size and great depth and pressure, have a much higher decline rate than the much older giant fields. I have noticed that some of the fields in the Gulf of Mexico have a decline rate of 15% or greater.
Ron P.
Agreed, figure 5 alone tells quite a story. I'm tempted to print this on business cards to place near gas pumps, just to give drivers a little something to think about.
Hello Ron and thanks.
To me it appears that few mentions the real elephants in the room; depletion and decline rates.
The chart above shows the developments in the decline rate for all Norwegian crude oil production (blue line) and the decline rate for fields starting to flow prior to 31/12/2001 (red line) estimated from Norwegian Petroleum Directorate (NPD) data. Both lines are 12 Month Moving Averages smoothed to take out “noise” from maintenance and unscheduled shut downs etc.
The aging fields (red line) have seen annual decline rates between 12 and 15 % that is what I would call aggressive. Total decline (blue line) in Norwegian crude oil production has been offset by a large number of developments (26 depending on who does the counting) that started to flow from 01/01/2002 and as of February 2012. Amongst these new fields was Grane that produced around 200 kb at peak and which is now in steep decline.
The chart also shows the movements in the average monthly oil price, Brent Spot (black line).
Note how the decline rates appear to become affected by the oil price (admittedly with a time lag). The higher oil price allowed for more (infill) drilling in aging fields that slowed the decline rates.
If oil prices comes down it will become interesting to see what happens to decline rates.
Rune,
According to a recent World Oil column, you are mistaken about Norway. The author of the World Oil Column asserts that there has been no peak in Norway.
Peak Oil? Not in Norway:
http://www.worldoil.com/April-2012-Oil-and-Gas-in-the-Capitals.html
(It appears that you can find the full article by doing a Google Search.)
Here is my favorite excerpt from the World Oil article:
There you have it. An infinite rate of increase in our consumption of a finite fossil fuel resource base is no problem, "To infinity and beyond!"
The EIA shows that the 2010 to 2011 year over year decline rate for Norwegian crude oil production, 6.5%/year, is higher than the 2001 to 2011 ten year decline rate, 6.1%/year.
I frequently use the North Sea (principally UK, Norway, Denmark), which showed an overall peak in 1999, as an example of making an incremental difference versus making a material difference. Sam Foucher found that North Sea oil fields whose first full year of production was in 1999, or later, had a production peak in 2005 at about one mbpd. These post-peak fields helped, but they only served to slow the overall North Sea post-1999 decline rate to about 5%/year. In other words, increasing production in some sectors of the North Sea made an incremental, but not a material difference.
As you noted, Peak Oil does not mean that we stop finding oil. It means that we can no longer offset the declines from the older larger fields, which tend to be found in the early decades of the exploration in a given area. So far, this has been what we have seen in Norway. We shall see what happens in the next ten years.
I could not raise the "access free" article with Google but a very good reply to the article by Tadeusz (Tad) Patzek can be found here:
Peak Oil? - In Norway
Ron P.
I was able to get the article by searching for Peak Oil?--Not in Norway:
http://www.google.com/search?client=safari&rls=en&q=peak+oil%3F--not+in+...
The title of the link is: April 2012 - Oil and Gas in the Capitals
Jeff, perhaps you get it with that search because you are a subscriber to "World Oil Online". But the link just brings up this for me:
Ron P.
Ron, the full article came up for me (using Firefox, btw). Perhaps clearing your cache will help.
Could have been written by Dan Yergin himself.
Likvern's Figure 2 represents the tragedy of our times: all that good stuff wasted for nothing but some numbers on a computer screen.
Sez Noreng:
What value chain, the term is an oxymoron. Maybe he means the waste part. Where is any value returned from burning the resource, how do the fuel user/wasters pay for themselves?
It looks like the Norwegians sold all their crude resources for less than $30 per barrel, it's gone and what is there to show for it? Will what was gained be around in a hundred years or is it just some 'money' that will be long-spent or worthless by that time?
Looking into the future and $50 crude, where will that oil be? The answer is at the bottom of the sea where it sleeps now. Norway is in the same trap as Texas was, before Mr. Noreng made liberties to wag his scolding finger: it must pump as fast as possible in order to get paper promises it needs to pump the oil as fast as possible. If it waits until tomorrow the paper promises may disappear. High oil prices have other effects within the incredible value chain besides paying for drilling in the middle of nowhere.
Price support is like the (new) weather, cannot count on it.
Hello Steve,
To me figure 2 is the most informative one as it shows the status of stocks and if this is held up with the draw down forecast in figure 5 it becomes apparent that it is hard to grasp that anyone now can claim that remaining reserves and resources can support growth in flows (oil production).
I expect price support to weaken and it could be that creditors as a result would look upon more complex technological developments as riskier and demand a higher risk premium (interest).
The North American nat gas markets is now an interesting laboratory, it is regional, but illustrates now how an oversupply has pushed the price well below the marginal cost for the last cubic foot.
In general the reasons for oversupply may comprise several factors, but the outcome seems to be the same, prices are pushed downwards. This may set off a self-reinforcing chain of events where debt capital becomes higher priced, companies abilities to take upon more debt and service debt are weakened and thus their abilities to go after the pricier oil and gas. In other words the companies loose momentum and if momentum first is lost it takes time to regain it.
And as you point out price support is around until it is not. And for oil it appears as 3 - 4 decades of debt growth also gave price support for oil prices and supported growth in consumption.
Hello Jeffrey,
Thanks for the link you provided. I do not know how and with what the author supports his assertions.
The Norwegian Petroleum Directorate (NPD) presented a status as of end 2011 here
From the above NPD presentation (slide 17) I have lifted out the figure below
Chart from NPD presentation on actual and NPD forecast for 2012 to 2016 for crude oil production from Norwegian Continental Shelf (NCS).
Few should be in a better position to predict future crude oil production from NCS than NPD. It does not seem like NPD now expect Norwegian crude oil production to return to the levels of 2001.
As of now (including reserves from sanctioned fields) NPD data shows these reserves to total 5.47 Gb. Norway produced 0.61 Gb of crude oil in 2011, which results in a R/P (Reserves over Production) ratio 8.9. Keep in mind that the reserves number used includes reserves from developments that are scheduled to start flowing towards 2016.
Total NCS reserves that has not been sanctioned yet is estimated at 3.36 Gb (this includes Johan Sverdrup (1.76 Gb), Skrugard and Havis (to the far north) with a total of around 0.5 Gb).
Looking at the hard numbers it is hard to understand that anyone can claim what was quoted.
Sarc on.
What the Peak Oil crowd fails to understand is that a glass of beer never becomes empty……….it is the portion of beer and air in the glass that changes.
Sarc off.
So 1 bb of oil is all it takes these days to end peak oil for a major producing country that used to produce 1bb of oil each year? Funny. Even if the optimistic estimates reach 2-3 bb, it's still just a drop in the bucket. And, as the article shows, you've got this new oil at marginally high prices. Hmm.
Good clear summary of new developments and their relative contribution to overall production - the graphs particularly - thank you. Fig 1 excludes Johan Sverdrup, which would give the graph a different profile, which is evident from fig 5.
Am I correct in interpreting from the numbers of these new sanctioned developments they will deliver a total of approx 2 Billion bbl oil equivalent, at a total cost of around 40 billion USD? Or an average of 20 dollars a barrel (which seems low to me)? I see elsewhere that the press is reporting that Johan Sverdrup can be brought on stream for 15 USD per barrel.
Hello and thank you.
The reason I did not include Johan Sverdrup in figure 1 is that it has not been formally sanctioned for development. The owners of Johan Sverdrup now intends to have the field flowing sometime during 2017 (reflected in figure 5). More delineation drilling is still under way.
The 21 fields, shown in figure, 1 have been estimated by the Norwegian Petroleum Directorate (NPD) to contain total recoverable reserves of just above 1 Billion barrels (1 Gb; Giga barrel) of crude oil, 23 Mb condensates, 164 Mb NGLs and 880 Mboe (million barrels of oil equivalents) natural gas. So that should total around 2 Billion bbl oil equivalents.
Most of the 21 fields had (crude oil) break even prices ranging from $40 to $90/bbl (that includes proceeds from other hydrocarbons; condensates, NGLs and natural gas, produced and sold).
A weighted break even price (crude oil) for these 21 developments was estimated to be shy of $50/bbl (same procedure as above).
I do not have any estimates (as of now) for Johan Sverdrup with regard to its break even price.
Just wanted to thank you for a fantastic article, Rune. It's a bit scary to me that some of these fields need 90 dollar oil to break even -- with all products included.
Rune.
Good. Post.
Norway has what, $400B, in its sovereign wealth fund,
which suggests that your countrymen recognize that these
are depletable resources.
I'm curious: would citizens in Norway be surprised by
the charts you presented here? Does the "average guy on the
street" know the score? Or would he or she think Norway has
"100 years" of oil and gas, just like America.
It's unlikely that the "wealth fund" will be of any use if all goes to shit in the world at large. It won't let you buy food if none is available for import.
The "elderly wave", along with a growing number of immigrants (the high estimate for population growth puts us at another million in just 13~ years) will surely leave holes in it as well (granted the status quo remains for another few decades).
Another Norwegian peak-oil believer thinks we'll be net importers within 10 years (http://oljepessimisten.wordpress.com/). However, from whom would we import?
It seems you are more optimistic than he is, Rune. I want to be optimistic. Another decade of good living? Cheers to that.
AssumingNorwegian oil consumption stay flat (andwith Norway, this can be close to the truth) and assuming the graphs in the article is propheticly correct, Norway will become an importer in 2035. But importing from whom?
With global peak oil events transpiring, I suppose oil consumption in Norway will peak and decline - which could offset it even longer
Then again, many of the fields may never be developed due to financial troubles or aforementioned possible international events.
I really do not know.
On the other hand Norway will still have a Government Pension Fund so it may be that the prevalent understanding is that it will only be a matter of…..money.
Rune - Maybe money...maybe some other leverage. If push comes to shove Norway could just station one of its nuclear powered aricraft carriers off the west coast of Africa and be in a better position to negotiate an export agreement.
I have no real guess how MADOR (Mutually Assured Distribution Of Resources) will play out eventually. But I doubt a country's bank account balance will be the only deciding factor.
If you lend money to another country it is better to make sure they do not use it on the military. They might decide they do not need to pay the interest ...
Lending will increasingly become a risky venture, and interest payments the least worry.
It is difficult to know how money lent are spent.
Hello ROCK and thanks for taking time.
There are rumors floating around that the Government Pension Fund is also pursuing a stealthy take over of Blue Bell ice cream ...and will use that for leverage. ;-)
In today's paper there was an article about the sale of the painting "Scream" by Munch that recently was auctioned away. The article pointed to that finally did Norwegians get to understand the value of art in a language they understood.....money.
What I have observed for some time is that finalization is increasingly used to describe the value of almost everything. It also appears as a persons self confidence and self image has become proportional to what they believe to be their net worth (even if they are so stupid that the gods will never allow them to die). I fear that in the near future as this super debt cycle unwinds that many will wake up one morning and see all their net worth vaporized........and their self image with it. The Government Pension Fund will take a hit as well.
ROCK, I believe you are right that as TSHTF, other rules comes into play than the balance of bank accounts, but as of now the media keeps pounding the Norwegian population that the Government Pension Funds literally buys us the world. It will be a crude awakening......giving a surplus of motives for an updated version of......... "Scream".
...
http://tvtropes.org/pmwiki/pmwiki.php/Main/FlatWhat
@DAL
Even if oil prices should fall to say $50/bbl, there is reason to believe that Norway will still be a net exporter of oil towards 2030. The lower the oil price goes the sooner Norway ends net exports and vice versa.
A lower price sustained for years (like $50/bbl) would affect activities and reduce exploration.
Hello rudall,
That is some tough questions to answer.
I am not sure how the citizens of Norway would react to my charts, but they reflect what hard data gives.
What I sense is that people’s perceptions are very much formed by what they learn from the media much in competition with other distractions. Presently several yards/vendors are working at full capacities (some even flagging a deficit of skilled workers and going abroad to hire and fill the holes) with petroleum related developments and I just saw an article that mentioned it is now hard to contract drilling rigs for NCS for the next few years.
This recent wave of developments has seriously stretched the yards/vendors and service industries.
The higher oil price in the recent years has allowed total Norwegian income from declining petroleum sales to grow, and thus the amount transferred to the sovereign wealth fund. The results from the oil companies are reflected by this as well. I think these are the factors that now form most people’s perceptions about the petroleum related activities and news about new discoveries (seems like size does not matter ) just reinforces these perceptions.
What would happen if oil prices were to come markedly down?
Actually not much in the near term.
As of now I believe we need to move to late 2014 when most of these ongoing developments become finalized and the flow of new developments does not keep up. From around late 2014, and dependent on oil prices, I now expect that annually more installations will be shut down due to economics than new ones brought on stream towards 2020 and beyond.
As of now I expect Norwegian crude oil production will resume its recent years annually high decline from around 2015 and by the same time chances are that natural gas production may also enter into a steep decline.
So as of now it appears as 2014/2015 may be when a slowdown in the Norwegian petroleum industry and incomes may become more widely recognized.
I've introduced the concept of peak oil to many of my Norwegian peers. Most recognize it has happened on the Norwegian Continental Shelf, but most believe it won't happen for another few decades globally.
Few if any take the possible ramifications seriously, claiming a solution is on the doorsteps or will be brought on as a matter of necessity (panglossian disorder).
When I try to say that's entirely a figment of their imaginations (of course, by disarming their arguments and telling them about how unsustainable so-called renewable energy is and explaining EROI), most get upset and derogatory. I suppose that's a defense-mechanism triggered by a dismay when considering the potential dire consequences of a scenario.
Of course, the problem is that few highlight the problem in media. Norway is in a good spot financially, quite different from most European countries. This has been disastrous with regard to unsustainable levels of low-skill non-western immigration, but that's a different cup. I suspect it will be a catalyst for much conflict and tension when shit hits the fan. Heterogeneity is hardly ever a benefit to the social fabric of a nation unless there's guaranteed financial stability.
It is about belief.
People tend to believe what they want to believe.
I now start to understand why you chose the nick DepressedALot ;-)
I should rename it, "PerpetualDepression" is cooler and more fitting. :)
Of course it colours my view of the world. I've only known of peak oil for some four months. I was busy growing up and going to school when peak hit Norway.
Now I'm a graduating computer engineer with few or any prospects after downsizing hits the business (an inevitable consequence). Perhaps social benefits will be available for some time still. Gotta get me some of that wealth fund before it's too late.
It's nice if the things people "want to believe" somewhat resonates with the truth though.
What specifically is the sovereign wealth fund denominated in? US debt bonds? I hope not.
http://en.wikipedia.org/wiki/The_Government_Pension_Fund_of_Norway
Much of it is spread through every stock market on the planet.
The irony is interesting, since the world's financial system, including of course the stock markets, is now revealing itself to be a giant ponzi scheme based on unsustainable debt levels. The amount of natural resources available to provide value to all the claims of wealth represented in the financial system is grossly over-stated based on the purchasing power of those various financial assets. Therefore, to maintain true wealth (resources able to support human needs) going forward will entail placing one's nest egg in real world natural resources rather than participating in the ponzi scheme.
Ironic, because it seems that Norway is rapidly liquidating its true wealth in return for paper / electronic tokens of imaginary wealth. I wish Norway luck.
Interesting observations and thoughts.
Apparently most people are conditioned to use money as a marker for wealth and wellbeing. This is a cultural thing.
A little while ago I had an interesting conversation with a friend. He pointed out it was more environmentally friendly if people compared bank statements as opposed to building big houses, cabins or buying big boats and cars to show off their wealth. I admit he got a point there.
Problem is that financial wealth (like bank statements) may disappear fast and many used debt to grow their net worth. If/when there is a repricing of financial wealth (due to overall debt levels) there are lots of people who will be forced to rethink the definitions of wealth, success etc.
The use of net worth also creates an illusion of wealth, which is useful to make people feel good, successful etc..
on the other hand what is the point of trying to become wealthy if the goal is just to compare bank statements? doesn't sound awfully interesting to me.
To use a creative metaphor...
In the ocean, an earthquake or landslide displaces a large volume of water, causing a small perturbation at the surface. To most observers, this wave will be missed due to its relatively small size. But as it approaches shore, the wave bottom which encompasses the entire water column, begins to move up and compress as the water grows more shallow. A wave that started out as three to four feet grows to ten, twenty, sixty, a hundred feet. On shore, it is obvious to any observer that an enormous wave is approaching.
Now let's think of the rising cost of a marginal barrel as the tsunami of peak oil.
At first, the rising price of a marginal barrel is invisible. It is embedded in muddy and difficult to perceive figures as supply, demand and speculation. At first, the rising cost of a marginal barrel rises below the regular price of oil and no-one really notices. But, like a tsunami approaching shore, eventually the marginal barrel pushes all prices higher, creating an increasingly thin profit margin for producers, speculators, and refiners to operate in. The peak oil wave of rising marginal production costs becomes visible when prices reach the point of economic pain. Then, demand destruction occurs, putting marginal producers under strain as prices fall during an economic recession. Perhaps these marginal producers weather the first recession. But, over time, larger and larger fractions of world liquids production comes from marginal oil.
Eventually, the price of a substantial fraction of oil production, 5, 10, 20 percent, is at or near to the price of economic pain. When the high price of energy, supported by these high-cost marginal barrels, creates a situation of demand destruction, it results in crisis for these marginal suppliers. A substantial fraction go bankrupt, wiping out their fraction of marginal production. Subsidized producers may last longer. But, eventually, it becomes too costly to finance them as budgets become strained when falling net energy sucks liquidity out of economies. The result, eventually, is the same: marginal supply becomes too expensive and non-useful for society and economic contraction creates an inability to afford the marginal oil. At that point, production will fall.
In my view, this is what the end of the oil plateau will look like. And if, as this article and as others are saying, the cost of a marginal barrel is now near 90 dollars, then we're probably much closer to the end of the plateau than people realize.
What's the point of economic pain? 120 dollars per barrel? 140? And how far do prices plunge after recession? 40 dollars per barrel? How long can marginal producers operate in a 40 dollars per barrel environment? What do they rely on to help mitigate lack of revenue during the bust time? Low price natural gas? Gas that's already creating its own marginal pricing balloon due to the increased costs of fracking? No, instead they will have to rely on the shrinking portion of non-marginal oil and gas production for their profits. Those wells that are increasingly rare and exceedingly valuable. For those with mixed portfolios, survival during economic downturns will be possible, but with lower revenue. For those relying increasingly on marginal production, it may not be possible to weather longer periods of demand destruction and recession. As marginal production increases, the number of producers in this position will grow and grow.
And what's the state of the world economy? The recent price falls would seem to indicate weakness and demand destruction. The World Bank says Europe is probably already in recession. China is slowing. US growth numbers are straining and employment is still a problem. The world bank is saying there is a risk of a world double dip. In this event, how much of this marginal production will be put on hold, delayed or never produced? And how capable will the governments of the world be to weather a second crisis in 4 years? To bring back enough demand to support a return to marginal production? It will be possible. But it will be more difficult the second time around. And what about a third time?
I suppose the world's governments and markets will fight tooth and nail against this possibility. So we may see oil prices fall a bit as demand is partially destroyed to the 80-90 dollars per barrel range as markets and governments keep their fingers crossed that this will bring back enough demand to eek out another year of slower growth, but stave off recession for a bit longer. But how long can we walk along this razor's edge? And where is a the cost of a marginal barrel next year or in 2014? 95 dollars? A hundred dollars?
In 2008, the marginal price of a barrel was probably around 60 dollars. That marginal production resulted in, perhaps, 5-6 million barrels per day of additional production. In 2012 the marginal barrel is 90 dollars and marginal production in the 60-90 dollars per barrel range is now at least 9 million barrels per day. This is 12% of crude + condensate production. These are conservative numbers. We don't know the volume of marginal production in states like Russia and Saudi Arabia. But we do know that they're saying they need 90-100 dollars per barrel to support their economies. Perhaps this pushes marginal production to 20% of C+C. In any case, the marginal production range of 12-20 percent and the price of a marginal barrel at 60-90 dollars is much more than it was in 2008. And this means the tsunami of peak, end plateau, oil production is that much closer to shore.
You got some interesting points and questions.
Many oil and gas companies grew/grows by increasing the amounts of debt. Debt may be a useful helper when incomes/revenues grow, but it may turn out to become a millstone if oil and gas prices declines markedly and remains suppressed for some time and lowers incomes/revenues.
In an environment where oil/gas prices remains suppressed the companies are left with cut backs, deferred investments, deleveraging, shut downs of unprofitable production etc. to remain in business. It does not take long before the company loses momentum and should prices recover it takes time before they again can take upon more debt and start developing new and expensive capacity.
Thanks, Rune! Nice post.
I think you make a good point about the role of higher price in encouraging higher production. The production that has been coming on line is available because prices rose to a point where producers were pretty sure that they would stay above $50.
You also point out that if prices were to rise much higher, and stay there, perhaps more, even tinier fields could be brought on line.
But there is a limit in all of this. As you point out, oil price rises based on supply and demand. At some point, the price becomes too high for people to pay, and many countries enter recession. It seems like we may be reaching this limit now.
As noted above, post-peak fields seem to make an incremental, but not a material difference, at least in regards to conventional production. We shall see how much of a material contribution that rising unconventional onshore production can make*.
Texas crude oil production (RRC) and North Sea crude oil production (EIA) on horizontal axes (around their respective peaks), versus US annual crude oil prices on vertical axes:
*A note regarding the gargantuan difference, between the Texas RRC and the EIA, for late 2011 Texas monthly crude oil production:
http://www.theoildrum.com/node/9188#comment-892789
And Texas is producing 1.5 million barrels per day now. A little higher now that fracking has come along with its 60-90 dollar marginal oil. But still a far cry from peak.
The latest number from the Texas RRC--which sums the reports from Texas producers--shows 1.05 mbpd for December, 2011. The EIA, which uses a sampling approach to estimate production, shows 1.65 mbpd for December, 2011. It's a difference of "only" 600,000 bpd. As noted in my link, it makes one wonder how much of the reported increase in US crude oil production is a result of the EIA's flawed methodology.
westexas,
I think I remember that sometime ago you had a post that made a similar comparison between EIA data on natural gas production in Texas and local data (Texas RRC probably). Would it be possible for you to give a link to that post?
I think that I posted a note on Art Berman's last Oil Drum article on shale gas plays. Here is a link to the RRC data for annual Texas gas production (2011 not out yet):
http://www.rrc.state.tx.us/data/production/gaswellcounts.php
Note the decline in Texas gas well production from 2009 to 2010. Also note the difference in per well production rates in 2010 versus 1972. We see a similar pattern for Texas oil production, which is probably indicative of the overall Mid-continent, i.e., the per well production rate has fallen substantially, relative to the early Seventies rate.
Thanks,
Actually I misremembered. It was Art who posted a diagram and you commented on it. Anyway I found what I was looking for.
Hello Gail and thank you!
A higher price has encouraged investments in more expensive production.
The world has seen little of increased supply of crude oil (crude oil and condensates) from years with higher price.
Oil companies will develop and bring into production any field that meets their criteria for profitability. The price returning profits is normally a price lower than what oil presently is trading at.
It should be expected that future fields will be smaller and require an even higher price. Smaller fields have expectedly lower flow rates and are thus less able to offset decline rates, which could accelerate.
As you point out there is a limit and OECD consumers have cut back on oil. Within OECD oil consumption has declined with more than 4 Mb/d since it peaked in 2005 at 50 Mb/d (I do not believe OECD oil consumption will return to 2005 levels).
I would not bet against that we presently may be in the twilight zone of what price consumers are able to pay and what price is profitable for oil companies to encourage investments in new capacities.
I believe that total debt levels, deleveraging and austerity measures increasingly will curtail future demand, also for oil.
Some food for thought is that the debt was accumulated while oil prices were low and these same debts are now expected to be serviced and repaid either in an environment with growing supply and fast increasing oil price or stagnant/slightly declining supply and a high oil price.
Something will apparently have to give.
Hi it is propaganda by the media when they said that austerity measures has been occurring in many Eurozone countries(except Greece). In France, UK and other countries there have been hidden stimulus by debt monetization. (http://www.marketoracle.co.uk/Article34544.html). Thus instead of a supposed huge fall in demand, it will be a zig-zag between increased demand and slightly falling demand depending on if the monetization slows down. However, there will of course be a consequence to this debt monetization and it is only at the end game where the greatest effect will occur.
This reminds me of an article earlier this year, from the Swedish critical magazine Ordfront. My translation below.
http://www.ordfront.se/www,-d-,ordfront,-d-,se/Ordfrontmagasin/Artiklar%...
I like this sentiment.
Perhaps Sweden should reconsider its ardent commitment to letting something along the lines of 50.000 immigrants in every year?
From what I understand you already have 10% unemployment total and 20% among young people.
That is perhaps an unfortunate conclusion, yet at the same time the question must be asked: where will they go? Especially the situation for East Africa is dire. I'm more or less resigned to the fact that quite a whole lot of the world's population will die - directly or indirectly - due to lack of food or water. My conscience simply weighs too heavy. I will probably hide illegal immigrants if I ever get the chance.
It is indeed a precarious world. It was not long ago that migrants from Scandanavia flooded to elsewhere. Scandanavia always had a problem growing enough food - not enough sunlight. Same was true in UK when the population explosion hit its stride in the 19thC, even though we could grow more food per acre, and we had more acres. Not enough acres now, of course. Who is tomorrow's migrant?
PS Do not rely on slow-growing northern biomass.
I am scandinavian, and the famiy I grew up in is traditionally anti-racist. My mothers mother was indeed hiding refuges. She had a hidden space behind a wardrobe. You entered the wardrobe,and opened a secnd door inside there. A matress was on the floor and there was a lamp. The space was used foremergency hiding if uninitiated people came visiting. My grandmother was one of those "engaged" people (in society), so people came visiting all the time. But very many people knew what was going on. Once a car came, grandma told the kids to go hiding. It was my uncle. Flase alarm. But then she forgot all about it, and hours later she wondered why the house was so silent. Then she remembered she had 3 illegal imigrant kids in her wardrobe, staying as silent as possible. For several hours. An oops moment.
Today I have learnt a very hard lesson; if people come from poor countries, to our rich countries, they will be upgraded to high-consumers. The world can't afford any more consumers, and thus we should not let them come. But then you have all these people with horribly tragic stories. I can't sit here and say with all my western wealth "sorry, you can't come". Any choise we make is the wrong one. There are no good options.
Hi Rune,
Thanks for the great summary of where things stand for Norway’s crude production. Based on your charts for crude discoveries I updated a recent model I created using webhubbletelescope’s oil shock model ( http://www.theoildrum.com/node/9153/891043 ) I used discovery data up to 2004 based on a 2005 paper by Jean Laherrerre
( http://www.mnforsustain.org/oil_forecasting_production_using_discovery_l... ) and filled in data from 2005 to 2011 based on your data from the NPD. The large discovery in 2010 has a significant effect on my model. I also modified my model to a crude only model (previously I had chosen C+C+NGL to compare with an older model created by webhubbletelescope). In my old model the URR was 36 GB for Norway, in the new model I chose 37 GB due to the large recent discovery which I had left out.
Further research at the NPD (Norwegian Petroleum Directorate) website led me to a forecast of 42.5 GB of crude for a URR when undiscovered oil is included see following link and download from right side of page.
http://www.npd.no/en/Topics/Resource-accounts-and--analysis/Temaartikler...
I created a second model with a URR of 41.5 GB. In each model the discoveries beyond 2011 were filled in using a dispersive discovery model. Discoveries to 2011 are about 32.6 GB so the future discoveries are approximated using the dispersive discovery model (see my previous comment on how this is accomplished). The second model is quite optimistic ( possibly unrealistic), but is actually a little lower than the NPD’s central estimate.
No new peak is expected, but if the larger URR of 41.5 GB is correct, we might see a plateau in a few years time which could last 10 years or so. For the lower URR of 37 GB the decline will slow a bit. but the relentless depletion will continue.
DC
Hello and thank you for sharing!
I find your work interesting.
There are areas of the Norwegian Continental Shelf (NCS) that still has not seen a drill bit, like vast areas in the Barents Sea and Lofoten/Vesterålen to name some.
It appears as both Norwegian Petroleum Directorate (NPD) and the oil companies think they have more to learn about understanding the potential of the Barents Sea.
The estimate on recoverable reserves for Johan Sverdrup may change and this will affect the production profile I have used. Further it has been made other discoveries that may be brought into production by 2020.
The one parameter I now believe will have the greatest future impact is…..the oil price.
Rune,
I agree that the oil price will have a significant impact on future production.
In the shock model it would show up as an increase or decrease in extraction rate, as well as a change in the time it takes to develop discovered resources, no doubt the degree of exploratory drilling would also be affected.
My model (which follows webhubbletelescope's earlier model rather closely) assumes fallow, build, and mature times of 5 years and a slight increase in extraction rate from mature reserves going forward (an increase from 0.2 in 2001 to 0.22 in 2062).
You seem to be concerned about a drop in prices, I assume that you are worried that current high prices may lead to a worldwide depression which would likely lead to a drop in prices, which might lead to to economic recovery eventually and an increase in prices (in summary price volatility).
If this is what you envision (and Gail the Actuary has repeated this theme often, along with debt problems and complexity), I agree.
Although such price volatility is expected as we reach the limits of how fast oil can be extracted, I believe the underlying costs of extraction will dictate the price of crude oil in the long run and expect that the overall direction of crude oil prices will be up (on say decade time scales.)
If you are worried that as the price of crude oil rises to very high levels, maybe 200 USD (in 2011 USD) or more that non petroleum energy sources will become competitive with petroleum, I think we are still far from that scenario.
The optimistic side of me hopes that we reach that point before we do too much climate damage and that as non-carbon energy sources ramp up that they will become cost competitive with coal due to ecomomies of scale and the eventual rise in coal cost as it depletes.
The realistic side realizes that the sitution will have to become quite bad, before any mitigation of energy and climate problems will begin. Hopefully it won't be too late to move from our current unsustainable path to some pathway that can lead to a sustainable world.
DC
In the long term supply and demand balance. Since supply is restrained by geology the price is the maximum price that the global economy can support, and that depends on how efficiently the oil is used to generate GDP. Right now, the economic block that most efficiently converts oil into GDP are the BRIC nations (excluding Russia, which is still a major oil producer). The block that is least efficient is the USA and parts of Europe. Hence the decline in OECD consumption. Currently the decline is the low hanging fruit. For all it's whinging the USA can and is become more oil efficient. Not pleasant for the individual losers, but it does not take much in the way of education to drastically reduce oil consumption. All that is lacking is the political will. Of course, China is becoming rapidly less oil efficient as it builds huge amounts of oil dependent infrastructure, but they will be ahead of the curve for a decade or more yet. Chinese peak coal (and environmental collapse) are their big problems. If one doesn't get them, it will make the other worse.
I do not see the oil price declining in real terms except for brief periods like 2009 until China collapses from other limits to growth.
Average annual crude oil prices have, so far, all exceeded the 2005 annual price, and five of the past six years have shown year over year increases in annual crude oil prices.
China has 1/2 the US GDP but equal energy use(waste) by Mtoe:
https://docs.google.com/spreadsheet/ccc?key=0AhORuxOwZhGydFM5NEktZkFFR0x...
China's economy grows because it wastes twice as much as fast as the US ... not because it is more efficient.
For China to have the same GDP as the US it would have to waste twice as much as it does now, which is (likely) physically impossible: it does not possess the needed infrastructure.
I wrote OIL efficient. Oil is a lot more expensive per BTU than any other fossil fuel.
Of course China is not energy efficient overall, but that was not my argument. China is winning hands down economically even if they are losing energetically. It won't last, of course. Nature bats last.
Oil prices are a double edged sword. Such a unique energy source as oil should have been higher priced, but a higher oil price affects economic activity.
I believe an economic slowdown is baked into the cake due to unsustainable debt levels. If oil prices decline as a consequence, this would slow down investments for new capacities as oil companies loses momentum and from there it will take some time for the oil companies to regain momentum.
Debt was used as an instrument to generate growth and debt thus became also instrumental in pulling demand forward and give price support for (also) oil. Deleveraging is very much running this process in reverse.
The cost of extraction has never dictated the price of crude, so why do you expect it to start now? The extraction cost from very large reservoirs is only a few dollars per barrel. But it goes up from there. However you did not say whether you were talking about the marginal cost or the average cost to produce a barrel of oil. That makes all the difference in the world.
The marginal cost to produce the last barrel of oil rose to $92 in 2011 but the average world price per barrel in 2011 was about $112. The average cost of production however was nowhere near the marginal cost. The average cost to produce a barrel depends entirely on where it is being produced from but I would suspect it would be near $20 a barrel in MENA countries but would be between that figure and $50 a barrel elsewhere.
Supply and demand has always dictated the price of oil and I suspect it always will. Demand is what is driving up the price of the marginal barrel. The higher the demand, the higher the price and therefore the more drillers can afford to spend to produce that marginal barrel.
Ron P.
Exactly, buyers of oil does not worry about the costs for the producers. Buyers of oil wants oil as cheap as possible.
Hi Ron and Rune,
Buyers want it cheap, producers want is expensive, that is is of course true.
I believe that most here have some knowledge of Econ 101 basics (especially you). In the world of a perfectly competitive economy (a fantasy I realize), the price is determined at the margin. If I am planning to extract oil and expect that the future price will be 50 USD when I sell my oil, I will be unlikely to go ahead with a project where the cost per barrel will be 100 USD. So in short, the price will be determined by the marginal cost. This will especially be true when the market is tight, when demand is slack the price will just clear the market, OPEC probably helps in this case (less demand) by reducing price volatility on the downside.
Supply=Demand must always be true. The question is how much will be supplied and how much will be demanded? This is always a guess and in the perfectly competitive model (the simplest to explain) a business maximizes profits at the point where its marginal revenue equals marginal cost and will just produce full on and supply products until the price (marginal revenue)falls to its marginal cost. No buyer cares about the costs of a business, they want low prices mostly. When we talk about costs of supply we are looking at how much will a producer supply if demand were unlimited at the current price level and this is determined by the marginal cost. Demand is determined by consumer preferences (a bit of a black box analytically) and we will just take them as given, but as prices go up less is demanded. From the producers perspective the price is just a given that they cannot control (a market clearing number that nobody can control.) Under these circumstances, which only really applies for the oil market when OPEC gets close to its output capacity, the quantity supplied is determined the interaction of marginal costs and marginal revenue(price).
I can imagine Rockman will chime in that it does not really work this way, and I will dfer bacause I don't know 1/100th of what he does about the oil industry. In general terms though, If I told him that he could know in advance the price of a barrel of oil when a project would be completed and that he could also know in advanve how much the total project would cost, prevailing cost of capital, an the total amount of oil (and gas) that would be extracted, he would be able to calculate a rate of return for the project, if it reaches some level he is looking for (which takes account of the risk of NOT knowing any of these numbers in fact (they are all estimates in the real world) he would say go ahead. In my analysis, these projects that are just on the margin of being profitable would be marginal barrels.
DC
edited to account for Rune's comment
DC – I’ve had a few econ courses including ones specifically geared to oil patch investments. Over 37 years I’ve done hundreds of econ analysis of drilling deals. I am wondering if we might be talking past each other a tad. First, to be honest, I’m not entirely sure what the phrase “the price is determined at the margin” actually implies. I might project that the cost of a bbl of oil I’m drilling for will be $50/bbl and expect to sell it for $100/bbl (which BTW doesn’t sound like a very good prospect). That doesn’t mean either expectation will be met. Today I’m selling NG and oil from two wells in Matagorda County in Texas. Based upon an oil equivalent basis the production from one well cost me about $25/bbl to develop. The oil from the other well, sitting just 2,400’ away, cost me over $200/bbl to develop: didn’t find as much reserves as hoped and had drilling problems that ran costs up about 50%. I’m selling the production from both wells to the same buyer for about $107/bbl. So why am I not selling the more expensive oil for a higher price? Easy answer: my crude buyer couldn’t care less what it cost me to develop my production. I either sell my production at the price he offers (a tad higher than other buyers in the area) or I shut in and lose 100% of my cash flow from the wells. My buyer pays me based on the price the refiner pays him. Not only does the refinery not care what it costs me to produce my oil they don’t even know who I am.
I suspect you know and appreciate what I’m saying. That’s why I wonder if there’s not a bit of miscommunication going on. What say you?
Rockman, I was typing my reply while you were posting yours and posted before I read your reply. But you said exactly what I thought you would.
Ron P.
Hi Rockman,
My "the price being determined at the margin" was a mistake. I was trying to get across the idea that given the price, a business in a perfectly competitive industry maximizes profits when marginal cost is equal to marginal revenue. In some businesses like yours there is greater risk that actual costs don't always end up near the estimated cost. Once a project gets beyond a certain point I imagine it is just completed and the oil is produced regardless of cost in order to recoup some of the sunk costs. So how much is supplied at any time, given past investments, just depends on supply and demand and the resulting price. So my comments about OPEC and spare capacity are irrelevant under many circumstances. I also realize that estimates are often wrong, and predictions of the future are problematic, but that is all a part of the game and when you are good (as I imagine you are) the estimates aren't far off very often.
Lets look to future supply and how that might be influenced by expected future prices.
If all else is equal, I would assume a higher expected future oil price and/or a lower cost per barrel for any given project would make it more viable.
Based on your comment a $50 profit per barrel would be less attractive than $82 per barrel, my guess would be that there is no rule of thumb because every project is unique, some are more risky and might require $80 expected profit per barrel, maybe a more straightforward project might require $60 profit per barrel.
How these projects are evaluated and the estimates that are made for costs, prices, and profits will be largely based on past experience, especially the recent past. If recent new projects were not very profitable one would look at what went wrong (prices dropped, costs went up.) It might also lead to more conservative future estimates.
Those higher cost per barrel projects could be thought of as the marginal cost of a barrel for your company, but probably a better way to look at it is just the average cost per barrel of new projects (maybe those that have started producing over the previous 12 months).
If these new projects have done badly as a group the company may be less willing to invest in new projects and may have a tendency to raise the estimated costs of new projects and/or lower its forecasts of future oil prices so that fewer future projects make the profitability cut. This would in turn lead to lower future oil supply from your company, until profitability improves.
Other companies in similar circumstances would also reduce their future output reducing overall supply.
In a nutshell, everyone keeps saying that the market (supply and demand) determines the price, I agree. They also seem to imply that nobody cares how much it costs to produce a barrel of oil, this is where I part company. I agree that the cost per barrel doesn't matter to buyers, but as a producer I think you would agree that the cost of a barrel of oil makes all the difference to your bottom line, especially the difference between price and cost. When profits go down investment in new projects may go down and if so oil supply will be reduced(think shift of supply curve left).
DC
DC - As I thought...just some misunderstandings. "They also seem to imply that nobody cares how much it costs to produce a barrel of oil, this is where I part company". Yes...I've seen some folks take that tack. They seem to think that the price we'll sell our product is related to what our per bbl development cost might be. And this is where the oil patch/investor mentality really messes up classical economic analysis. One would think that during a period of rising prices profitability would also increase as long as prices stay up. So ignore the degradation of profits during a price collapse and let's just talk about the good times.
Like in the late 70's when the increase in oil prices led to the biggest drilling boom the oil patch had seen before or since. We had more than twice as many drill rigs then as we do now. And while was at an all time high I saw more companies go belly up than succeed. And I'm talking about the period long before prices fell to $10/bbl in 1986. The misplaced enthusiasm over high oil prices led to thousands of crappy prospects being drilled. I worked with one of the worse during that time. They spent $550 million and found less than $100 million in reserves. Oil could have sold for 3X what is was and they still would have filed for bankruptcy. Their first exploration venture (in Indonesia) discovered a billion bbl field that cost a tiny fraction of the then price of oil to produce. But that still wasn't enough to save them from themselves. They failed years before oil prices collapsed. It's obviously difficult for traditional economic analysis to take these types of investment into account. I've said it before and it's still true: the oil patch has a well known term for this investment strategy: STUPID MONEY. Really. I can tell another hand that Company X is stupid money and they have a clear picture of that operation.
I don't see a lot of stupid money these days. But think some operations could be called "questionable money". I think some of the current shale players may deserve that moniker. Not so much that they are making stupid investments but they are betting on what looking more and more like an unsustainable drilling model. Works well if you monetize the operation as Petrohawk did by selling out for $12 billion before the marginal returns start leading to a possible collapse. Were Petrohawk's wells more profitable than Chesapeake's current efforts? I doubt it. Was Petrohawk's undeveloped shale going to be more profitable than CHK's? Again, just my guess but no. At one time CHK was in a position to sell out and reap a huge reward like Petrohawk. But they didn't time it right. The NG price collapse in '08 put them in a poor position to do it. As they recovered with the aid of higher oil prices and the initial results from the oily shale plays stock value started to improve. But now it appears they lack the cash flow and borrowing base to maintain a drilling program that will allow them to maintain reserve growth. And that, as they say, is usually the last nail in the coffin for a public oil company. They might survey margin returns on their drilling efforts but if wall Street begins to suspect the days of y-o-y reserve growth has ended they won't hesitate to kick that company to the curb and start hunting the next sizzle. As I'm sure you know: Wall Street doesn't sell the steak...they sell the sizzle. And when one company's sizzle fizzles it time to move on. LOL.
Err... no it simply is not. I am afraid you are confusing the term margin with scarcity. Oil is really no different than any other commodity in that the price is always, always, always determined by supply and demand. (Well except in the cases of price controls and/or rationing of course.) But in the absence of those two things, price and demand always sets the price. Marginal cost really has nothing do do with it. The price will determine what the marginal cost per barrel is, not vice versa. That is the price of a barrel of oil will determine what the producer will spend to produce that marginal barrel. That, DC, is Economics 101.
DC, OPEC's marginal cost is far less than the marginal cost of a deep sea sub-salt field off the coast of Brazil or even the marginal cost of a deep sea field in the Gulf of Mexico. The price of oil is at least twice the marginal cost of any OPEC producer.
You are right in that Rockman knows a lot more about the oil business than either of us. However I know that Rockman will tell you that drillers often produce oil at a loss. Not intentionally of course but it often just works out that way. The driller obviously thought, when he began the project, that he would make a profit. But if it cost him $140 a barrel to produce the oil he will still sell it for $100 a barrel if that is all he can get. Better to take a small loss than a total loss. I mean he will not hold out for $140 a barrel simply because that is what it cost him to extract it. If he did he will not sell a single barrel even though his "marginal" cost was $140 a barrel.
Again, supply and demand determines the price of any commodity or product. They drill that fact into your head in Economics 101 over and over and over. Oil is not special in that respect.
Did you really take Economics 101? I did.
Oh, truffles are going for between $2,000 and $4,000 a pound. I doubt that the marginal cost of a pound of truffles are anywhere near that figure.
Ron P.
Hi Ron,
Supply and demand determines the price. Maybe it was the next level of microeconomics that I was confusing with the introductory level, it has been a while since I have taught this stuff. Many here keep harping on demand and that is indeed important, but always remember that it is the intersection of supply AND demand that determines price. Sometimes the example of scissors is given, that you need both blades to easily cut the cloth.
I agree with your assessment about OPEC in the short term, that marginal costs probably don't matter, but let's do a quick thought experiment. Imagine that we have a situation like the summer of 2008 where there is little or no spare capacity and everyone is pumping full out, let's imagine this continues for 10 years or so with no recession(unrealistic, but so is the underlying economic model of a perfectly competitive market). Price will be determined by the intersection of the supply and demand curves as always, but this is where the supply curve starts to approach the theoretical perfectly competitive market introduced in Econ 101. I am pretty sure at the introductory level the supply curve is taken as a given, but in the long run if demand is high enough to absorb all output produced, in that case the supply curve will be determined by marginal costs. Any individual company will bring every barrel to market that it can, through extra drilling and workovers and so forth and for every project considered they will look at the price and the incremental cost per barrel of any new output brought to market, if it makes economic sense when looking at the opportunity cost, (are there other ways the company could use that money that would be more profitable) the company will make the investments to bring the extra barrels to market. The average costs of production are of no consequence in determining the supply curve, this is why the low costs of OPEC vs say deep water GOM or the North Sea really do not matter in determining the total quantity supplied at any given price, it is the cost of those marginal barrels that matters when supplies are short as in 1980 to 1982, 2008 up to July and in 1973-74. As decline sets in we will approach this supply limited scenario more and more, though as many have pointed out the high prices may lead to recession or depression which would shift the demand curve to the left and drive prices lower. In addition there may be some switching away from oil by more fuel efficiency, fewer miles driven, etc.
Clearly the price of the same grade of oil ( I am aware that every barrel is not identical there is heavy,light,sweet, and sour) will be the same worldwide regardless of the cost of production. I also realize from many comments that Rockman has made in the past that once the project is set in motion it usually goes forward regardless of oil price and the oil might be sold at a loss in some cases.
The question I was addressing is what determines the supply curve for oil? This is maybe intermediate micro rather than intro. So if you are in business to make money that is done by maximizing profits and this is accomplished when marginal cost is equal to price (marginal revenue) if one is operating in a perfectly competitive market.
Now we would all agree that oil companies are in business to make money and although some projects may be money losers, they can't all be or the oil companies would go out of business eventually.
So what does an oil company do when they evaluate an oil project? I don't know the details that Rockman would but I will venture a guess. They use their knowledge to estimate the cost of any project they are considering along with an estimate of recoverable reserves and an estimate of the price of oil over the period it is produced. They also look at the cost of capital and require a certain rate of return to put that capital at risk. For any given project the price of oil will impact the decision on whether the project will be profitable and that will determine whether the oil will become part of the oil supply. If oil is at $50 fewer projects will get the green light than if oil is at $100, assuming every other variable is unchanged.
From the comments that Rockman makes it seems that there are few prospects in his area of operation (mostly Lousiana and Texas?) for crude at current prices that would be profitable (or not high enough profits to account for the risk). So rather than just say it is supply and demand which determines price (which is correct), I am considering what determines the shape and position of that supply curve for oil that then intersects with a demand curve to determine price.
Any new barrels of oil that come online due to project developments in the North Sea, Brazil, Africa, or the Arctic will have some cost per barrel associated with them and the most expensive of these projects (in terms of cost per barrel) will be the barrels with the highest marginal cost. These marginal costs will not determine prices, but they will influence the position and shape of the oil supply curve. How is that possible if everyone just sells these high cost barrels at whatever price they can get(i.e. at a loss)? In the short run it has no effect, but in the long run if most companies are producing oil at a loss they will go out of business. It has a greater effect on the supply of oil a few years down the road when new oil investment slows because profits on recent high cost per barrel projects have been poor. I won't go into the reserve replacement issue, suffice it to say that losses on a consistent basis will slow investment in the oil patch at least in the long run. Less investment will reduce the oil supply as mature projects become depleted.
DC
DC - "So what does an oil company do when they evaluate an oil project? I don't know the details that Rockman would but I will venture a guess." Good guess. You pretty much nailed it.
Rockman,
I appreciate the responses. I am sure I only got the broad outlines correct. Your posts are great, it seems I learn something interesting every time I read one. The knowledge you share about the oil industry, your patience with poorly phrased comments ("price is determined at the margin"), and your pragmatic perspective on may topics make your comments some of the most interesting at the oil drum. Thanks.
DC
DC – I think the “broad outlines” will serve you, TOD and the public better than trying to work through the details our geekworld. Lots of fantastic tech in our efforts. But the reality is it’s as much an art as science and we tend to use a hammer more often than a scalpel. And that includes predrill economic analysis. I enjoy teasing exploration geologists who present ROR values carried to two decimal places. There has never in the history of the oil patch been an exploration well proposed that didn’t include an economic analysis showing it to be a very profitable effort. First, the prime assumption that there is any oil/NG present in the first place is often wrong. Yet I’ve sat in meetings and listen to long argument over whether a discount rate of 10% should be used instead of 12%. Or if the forward price of oil used in Year 5 should be $105/bbl or $112/bbl. At times it can be difficult to keep my mouth shut. LOL.
My analysis of an exploration project is purely non-numerical. Simply: do the geological concepts make sense and is there a reasonable expectation of hydrocarbons being present. I can’t tell you how many times I’ve seen managers/investors drill wells because they were impressed with a spread sheet when the geologic rational was horribly flawed.
The Big Picture framed by broad outlines is more than sufficient to relay the reality of the situation. Arguing the details only distracts for the public’s education IMHO. But it is enjoyable for geeks like me, wt, Ron, RMG, Web et al. LOL.
One of the important implications of a dispersive discovery model is that it does allow for larger amounts of oil to occur in the tail beyond the peak. That's how DC was able to generate an asymmetric curve with a fat-tail, which seems to match potential future discoveries. Note how this approach differs from the Hubbert Logistic model, which precludes asymmetry in curves (unless someone decides to use a multi-Hubbert, which essentially confirms that the Logistic is a poor heuristic).
On another point; I think the Norwegians have not been as aggressive in their search for oil as some other countries. That is not necessarily bad. They seem to have kept a measured pace, and tapped what they needed as their reserves started to top off. So the volume of their search region has progressively gotten larger over time, thus causing the URR to creep up, from 36 to 41.5 according to DC's updates to the model.
Bottom-line is that we couldn't have modeled Norway as well as we have if it wasn't for very open details of production statistics from the Norwegian government.
Thanks to expert analysis from Likvern and Coyne with their updates.
WHT,
Your welcome, thanks for your input. I was a little surprised how the 2 GB discovery in 2010 changed the shape of the curve even on my model of 37 GB (about 1 GB more than the recent model I had done). When one considers that 2 GB is over 6 % of all Norwegian oil discovered to date, I guess it is not that surprising. In addition, raising the estimated URR by another 12 % from 37 Gb to 41.5 Gb results in a very dramatic change in the shape of the modelled output curve.
DC
Don't post here often but would like to express my gratitude for this excellent post. Very informative.
I totally agree.
I'm watchng Bloomberg as I write this and the vast majority of the money men still talk as if the slow-burn economic collapse we are experiencing is somehow recoverable from; as long as most people accept increasing poverty so that the 1% can continue thriving, that is. (They don't say that on Bloomberg, my interpretation!)
And the British governement has just fudged another annual economic plan by including, amongst other things, paid maternity/paternity benefit to be shared between parents for six months. Like we need to encourage the production of more and more children, and like businesses are there to act as an extension of the benefits office. What i am saying is that we are kidding ourselves, or more accurately, our governments are lying to us. Governments are spending our money recklessly and refusing to tell it how it is. Energy, oil: hell, we are now being sold fracking as a solution to our energy problems for another 100 years, and business as usual. For the 1% anyway, the rest of us will be fed tidbits of hope and do as we are old. For how long I wonder?
I am a total pessimist and have been depressed about PO for years though.
Lundin Petroleum AB: First Oil From Johan Sverdrup Discovery Expected in 2018
I have revised my forecast in figure 5 to reflect this.
- Rune
Thank you very much Rune. I agree with others about figure 5, but also was much impressed by figure 6 showing the rather dramatic declining discoveries each decade. Very scary.
I was wondering about the other side of the equation - Norwegian oil demand.
Down from a peak in 2006 of 236,700 b/day to 221,300 b/day in 2010. Like it's Nordic neighbors, is Norway trying to transition off oil ? Is there any public consensus to start doing so ?
I know from Iceland, that fishing is a major and hard to substitute use (they were looking at methanol).
The new tram line in Bergen, and expansion plans are impressive for a town of that size.
http://www.bybanen.no/bilder/kollektivvisjon.jpg
There has been talk of single track high speed rail lines out of Oslo to smaller Norwegian cities - and even picking up where the Germans left off in extending rail north towards Narvik. Both just talk as far as I can tell.
A Norwegian company Fisker is starting to build electric cars.
Are these just disconnected bits - and is there a chance for a more comprehensive approach to reduce Norwegian oil use ?
Best Hopes for Norway,
Alan
Hello Alan,
Presently there is a lot of petroleum related activities (which consumes petroleum) going on the Norwegian Shelf so as of now it could be that petroleum consumption data for 2011 could show some growth relative to 2010. The higher gasoline prices have lowered demand somewhat.
I am not aware of any public consensus to start transition off oil. However there are several ongoing projects to improve roads, railroads (with new improved trains) to reduce congestions, reduce taveltime and also looking into improvements to encourage more use of bicycles and walking.
Most of this is related to traffic load during rush hours.
Norway is a long and small country and generally sparsely populated with lots of mountains. The geography makes road traffic more economic for moving people and goods. Exceptions are areas more dense populated like Oslo, Bergen, Stavanger and Trondheim.
Stavanger is also looking into the possibility of building tram lines. In the Oslo area a lot of investments are made to improve regularity and capacity for intercity travel by rail.
Bergen and Oslo also get air pollution issues in winter time (combination of exhaust and dust from use of studded tires, more use of heating oil (which there is a campaign to reduce the use of and from wood used for heating). In Bergen the issues with air quality has led to temporarily restrictions of car use when things are bad.
There are some who keeps the idea of an extension of the railway from Fauske to Narvik alive, but again geography (terrain, distances) and population densities makes the extension hard to justify based on economics.
As I see it all these initiatives are not a comprehensive approach to primarily reduce Norwegian oil consumption, but more a result of improvements of systems that were not designed to handle the growth in traffic loads and also the seasonal pollution problems created.
Norway's economy is also heavily dependent on the oil industry, not just production but also companies involved in maintenance and technology etc. The performance of the Oslo Stock Exchange is also very intertwined with the oil price. I think its in the interest of the Norwegian government to keep the oil industry going for as long as possible.
When it comes to Norwegian consumption, it is probably a goal to reduce it as that will increase exports, and also prepare the country for a oil free end to the century. The high petrol prices (worlds highest, next to Turkey) is a part of the *tax the hell out of everything* strategy that the socialist style welfare state use to increase its income.
Thank you for an interesting piece. In addition to these I guess Hild will be sanctioned any time now with a production profile similar to Edvard Grieg(?) (their reserve base are of similar size anyhow..)
By looking in the rear mirror at a similar time frame (2008-2011) there were 6 fields starting production (Alvheim, Tyrihans, Gjøa, Morvin, Volund, Volve) with a combined production of 260 kb/d in 2011 (crude only). Still the decline rate in the existing reserve base was so steep that the combined production (crude only) from old and new fell from 2,21 (in 2007) to 1,68 mb/d (in 2011). Counting only the existing in 2007 to 2011 the production rate fell from 2.21 to 1.42 mb/d. Ie. a depletion rate of 36%!
Just makes you wonder what the norwegian oil production would look like with a sustained oil price of 40$/b (which were considered high 10 yrs ago..) Not to mention the norwegian economy...
Hello,
I have included Hild, now Martin Linge in the forecasts I have presented in this post.
$40/bbl would have produced quite a different result.
Chart above shows the development (decline) in crude oil production from fields that started to flow prior 12/31/2001 (green columns) and how total decline in Norwegian crude oil production has been moderated by production from fields that started to flow as from 01/01/2002 and thereafter.
Note that the aging fields (flowing prior to 31/12/2001) have declined from a total of around 3 Mb/d to around 1 Mb/d in 9 years.