| Tech Talk - More on Hydraulic Fracturing | The Oil Drum | Norwegian Crude Oil Reserves and Production as of 12/31/2011 |
Energy Supplies and Climate Policy
Posted by Euan Mearns on May 7, 2012 - 11:54am
This is a guest post by Dave Rutledge. Professor Rutledge is the Tomiyasu Professor of Electrical Engineering at Caltech, and a former Chair of the Division of Engineering and Applied Science there. This post originally appeared on Judy Curry's Climate Etc. blog here.
In this post, I consider the limited impacts of climate policy on fossil-fuel production and discuss estimates of fossil-fuel production in the long run. Since this is a cross post, with the original aimed at an audience with a climate interest, it includes introductory material that will be familiar to most Oil Drum readers. I would like to acknowledge the comments on my two earlier TOD posts, The Coal Question and Climate Change and The Coal Question, Revisited, that have helped me in writing this post.
1. Climate Policy and Fossil-Fuel Production
I will start with the notion that the response of carbon dioxide in the atmosphere has slow components that will dominate over time, like the exchange with the deep ocean and weathering of rocks. David Archer expressed this vividly, “A better approximation of the lifetime of fossil fuel CO2 for public discussion might be 300 years, plus 25% that lasts forever.” This means that from a climate perspective, it really does not matter whether we burn a particular ton of coal now or at the beginning of the Industrial Revolution—what counts is the total that the world burns in the long run.
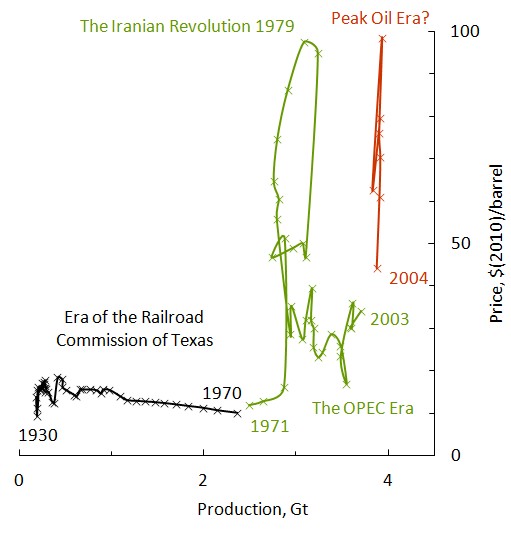
This has several consequences. First, a national policy to reduce fossil-fuel consumption, like mileage standards for cars, will have little climate impact if it does not change world consumption in the long run. Actually, because oil is traded in a world market, mileage standards may have no effect on world oil consumption even in the short run. Figure 1 shows a plot of annual production versus price. Except for the years around the 1979 Iranian revolution, production increased steadily, and the price stayed below $50 per barrel in today’s money. However, starting in 2004, the plot went vertical, with a price range of more than 2:1, but with production varying by only 2%. If this is the case, when the United States reduces consumption, it will be offset by increased consumption elsewhere.
Second, a new fossil-fuel resource resulting from improved technology like shale gas adds to long-term fossil-fuel production, increasing any climate effects. This is true even if the shale gas reduces carbon-dioxide emissions temporarily by partially displacing coal in electricity production.
The final implication is that resources must be walled off from future production to have an effect on climate. My favorite example of this, not least because of the political skill involved, was the creation of the Grand Staircase-Escalante National Monument in Utah by the Clinton Administration. This area contains most of the Kaiparowits Plateau coal field, which is a big one. The Utah Geological Survey estimated the minable coal at 11Gt. For comparison, annual US coal production is about 1Gt. The action was not popular in Republican Utah, which might have gotten $30 per ton for the coal. President Clinton, a Democrat, made his announcement across the border in swing-state Arizona, which he carried in the election two months later. Even though we can acknowledge President Clinton’s political ability, we should be cautious in crediting him with a full 11-Gt reduction in future production because it is not clear how much production would have taken place without National Monument status. Past production only comes to 40,000 tons, with none since the 70′s. It is worth noting that the US Geological Survey estimate for the recoverable coal was 4Gt, much less than Utah’s.
Can climate policy significantly reduce world fossil-fuel production in the long run? At the G8 meeting in L’Aquila, Italy, in 2009, our leaders pledged an 80% reduction in greenhouse-gas emissions by 2050. This proclamation is certainly meant to encourage the countries of the world to commit to this reduction, but so far only the UK has passed the legislation for it.
For perspective, it is worth looking at the historical record before and after the Kyoto Agreement was signed in 1997. Figure 2 shows world fossil-fuel carbon-dioxide emissions, taken from the BP Statistical Review. Do you see a decrease in emissions after the agreement was signed? I don’t either; if anything, emissions accelerated. It is worth noting that the EU and the US show the same percentage decline in emissions, 0.4%/y over the last 10 years, even though the EU countries all ratified the Kyoto Agreement and the US did not.
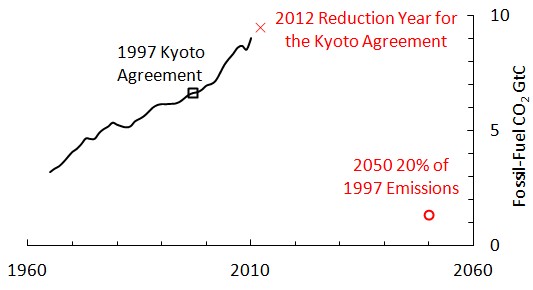
The figure also shows where an 80% reduction in 2050 would take us. It is not easy to convey the enormity of what our leaders agreed to. One comparison we can make is to the collapse of the Soviet Union. From 1990-1999, fossil-fuel emissions fell 40% there, and this was no one’s idea of a good time. To get to 80%, the entire world need to do this four times, voluntarily. Not going to happen. What were they smoking?
What about policy impacts at the local level? My home state of California has implemented an ambitious renewable-energy policy through a series of laws, starting with Assembly Bill 1078 in 2002 and culminating in Senate Bill 2 in 2011. These commit the state to a 20% renewable share for electricity in 2010, and a 33% renewables share in 2020. In California-speak, renewables means no large hydro and no nukes. In his signing letter for Senate Bill 2, Governor Jerry Brown wrote, “With the amount of renewable resources coming on-line, and prices dropping, I think 40%, at reasonable cost, is well within our grasp in the near future.”
Well, we are half-way from 2002 to 2020 now. How is California doing? You can judge the progress in Figure 3. The in-state renewables share has actually fallen during this period. California missed its 2010 goal badly, but it appears that the only result of this was to set an even more unrealistic goal for 2020. Governor Brown seems to be smoking something also.

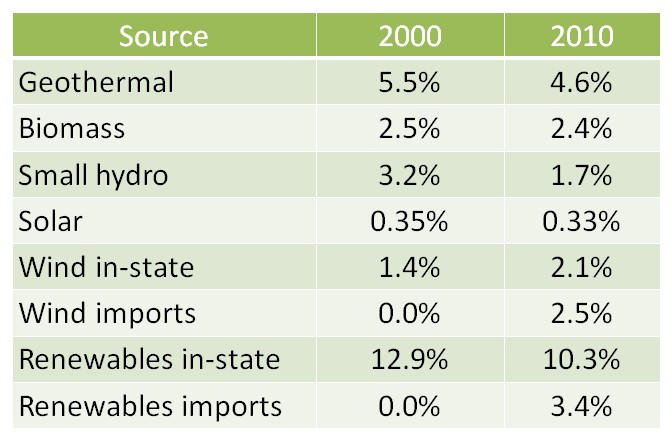
It is hard for me to think of a bigger disconnect between the politics and the reality. What is going on here? Table 1 shows the renewables shares by source. The biggest is geothermal, which peaked in 1992. Biomass is stuck because pollution rules make it is difficult to get permits to build an incinerator in California. Small hydro is no longer favored and it shows. The one bright spot is wind from Oregon and Washington, but wind imports are not going to get us anywhere near 33% by 2020. Most surprising is that the solar share has been flat for ten years, even though California’s solar resources are stupendous.
What this tells us is that there is no magic climate-policy wand that will let us set the total fossil-fuel production in the long run to a particular number. This is not to say that climate policy does not have short-term effects. The EPA’s proposals for carbon-dioxide emissions limits certainly discourage utilities from building new coal plants. If I were a Kentucky coal miner who lost his job this year I would likely blame the EPA. However, the current coal plants could be operated for generations to come, so the coal can be consumed eventually. In addition, even if American customers are lost, an offsetting export market may develop because American coal mining costs are low. Wyoming miners can make money selling coal at $10 per ton, while the price in the main export market, East Asia, is over $100 per ton. This depends on being able to ship the coal to East Asia at a cost that would meet the market price there.
2. Reserves vs. Resources
So, independently of climate policy, how can we estimate production of oil, gas, and coal in the long run? Economists have shown surprisingly little interest in this problem, but many geologists and engineers have been fascinated by it.
First we need to distinguish two terms, reserves and resources:
Reserves refers to oil, gas, and coal that have been discovered and characterized (proved), and that one could produce and sell at a profit now. People distinguish between the oil (or gas or coal) in place, and recoverable reserves that make an allowance for what is left behind when production is finished. Proved, recoverable reserves for oil, gas, and coal have been tracked at the national level for many years.
Resources refers to oil, gas, and coal that are of economic interest. This is a broader term than reserves. At the national level, resources are not well defined or tracked, and they are subject to political winds. In practice, resources means whatever a speaker wants it to mean. As a result, the statement in the President’s recent State-of-the-Union Address, “We have a supply of natural gas that can last America nearly 100 years,”conveys little information.
The boundary between the reserves and resources is not fixed. New technology and higher prices can cause resources to shift to the reserves category. For one example, because of new horizontal drilling and hydrofracturing technology, some shale gas can now be counted as reserves rather than resources. As another example, high oil prices have enabled production from the Canadian tar sands, and Canadian oil reserves are now 3rd largest in the world.
Perhaps surprisingly, reserves can also shift to resources. In 1913, US coal reserves were 4Tt (trillion metric tons). A hundred years later after 60Gt of production, American coal reserves are now 240Gt. The early reserves criteria were too optimistic—seams as thin as 1 foot down to a depth of 4,000 feet down were counted. However, this coal was not mined a hundred years ago, and it is not mined now. Over time, as it has became clear that the criteria were too optimistic, the US Geological Survey tightened up the rules, and other countries followed their lead.
We will develop estimates first for coal, and then for oil and gas together. At this point, future production for other sources like methane clathrates and oil shales is speculative, and they will not be considered.
3. Coal Production in the Long Run
In energy terms, world coal production is 95% of world oil production, and coal is on track to pass oil this decade. Coal markets are regional—85% of coal is consumed in the country it was mined. This means we need a regional analysis. I have given one in a paper in the Journal of Coal Geology that considers the world in 14 regions. I will only summarize the results here. The approach in the paper is to fit an s-curve (logistic or cumulative normal) to the cumulative production history, and to use the top of the s-curve as an estimate of the total production in the long run. Coal has a long production history that we can use to test our ideas. Several regions are very late in the production cycle, with a current annual production that is a thousand times less than the cumulative production. The results for these mature regions are summarized in Table 2 below.
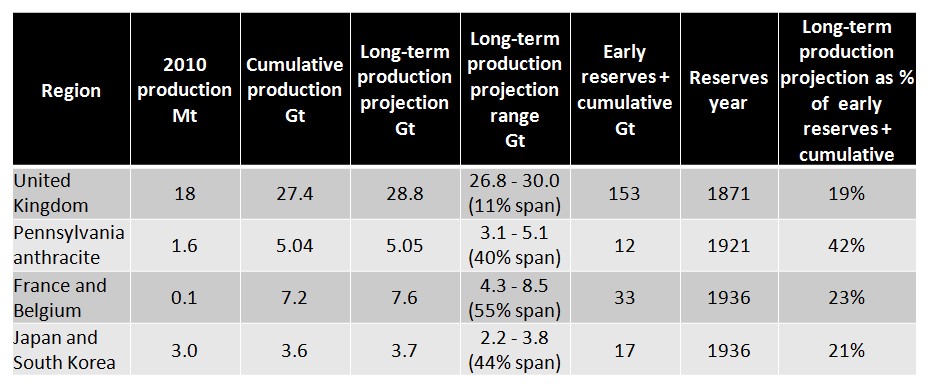
One way to estimate the long-term production is to add reserves to the cumulative production. Early reserves and production history are available for each of the regions. Surprisingly, this approach gives numbers that are too high. For example, Japan and South Korea have produced only 21% of the early reserves plus cumulative production. The other regions also show this pattern. Across the four regions, the average is only 26%.
The results of the s-curve fits are given in the “Long-term production projection” and “Long-term production projection range” columns. “Long-term production projection” gives the current estimate, and the range column indicates how the projections have evolved since 1900 (since 1950 for Japan and South Korea). The average range in percentage terms is 38%, so this gives the uncertainty in the estimate. It is interesting that in each case, it appears that the range will include the actual long-term production. However, we cannot be sure of this until the last mine in each region shuts down.
How should we interpret these results? None of the mature regions has come close to producting its reserves, so for coal at least, we might take the reserves as an upper bound on future production. It is interesting that the IPCC in its scenarios assumes that a multiple of the reserves could be produced. However, there is no historical precedent for this in any of the mature regions. On the other hand, the s-curve fitting ranges do appear to predict the long-term production correctly, with an error of about plus or minus 20%.
We can estimate the long-term production for the entire world by adding the results for the 14 regions. The latest world reserves at year-end 2008 were 861Gt and the world cumulative production at that time was 303Gt. This gives a total of 1,164Gt. The s-curve fits updated for the 2010 production give a long-term production of 723Gt, 62% of the reserves plus cumulative production. Thus, the pattern of underproducing reserves that we saw in the mature regions appears to be repeating.
The analysis also indicates that the world reaches 90% of the eventual long-term production in about 60 years. This result should be viewed as a current trend, rather than a projection with uncertainties, because historical shocks that changed the production rate. For example, production slowed after the collapse of the Soviet Union. For the mature regions the production at the 90% point had fallen to about 40% of the peak production. So at that point you would need a Plan B or use less.
4. Oil and Gas Production in the Long Run
In contrast to coal, about half of world oil and gas is exported, and we can consider a world analysis. Usually oil and gas are considered separately, but there is really not a clear distinction. They often come out of the same wells and some products like propane are sold pressurized as liquids and burned as gases. Figure 4 shows the production history.
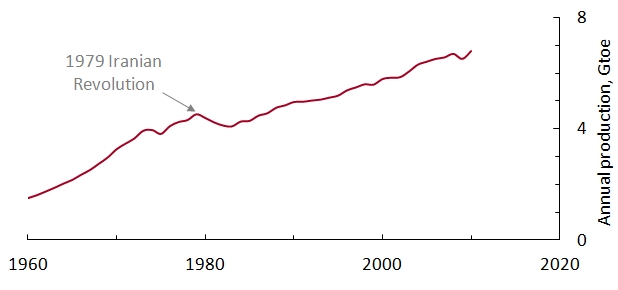
Notice that the world shifted to a slower pace after the 1989 Iranian Revolution. For this reason, I will start the curve fits a few years after the revolution. The approach I use here was popularized by Ken Deffeyes in two very interesting books, Hubbert’s Peak and Beyond Oil. The technique is called Hubbert linearization, in honor of the geophysicist King Hubbert, who first used it for this purpose. In Hubbert linearization, the cumulative production is plotted on the x-axis, and the growth rate for the cumulative is plotted on the y-axis (Figure 5). Algebraically, the growth rate can be expressed as p/q, where p is the annual production and q is the cumulative production. This kind of plot linearizes a logistic function. The chief advantage of Hubbert linearization is that it gives one an excellent way to visualize the fit. There are some disadvantages that are discussed in my Coal Geology paper.
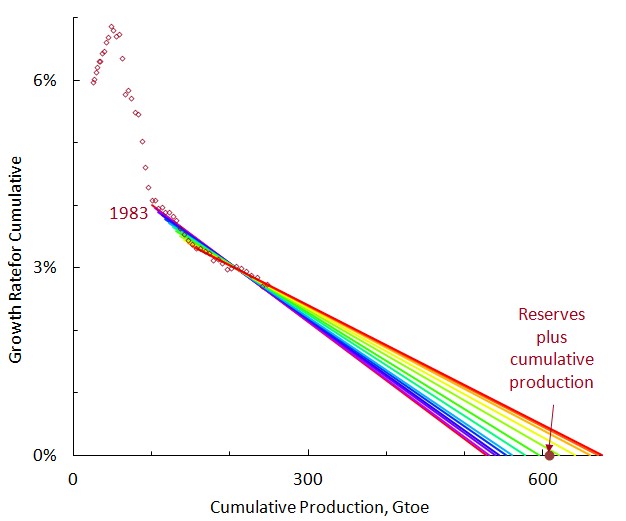
In the Hubbert linearization, the x-intercept gives the estimate for the long-term production. In the figure, I vary the starting point from 1983 to 1995 to give a sense of the uncertainty. The range is 530-680Gtoe. This range contains the reserves plus cumulative production, 608Gtoe. This is different from coal, where countries under-produced reserves. This agreement is fortuitous; it is easy to identify factors that might bias oil and gas reserves high and low. US oil reserves have historically been close to ten years of future production, which clearly makes them too low as an estimate for total future production. On the other hand, OPEC oil reserves have often been criticized for arbitrary increases and lack of outside auditing, and may be biased high.
I will not give the analysis here, but it turns out the curve fits indicate that the world reaches 90% of the long-term oil and gas production around 2070, just like coal. Again, this does not mean that production would cease by then, but it is likely to be half the peak value and dropping. And as for coal, we would either need to use less or replace the energy from a different source.
5. Discussion
Oil and gas are really quite different from coal, and we should not expect their reserves to necessarily have the same relationship to long-term production. Oil and gas are usually hidden in geological traps, and they are difficult to find. Once found, however, oil and gas are relatively easy to produce—the pressure helps. Governments can even arrange turn-key concessions, and the money starts rolling in. On the other hand, coal is a rock, and it is easy to identify most of the major coal fields at outcrops. But there is nothing easy about mining coal underground. To get a sense for this, watch Michael Glawoggen’s documentary on Ukrainian coal miners. I am sure most of us would prefer to get our electricity from solar panels in our yard to manually hewing coal underground if we could afford it. However, coal provided the first rung on the energy ladder for many of the world’s economies, and our society reflects the scientific, technical, and social experience of underground coal mining. And coal has a similar importance in many countries that are on their way up today.
Table 3 summarizes the results. For coal, I use the curve fits, because they have proved more reliable in the mature regions than reserves. For oil and gas, the curve fits are consistent with reserves, and reserves are used. The current world production is also shown for comparison.
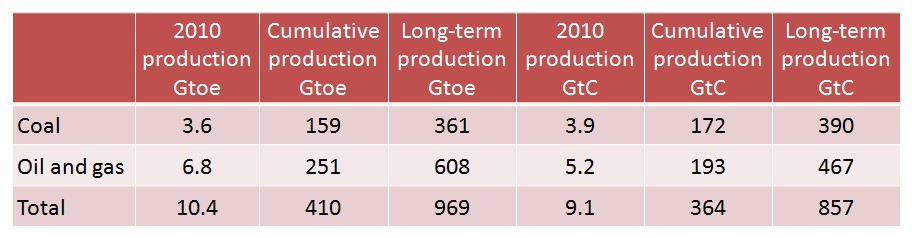
How do these emissions compare with the IPCC numbers? The forthcoming 5th Assessment Report uses representative concentration pathways, RCPs for short. The total carbon-dioxide emissions here, 857GtC, fall between RCP2.6 (peaking around 660GtC in 2070) and RCP4 (1,100GtC and rising in 2100). However, these RCPs assume an effective climate policy. They start with a prescribed top-of-atmosphere forcing and work backwards to a published scenario. It would be more appropriate to compare the emissions here to RCP8.5. This is the only RCP that is unconstrained by climate policy and it might be said, even by geology, with cumulative emissions of 5600GtC in 2500.
For people in the renewables business, what are the implications of a 60-year time frame for reaching 90% of the eventual long-term production? I do not know, but I will guess. You will be facing economic headwinds for decades, and competing with rent seekers who are better at securing favorable rules than they are at actually producing energy. You will be dependent on subsidies and renewables targets, in other words, on other people’s money. But as the Iron Lady observed, other people’s money runs out.
Contact
- Content: editors at theoildrum dot com
- Tech support: support at theoildrum dot com
License

This work is licensed under a Creative Commons Attribution-Share Alike 3.0 United States License.
Hi Dave, thanks very much for this candid portrayal of utter failure of climate based energy policies so far. Just to recap:
1) There is no difference in emissions reductions between USA and Europe even though the latter ratified Kyoto and the former did not. It is further possible that reductions achieved are in part due to economic hardship and not policy.
2) There is no discernible reduction in emissions trajectories either side of Kyoto.
3) California (along with many other States / Nations) have set and totally missed renewables targets.
4) If National governments want to get serious about emissions reductions then they need to start ring fencing those fossil fuel resources that will never be produced. US could start with Powder River basin coal and shale gas, The Saudis could shut down Ghawar, the Qataris shut down North Field and the UK and Norway could shut down North Sea production. All this would lead to a reduction in global emissions, there is absolutely zero chance of this happening, and so politicians should abandon their Green posturing and get on with planning secure and affordable supplies of energy for their populations.
In Scotland we are right in the thick of it. We are bound by UK Climate Change Act of 2008 and on top of that, not to be outdone the Scottish Parliament has set even more ambitious targets of 100% electricity from renewables by 2020 - the clock is ticking. The harm being done here is that our heritage power generation assets are being neglected. When they break down / are decommissioned the lights will go out.
We have a major drive at present to install solar panels in Scotland - subsidised of course - even though we occupy a sub-arctic zone where the sun barely rises above the horizon in Winter and barely shines in summer. These things are being installed on roofs everywhere, regardless of orientation - that's right North facing roofs are in play. One of the vendors told me that they did not need direct sun light operating purely on daylight;-( If someone would like to post data on capacity factor for solar PV in Aberdeen - summer and winter and annual average: South facing and North facing - that would be interesting data to have - I will be sending links to this post to local politicians and to DECC.
Amidst all this it is easy to come over as anti renewables - which I am not. I am all in favor of a sensible renewables strategy based on evolution and not revolution. Based on engineering and not comic book analysis found in lobby group propaganda. As a starting point, I would like to see large renewables suppliers mandated to provide dispatchable power. In that way, large suppliers would have to own (or partner with those who own) Hydro or CCGTs used for balancing or to build storage. The cost (energy and financial cost) of intermittency is met by the renewable supplier and not by some third party. In this way third class renewable energy flows can be converted to first class dispatchable power.
It seems to me that the problem with renewables is that since they are today mostly made out of fossil fuels, that their 'price' will increase as the 'price' of fossil fuels increase. I put price in scare quotes because if the price of oil goes down because people can't afford it, it might as well be the same thing as a price increase. As natural gas in the US has crashed, renewable energy companies crashed, too. In a fossil fuel price slump, the price of renewables will probably not go down as much, keeping them relatively more expensive.
The reason that renewables will remain problematic is a matter of people thinking that changing their economic/money system to look further into the future (i.e., more than 6 months) is impossible. I suppose that makes changing it impossible. I think people will 'Margaret Thatcher' their way down the slope of scarcer and scarcer fossil fuels, the whole time bad mouthing renewables because renewables cost more. I don't see any way that they couldn't cost more!
A rational person would say that we should right now be investing other people's money in renewables, even though they cost more and will always cost more, because otherwise we will just end up riding down the downslope like Major Kong without ever being able to get off. Unfortunately, I think we *will* all do just that because we will not be able to change our short-sighted monetary system in time, for fear of repeating previous failures of large scale planning (the topic of the article).
People are a lot smarter than yeast, but the barrel they are in is so much more complex that their smartness/barrel ratio may be the same.
It seems to me that the problem with renewables is that since they are today mostly made out of fossil fuels, that their 'price' will increase as the 'price' of fossil fuels increase.
Even a quick passing glance at the figures shows this is not the case. The cost of fossil fuels has increased (with the very recent exception of natural gas prices), yet the cost to manufacture a PV panel fell 4X 2000-2010. Wind turbines are likewise at an all time low per MW.
Well my post was remarkably free of numbers...
The low cost of wind turbines is particularly hopeful.
But in the case of PV panels, how much of the lowered price was due to one-time Chinese labor plus environment arbitrage?
China dumping PV panels on the world market below their cost of production is a factor, but the cost of refined silicon has also declined as the shortage of it has been eliminated by expanding the production of photovoltaic grade silicon. The silicon used in PV panels used to be primarily rejected stock from the microelectronics industry. The PV industry outgrew that source and had to transition to manufacturing their own. That transition kept the price high through out the last decade.
Another reason to be cheerful! I remember the price spikes from shortages of rejected stock and it's good to hear that PV grade (not over-engineered) silicon is now separately manufactured.
Well, it's also Critical to look at Purchase Price versus Operating Costs, since renewables, when done right, will be offering a continual ROI to the owner, while anything that has to be fed a fuel- has a ring in it's nose that HAS to follow that fuel's cost.
Even if cheap PV right now is just an unfortunate fluke of comparative Labor costs and International Undercutting.. there is still a fundamental difference in where the prices of the Renewables come from as opposed to Fuel-burning sources, and how they will play out in the long term.
A continuous stream of technology improvements over time have been the largest driver: single crystal, wire saws, and recently - improved light capture from surface structure, etc, etc.
Hi Falstaff, this looks like an interesting chart, but its a log log scale plotting somewhat obscure variables. But noting that PV may get to 7% global generation by 2020 is an interesting observation to make. Looking at the log scale it seems we are about 0.07% today. So what are you proposing? That this exponential increase will continue? This is an honest question, if PV becomes cheaper than FF then exponential uptake will continue.
That is why FF companies are terrified.
NAOM
LOL
The only thing the oil companies are terrified of is running out.
Deepwater drilling, fracking, tar sands, arctic exploration, BP Solar and coal hasn't peaked yet but on an upward trend. We are burning at peak and PV will help us maintain the rage.
PV Schmee Vee, this house is going down. Unless a way is found to leave FF's in the ground unburnt...forever, then efficiency and alternatives will help maintain the peak all the way to collapse. We are attempting to burn everything and at this rate we will, including ourselves.
Bandits is quite right on that point, but makes the mistake of then identifying the desires of the oil companies with those of society as a whole.
As the price of renewable energy comes down and that of fossil fuels goes up, there will be a point at which there will be mass switching. What I'm worried about is that, left to the market, the switch is likely to be too late for sufficient mitigation of global warming. That's why I advocate an emergency program of conversion to publicly owned renewable energy (with compensation for displaced workers), funded by a levy on the rich. I don't want to wait till we've baked in enough global warming to ensure that the Greenland ice cap melts 50 years from now and endanger the West Antarctic ice sheet another 50 years further on.
There will be some switching, perhaps even more than now. Whether it will be mass switching depends on the availability of credit.
However, restricted credit always accompanies economic contraction, just as economic expansion is correlated to available credit.
My view is that we will devote the scarce capital we will have to keeping the fossil fuel infrastructure working as it falls apart from lack of maintenance. The problems Matt Simmons raised about our energy infrastructure haven't gone away even though he is no longer here to talk about them.
Declining oil means the absolute re-arrangement of our world economy. It would be very unwise to think that what we see now (an upward trajectory of renewables penetration) will necessarily continue. It might, but in my view, there is a very low probability of it.
The graph below is still the operating future regardless of any technological advances that are still before us. If we were somehow to "solve the energy problem," we would just bump into the next limiting factor, then the one after that, then the one after that and so on. This is guaranteed because we are already operating in overshoot. And even if that were not true, the ever-diminishing returns on capital that the Limits to Growth team identified would guarantee contraction. The technocornocopians blithely ignore these factors, think technology will trump all and try to convince people that contraction isn't inevitable. The only thing that isn't inevitable is that we enter another Dark Age as we contract, though I think Greer is probably right on this score, too.
Preparing for contraction is, in my view, the only sensible course to take. I recommend that people take the time to really understand what contraction means, especially to the monetary system. Once they understand that, they can go back to the technology and see what will work and what will not work.
I'm curious. Don't you feel at least some need to offer up at least one or two pieces of actual historical data when forecasting another 'Dark Age'?
There is tons of work being done in this area and Greer discusses it in various locations. I'll just a say a bit about it here.
Personally, I think we'll go through a period that will look like the science fiction movies in which there was high technology right beside people barely getting by. This is already the case if you look at the world as a whole but will become common in the formerly developed nations soon, too. It all starts with unemployment and our inability to take care of ourselves without the capacity to generate monetary income. Institutions of higher learning go away first. (After all, why create more college graduates when the market is already flooded with millions of them who already can't get a job?) Then it works down the educational system. Specialization gives way to generalization as people increasingly deal with subsistence issues.
Widespread education is, in my view, currently at its apex and its prevalence just goes down from here.
I'm guessing most of the dark age forecasters have never built or designed any large structure, complex, tool or machine in their lives, and have never worked in close collaboration with others doing the same. They really don't have a clue what we humans like to do.
Forecasting us shredding the planet as we try to keep things rolling along is far more supportable historically, but then again we really are breaking all new ground with our tool use these days. Finance may be a weak link but as I said in another comment it will be trumped by the tools we have in hand find some way to keep us digging stuff out to make more of them.
Of course we are also breaking all new ground with our population numbers, you don't have to go too far to find evidence of population crashes happening after a some creatures have eaten themselves out of house and home. As long as we keep the food supply streaming in we will keep rolling along...unless of course we blow ourselves up in the process.
"I'm guessing most of the dark age forecasters have never built or designed any large structure, complex, tool or machine in their lives, and have never worked in close collaboration with others doing the same. They really don't have a clue what we humans like to do."
I've been involved in many such projects, so I also have a clue about the massive inputs required to continuously conduct such feats, not only for the projects themselves, but to support the people involved and a society with the capacity to do these things. What we like to do and what we're capable of are parting ways in a sense.
Up until now, there have been few physical constraints upon our activities. What happens when virtually all inputs become more scarce? To begin with, there's the problem of supporting/maintaining what we already have, and have become dependent upon just to support the vast armies of worker bees who really just move things around, use things up,, and the dependent populations that don't, in fact, produce anything. Our overhead has increased faster than our accomplishments. Overshoot, indeed; until now many thriving on a surplus,, net consumers by the billions?
Moses didn't free the 'slaves', biophysical economics did. I expect much of humanity will wander the deserts for far longer than 40 years. And just as Egypt dealt with a period of climate change, our get will be challenged with adapting as well, adapting to less complexity, naturally imposed austerity, challenged to cooperate on things that matter most for survival. We're reaching peak humanity, of that I have little doubt. Our species is being retasked.
Like I said in couple other comments it all about food supply and as aangel brought sci-fi into play Soylent Green handled that in a not so unbelievable way--assuming major climate impacts and discounting 2022 as not being out near far enough.
Yes when I fly into O'Hare I really can't comprehend how we could possibly keep this going, but then I can't comprehend the size or distance to the sun much less the sequence since the big bang in a very hands on fashion either. But then I look at the crap we spend money on to keep things rolling along and realize there is plenty of room in the OECD for spending to shift to the basics, lifestyle to become dramatically more austere and for the technology/machine base that supplies us to remain essentially intact.
Coal on the north slope of the Brooks Range is not out of reach economically in a dire straits situation as it can supply all the energy itself to get itself to the major food production and manufacturing centers. We are like every other creature on earth that way, eat everything in our reach until it is gone.
Maybe I should have qualified what I meant by 'rolling along' in my earlier post. If energy supplies do not stay cheap it just means we ants will live shorter lives transporting resource longer distances to the machine hearts of our 'queens'. Of course that is my opinion but it is likely far more realistic than seeing us lose our tech and fall into some dark age before every scrap has been clawed in (again barring sudden and continuous dramatic contraction of the food supply or us blowing ourselves up in the process of dragging in all we can get).
Huge swaths of the earths population could fall off the map and barely dent the industrial world's ability to rake in more and more for itself. To me it looks like the financial implosion dark age predictions emanate from denial of just how much energy we are capable of expending to exploit every possible resource we can reach to keep our monster fed. 'Know thyself' is where we have to start and granted a moral compass is critical to keeping society functioning. But our hard wiring to discounting the future and our tremendous rationalization capabilities hardly suggest that human society's moral compass need be tuned to long term sustainability. 'Feed me now' gets to be a pretty strong driving force.
Of course it doesn't have to go that badly--we might manage to find some way to keep energy somewhat cheap through what certainly looks to me to be an approaching bottleneck (size and shape subject to wide variations). I linked Jevon's 'The Coal Question' farther down the page, might as well link it here too. If you haven't read it you probably should--it certainly highlights how even some of the most informed and brightest of analysts of the time can totally miss future events when they go out on a limb and predict.
Oil has more merits than other FF (aircraft travel and such).
But the utilities are certainly terrified of PV on its customers roofs, which is also why there is substantial PR-campaign against PV in Germany.
I disagree, totally.
German PV has a capacity factor of 10%, meaning that the 25 GWp installed now generate 22 TWh, i.e. less than 4% of the German consumption in 2011 (550 TWh, I believe).
Large utility companies are afraid of the foolish plans set in place by the government, aiming at shutting down the remaining nuclear plants within 10 years, as do all electricity-consuming businesses.
German PV is a total failure, a financial scam which is costing the country more that 10 billion Euros/year, has led so far to the bankruptcy of tens and tens of small and large PV technology companies, has created a fake work market, and most of all has increased and will continue to do so the electricity bills of tens of millions of Germans.
In the end it will be remembered as an ideology-driven scheme, based on wrong science and technology concepts.
Wrong.
1. The utilities are particularly mad at PV, because not only do they sell less coal power but PV significantly lowers peak prices at noon. This means they get less for ALL kWh they sell -> merit order:
http://www.transparency.eex.com/de/
Even the utilities in Switzerland are mad at German-PV because they cannot export pricy peak power during daytime anymore:
http://www.drs.ch/www/de/drs/nachrichten/wirtschaft/301909.schattenseite...
2. The renewable industry in Germany not only created nearly 400'000 tax paying jobs, the industry and its employees pay more taxes than what they indirectly receive in feed-in tariffs (paid by the electricity consumer not the tax-payer).
http://www.forium.de/redaktion/steuereinnahmen-der-solarindustrie-ist-ho...
3. The feed-in tariffs for wind power lower the electricity prices more than what the consumers pay for them:
http://www.tagesspiegel.de/wirtschaft/art271,2147183
4. Thanks to the renewable energies, Germany has lowered its fuel import bill by €11 billion:
http://www.solarserver.de/solar-magazin/nachrichten/aktuelles/2012/kw06/...
5. The feed-in tariffs for PV in Germany are meanwhile between 13.37 and 19.31 cents/kWh. Even if Germany would still install 7 GW of PV per year, it would only add 0.1 cents/kWh on the electricity costs. (This is besides the fact that the roofers and electricians have jobs and pay taxes.)
http://de.wikipedia.org/wiki/Erneuerbare-Energien-Gesetz
6. Even though some German PV factories shut down, the job numbers in the entire renewable industry has still increased in 2011:
http://www.solarserver.de/solar-magazin/nachrichten/aktuelles/2012/kw13/...
German inverter factories, German PV equipment manufacturers and German electricians and roofers are in fact not Chinese.
If anything feed-in tariffs haven't increased electricity prices enough such that people actually even care about wasting less electricity.
Well Molflow was right about German PV capacity factor, it was indeed 10% or less.
Sure they are mad, with a reason, as they are obliged to keep their thermal power stations (gas and coal) ready to go to cover the fluctuations in power production by PV, and as a matter of fact they increase the price of the evening peak hours... same happens in Italy, easy to check. About the high paying jobs I invite you to read the following study, by a German research authority, which shows that heavinly subsidizing PV has been (still is) a very poor way of helping the economy and providing jobs. Similar studies can be found for other countries where high-penetration renewables have been subsidized, like Spain and Denmark:
http://www.instituteforenergyresearch.org/germany/Germany_Study_-_FINAL.pdf
That's more likely, but the need to keep spinning reserves by power companies stays for wind too...
"solarserver"??? Sorry, I don't buy into PV's PR front office spin! Try again with something serious, like the expenditure of (correct me) 11 billions in PV "incentives" over 2011? The 25 GWp presently installed in Germany produce about 22 billion kWh/y, which corresponds to about 4.5 billion cubic meters of natural gas/year (burned at 45% CF in thermal units), I can't see how this could amount to 11 billion Euros/year. Burning coal/lignite (which is what Germans do in large part) would cost even less, of course. So, check your numbers please, or provide serious refences, not PV PR spin.
The values you quote are for NEW PV installations!... the problem is that the OLD ones which have been installed at times when the "incentives" were much higher will be paid for 20 years! PV "incentives" are a blank check for elecricity users to be paid for 20 years, not one or a few only. Big difference.
Anyway, that PV is a total waste of money in Germany is given by this simple fact: on short winter days German PV (25 GWp, not peanuts) can generate a PEAK power of 2 GW or less, during a couple of hours... for a total daily generation of 20 GWh... to be compared with a daily total consumption of up to 2000 GWh!
Yes, and let's wait a few years and will see whether this market will follow the same course as the cell/module one has done, moving massively to China/Taiwan/FarEast, shall we?
Now it's my time to say "wrong" to you: recent data released by the German Federal Agency show that overall CO2 emissions have gone down for Germany in 2011 (by 1%), but electricity production has actually INCREASED CO2 emissions. Following the decision to shut down 8 reactors on March 14, as a result of Fukushima disaster, German export has considerably decreased (to the point of affecting the price of electricity in Denmark and Sweden), imports have considerably gone up,
Germans are very marginally consuming less, how could anybody who, as per PV galore, "produces electricity at no cost" consume less rather than more? Jevons anyone? :-)
Roberto
Offline pumped storage and hydro provide the bulk of the spinning reserve and can even out the fluctuations with solar & wind in Germany. Some supplied from Switzerland which has a vast surplus of both.
And with solar taking most of the lunch peak, they can alos take care of most of the evening peak w/o fossil fuels on many days.
Alan
The prediction part of the graph, an extension of prior exponential growth, comes from E. Sachs, a founder of 1366 Technologies and MIT professor. For what it is worth I agree solar PV growth will continue as he indicates up and until the percentage starts to bump up against base load power, probably somewhere around ~20% of total electric capacity. If no inexpensive storage mechanism has been identified at that point, then I expect solar growth will slow and stall.
1. In Europe there's enough hydro storage capacity for over 20 days:
http://www.claverton-energy.com/european-hydro-capacity-compared-to-the-...
There are simply no nights and dead calm periods which last that long.
2. Wind and PV complement each other very well: http://www.q-cells.com/uploads/tx_abdownloads/files/6CV.1.32_Gerlach2011...
3. Replacing fossil fuel heating and hot water systems with flexible heat pumps saves fossil fuels and increases the grid flexibility.
4. It's simply cheaper to overbuild than to store every single kWh. If the inverter reaches maximum production at 70% of the installed PV-capacity you only loose 3% to 6% energy yield.
No, not even close. We've been through this before. The generation capacity of European hydro is a small fraction of even the average Euro demand load. No matter how long the hydro could run on stored head, its output per instant is way too small. And then of course Euro hydro generation is not universally connected via transmission to all Euro demand.
In the case of PV solar, which I was discussing, overbuilding PV infinitely will still produce zero power 14 hours a day in the winter. Thus PV solar needs a backup, at least for overnight. As I said above, the existing fossil/nuclear/hydro grid will handle that nicely for sometime, but beyond somewhere around 15/20/30/40% PV share (I dunno) a lack of storage is going to be a problem. However, I don't believe there will be a lack of storage in that time frame.
We have this thing called transmission? It's allowed to run across time zones, and latitudes.
The point in contention was whether or not over building power generation was economically preferable to storage. Yes we have transmission, but transmission costs money, extreme amounts of money when running the distances you suggest. And, at least to the degree a post fossil system is depend on solar PV, unless transmission will also carry *all* the power from one hemisphere to the other, then storage is still required to back up solar at night.
Yes... but it also costs a fortune and it is a nightmare from the point of view of control, with literally tens of thousands of network points, see "smart grid" (which, in the words of the MIT professor who has supervised the writing of a study on electrical networks, "is is not so smart, after all")
I don't believe that Chinese PV manufactures are truly dumping. The most efficient manufacturers are not selling below cost. Smaller, less efficient Chinese PV manufacturers are being squeezed out just as fast as those in this country. What we're seeing looks like the normal consolidation that occurs in any new market.
The more interesting question is whether the production volumes that the low cost manufactuers depend on can be sustained, in the face of global economic recession and forced govermental austerity. Subsidies are evaporating everywhere, but the loss has bitten most deeply in (formerly) huge German PV market.
I think that the answer is that the PV market will continue to grow. We won't see the rapid plunge in costs that the last few years have brought, but I don't expect to see module prices increasing. I think the market will be sustained by development in India. Prices have gotten low enough that PV is cheaper than the alternative of diesel generators for villages not connected to the dismal national grid. Intermittency isn't so much of an issue for rural India, since they major applications there are refrigeration, water pumping, and battery charging.
There are some big silicon fabbers getting into the market in a big way. They KNOW how to handle the stuff. They will not aim for big bungas to the CxOs and they will look for a slim margin, 5% or less, compared to 30% to keep shareholders happy. Just turn it fast and as cheap as possible to turn that small profit sliver into a big win on the large quantities.
NAOM
Installing PV on northerly oriented structures anywhere in the northern hemisphere is basically a waste, and installing subsidized PV facing north in the UK is outright fraud, IMO.
http://www.inference.phy.cam.ac.uk/withouthotair/c6/page_38.shtml
The area of roof covered by PV may last a bit longer, but in terms of electrical production, you may as well build a hydro dam in a dry riverbed...
Spend the money on efficiency. It's the first rule of RE.
Love it! Solar works better in the desert, hydro works better in Scotland. And looking at the next page MacKay says:
So it seems that UK receives 10% of the solar energy received at Equator and panels are typically 10% efficient - we will capture 1% of energy in UK (much less in Scotland I'd guess) on S facing roofs - virtually nothing on badly orientated roofs. Solar PV has large range in reported ERoEI, and I'd guess this in part due to range in quality of sunshine from area to area. Wouldn't surprise me if Scottish solar is competing with biofuels for the wooden spoon.
Hi Euan,
Thank you for your comments. I'm with Ghung. PV in Scotland? Nuts. Isn't Scotland's biggest electric load in winter, at night?
Dave
Peak demand will be a week day in February at around 18:00 hrs - pitch dark!
Not specifically Scotland, but for Great Britain as a whole see,
http://www.geog.ox.ac.uk/~dcurtis/NETA.html
"Peak demand will be a week day in February at around 18:00 hrs - pitch dark!"
Good call: peak demand for the period covered by the data was 56 GW on Wednesday, 8 Feb 2012 at 18:00. Minimum demand was 25 GW.
While coal is "on all the time", its output is actually quite variable. It's often reduced 40% from the evening to the early morning, though more gradually than gas.
. . . . or Anchorage, or anywhere except small scale in low latitudes if you're wealthy. Optimistic emergy yield ratio for PV in Italy from Paoli et al. at the link below is 1.03, early less optimistic calcs are a fraction of that. And below the citation, also at the links, bar graphs of emergy yield ratios for NR and R. Notice how we're now scrabbling around in PV in Scotland and oil shale in Utah--what does that tell you about our current emergy basis for society?
How does your garden grow?
http://prosperouswaydown.com/principles-of-self-organization/empower-basis/
I think the Scottish PV is just a poorly thought out piece of planning rather than telling about our current energy basis. Somebody has not done the job right. OTOH I agree with you about oil shale.
NAOM
I lived in Aberdeen for a year working week on-week off in the BP40's, and am surprised they are not doing more with wind. Definitely the windiest place I've ever lived. Even small wind turbines on the roofs of houses would probably produce more energy than solar in Scotland in the Winter.
I lived a winter there without any heating. Just get use to it.
Yet the authors state in their abstract:
Solar Power: An Approach to Transformity Evaluation, C. Paoli, P. Vassallo, M. Fabiano; Ecological Engineering, v34, i3, 6 October 2008, Pages 191–206.
Your source at "A Prosperous Way Down" confuses ERoEI with EYR in "The energy return on energy invested (i.e. Emergy Yield Ratio) was 1.03...." ERoEI of PV is on the order of 10.
Yes, Twilight, the authors make an irrational leap and say that we should go ahead and do PV anyway, when it is not net yielding.
Odum invented EROI, and then he refined it with Emergy Yield Ratios. EYRs will be more inclusive and lower than EROI, because they include transformities such as human labor that weren't included in EROI. But even when Odum was using EROI back in the early 70s, he came up with values less than 1 for PV. I The Paoli citation is in there for some variety, even though the authors come to such an illogical conclusion. Odum's calculation of solar PV grid electricity was an EYR of 0.41 (in Austin in 1991). (Environmental Accounting, 1996, p. 149). The bar chart at the link below gives the different values for electricity, from 15 for tidal electric to 10 for hydro, to 0.36 for solar voltaic array in Nashville.
http://books.google.com/books?id=j1PHFoVb7rYC&pg=PA149&lpg=PA149&dq=envi...
If the EROI for PV was 10, we'd be seeing them going up on every house in the country right now. Empirical validation is all we need right now. The value of 4.6 for nukes in the figure above was from the mid-80s in the US. What is the current Emergy Yield Ratio of nukes in Japan?
"...do PV anyway, when it is not net yielding. "
Not yielding?
NREL:
Methinks your assumptions are location biased and grossly out of date. I shed my gridweenie status years ago. Now I have to deal with other folks' electro-carbon... Thanks for that :-/
I really don't care how we do it, just get'er done... Not interested in other peoples' excuses.
Ghung, most other peoples' excuses are that they cannot afford solar panels when faced with more ordinary, important, and imminent expenses in their family budget, such as mortgage, utilities, food, gasoline, etc. Inflation is now increasing, while salaries remain fixed for the middle class in the same place they've been essentially, since the 1970s. In the meantime, the emergy basis per capital globally has been decreasing.
(Brown, http://prosperouswaydown.com/subsystems/economics/ )
The only reason we can buy those PV panels is that we are still wealthy in this country, as long as the petrodollar reigns. You have made a decision to take your store of wealth as represented by greenbacks in order to buy security for the future. But that security is based on a very high level of transformity. As complexity wanes, will our lifestyles warrant justifying large portions of our vanishing household income and saved wealth to go to a very expensive way to make electricity? As soon as our ephemeral greenback wealth disappears because we can't print money to buy oil, the perceived relative value of PV panels compared to gardens and greenhouses that use nature's help to convert sunlight will become apparent? The relative advantage of some ways to make electricity below seems so obvious when it is not obscured by "comparative Labor costs and International Undercutting" as Jokuhl says, in addition to subsidies, subsidies, subsidies.
(Odum, 1996, p. 149)
Why are you hammering figures from 10, 20, 40 years ago on a field that is changing so very rapidly especially in the last 2,5, 10 years?
NAOM
NAOM, isn't that the basis of the concept of net emergy/energy? The values go down over time (the global emergy/capita graph). So those values from 20 years ago are optimistic, more than offsetting any heralded improvements in technology. Take a look at Euan's great cliff figure above. Yes, it has been changing rapidly. Instead of spindle top we get oil shale in Utah. Instead of building more nuclear plants, we consider whether we can afford to decommission them at all. Instead of large scale solar PV, the companies are going belly up, even with subsidies. Empirical testing.
175 Watt Sun laminate PV panel from China sells for $.75 / (rated watt).
(175 W * $.75/W) / (175 W * 6 hour/day * .65 (efficiency, clouds) * 365.25 day/year * 30 year) / 1000 = $.0176 / kW·h.
It seems to me that ideology, education and motivation are greater barriers than affordability.
You can probably get that level of production in Arizona and a few other sweet spots. You assume a zero discount rate. You forgot to pay to install it (free wire and labor, me like). Are you buying new appliances to run on DC or do you need an inverter?
Yes, I calculated the price for the PV panel, not an entire system. One can get better than 65% in Arizona. Education allows one to install it avoiding the cost of someone else's labor. For these laminates one also must buy a junction box and silicone to attach them. A mount is necessary and maybe a building permit. The electronics depends on the application. Batteries add significantly to cost, but other less expensive storage devices are possible depending on the application, such as pumping water and thermal mass in a refrigerator/freezer. For the motivated demand side management is available to reduce cost. There are tax rebates and incentives.
I've looked at these panels and the process of installing junction boxes and framing them. In the US/Canada, with quality polycrystalline panels available for $1.17/watt, made in Canada, with an excellent warranty, I've decided that buying ready to install PV makes more sense. I'm trying to get a group together to buy a pallet of these.
If more folks would ban together and have PV raising parties, we could continue to make a dent in people's CO2 debt, especially if municipalities and utilities could help streamline things. Professional installation is a big factor in costs and there's nothing particularly difficult or complex about PV installs. Most jurisdictions allow homeowners to do their own installations, requiring only an inspection and connection by the utility for grid-tie.
I'm sure some comments are to follow about the negative aspects of this route, but I've been helping folks' in my area do their own installs for years. Many have chosen to go off-grid and install their own parallel systems, eventually firing their utility or paying only the minimum monthly fee.
I have no problem from a utility standpoint with PV parties as long as they have competent design/execution (it takes a leader who is usually a professional or a serious enthusiast). Much better than typical solo DIY IMO. At least you have folks involved with SOME experience. Also, they tend not to be nearly as interested in cutting corners as the commercial installers. The big advantage of this approach from the individual's standpoint is that: Equivalent labor income is untaxed income (as long as it isn't formal barter where a contractual obligation to work on another project is incurred for receiving the labor on your own project), and you aren't dependent on an employer to get the hours spent reducing your utility bill. The problem is that incentives are usually based on project cost and so your incentive payment goes down if substituting free labor, which means the free labor isn't AS valuable/lucrative. Installers and governemtns have exactly the reverse experience of DIY, it takes money out of their pocket.
You are right, my Dad's AZ installs (non tracking) typically are getting 2200-2300kwh/kw and typical there is 1800. I grew up in a home with self-installed solar DHW which now has self-installed PV on the roof, and have helped friends install PV. I personally value my own labor higher than zero, however. My brother and his wife and seven kids lived grid-free for years with scrounged PV, batteries, small wind, DC lighting, and inverters for A/C appliances and well/pressure pumps. The grid is a subsidy for PV installs.
In Germany in 2012, you get 1 kW(p) for less than 2000 EUR, this would be high quality stuff with an expected life span of more than 35 years, the costs include installation. This 1kW produces 1000 kWh per year. Therefore, with 7% for write off and capital costs (20 years), 1 percent for new inverter, 1 percent for insurance (if you do not have new contracts) you pay for one homemade kWh around 18 cent. Typical consumer prices for electricity from the grid are 22-29 cent/kWh.
With 25% own consumption (you save 4-11 cent per kWh) and 19 cent feed-in tariff for the rest you get a yield of 1-2% at the beginning, each increase of consumer prices for electricity (very save bet) improves the situation, so your money is not eaten away by inflation, quite contrary you see deflation.
After 20 years your written off PV gives a very nice yield in the range of >10%. In Germany investment in high quality PV products is IMHO a good alternative to secure your retirement savings.
That sounds implausible to me. Just look at all those great necessities people are spending their money for: booze, cigarettes, cosmetics, too large SUVs - you name it. Our society is full of pointless spending, if we just focused that on the task at hand, it would quickly be solved.
Ghung, he is referring to emergy yield ratio, not energy returned over energy invested. As input energy emergy includes the solar, gravitational and geologic radioactive decay energy that was used to make sand and bauxite deposits. It includes some formula for including the energy to evolve humans and power our operation. Things that have EYR < 1 could easily have ERoEI > 1. I do not care how much energy nature used to make sand. Input energy begins when humans dig up sand and includes the energy for transporting and processing it into refined silicon and glass.
Having read Odum, et al, I understand where Iaato's coming from, but not where it leads. PV is only a part of a system; passive heating and cooling, solar/gravity water, wood heat, more,, utilizing local resources rather than massively centralized energy sources, a system that, IMO, reduces overall emergy compared to my contemporaries. We've powered down dramatically. I'm just not sure what Iaato's point is. We make the best chioces we can with what's available at the time rather than according to some theoretical ideal. I have serious doubt about the emergy levels posted above; out of date and not all inclusive, and I don't do circular arguments well. Emergy metrics are of limited usefulness, out here in the real world, IMO.
And right now the best net energy from all the new energy sources comes from solar and wind. It also looks like economics are starting to come in line with this fact. My bet is that by the end of this decade it will be pretty clear that wind and solar are far less expensive, long term, than fossil fuels. The industry is doing its best to fight this trend -- using whatever political and public relations resources it can muster. And that is a huge amount considering their current and very large profits. But the base of that profit is a society-wrecking nightmare. Ever-increasing costs + climate change means that the days of the oil and gas industry are numbered. And ever-lowering costs for solar and wind + increasingly visible climate change makes it ever more clear what our better options happen to be.
Yes, yes, there's been much rumbling on the new cold fusion lately. We'll see. For now, I'm putting it in the same category as fuel cells. Until something practical is demonstrated it's still vaporware. Possible. Hopeful. But still a glimmer in the eye.
With 100,000 homes sporting solar panels in California and with those 100,000 pushing 5% of the entire grid's peak capacity, I think it's pretty clear we have demonstrated viability. And not a moment too soon.
Is it 5% of peak, or 5% of real-time load?
Apparently the utilities are arguing that it should be the peak load for their systems, while the PUC is proposing that it should be the sum of all their customer's individual peak demands. Which makes a difference.
http://solarindustrymag.com/e107_plugins/content/content.php?content.10262
But all this only applies to people who want to qualify for the net metering program.
I read the proposed decision. I find the utilities' arguments about legislative intent cogent. I find the proposed CPUC decision to be pandering to a novel interpretation of the language proposed by special interests. DRA supports the utilities! That has to tell you something.
. . . . or Anchorage, or anywhere except small scale in low latitudes if you're wealthy.
Well maybe not quite rich.
Each array is 2640W and at the CCHRC facility, a bit north of you at about 64.5° N.
Panels are getting to the price that we up in the interior where 60% of the electricity comes from diesel powered generators can consider them--but siting must be top notch. I've been paying more attention to my location this winter/spring, but I'm guessing my Solar Pathfinder image won't be looking even this good,
Anchorage is quite a bit more overcast than Fairbanks so likely any slight gain due to slightly lower latitude is more than cancelled out by cloud cover not to mention your much cheaper natural gas fired power generation.
Big hydro (Susitna dam) and heat pumps (though not up in the permafrost laden interior) will beat solar hands down in railbelt AK. Think it will get built this time? The world still has a few good hydro sites left but not near enough to pick up the slack declining fossil fuels will leave. Don't expect powering down to be voluntary.
Hi, Luke. I'm rooting for the Susitna dam. No, I don't think we have the time. It's no more likely to be built than the bridge to nowhere, or the road to Nome, or any other hare-brained schemes our legislators can come up with? No, powering down won't be voluntary except in the case of those smart enough to see where we're headed. There will be a lot of folks standing around wondering who moved their cheese.
Hi Iato.
I think you badly underestimate the effort that can be made by the industrial world to keep from powering down, we haven't started to tear the place up yet. Very likely plenty of time to build the Susitna dam. As a matter of fact I believe the argument on the other and much more controversial large Alaska dam is framed all wrong. It is not whether or not we will mine Pebble but whether we will be able to do a cleaner job of it now or in the not so very distant future. Unless of course we blow ourselves up or have continuous catastrophic global crop failures first, in which case resource demand will drop dramatically.
Enough of that kind of talk. I think I'll go outside and listen to the robins, they sing round the clock now that really never gets dark. Hope your having a fine spring on the other side of the mountain as well.
Luke
Okay, Luke, I conveniently forgot Pebble Mine. You forgot that the state of Alaska doesn't think we need to test our salmon for radiation, since it's not a threat like Mercury is. I'm just hopeful; I keep trying to push the button on all of this.
I'm up early because it has been light for two hours. I had to chase a moose out of my raised beds last night, but we've still got a pile of snow by the street. The onions and strawberries are already on their way, and it has been a great spring. Same to you.
A bit of extra radioactivity in our food supply will just kill some people off a bit quicker, and of course if the hard times you are expecting start to overtake us the sick and elderly will get precious little of the resources, with seven billion strong there will still be plenty of hands to tear the crap ouy of the place for a good long time...again as long a we don't blow ourselves up or have a drastic collapse of our food supply first. Finance may be a weak link, but when push comes to shove tools in hand will overtake it and force money to find a way to help us extract what we use.
I have very serious doubts that Fukushima Daichii will add much radiation to the wild salmon stocks. The old soviet nuke dumps in the northern seas might have a more significant impact, of course no one knows. I'm all for testing the wild fish though, even the faintest traces of radioactivity from known sources would tell us that much more about just what the salmon do out there for 3,4 or 5 years. Of course that might negatively impact wild fish sales even if the amounts found were barely measurable. Human fear of radiation is a black box thing, not readily quantifiable.
From an ecological point of view, people getting afraid of eating some animal doesn't seem like a necessarily bad thing. I'm sure readers here know what eco-people say about eating meat.
You must have missed the extensive discussion on meat eating in the comments to Tom Murphy's post here a week or two ago. No need to out that again here. I will admit I do have a bit of a dog in at the fish testing fight as almost all of my in-laws make/made their living commercial fishing (mostly for wild red salmon). I've a few season's of that under my belt as well though now personal use dipnetting is my biggest involvement in the fishery.
Alaska is among the best at managing wild fish stocks in the world, that is not to say that the management is either flawless or done without any controversy. Of course major changes to the ocean will add huge challenges to interpretting fish population data. The more data the better for that.
I did glance it over somewhat. Not sure if it came to any significant conclusion, though.
Pretty much how I felt about it but the last post I saw added was about as over the top as you get. I will throw it in for entertainment value.
A poster was writing about some Gary Null who gives lectures and claims his hair grows a quarter inch a day
Gary consumes a very rich diet in fruits and vegetables - he reported that he consumes the equivalent of 130 pounds per day of raw fruits and vegetables, their fresh juices and powders from fresh juices.
I've no idea how that 'equivalent' number is reached but my horses never consumed 130 lbs a day counting the 7-8 gallons of water they drank and they weighed 800-1000 lbs and worked a fair amount.
Great chart that answers many of my questions. First of all....
.... shows that siting panels on randomly oriented roofs is a waste of time and money. To be fare, most panels in and around Aberdeen are S facing, but if you don't happen to have a S facing roof should you really bother?
So a 2.64 Kw array should produce 1900 Kw hrs in 30 days. In May, the fixed array has capacity factor of 18.5% and the tracking array a capacity factor of 31.6% - the latter is impressive.
Over the year, the fixed array looks like it will have capacity factor of about 10% and the problem remains of miss match between demand and supply. So only outstanding question is EROI / energy pay back? I'm asking so many questions cos I have a S facing roof and could be tempted. Should those be mounted vertically - to face the low angle Sun more directly?
CCHRC is a great local resource. I pulled the chart from this 445KB PDF on the arrays' performance. Quite a few other good charts in it.
I'm tempted as well but my site is likely not quite up to it. I believe vertical would work best at the poles as proper angle of orientation corresponds pretty closely to the degrees of latitude. My brother used the Solar Pathfinder to get a feel for his site. I'm off to look for some such tomorrow as the ground is now thawed enough to drive stakes into (to secure my ladder) and the leaves haven't quite shot out yet. I want data both with and without leaves on my boreal forest hillside.
Euan, consider the cloud patterns. If the winter is mostly cloudy, then do not point them vertically (pointing direction horizontal) because there will be no sunlight. Point them to favor Spring, Summer and Autumn.
Ignoring clouds, the optimal direction is due south in azimuth and (90 degrees) - (your latitude) as measured from the horizontal to the direction that the PV panel is pointing. With cloudy winters, point them 10 degrees higher in altitude as measured from the horizontal to the pointing direction. If you have fog in the morning that typically evaporates by the afternoon, then point them 15 degrees west of south in azimuth.
If you want to get more even power output through out the day from a fixed array, then point half of the panels east and the other half west in azimuth. It also works well if half of them are pointing southeast and the other half southwest in azimuth.
Bill,
Great site. Do you know a way to get the data in Excel format?
Thanks,
Dave
You could try contacting Mr. Curtis. Or rummage around on the NETA site he's getting the data from.
Bil,
I will follow up with Mr. Curtis.
Dave
Same is true for nuclear (France's) which modulates its production by more than 3.5 GW over 4 hours, during weekends, to follow reduced power demand in low-consumption days.
Not so !
I rather tediously tracked EdF generation for several days on a TOD post a couple of years ago. There was no correlation between nuke generation & load. The second highest generation hour was the 18th highest (out of 24) hour load, and so forth on one day, while the highest load hour was the 10th (out of 24) highest nuke generation hour and so forth.
One day out of several I looked at had a fairly close match nuke generation & load, but random walk variation could explain that.
When fresh fuel is in a reactor (and a multi-month shutdown has allowed fission products to decay in the fuel rods not replaced), it is possible to vary nuke reactor generation. But this capability apparently declines quickly.
At that time I did find a quote where EdF was "de-emphasizing" load following in their nukes.
The new EPR reactors are supposed to be specifically designed to load follow (100% to 60% on a DI-urnal cycle). We shall see.
Claims vs. Reality,
Alan
National Grid
http://www.youtube.com/watch?v=vX0G9F42puY&feature=plcp
Actually Scotland has excellent wind resources:

However, if wealthy golf players can't enjoy the landscape if there is a windfarm far away in the distance, then Scotland should do whatever the wealthy golf players tell them to do.
Who knows? Maybe these wealthy tourists will stick around indefinitely and in that case Scotland can even rename itself as Golfland. And if not: They will then just have to pay dearly for FF imports without the help from any foreign golf players.
Robin Williams on Scotland inventing golf brilliantly hilarious but quite profane.
Hilarious!
On off shore wind....
The East coast of Scotland is a major navigational route, elsewhere water is deep. Water is much shallower around the English coast - and that's where all the people are. What Scotland does have is topographic relief and water and we should really be expanding pumped hydro much more aggressively than we are. Pumped hydro is much less environmentally damaging than conventional hydro.
You don't necessarily need to go offshore and don't even need to pump.
You just need to replace fossil fuel systems with flexible heat pumps and power them with wind.
Meanwhile there are wind turbines with very high capacity factors. This windturbine produces over 90% of its nameplate capacity between 14 and 42 knots of wind speed: http://www.gamesacorp.com/recursos/noticias/2012-marzo-g114-20-mw-data-s...
So the probability is extremely high that a flexible heat pump can be powered by wind all the time (in Scotland). http://www.metoffice.gov.uk/climate/uk/ws/print.html

So the probability is extremely high that a flexible heat pump can be powered by wind all the time (in Scotland).
What are you on about? Yes Scotland has some of the best wind resource, but that table shows mean wind speed, meaning a variance to either end will yield zero power. In the best onshore wind resource areas with the best turbines no wind farm in the world breaks 40% CF, and nation exceeds 35% CF. The probability is high that an entire onshore windfarm in Scotland would either go idle or offshore suffer shutdown gails for up to a week or more during its life. With better turbines and higher towers CF will continue to creep up, but it will never replace base load without backup.
"In the best onshore wind resource areas with the best turbines no wind farm in the world breaks 40% CF, and nation exceeds 35% CF."
You've been misinformed, or perhaps your numbers are very old. For example, New Zealand has an average capacity factor of 41% from its operational wind farms and the best few get around 47%.
Also, citing CF figures as the basis for a response to a comment about how much of the time wind might be providing electricity, is ignoring what a wide gap there can be between capacity factor and the proportion of time there is some generation. Again for example, those NZ wind farms with over 40% CF are typically generating electricity around 85% of the time - may seem high compared to the CF but not really surprising, because that's the proportion of the time that the hub height wind speed at those locations is between the turbine cut-in (usually around 3 or 4 m/w) and cut-out (often 25 to 30 m/s) specifications.
Arg, though as of 2008 EIA shows NZ at 36% CF, I'll grant you are right about NZ in 2012 and it's .6GW of wind recently installed wind. Alright, none of the twenty largest wind generation countries in the world exceed 35% capacity factor with their wind production.
Countries sorted by installed capacity (2008), CF
US 0.26
Germany 0.18
Spain 0.22
China 0.13
India 0.15
Italy 0.15
France 0.18
UK 0.23
Denmark 0.23
Portugal 0.22
Canada 0.17
Netherlands 0.21
Japan 0.18
Australia 0.22
Ireland 0.25
Greece 0.24
Austria 0.22
Sweden 0.27
Poland 0.17
Brazil 0.15
Egypt 0.25
Norway 0.25
Turkey 0.25
Belgium 0.21
NZ 0.36
S.Korea 0.16
Taiwan 0.25
Cz 0.18
Finland 0.20
Hungary 0.17
Morocco 0.26
Bulgaria0.12
Mexico 0.29
http://www.eia.gov/cfapps/ipdbproject/iedindex3.cfm?tid=2&pid=37&aid=7&c...
http://www.eia.gov/cfapps/ipdbproject/IEDIndex3.cfm?tid=2&pid=2&aid=12
I did not state that CF and down time were equivalent. My point was that, absent daily generation figures, a low CF (<.5) means it is unlikely that power is being generated all the time, in contrast to the claim of the poster above. Furthermore, when you let this go above by 'anyone':
and raise objections to my use of CF I suggest you are chasing an agenda and not accuracy.
First of all, why stick with such old data? 2008 is a fair while ago compared to the pace of renewable energy growth.
Second, even using 2008 you have used a dodgy methodology. Example for the first country in the list, the USA: you've taken the 2008 Wind generation 55.4 TWh and used the installed capacity at the end of the year (24.7 GW) to get a capacity factor of 26%. But that's a lower bound which assumes every new wind turbine installed in the country that year was added on January 1 and available the whole year.
Using the installed capacity available at the start of the year instead (16.5 GW in the data set you used) we get an upper bound on the capacity factor that year of 38%.
So all we can say is the 2008 USA wind capacity factory was in the range 26 to 38%. It would be in the middle of that range if the new capacity added was at a constant daily rate. But it wasn't; in recent years there has been a common trend for half the annual new US wind capacity to be installed in the fourth quarter, as this graph from the AWEA 4Q 2011 quarterly report shows:
So even four years ago, the US mean capacity factor was much closer to 38% than 26%.
Hmm, I'm starting to get an agenda over accuracy vibe myself.
First of all, why stick with such old data? 2008 is a fair while ago compared to the pace of renewable energy growth.
Because internationally that's what EIA had available for both generation and capacity (I see now they go 2009?). You have access to more recent data, internationally?
Fair point about the year start, year end data. The most recent data I can get from EIA, on the US alone, has has US 2010 generation at 94.6 TWh with US 2009 installed capacity 34.3 GW. Best case US 2010 CF: 31%, and the US leads the pack of the top twenty wind produced with regards to CF. Summary: i) so far nationwide CF doesn't exceed 35% for the top wind producers, ii) NZ gets a big hat tip for the highest CF in the world.
There's a lot of more recent data, but not easily collated on one website.
From the EIA, you can get 2011 full year generation (wind almost 120 TWh) and for that the worst case to best case range of capacity factor is 34 to 39%. Again likely being closer to 39 than 34 because a majority of capacity added during the year came online in the 4th quarter.
Do you have a link for installed wind capacity year end 2010? Agreed 120 TWh is the EIA generation figure for 2011. From the US NREL, I have year end 2010 installed US wind capacity as 40.3 GW, giving an upper bound CF of 34%. Year end 2011 installed capacity was 46.9 GW, giving a lower bound CF of 29%.
http://www.windpoweringamerica.gov/wind_installed_capacity.asp
http://www.windpoweringamerica.gov/images/windmaps/installed_capacity_20...
Right, it was in the range 29 to 34%. Something went awry in calculation there.
Wind farms are not being sited solely based on the best wind conditions. If they were, the capacity factor would be much higher. They are being sited based on having at least commercial grade wind, near existing high voltage power lines, near existing access roads and not in remote locations (workers need a place to live). The low hanging fruit is picked first which is not necessarily at the sites with the best wind.
+1
Hey, don't put things in mouth I didn't say.
I said that Scottish windfarms based on this sort of wind turbine could power flexible heat pumps all the time, because heat pumps do not require 24 hour operation:
http://www.gamesacorp.com/recursos/noticias/2012-marzo-g114-20-mw-data-s...
Read this:
http://www.theoildrum.com/node/9163#comment-893064
This shouldn't be that hard to understand.
You were quoted.
Some of the best wind farms on Prince Edward Island have annual capacity factors as high as 42 per cent.
Cheers,
Paul
I've actually seen data on a (very) few U.S. wind farms at 50% annual, it depends on blade selection per kw rating. A bigger blade for a smaller turbine runs at higher capacity factor. It doesn't necessarily produce more power than the same blade on a larger machine in the same place.
1. The heat pumps are flexible don't need to operate all the time and can run a day without power. That's the point.
2. The mean of 18 knots is at a height of 12 m. The wind turbine which reaches 90% CF at 14 knots is at 100 m and gets a much higher average wind speed.
Thus, the probability that you can always count on wind energy production within a 24 hour period is extremely high: The curve would fall off much more abruptly than shown here:
http://mobjectivist.blogspot.com/2010/05/wind-energy-dispersion-analysis...
3. CF has nothing to do with operational time. For example, PV-systems in Germany have a CF of only 11% but are actually producing power about 45% of time.
4. Even if a heat pump would be powered by 100% gas power and 0% wind power all the time, it would still save over 50% of natural gas.
5. Even if you would only have 80% renewable power, you would thus still save over 90% of fossil fuels.
6. Scotland also has flexible hydro power and the Netherlands is already electrically connected to Norway and so can Scotland. In addition, interconnected wind farms provide baseload.
3. CF has nothing to do with operational time.
They are not the same thing; of course they are correlated.
For example, PV-systems in Germany have a CF of only 11% but are actually producing power about 45% of time.
Producing trickle power perhaps, and no you won't get even 45% trickle power except in the summer.
You are ignoring the fact that PV systems almost never produce their nameplate capacity. PV systems don't switch between 100% power and 1% power. They always have a bell shaped production curve (they usually do not track the sun and the sun doesn't actually go up and down within seconds).
The German PV systems over the entire country have never actually reached more than 67% of their combined nameplate capacity: http://www.transparency.eex.com/de/
Small PV systems in Germany are meanwhile only allowed to produce up to 70% of their nameplate capacity and yet they only loose 3% to 6% energy yield.
Which, as usual, is a non-sequitor and has nothing to do with the nonsensical claim that solar PV "are actually producing power about 45% of time."
I don't think so. As a matter of fact a general feature of wind production, independent of its strength, is that less than 10% of the nominal, installed power is generated for more that 30% of the time. Wind comes in gusts, even for sparse installations, contrary to popular galore (and some theoretical/mathematical formulations) which states that provided a sufficiently large area is covered with turbines the power fluctuations will decrease. This is particularly true for the European continent, where most of the time there is strong winds or weak winds over the whole Continent, at the same time.
So, any heat pumps system designed to be powered by wind farms would either need 10x more installed power (with respect to its nominal power) or would need integration via fossil fuel generation units... which is exactly what is done right now in Denmark, UK, Germany, Spain, etc...
The "monthly" generation doesn't help you a lot in that regards, as wind fluctuations take place on all temporal scales, especially on time intervals much shorter that one month.
See, for instance, the power forecast and actual generation for Germany's Tennett wind
http://www.tennettso.de/site/en/Transparency/publications/network-figure...
By selecting a whole month you can download the data and make a plot, you'll see by yourself what I mean.
Roberto
And by the way:
With the money Britain pumped into RBS and Lloyds:
http://uk.reuters.com/article/2012/04/03/uk-rbs-lloyds-taxpayers-idUKBRE...
Britain could power its entire country with wind energy alone.
$106 billion into RBS/Lloyds? More than a bit short to buy a 100% UK wind supply. UK average annual load is 43GW, meaning peak is roughly 60GW. At $1800/KW and 33% CF onshore that's $324 billion for 180 GW of nameplate wind and 120 thousand,1.5MW, 100M tall wind towers around the UK, for which the land price must stay flat.
1. In order to produce the same amount of electricity as the UK is currently consuming you need 130 GW and not 180 GW at 33% CF.
2. Average size wind turbine size in Germany was 2.25 MW last year and continues to increase:
http://www.dewi.de/dewi/fileadmin/pdf/publications/Statistics%20Pressemi...
And the biggest onshore turbine has 7.5 MW.
3. Nobody installs wind turbines in the center of London.
4. Denmark already has over 5000 wind turbines and is 6 times smaller than the UK.
5. You ignore the fact, that people actually already pay for electricity. So, you still have that income: Let's take your numbers of $1800 /kW, even though NREL has mentioned $1200 /kW: http://eetd.lbl.gov/ea/emp/reports/lbnl-5119e.pdf in 2011.
So with the RBS/Lloyds money you are at $984 /kW. At 20 years amortization and 5% interest rate you are at $73 /kW financing costs per year for 2920 kWh/kW at 33% CF. Thus, the entire financing costs for the wind electricity is only 0.025 cents/kWh.
-> Plenty left to cover land leasing costs such that the subsidies to the farmers can be reduced, since they get this extra income.
1. In order to produce the same amount of electricity as the UK is currently consuming you need 130 GW and not 180 GW at 33% CF.
Before going any further, lets be clear, I'm asking you to show your earlier statement is valid and not hyperbole:
That is, not a future UK with nice energy demand and energy efficient this, that, and the other thing, but the UK as it is today, with the "entire country" powered by "wind energy." Your statement indicates the RBS/Lloyds money, by itself and not supplemented by existing electricity funding, is sufficient capital to finance such a system.
Today's UK (2010) uses 378 TWh/year, or an average demand of 43 GW. Peak demand, which still must be serviced by whatever power source, will be of course be considerably larger. California, which is comparable to the UK in electric demand, sees peaks 76% above average use (53 GW over 30 GW average in 2000). So a 50% peaking margin (at least) should be factored in, i.e. the UK peak might be 65 GW. As of 2008, the capacity factor for the UK existing, installed wind was 23%. But as you would build your 100% UK wind system with the most recent technology, let us say a 33% CF is possible for an onshore system. Higher CF is of course available offshore (and obviously offshore will be the eventual way forward in the UK) but offshore costs considerably more per unit power, especially in the North Sea and the Atlantic. Thus a UK all wind system would be modestly sized at 195 GW peak, 33% CF.
The price of $1800/KW (average from US Dept of E.) is the total onshore capital outlay to include land and installation costs, not only the price of the turbine from the manufacturer ($1400/KW). Thus the total capital outlay for this system would be $350 billion.
As for turbine size, yes they come larger than 1.5MW, but the larger turbines are overwhelmingly used offshore. For now, the top selling GE turbine is thee 1.5MW, and it also enjoys the best installed price/KW, as the larger turbines often require more exotic shipping methods and/or assembly equipment. Tower count of 1.5MW turbines, whatever the site: 234 thousand.
California peak demand:
http://www.energy.ca.gov/2011publications/CEC-200-2011-011/CEC-200-2011-... table ES-1
GE 1.5 top selling US turbine for years:
http://www.reliableplant.com/Read/21168/ge-15-mw-wind-turbine-commission...
UK existing wind CF calculated from
EIA wind capacity peak
http://www.eia.gov/cfapps/ipdbproject/iedindex3.cfm?tid=2&pid=37&aid=7&c...
EIA wind generation
http://www.eia.gov/cfapps/ipdbproject/iedindex3.cfm?tid=2&pid=37&aid=12&...
As I said: Germany's average onshore windturbine size was already 2.25 MW last year and continues to increase (your 1.5 MW figure is obviously not up to date).
Even at your $1800 /kW figure you can power 45% of the UK with wind alone, by only using the RBS/Lloyd subsidies.
If were only using the tax-money the UK spends on its military in 3 years you can power 81% of the UK with wind power at your $1800 /kW.
The point is: Even if electricity was given out entirely for free, a very high proportion of renewable power can be funded with banker and military subsidies only. Increasing the renewable share is definitely NOT a financial problem. It is simply a political problem.
Onshore wind power for the UK is a fun intellectual exercise, but hundreds of thousands of onshore wind towers is not going to happen in the rolling hills of the UK. Even now onshore towers often end up subsidizing the large estates of English nobility. Offshore is the place to go there, but the offshore cost is $4800/kW (£3000/kW), five or six times the capital cost of a natural gas fired electric plant.
Edit:
UK Professor/Energy Pundit David McKay on using wind (to replace all UK energy, not just electricity):
I.e., he's apparently assuming 34% CF from that 33GW of offshore wind across 62 million people.
...
...
Only!!! am i missing something here?? from a single power source? That's fantastic!!
I don't use that much power per day at home... and Tom Murphy (Do the Math) got his home usage down to 2.8KwH per person without any great sacrifice.
Even though the GE 1.5MW turbine has been the best selling turbine in the U.S. its market share has been slipping for several years. The average onshore turbine installed in the U.S. in 2012Q1 was 2.15MW, ranging from 0.9MW-3.0MW. Of the 1695MW installed, only 9MW were 1.5MW GE's. Larger GE turbines (1.6MW and 2.5MW) were 421.1 MW. Among other manufacturers, only 2-900kw, 49-1MW, and 81-1.5MW turbines were installed. Most installations were larger: there were 85-3MW, 250-2.5MW, 8-2.4MW, 99-2.3MW, 136-2.0MW, and 72-1.6x turbines installed. Even including other mfg's and 1.6x turbines as '1.5MW class,' the U.S. onshore market has (finally) moved past the 1.5MW class. 2.0-2.5MW is where the action is now.
62% of MW's installed in the U.S. 2011Q4 were from 2.0MW or larger machines, most of the rest was 1.6-1.8MW.
Euan, that's shockingly wrong! Scotland's 100W/m2 average yearly solar insolation is quite similar to that of Germany, and about half of what you might get in great solar locations such as southern Spain, but it's far from 10x worse than other places! I don't want to say that solar PV doesn't have a problem in winter in Scotland, but it's certainly not half as bad as you seem to think it is.
Furthermore, MacKay's book is rather new, but with regards to solar PV it is already old - so much has happened in the past 2 years in solar PV that his information is just outdated. Perhaps the most important development is that module prices have dropped so much that they no longer dominate solar PV system cost as they used to. This means that the economics now favor more efficient panels (same amount of construction costs around the panels, but more output) than before - hence also the rapid decline in the fortunes of the thin-film PV makers. => goodbye 10% efficient panels, welcome 20% efficient panels!
Correct;-(
It remains true, however, that the Sun barely gets above the horizon three months of the year in winter when our demand is highest. I'd really quite like to know the ERoEI for solar at Scottish latitudes, both with and without storage.
Good numbers on ERoEI are hard to come by (I looked for a while some time ago). Typical numbers that are thrown around are energy payback times in the range of 1-4 years, depending on location/insolation and technology used. With an assumed lifetime of 25 years that turns into ERoEI of 6-25, but as usual, it's not really clear whether everything has been included in the calculations...
Not if one needs more power on a cloudy day and there is not enough space to add them anywhere else. The power output on a cloudy day is independent of direction provided the panel is pointing toward the sky. If Sun shines only during 34% of the daytime in the UK, then they will need to overbuild their PV arrays by 3 to 4 times, and dual-axis trackers probably make less sense than pointing panels northward.
Respectfully and vehemently disagree. Relying on reflected or refracted sunlight, even with optimumly oriented PV, returns negligible production. The one exception may be snow. I've been data logging my production for years, long enough to know that my arrays' production drops to about 5% of their peak production during totally overcast conditions. I can't even find any studies on the subject, likely because it's not considered worthy of the time, effort, and money. I expect that arrays would need to be overbuilt by 10-20 times to get any similar production. PV needs full sunlight, and as much as they can get. I built single axis trackers and improved output an average of about 35%.
BTW, dual axis trackers only boost production over single axis marginally, while adding costs and complexity....
http://altenergymag.com/emagazine/2011/04/single-vs-dual-axis-solar-trac...
...especially if one is willing to make seasonal adjustments to single axis trackers. Dual axis trackers I've seen go a bit crazy in cloudy conditions, searching everywhere. Single axis, not so much.
Having said all of this, I submit we've strayed off target somewhat ;-/
Maybe my clouds are thinner than yours because my elevation is about 2,000 m. I routinely see 20% to 25% power output from my PV panels on cloudy days. I have only seen the output lower with rare, very dark rain clouds overhead. On a clear day when Sun is behind my PV panels, they output 25% power except near sunrise and sunset when Sun is low on the horizon. I do not recall checking power output during a rainstorm or foggy conditions when I suspect it would be lower.
Tracking craziness is eliminated by using a computer to point the array based on location, date and time of day. Using sensors to detect the location of Sun is not the best method.
The graph shows about a 20% increase in power from a tracker with 34% clear days. Trackers provide no gain and actually waste power on cloudy days. Consider how little power the array would generate on cloudy days when 2 out of every 3 days is cloudy. The array would have to be overbuilt by more than 3 times to keep batteries charged even if using trackers.
North facing PV does get some direct sunlight in Spring and Summer.
I know you are a big fan of tracking arrays. I considered them in the 1980's rejecting them for residential installation because of mechanical complexity, reliability and expense. By my data and calculation it was more expensive to buy and install a tracker than to purchase additional PV panels pointed in a fixed direction. That was still true when I checked prices in 2003. I prefer to mount them on my roof using EMT (Electric Metallic Tubing) so that I can manually tilt them in altitude to adjust for the seasons. I still think keep it simple and reliable is the best approach.
One can connect east and west facing PV modules to the same (small) inverter and increase power production in the morning and evening.
Given the fact that PV-modules have gotten really inexpensive, there's no reason to consider tracking any longer: http://pvinsights.com/
Small PV-systems in Germany are meanwhile only allowed to produce up to 70% of the installed PV-module capacity. This 70% cut only leads to a loss of 3% - 6%.
Dave has done a great article looking back at yesterday's energy supply market. In today's world, dominated by yesterday's economic system, fossil fuels appear as the only choice for future energy supply. Most of the renewables are intermittent and require additional storage to provide the sort of energy service that the developed nations have come to take for granted. The fossil fuels are already found as stored energy, thus there's no cost associated with that storage, other than the cost to produce the fuels from their geological source(s). Dave addresses this in great detail, "proving" that there is no hope to reduce the world's CO2 emissions enough to meet the stated political goals.
Of course, the problem of climate change is a forward problem and it appears possible that it will be an existential problem of major proportion. If that turns out to be true, the old political/economic calculations will not fit the new awareness. History provides numerous examples of the extent to which nations will go if they believe themselves threatened. We know what happened during WW I and WW II, as entire economies were rapidly re-directed into survival mobilization. Many people were badly hurt or killed and entire cities were wiped off the map by very brutal aerial bombing. Millions of people fought in armies spread over large areas of land and sea. While the development of nuclear weapons made a repeat of such global conflicts unthinkable, there still remain large standing armies and massive spending for military equipment as a form of insurance against the start of another round of global conflict. We see today the Iranian sanctions and the threats from Israel to attack Iran as prime evidence of the length to which nations will go when facing an existential threat.
Should the world's peoples (not necessarily their leaders) decide that Climate Change is such a large threat that emissions must be curtailed, the result would be another sort of global revolution. Recent history has shown that the public will force their governments to change when there is enough dissatisfaction and desperation takes over, as demonstrated by last year's Arab Spring and this year's European elections. Who would have thought in the days before the Fukushima Daiichi nuclear disaster that Japan would find itself without any operating nuclear power plants today? As the impacts of climate change increase, there will be a point at which the threat becomes so clear that it will no longer be possible to ignore them. After that, the future of the industrial world will not be like the past...
E. Swanson
"Should the world's peoples (not necessarily their leaders) decide that Climate Change is such a large threat that emissions must be curtailed, the result would be another sort of global revolution."
That's the decision I reached about 16 years ago; didn't want to be in a position of learning to swim after the flood hits and the boat starts sinking. At least my choices have been a bit better than, as Euan hints at above, Scotland and many other places.
Reducing consumption dramatically will be the first, best choice for most of the developed world (using 'choice' loosely here). I expect this choice has been made for them, primarily through lack (delay) of acceptance in the PTB sector and their following populations; austerity will be imposed, but not by choice. Not too funny, that. Worse yet, (again, as Euan hints at) very poor choices are still being made.
I expect that Scotland will be marketing used PV panels in the not-too-distant future :-/
ES
I think Dave's point is that the world will likely be down to about half the daily use of fossil energy in about 60 years, compared with today (leaving aside some uncertainties over shale gas and clathrates, which might make a marginal difference). Regarding cumulative carbon release we are not yet at the halfway point if I understand his Table 3. Dave makes Archer's point that in effect the cumulative result for the atmosphere will last for hundreds of years. We have only just begun to clearly see positive climate feedback response to radiative forcing, and to borrow from Hansen & Sato 2011
We do not know how much the climate system will respond over the next several hundred years and I suppose one can be either encouraged or alarmed by a level of uncertainty. We know more however about past climates and their interaction with the carbon and hydrological cycles. Modern rising CO2 levels for example are rising more rapidly and changing the ocean more quickly (pH levels) than the slow changes recorded 5 million years ago when CO2 was last near 390ppm in the atmosphere. Our new climate levels of non-condensing gases will outdo that by a handsome margin. A disordered carbon cycle is not pretty to contemplate, and I personally have recently had a sobering experience updating myself from recent climate science papers (see Ugo Bardi's blog, Cassandra's Legacy).
Phil
"We do not know how much the climate system will respond over the next several hundred years and I suppose one can be either encouraged or alarmed by a level of uncertainty. We know more however about past climates and their interaction with the carbon and hydrological cycles."
It's often what one doesn't know that bites one in the.... Also, while we can compare levels of naturally occuring GHGs to past climate scenarios, these comparisons can't account for non-natural, long-lived compounds currently in the mix (CFCs are just one example), and what synergistic effects these may have on climate. In this regard, we're exploring new territory. Any studies on this?
I agree. Models of past climates can often claim reasonable accuracy and in my view tend to give us lower bounds for what will happen. Upper bounds are something else. Cornucopian projections for fossil fuel energy, industry, economic 'growth' models, on the other hand, seem to go off into fantasy stratosphere (which I think has been Dave R's point for a number of years), and can be mostly discounted, it seems. What we are going to get, however, in terms of climate is already deeply threatening because of positive feed-back amplification in an already warmed interglacial. I know of no studies that specifically address your points but anything that could affect 'carbon-sinks' as well as sources of atmospheric carbon CO2 and CH4 in the longer term, could be game changers, and there are known potential examples of these.
"politicians should abandon their Green posturing and get on with planning secure and affordable supplies of energy for their populations."
I don't quite follow this. If, as the article states, we run out of oil, gas and coal fairly soon with around 90% depletion by 2070, then why should politicians be promoting affordable supplies of energy? If anything they should be taxing the H out of it to crank the price way up, and disproportionately so for energy derived from FF sources, leaving renewables as untaxed as possible, plus drop the subsidies for renewables as well so that we don't get the absurd PV installations in Scotland you describe. Let renewable installation stand on its own merit in terms of where and how they're installed, but "level the playing field" of price by taxing FF's to internalize the externalized costs wrt sustainability. Subsidies generally don't lead to efficiency. Taxes are much better.
Of course, I see the chances of politicians doing this to be slim at best but that's the only way we're going to get a meaningful shift to renewables. By promoting affordable supplies of energy wouldn't that just encourage people to go out and buy SUV's?
Nor do I;-) This boils down to policy reactions to two quite different problems:
Climate change
You'd opt for energy wasting CCS
Try to curtail FF production, especially low grade large resources like shale gas
You'd promote nuclear
You'd promote sensible renewables + storage
Energy Decline and security
You'd do all you can to promote FF production, including shale gas
You'd promote energy efficiency that enables higher prices to be paid, leading to more FF production
You'd promote nuclear
You'd likely want to ban CCS in favor of CHP (energy efficiency again)
You'd want to ban temperate latitude bio fuels (energy efficiency again)
You'd promote sensible renewables + storage
What we have at present is a bastard mix of policies that are not fit for any purpose at all, they are failing everyone, especially in Europe.
I can persuade myself to favor taxing FF production and use (despite propaganda both are heavily taxed in Europe, apart from deep coal) and to use proceeds to help build renewable infrastructure and storage in order to help provide secure and affordable electricity in the future. Taxing FF to reduce CO2 emissions is utterly futile. All we are doing there is making ourselves uncompetitive and allowing someone else to burn the fuel that we might have used to provide us with prosperity.
Highlighting the intersection:
Why would you do "all you can to promote FF production" in the case of energy decline and scarcity? What's that going to achieve? Since FF's aren't produced, that will just cause them to run out faster. Furthermore, it will enable economic growth to accelerate the problem further. Shouldn't we be doing everything we can to discourage FF production? Sure, this may make us uncompetitive with another country that doesn't tax FF's but if this promotes a shift to renewables then this will be an investment in the (near) future as the other country that didn't tax FF's to the moon developed an infrastructure around FF's and will be hit hard as oil runs out and price inevitably rises.
Actually, if one were seriously interested in climate change one would primarily promote efficiency measures including weatherization and and lower income taxes in favor of a tax on energy and introduce feebates such that people would not primarily buy gas-guzzlers like this:

Unless the US infrastructure is meanwhile really that bad, that the majority needs to purchase such vehicles...
Improved energy efficiency is the direct route to tolerance of higher energy prices that will lead directly to a higher proportion of FF resources being converted to reserves.
http://www.theoildrum.com/node/7411
And these reserves will stay there (assuming serious efficiency policies and FF-taxes would ever be introduced). Just as there are more sperm whales reserves now than were around in the 1870's.
People who insulate their houses won't take out that insulation again.
People who replace their old fridge by a new efficient fridge won't take back their old fridge.
People who install a PV system on their roof won't turned it off again.
People who switch from an oil heating system to a heat pump powered by wind energy won't switch back to an oil heating system. http://www.theoildrum.com/node/4541
People who switch from a gas-guzzling commuting vehicle to an electric commuting vehicle won't switch back to a gas-guzzling commuting vehicle.
People want a hot coffee and a cold beer. They don't care whether they get it by wasting FF or not.
Euan,
"Improved energy efficiency is the direct route to tolerance of higher energy prices that will lead directly to a higher proportion of FF resources being converted to reserves."
That is a serious point. A kind of Jevons Paradox in the long run.
Dave
Even if Jevons Paradox were true (e.g. people drive detours on their way to work just to waste more gas and more time (because gas is cheaper).):
If income tax is being reduced and tax on FF-energy is being increased (as opposed to subsidized), energy is still more expensive and people have still an incentive to waste less of it.
Jevon's Paradox is true - Jevon discovered it while investigating actual economic phenomena. In the case of petrol, increased efficiency wouldn't lead people to drive detours on the way to work, but it would lead to:
(a) People buying larger and more powerful cars (e.g. SUVs) instead of small 4-cylinder ones;
(b) People deciding that they can drive further to/on their annual holiday and maybe take a caravan (refer point a);
(c) People deciding that public transport, although available, is too much of a hassle while they can afford to drive to work.
On the other hand, Jevon's Paradox assumes constant prices. If efficiency gains are being driven by higher prices rather than technological change, consumption will not increase. Instead, it will merely decrease less than it otherwise would. I don't expect those price changes to come from increased taxes (much as I would welcome that), but from the increasing cost of producing crude oil.
Have you ever read all of The Coal Question?
Give it a go, it is pretty short and crafted pretty readably. Seeing how dead wrong Jevon was in his predictions of energy production (and how he totally missed the boat on the future of electrical power) and realizing he was one of the most informed people on the state of energy production of his time makes for an eye scale shedding experience.
OK - I'll give it a go, but it might take me a couple of weeks to find the time.
Hope you find it worth your efforts. For me finishing it did become a bit of a slog, but I felt to get a more complete understanding of Jevon's point of view and frame of reference I needed to. I think finishing it was a bit of slog for Jevon also, or at least that's how it read for me.
My main point here was, to quote Niels Bohr, 'Prediction is very difficult, especially about the future." Of course as I grew up loving to 'hate' the NY Yankees so I always hear Yogi's version in my mind's ear. Heck baseball season is in full swing, a couple dandy Berra quotes should lighten your day ?-)
1. People in the US already drive SUVs and pick-up trucks. So they can only waste more by driving detours to work.
2. The Caravan has far higher renting costs than fuel costs.
3. You still ignored the point I was making: Energy is being taxed as opposed to income such that people have an incentive to actually waste less.
1. Not everybody does. With cheap petrol, increased efficiency of engines would lead to increasingly powerful engines.
2. True, but there's already a market for caravans, both rented and bought. A more efficient and powerful engine, making it cheaper to haul a caravan, would shift the point where a caravan holiday would stack up on a cost/benefit basis in the eyes of many people. And caravans, of course, save a packet on accommodation costs. We have a phenomenon in Australia of "grey nomads", retired people who sell or rent out their home and live on the road, travelling the country while they live on their retirement nest eggs and the age pension.
3. "Energy is being taxed as opposed to income such that people have an incentive to actually waste less." Is it? I read the comment to which I was replying as though it was proposing that energy be taxed instead of income. I can't see that getting off the ground in the US. We're just about to have that come into practice here in Australia, to a limited extent, with the carbon tax. And it looks like getting the Labor Government kicked out on its ear. I certainly accept that, if energy taxes replaced income taxes, there would be a strong financial incentive to waste less. I explain further down, though, the basis of my objection, which can be summed up by saying it is inequitable and will be unable to sustain political majority support. In reality, I think Peak Oil will do the job that some people are proposing higher energy taxes perform.
I said:
If you wanted to address climate change you would reduce the income tax and introduce a tax on FF (and would not give nearly $500 billion of subsidies to FF per year).
I don't deny that the FF-industry is not in favor of a FF-tax, which is also why countries are not introducing any tax on FF.
I don't buy Jevon's Paradox, at least not how it's being applied so universally, especially wrt energy. As someone noted above, people who have been commuting 2 hours a day aren't going to go take detours on their way home just because gas is cheaper (I took a detour today in my Leaf but that's because it's so fun to drive). If people's incomes aren't rising (as is the case in the West; they have been going down for 40 years), then there's no reason people are going to go out and buy more gasoline just because it's cheaper.
JP has more to do with technological efficiencies throwing people out of work and therefore requiring perpetual economic growth of a ratio commensurate with the amount of labour-kicking being done by robots and computers (I read today in one of the comments that farm labour has gone down 25 times). In order to keep unemployment down at 40 hours a week and prevent a deflationary catastrophe we need to perpetually consume more crap to keep people employed making and selling that crap. The media brainwashing and continually decreasing interest rates are the methods used to persuade the average petson to get into debt to do just that.
Jevons paradox doesn't apply properly if there are other constraints that prevent people using more.
But, if petrol is cheap, it won't be a factor in how far you're willing to drive to your job. So your commute may get longer if you switch jobs. You won't try to combine trips to save fuel. You won't use fuel saving methods. You may buy a bigger car because "it's fun" and petrol is no longer a problem.
Plus now you're getting more bang for your buck, why wouldn't you want to use more so you can do more things while it's cheap? It's like a 2 for 1 offer, you BUY to SAVE.
I believe that's simplistic, and probably wrong.
There's a straightforward remedy to the competitiveness issue: slap import tarrifs on goods imported from countries that don't haven't instituted comparable carbon taxes, and use a portion of the carbon tax revenues to subsidize exports to those countries. Anathema to free market fundamentalist, perhaps, but easily justified if the tarrif and subsidy levels are honestly calibrated to offset carbon taxes.
In the long run, competitiveness is enhanced, because the reduced dependence on fossil fuels innoculates local producers against the future effects of rising fuel prices.
yes the tariff wars worked so well interntationally in the early 1930s
Smoot-Hawley was such a smashing success. It smashed US exports by over 50% though it did indeed cut imports by that much as well. Punitive tariffs not a real good answer unless almost the whole world is on board at once--yeah that will be happening sometime soon.
Well the dirty thirties did have the roaring twenties to inflate the credit boom so it's not so simple as you suggest. Obviously the economic reorganization as a result of tariffs would be painful but I think we all agree now that our economies will all be radically reorganized in the near future regardless, by way of force due to lack of resources.
Now we have had 30 years of credit boom, the longest one in history, coming to head now with 0% interest rates. I think any policy now which veers from the existing pencil standing on its eraser will help trigger a complete systemic collapse. After that collapse I think tariffs as suggested may be the way to go.
PV in Scotland may well be marginal, but before I spent a lot of time being aghast at installations on north-facing roofs, I'd want to see well-sourced figures on those. Sounds more like a rumor or a rarity so far.
Yes its a rarity, but shouldn't ever happen at all. I had a cold sales call a few months ago and was told by the sales girl that daylight was all that mattered.
Scotland has about 1.2GW of conventional hydro built after WWII that has served the people extremely well. We have more recently built a couple of GW of wind without the storage to make it valuable. And now wasting precious resources on installing solar PV. Something has gone wrong where we are now driven by emotion and not rationality.
I agree this sounds like a rumor.
Since anybody who installs a PV-system on a north facade will make a definite loss regardless of the incentives in place. However, even a PV-system on a north facade will waste far less energy than a gaz-guzzling pick-up truck.
The bestselling car in the US is an incentivized gas-guzzling pick up truck. But instead of pointing out bestselling gas-guzzlers (which is undoubtedly an actual problem), he points out a hypothetical PV-system on a north facade.
The real drive in renewable energy sources in Scotland is from wind energy. And while we might not get much sun, we certainly get more than our fair share of wind - Scotland has 25% of Europe's wind resource (and 1% of its population).
There's 3 GW of onshore wind capacity installed at present, another 1 GW in construction, a further 2.5 GW of capacity consented and 4.2 GW in the planning system.
http://www.bwea.com/statistics/
On a per capita basis, that amounts to roughly 600 W of onshore wind capacity per capita at present in Scotland.
And there are plans for large offshore wind farms in Scottish waters. There is 1 GW of offshore wind capacity seeking approval in the planning process in Scotland. A capacity of 10 GW is planed for Scottish waters.
http://www.sdi.co.uk/sectors/energy/sub-sectors/offshore-wind.aspx
The coal fired Cockenzie power station near Edinburgh is to close down in 2013 and be replaced by a 1 GW CCGT.
http://www.cockenziepowerstation.com/
http://www.bbc.co.uk/news/uk-scotland-edinburgh-east-fife-17381340
In addition, a 0.6 GW pumped hydro scheme has been submitted for approval by SSE at Coire Glas in the Great Glen - a decision on planning approval (or otherwise) is expected in 2014. SSE recently built the 100 MW Glendoe hydro plant near Loch Ness.
http://www.scotsman.com/the-scotsman/environment/scottish-and-southern-e...
And there are major electrical interconnector upgrades planned to take renewable energy out of Scotland to Norway and England for example.
And it all makes Alex Salmond chuckle.
hi Euan below is link to Tsol Valentin software with handy online version
http://www.valentin.de/en/
PV for 1.iKWp/10M2 in Edinburgh on 30deg roof south facing shows 933KwHr for year/ Similar north facing drops to 524 Kwhrs
Pthermal for average 4mSq flat plate 200ltank for Edinburgh shows total yeild of Approx 1000Kwhrs for due south droping to approx 250 Kwhrs for due north facing
Regards
A roof slope of 45 degrees and an azimuth of south would maximize the power output according to the PV calculator at valentin.
Calculation software is great, but at least one source of hard data tables exists that might do very well for data calculations at Aberdeen specifically.
Try this link:
http://pv.nrcan.gc.ca
or you might try finding it by typing Cartes PV maps in popular search engines.
This is Canadian data so you won't find Aberdeen, but there is at least one community with a nearly identical solar insolation profile.
Type in Prince Rupert in the municipality data field. That city is located about 3 degrees further south, but its weather follows a similar pattern with a heavier level of precipitation. The upshot is solar insolation tables are nearly identical for late fall and winter with the annual difference being less than 15 percent higher for Prince Rupert.
Since we're looking at California, let's look at a few facts:
1. Installed solar energy capacity: 1 gigawatt
2. Installed wind energy capacity: 5 gigawatts
3. Installed hydro capacity: 13 gigawatts
4. Installed geothermal capacity: 1.8 gigawatts
5. Installed biomass capacity: 1.1 gigawatts
6. Wind additions in 2011: 1 gigawatt
7. Solar additions in 2011: 200 megawatts
The 1.2 gigawatt wind+solar additions in 2011 represents about 1.5% of total California energy consumption. As for the claim that the percentage coming from solar has been flat at .3 percent. Sorry to say that's not good info. In home rooftop power alone, which is not included in the above figure, California is now pushing 5% of peak capacity:
http://cleantechnica.com/2012/05/02/california-utilities-balk-as-home-so...
In 1999, 500 homes in California had home solar energy arrays. Now, over 100,000 homes in the state have home arrays. This is huge growth which the above study seems to have missed entirely.
Yes the California Energy Almanac states directly that it ignores anything less the 1MW. If we assume those 100K homes have an average 5KW array, then the Almanac is ignoring 0.5GW peak.
Utilities have also added a boatload. They just added 200 MW in 2011 -- a net gain of 20% in capacity. I think this might need a bit of a fact check.
Robert,
"Utilities have also added a boatload. They just added 200 MW in 2011."
Lost me here. At a typical CA capacity factor of 15%, that would give us 263GWh per year. The state ran 290TWh in 2010. 0.1%. Doesn't sound like a boat-load to me.
Dave
Not to dispute your main point -- which is valid -- but I believe that the typical CA capacity factor for utility PV is closer to 25, not 15%. Six hours FTE. It's in the desert.
Roger,
Thanks for your comment. I will be happy to defer to someone who has more knowledge on this.
Caltech has 1.2MW of PV, and we get 14%CF. My experience is that even in summer at high noon, we never get close to 1.2MW instantaneous power output. Apparently the reason for this is that the modules are rated at 25 degrees C, but of course they are much hotter than this in summer at high noon. This reduces the output power. Would the inverters count as a loss also?
Dave
In conversations where people discuss the peak power of PV *panels* yes the inverters count as a loss. New arrays should be able to hit peak power on the cooler days a couple months away from the summer solstice.
Falstaff,
My installer calculated the capacity of my PV array by multiplying the panel capacity by the number of panels. I checked with a person in Caltech facilities, and he believes the that the Caltech PV capacity, 1.2MW, was calculated by multiplying the panel capacity by the number of panels. Is there some level where this calculation is done differently? Are these exceptions to the general practice?
Dave
Yes, that is the normal way to calculate the rated power of a PV system while virtually nobody uses the adjective "rated" to make it clear.
BlueTwilight,
Thank you for the information.
Dave
The highest instantaneous peaks will typically be on intermittently cloudy days, where the panels are cool due to not carrying current, and are then hit with full sun as the clouds pass.
Robert,
"the above study"
It is no study. The numbers come straight from the California Energy Almanac, which is the state source for renewables.
http://energyalmanac.ca.gov/electricity/electricity_generation.html
If you do not like the way the state does the calculations and what it includes, why don't you let them know about it.
Dave
Robert,
When I wrote the post I was not aware that for the purpose of the renewable portfolio standard for utilities, California does not consider customer-generated electricity.
http://www.energy.ca.gov/2010publications/CEC-300-2010-007/CEC-300-2010-...
This means that my Table 1 is probably OK for the purpose of discussing progress toward the 33% renewables target through 2010.
As near as I can tell California treats consumer-generated electricity as a demand reduction. Presumably this is true for things like Caltech's natural gas combined-cycle plant, as well as for rooftop PV. Effectively they are accounted for in the denominator of the share calculation rather than the numerator.
Dave
Yep. For a peek at 2011 state level renewables production by fuel (which still doesn't include most DG), see here (look at the YTD stats by state thru Dec 2011):
http://www.eia.gov/electricity/monthly/current_year/february2012.pdf
Curiously, the CPUC has all 3 IOU's over 20% in 2011. Although the cumulative CA RPS generation increased 50%in 2011, I'm guessing this also has to do with REC's and WREGIS. The biggest factor is probably that they are only responsible for 20% of bundled service customers. Thus their 2010 20% goal was only 33,839 GWH, whereas looking at total power consumed in California 20% would be 58037GWh per your CEC data.
http://www.cpuc.ca.gov/NR/rdonlyres/B5AF672B-ABB6-4B0F-8F52-AF78D4701677...
The difference has to do with POU's, CCA's, small IOU's, and the IOU's unbundled customers. The 33% applies to all of these.
Hi Euan, I appreciate your balanced and pragmatic viewpoint. However, I would argue, in the overall competition between energy technologies to deliver the highest performance/risk ratio, wind and solar have already soundly defeated FF for delivering electrons. This is the core of the current debate. Very old, powerful and entrenched capitol does not want to stand by without a fight and witness their investments in FF losing to these young, rude uppity renewables.
Wind and solar have of course their own "sweet spots" so proper siting and grid management are necessary inputs, but these are manageable challenges. Anectodal evidence of idiotic siting or near failures of grids due to large transients driven by intermittent renewables do not stand up as credible worries compared to a broader review of larger-scale performance and experience. We have plenty of idiotic FF sites and practices and grid failure events that happened long before renewables came along.
Your oldest heritage power plants in Scotland will very soon be scrap heeps because rust never sleeps. If I lived in Scotland, I would personally invest in the best air-to-air home-sized heat pump money can buy, get a small, modern wood-burning stove for the very coldest 3-4 weeks of the winter, improve all insulation (windows, walls, etc.) and replace all lighting with LED solutions ASAP. I have already done most of this in my home here in southern Norway in addition to always choosing the most energy efficient appliances when these must be replaced.
And finally, you present the need for back-up generating capacity as a burden that the renewable energy projects must carry themselves as part of their own investment and cash-flow analysis. I claim that for wind projects this is already the case. Wind production is mostly at times of low electricity demand, and for some areas like Denmark and Texas, they often receive no income when they produce at high capacity at night. For Denmark, the unsaleable nighttime electricity from wind is exported to Norwegian and Swedish regulatable hydroelectric dams. Wind producers get little or no income from this. The hydroelectric dams turn this around and sell the stored energy at times of peak electricity consumption at full price, laughing all the way to the bank. For PV, production is always at times of peak demand, so this is not a similar problem. So for PV,the question becomes, how many cloudy, hot, windless days does your grid service. Please do not say anyone in their right minds expects PV in northern latitudes to make any meaningful contribution to peak winter demand. That is what wind, pumped storage, biomass and yes peaking nat. gas are for.
As I've mentioned elsewhere on this site before, we have a 44-year old, 232 m2 Cape Cod and our winters are colder than those of Buffalo, NY, and I'm guessing most if not all of Scotland as well. This past winter, our two air source heat pumps consumed just under 3,800 kWh in total (3,787.9 kWh to be precise) and 100 per cent of this electricity was generated by wind and low-impact hydro sourced through Bullfrog Power (www.bullfrogpower.com/)*. We can't generate our own renewable energy on-site, but are more than happy to pay an extra 2-cents per kWh to someone else who can.
Also worth noting that using the very best heat pump technology commercially available today, we could theoretically shave an additional 1,000 kWh off our space heating requirements (12.5 HSPF versus 9.3).
Cheers,
Paul
* We purchase 1,000 kWh a month of renewable energy from Bullfrog Power. Our running 12-month usage for our now "all-electric" home is just over 9,000 kWh, so wind and small hydro supply 1.3 times our current needs.
The future is electric in Scotland, no doubt about it.
Personally, I'm looking at an air to water heat pump using CO2 as the working refrigerant to get higher water temperatures suitable for my wet radiator system. I've just been told that my plans are "permitted development" by the Council planning department.
Getting off natural gas seems like a good idea to me.
The rate at which UK North Sea gas is disappearing (50% decline in 11 years!), the imminent natural gas production peaks in Norway and Western Siberia and delayed production in the Yamal peninsula together with increased competition for LNG hint at what is to come. Please let me know if you think I'm being paranoid!
I'd add induction hobs for cooking (rather than a gas burning hob) and perhaps a heat pump based clothes dryer if needed. And an electric car - the Leaf once production starts in the UK or a Renault Zoe, for example.
We switched from bottle gas to induction a couple years ago and couldn't be more pleased with the results. Our primary induction hob (a portable Vollrath) is 90 per cent efficient in terms of its heat transfer whereas our gas hobs are perhaps 45 to 50 per cent (we have two BergHOFF induction units as well). With gas, we had to run the extractor fan to remove the combustion by-products and humidity that were generated which increased our space heating costs; we still use the exhaust hood to remove cooking odours and any moisture generated by the cooking process (as opposed to the gas flame), but the runtime can be cut back somewhat and we can operate the fan at it's lowest setting. During the summer months, we can move it outside and cook outdoors, thereby keeping the house more comfortable.
On simmer, the power draw fluctuates between 6 and 100-watts; medium, 300 to 700-watts and at its highest setting upwards of 1,400-watts. In addition to being more energy efficient, it's faster than gas, very easy to control (you can set both the power level and temperature to be maintained) and a lot easier to clean.
Cheers,
Paul
Cool!
We have a heat recovery ventilation system in our house which gets rid of excess moisture, smells etc and provides a more healthy living environment in a modern timber kit construction. We can dry clothes out of the washing machine after a high speed spin cycle (i.e. without using a clothes dryer) in winter. The heat from the heating system dries the clothes and the heat recovery ventilation system takes the moisture away.
We have a heat recovery ventilation system in our home as well (a Venmar HEPA 3000), but still use the extractor fan to remove any humidity and cooking odours generated at the source. Our problem is that in our maritime climate the supply air is often heavily moisture laden; for example, our relative humidity over the past 24-hours: 95 per cent. Thus, there are times when it's best to simply leave it turned off and to keep the heat turned up and/or run our dehumidifier.
We have a Bosch 300 Vision front loader and I'd like to mate it to one of their heat pump dryers (http://www.youtube.com/watch?v=sbeAeYUfUGI). Unfortunately, this technology is not available in Canada. A conventional gas or electric tumble dryer might exhaust 60 litres of air per second, so running a couple loads of laundry through the dryer could conceivably remove up to 400,000 litres of previously conditioned air and, in our case, draw more potentially damaging moisture through our house membrane.
Cheers,
Paul
The natural resources, infrastructure, labour force etc. that builds those renewable energy plants will continue to exist independently of whether or not "other people" have money or not. Subsidies is a small price to pay for their continued existence as a sociological group, all things considered.
I think it's worth pointing out that one can have all the best policies in the world, but if an industry fights back against those policies with every tool they have at their disposal, including bucketloads of money, purchased politicians, endless legal battles in the courts and slick disinformation campaigns in the media, it's not hard to understand why those policies fail.
In most countries there are no serious frame-conditions (policies) in place which promote efficiency and renewable measures. On the other hand there are tremendous subsidies in place for fossil fuels:
http://www.bloomberg.com/news/2011-11-09/fossil-fuels-got-more-aid-than-...
What scares you? China? Brown people in caves? The military is built with 'other people's money'. It is something that we do collectively outside of the normal incentives of a quasi-free market (even though many become fabulously wealthy in the process). It is a response to a perceived threat real or imagined. The irrational campaign by the right against climate science is based on a fear that this threat will rise to this existential level requiring collective action at which point the same calculus that we apply to the military will apply to energy policy.
Prof. Rutledge posted essentially the same article on Climate Etc.
http://judithcurry.com/2012/05/03/energy-supplies-and-climate-policy-2/
The climate skeptics are getting battered about the head and many of them are coming to their senses that fossil fuel depletion and global warming have the same risk mitigation scenarios.
Which is: Transition off of fossil fuels and go the sustainability route! Duh!
"Many of them are coming to their senses that fossil fuel depletion and global warming have the same risk mitigation scenarios"
Thank you. I've been saying that for a long time.
This article confirms the first reaction I had when I first read about the Kyoto Agreement - "This isn't going to work. People just don't act like that."
People are smarter than yeast, but they don't follow plans just because someone tells them to, and they are smart enough to subvert any plan that they don't buy into.
Central planners, including the EU central planners, can create any plan they want, but it will not work if people have no incentive to follow it. This is the main reason for the ultimate failure of central planning in the communist countries, and the real reason the Soviet Union collapsed.
At this point I would say we are going to have to rely on the ability of people to adapt to changing conditions in future, and fortunately this is much better than most people think - certainly better than the ability of central planners to create workable plans.
I see more similarities than differences between the USSR system and the current capitalist one, at least if one compares with other societies; unlike, say, the Polish Lithuanian Commonwealth or the Kingdom of Sweden in the 17th century (just a random example, I'm interested in that region and age) the USSR was a developed nations with all the accoutrements of the modern age. The amount of control the USSR government tried to use has been quite overrated, ironically partly due to the USSR's own propaganda; in reality, state companies had a lot of free rein. One could contrast that with the alleged free market: A corporation is basically a planned economy in miniature. I would argue that what really did the USSR in is that it was not a steady-state economy; once it could no longer grow (peak oil in the USSR being 1988), things went downhill fast. Capitalist economies have had quite an advantage in their ability to keep the wheels rolling through financialisation, and simply having a far larger resource base to draw upon, but it seems they are reaching the end of the road here, too.
Anyway, I've no doubt that a lot can be achieved at grassroots level, but if the public sphere does not go in and keep things like transportation and infrastructure going, a lot of things will not get done, and a whole lot of other things will get that much harder to achieve. Maybe you prefer that outcome to having a lot of these "plans", but them's the brakes.
The plans put in place to reign in carbon dioxide emissions are far from central planning, a market in carbon emissions was set up which did not work very well because too many free allowances were given away to emitters.
Note that Professor Rutledge forgets to account for land use change, emissions from cement production, and flared natural gas which all contribute to carbon dioxide levels in the atmosphere.
Data for past carbon emissions can be found at the following link:
http://cdiac.ornl.gov/trends/emis/meth_reg.html
I extrapolated the land use change data based on the decreasing exponential trend from 2001 to 2009 (which is optimistic I believe).
The cement scenario is based on IEA projections to 2050, then held constant until 2060 and then decreased by 1.5 % per year (also a rather optimistic scenario).
Flared gas was estimated by creating a model for natural gas output based on a URR of 12,500 Trillion cubic feet , using webhubbletelescope's oil shock analysis, and then assuming the percentage of flared gas stayed near the 1989-2008 average of 3.65 % (I used 3.5 %).
The total of these three items (land use change, cement production, and flared gas) for the period from 1751-2320 is 275 billion tons of Carbon emissions.
Recent climate research (see http://www.fraw.org.uk/files/climate/allen_2009.pdf ) suggests 1000 billion tons of carbon emissions will get us to the 2 C safe temperature limit (that is 2 C above pre-industrial average global temperature.)
Doing the subtraction (1000-275) leaves us 725 GtC which can be emitted by burning fossil fuels.
Clearly Professor Rutledge's estimate of 857 GtC (which I believe is on the conservative side) still leaves us with climate problems when other sources of carbon (besides oil, gas and coal) are taken into account.
DC
I have a couple of posts that also show that Kyoto didn't work. Things actually got worse after Kyoto.
Is it really possible to decouple GDP Growth from Energy Growth?
Thoughts on why energy use and CO2 emissions are rising as fast as GDP.
China and India and other Asian nations grew rapidly, as Kyoto encouraged countries to curtail their own heavy industry. China and India and the other countries use coal primarily. They also were growing from a low base, so needed a lot of infrastructure like new roads and new houses. The rise in their emissions more than offset whatever savings occurred. In fact, GDP had been growing faster than emissions prior to Kyoto, but this stopped in the most recent decade.
Kyoto was never going to work. It was never intended to work. It was just another of those "let's pretend that we're doing something so that those greenies will shut up" ploys.
The real intention was (big) business as usual.
It always is.
Exactly, carry on burning fossil fuel and claiming to be using someone else's apportionment that they would never use in the first place.
NAOM
Thanks Dave, I really like the article. Now, If we assume your numbers are correct and I have my math approximately correct:
By year 2070 we would have produced 90% of the coal/oil/gas long term production. 857GtC x 0.9 = 771 GtC.
Minus current cum production of 364GtC is 771-364 = 407GtC to be produced.
407GtC x 44/12 = 1493Gt CO2 between now and year 2070
Currently, ~25Gt CO2/yr has been yielding about a 2ppm/yr addition to atmospheric CO2 concentration. (both numbers are currently somewhat higher)
Thus, 1493 / 25 * 2 = 120ppm addition to the atmosphere.
So, with this business as usual approach without effective climate policy (I agree policy has been so far ineffective) the concentration in 2070 would be the current 395 + 120 = 515ppm and still rising.
What do climate models suggest a 515ppm world would look like? Would we by then finally have effective policies to limit CO2 emissions? What would the price of fossil fuels be by then? Would those higher real prices for fossil fuel only increase its long term production?
fisherman,
You have a nice way to do the calculation. I have tried lots of CO2 models on the data, and they all give a peak between 450 and 500ppm around the time of the year of 90% exhaustion. In the climate models, it puts us close to the 2 degree C rise that our leaders have committed us to.
Dave
For a bit of perspective, here is one take on the history of C02:
This could be the paper it comes from (someone else told me and I haven't confirmed):
Phanerozoic atmospheric CO2 change: Evaluating geochemical and paleobiological approaches
Royer, Berner, Beerling, Nov. 2000, Earth Science Reviews
https://wesfiles.wesleyan.edu/home/droyer/web/CO2Proxy.pdf
2 degrees is still going to disrupt quite a bit of our weather given the impacts we are already seeing at just 0.8 degrees above the mean (for our time period).
But, it does seem unlikely to me that we have to worry about runaway climate change.
Hey guys, please confine comments to energy and energy policy, if you want to discuss the technicalities of climate science there are lots of other blogs where you can do that. But its a nice chart;-) Seems like The Earth has two modes - warm and cold.
I understand what you're saying, Euan.
However, it seems odd on a post that discusses how much CO2 will be emitted by various policies not to have some context for how much we can afford to emit — the two are so intertwined that separating them seems completely artificial to me. One major reason to move away from fossil fuels is their carbon emissions and that's exactly the question that Prof. Rutledge is addressing.
It doesn't have to get out of hand, but surely in this post some discussion of the above is merited?
Hi Euan,
Sorry about the comment on climate change. The title "Energy supplies and climate policy" made me think that climate change and the effect of energy supplies on climate were on topic. It also seems quite relevant to talk about carbon emissions and the effect on climate. This is not the first time that only a part of carbon emissions was considered. I have also looked at the climate models, particularly the Magicc model available on line. Business as usual will take us over the 2 C limit even at the low numbers proposed by Dr. Rutledge, when extra heavy oil and shale gas are added then action needs to be taken if we want to preserve a climate that we can adapt to. The policies are indeed inadequate, what we need are better policies. Energy efficiency is a large part of any climate mitigation strategy, taxes could be designed to account for products produced by countries who ignore climate emissions, slap an import tax on products produced by countries with high carbon emissions (tonnes of C per $ of GDP) and the competitiveness argument is no longer an issue.
DC
It's also worth noting that the US emits double the amount of CO2 per capita compared to the EU.
Actually, Germany increased it's renewable share from 4% to 21% in about 10 years with far less wind, PV, geothermal and biomass resources than California.
California could obviously do much better than Germany. However, Germany has introduced feed-in tariffs (not limited) and California has not.
And not just the piddly little feed-in tariffs that are bandied about in this country, but really serious tariffs. Don't recall the actuall amounts, offhand, but they have been high enough to contribute heavily to Germany's long term deficit problem.
Germany has committed to spending about 100 billion euro for the 25 GW it had installed by 2011.
http://www.spiegel.de/international/germany/0,1518,809439,00.html
However, to stanch the bleeding, it's reduced its FiT rates to 135-195 euro/MW-h, with further reductions to follow if new installations exceed 13.5 GW over the next five years.
http://www.germanenergyblog.de/?p=8991
Besides that feed-in tariffs are paid by electricity consumers who can always choose to waste less:
In the same time frame the US will spend 110 times (11,000%) actual-tax money more on its military without getting any electricity in return. And that is assuming 0% inflation.
On the very contrary!
1. The renewable industry in Germany not only created nearly 400'000 tax paying jobs, the industry and its employees pay more taxes than what they indirectly receive in feed-in tariffs (paid by the electricity consumer not the tax-payer).
http://www.forium.de/redaktion/steuereinnahmen-der-solarindustrie-ist-ho...
2. The feed-in tariffs for wind power lower the electricity prices more than what the consumers pay for them:
http://www.tagesspiegel.de/wirtschaft/art271,2147183
4. Thanks to the renewable energies, Germany has lowered its fuel import bill by €11 billion:
http://www.solarserver.de/solar-magazin/nachrichten/aktuelles/2012/kw06/...
5. The feed-in tariffs for PV in Germany are meanwhile between 13.37 and 19.31 cents/kWh. Even if Germany would still install 7 GW of PV per year, it would only add 0.1 cents/kWh on the electricity costs. (This is besides the fact that the roofers and electricians have jobs and pay taxes.)
http://de.wikipedia.org/wiki/Erneuerbare-Energien-Gesetz
If anything feed-in tariffs haven't increased electricity prices enough such that people actually even care about wasting less electricity.
Actually, Germany reduced its greenhouse gas emissions by 28.7% between 1990 and 2009, even though Germany was export-world-champion in 2009: http://www.bmu.de/klimaschutz/internationale_klimapolitik/kyoto_protokol...
Anyway, your statement is basically saying, that we will have access to cheap fossil fuels by 2050 and renewable and efficiency measures won't evolve at all during the next 40 years.
This is doubtful, since complete PV-systems can already be purchased for €1.1 /W: http://www.solar-agentur.de/index.php?page=solarshop&sub=solar_kplsys (installation adds < €0.3 /W in Germany).
At 1500 sunhours you are already at €0.073 /kWh if you need to amortize the system in just 10 years. (Practically free electricity after ten years. Fossil fuels will have a very hard time to beat this price by 2050 even if you only add inflation).
Unfortunately all your paper napkin calcs go in the bin when you consider that PV only accounts for a tiny fraction of a % of the total global energy consumed and if that component of energy were to rise tenfold or a hundredfold to what would still be a tiny percent it would push the cost of PV to uniaginable heights. It's basic supply and demand of econo 101.
Can you imagine what it would do to the price of PV if you were then asked to supply a significant portion of the worlds energy? The the situation becomes even more dire.
Marco.
Guess what: 100 years ago the world consumed more wood than oil.
1980 the world installed not even 1 MW of PV.
2011 the world installed over 27'000 MW of PV.
That corresponds to a growth of roughly 40% per year.
And Germany with far less sun than California is already close to 5%.
And no Marco there is no material shortage for PV:
While there is only 0.2% carbon in the earth crust, there is over 28% of silicon.
Ahhhhh we're save then. Look everyone, anyone has the answer. It was staring at us the whole time.
Save your sarcasm.
The effect of substantially increased PV production will be substantially reduced costs. PV modules have been following the more or less standard industry learning curve: a 20% reduction in cost for every doubling of production volume. It's been on that trend for 30 years now. If it holds for 10 more doublings -- a factor of 1024 increase -- the cost of the modules will have dropped by a factor of 3000.
Long before then, of course, other "balance of system" costs will far outweight the cost of the PV modules themselves.
Sorry, slipped a mental cog there. That should be a cost reduction by a factor of 9.3 not 3000. Point remains that the module cost will become insignificant, against the "balance of system".
Roger as a time served design engineer I could expend some energy and effort showing you on many many points why your very rudimentary extrapolation (almost cornucopian) of these figures will not hold true but I prefer to let people that are bogged down so deep in their dogma that they cannot see he whole picture to believe what they choose to believe.
It satisfies me more to know that in 10 years time you will be saying.....ahhh see why he was right now.
Marco.
Even if PV costs would not continue to sink:
PV-electricity is already cheaper than electricity produced from oil and 7% of the world's electricity is still produced from oil.
Unless FF-subsidies are going to be significantly increased, PV-installation rates will continue to rise, simply for economic reasons.
anyone,
Using a start date of 1990 gives Germany credit for shutting down inefficient plants after reunification. They will not get any credit from me on that one, because of their share in creating the original mess.
For the last 10 years, Germany has only dropped 0.9% per year, so it is not that different from the EU as a whole or the US (0.4% per year). I am using the BP Statistical Review numbers for CO2. And we will need to see how much they give back if they shut down their nuclear plants.
Dave
You are still ignoring the fact, that the US emits almost double the amount of CO2 per capita compared to Germany.
Even though Germany turned off 8 nuclear reactors last year, the German CO2 emissions still went down by 2%: http://www.spiegel.de/wissenschaft/natur/0,1518,827174,00.html
But of course, nobody denies the fact that Germany has still a very powerful coal lobby and is unfortunately still subsidizing coal.
Ah but we emit far less CO2 per square kilometer of US territory ?-)
anyone,
Hooray for the Germans! :)
Dave
The fact that they subsidize coal is certainly not something to be cheerful about.
I just showed that an efficiency and renewable share increase is technically and economically relatively easy, but unfortunately extremely difficult politically.
Keep in mind: FF receive nearly $500 billion in subsidies worldwide.
Germany's electricity production in 2011 was 2.7% lower than in 2010, mostly because of warmer weather. Despite that, and an 18% increase in renewable power, its fossil-fueled generation went up 1.8%. (Presumably more gas than coal.)
https://www.entsoe.eu/resources/data-portal/country-packages/
Actually, the electricity consumption went down by only 0.3% and the natural gas consumption went down by 13%:
http://www.energieverbraucher.de/de/site/Hilfe/Daten-und-Statistiken/New...
Most people forget the fact that more fossil fuels are wasted in the heating and hot water sector than in the electricity sector.
Which is also why replacing FF heating systems with heat pumps do reduce the FF consumption tremendously and is also why people are almost always surprised that nuclear has a relatively small influence on Germany's CO2-emissions.
A handy tool to visualize the German Energy picture:
http://visualization.geblogs.com/visualization/germanenergy/
Data from multiple sources (1950 to today), and projections for future energy mix. Clearly shows the benefits of efficiency, and phasing out inefficient brown coal plants in the 90s (and maintaining these efficiency gains to today).
Germany claims to be able to get a 14% overall reduction in CO2 emissions by using climate fund dollars, and once again converting to more efficient coal plants.
http://www.businessweek.com/print/globalbiz/content/mar2007/gb20070321_9...
"the replacement of old power plants by new coal-fired power plants may well result in a decrease in the output of greenhouse gases, but, realistically speaking, the decline will only be 14 percent." Nobody said compromise was easy (or didn't bring about results)!
Fossil fuels are having a hard time beating the net energy of solar and wind now. You look at the US and you have 11:1 net energy from oil. Solar is 10 or more to 1, wind is 15 or more to 1. Fracked oil is 5-6:1, tar sands is 3-5:1, deepwater is 5-6:1, oil shale is 1.6:1. That's the future of oil 2-6 net energy and an economy that can't function because of its high cost to produce. And the easy alternatives are being produced now. Wait til we get to hard to fracture oil and the worst of the deep water deposits. The further we go down the depletion curve, the worse this gets.
The reason so many people are still dreaming of fossil fuels is due to the ease with which it can be used to dominate markets. Concentrated source of energy = easy to dominate and monopolize market. The fossil fuel companies are in a battle royale both for their lives and for dominance of the world energy structure. If they win, it means nothing less than long-term civilization decline. Energy depletion + climate change makes this a certainty. The cost of using fossil fuels is just too high and the cost of the replacements just keeps falling and falling.
It is oil's portability and energy density that will keep it big in the transport for a long time. The front loaded cost of battery vehicles and and range/payload limitations will leave that fossil fuel virtually unchallenged in some market segments for a long time. It will take forward thinking I've seen little evidence of to get even the heavy rail industry to move toward electrification right now.
The glut of natural gas on the US market hardly indicates some monopolistic dominance--no doubt the low prices it has brought back are not doing much to encourage people to switch to heat pumps for heating.
There does seem to be some displacement of coal electrical generation by natural gas but nothing is even out there on the horizon to challenge its baseload domination at the moment. However there is no doubt that coal wants to grow as well and it does see PV and wind as threats to that desire.
It seems disingenuous to use 2010 numbers for solar in California, without noting that there's a pretty large surge in installations going on right now. Yesterday, solar provided 1% of California's total electrical power demand (you can check on the CAISO website), and I expect the annual average will be close to that, and next year's number's close to double that. Still not a huge number, but I think it makes the difference between "what are they smoking" and "a valiant effort."
Hi Dankd,
"to use 2010 numbers"
We can all wish California would update its annual numbers more frequently.
"a valiant effort"
1% a valiant effort?
Dave
Yes, you heard it right.
For all of its bluster about being so green, California's flat-earth energy policy is not much better than the rest of the country, and it can take 2 years to get a commercial solar project through the maze of paperwork. I know. That's what I do.
And remember, we are competing against $2 natural gas because some greedheads in Oklahoma etc. decided to drill everywhere at once to maintain the price of their shares on the stock market. (Do you think anyone will want helium 100 years from now? "Oh, they burned it all up with the natural gas that was used to heat water.")
Oh, by the way, we are paying about a third at most of the true cost of our oil. (Have you heard about what they did in Iraq?)
And don't forget, we are burning coal to make electricity. (Do you think anybody will interested in making steel a hundred years from now?)
Solar is expensive. The Greenland Ice Sheet is priceless.
Numbers for energy production from solar are very prone to error, because it is the electricity source with the greatest share of small scale residential installations.
A particular data set might count the generation from a typical home PV system in any of the following ways:
(1) Zero, because the data set excludes non-commercial systems or systems below a certain size.
(2) Net metered generation only, e.g. if, say, 80% of the home PV output was used within the home and 20% was excess sold to the grid, only that 20% is counted as generation.
(3) All the electrical energy generated by the PV cells, whether used locally or sold to the grid.
The 2010 numbers in the article -- that "show solar flat for 10 years" -- are counting all residential (and a lot of small commercial) solar systems as zero, because only sites with more than 1 MW capacity are included there.
I'm not sure what methodology is used by the CAISO website mentioned in your comment, but I think it is most likely something along the lines of (1) or (2) above, at best only counting net metering grid contribution from non-commercial systems.
Then of course there's also solar hot water to consider, which counts as nothing for electricity generation purposes but provides useful energy that in many cases would otherwise have been met by electrical demand.
This is great summary of the realities of GHG emissions. However, the closing sentences which stray into politics are not constructive:
"You will be dependent on subsidies and renewables targets, in other words, on other people’s money. But as the Iron Lady observed, other people’s money runs out."
The English government has engaged for centuries in military adventurism, about which Richard Cobden observed (in reference specifically to England’s wars with France) It was reserved for our own day to witness the close of a feud, the bloodiest, the longest, and yet, in its consequences, the most nugatory of any that is to be found in the annals of the world.
And yet, strangely enough the supply of “other people’s money” which supports this madness has not dried up even yet. I am not particularly hopeful about the course of events over the next few decades, but I think it would be just as well if we avoided using propaganda phrases which are designed to discourage intelligent thinking about economic and political issues.
Roger K,
Lost me in the connection to England's wars with France. As an American, I don't have a dog in that fight. Maybe as smart as PV in Scotland.
Dave
Margaret Thatcher maintained than any interference in the short term efficiency of private credit markets was a form of robbery, but nevertheless enthusiastically supported military spending which allowed Britain to project force over distances of thousands of miles for highly questionable purposes. Even if you take a US centric view of the situation I think that you do have a stake in the amount of resources which are dumped into the US military machine over the next few decades.
The earth’s mineral and biological resources are the common basis of human welfare. If humanity is going to be around for the long run we need to develop an intelligent strategy for long term management of these resources. It may be developing such a strategy is beyond our capabilities, but if you believe that there is even a small chance that real systems intelligence might someday prevail, then quoting people who believe that society does not exist, and that any conception of human welfare that does not involve maximizing the volume of economic exchanges over the next few year is form vampirism, seems like a less than optimum strategy.
Astute point.
The "-OLOGIES"
Through which lens will we analyze the cause and effect for both the failure to reduce GHG's and the associated adoption of renewable energy? If we can allow ourselves the luxury of analysing the layers of the onion we may find the core industrial activity in the centre and Sociology as the skin that encapsulates the entire human condition.
For a case history, look at Daylight Savings Time and what brought it about. Same thing.
For one that deals continuously with large electrical demands, we can see the clear pattern of our civilization of specialization and economically optimized capital (in onion layers): 1) Large capital requires high capacity factors which means 24/7; 2) Large capital and commodity markets requires specialization which drives up the operating time and return on capital - the two are self-reinforcing; 3) The core of industrial activity is electrically driven and most of the fossil fuel transportation can be thought of as supportive to this activity including the movement of workers and staff.
Ironically, this even applies to knowledge based workers that could take advantage of our technologies and divorce themselves of this persistent institution of industrial activity time cycles. We have all the tools and flexibility, yet firms still insist on parking butts in office chairs between the established working hours in a centralized location. Those that depart from this paradigm are the small minority.
Thinking back to post high school and starting my initial forays into the working world while commuting into downtown Vancouver in the volume congested highways from the suburbs, I realized the traffic ground to a halt often and frequent enough for me to get out of my car and exclaim "This Is Insane!" Consequently, members of VPOE took this notion and produced a public service advertisement to promote the idea a few years ago:
http://www.youtube.com/watch?v=O6keKo6lzS4
Which "ology" will provide enough information to shock us out of our societal coercion to patterns and take the first step to change, which is to recognize the status quo is insane? It seems none of the traditional schools of scientific practice can accomplish the task. So we may have to ask ourselves a very simple question while sitting in our cars during the rush hour, (and please turn off the inane radio morning show vacuous chatter that attempt to keep the masses smiling on their way back into the bowels of the industrial human soul grinding machine), ask yourself "If I were the Grand Designer of this society would I actually create a construct such as the one I find myself?"
This little missive is salient to the post as I find myself in the same conditions of "political numbers" for renewable energy and DSM that are never met - nor remotely possible. In BC those that have a sound appreciation of the energy infrastructure and realistic change duration call the current DSM targets as the "Hail Mary". It appears the California RE targets can be classified equally.
As an engineer I find myself contemplating philosophy well outside my realm of expertise; yet, I believe it is the same for many on TOD that have come to appreciate the full ramifications of our local and global challenges. If we delve into the origins of our education, we are Men of Letters. Understanding the first duty we can then hope that not technology or politics will change the course, but wisdom.
It is my understanding that the issue in not conventional resources, but not conventional one that can blow the carbon budget.
I am guessing that Dave is including tar sands and similar heavy deposits, as well as deep water, in the oil estimates. However,he is predicting that the shale keragen will never be economically recoverable. Is that right?
sf,
Yes on tar sands and heavy oil in both production and reserves.
Shale kerogen is not included in either production or reserves, so it is not included in my totals. However, this was not meant to be a comment one way or the other on its future.
Dave
I think your estimation of carbon reserve are somewhat lower than other similar estimate. Anyway, I use to tell to our student that we can have civilization collapse due to the lack of fossil fuel, civilization collapse due to climate change or, more realistically, both in succession.
There has not been a price increase caused by peak coal yet to make further extraction of the reserves in mature regions profitable. The system predominantly extracts the cheapest, easiest to get resources first. Those mature regions with significant remaining reserves are only tapped out to the extent that there are other, less expensive options for producers and consumers to exploit. The producers will return later when the economics are better. Provided business-as-usual continues, that which is economically extractable will be extracted.
So interpret the results as caused by economics on the rising edge of the production curve, not depletion.
BlueTwighlight,
"The producers will return later when the economics are better."
Japan provides an interesting test for this idea. Japan has for many years been the largest importer of coal in the world, 187Mt in 2010, and they have been paying very high prices, over $100/t. Their production last year was 1Mt. If not now, when? They really do appear to be out.
Dave
Coal production is certainly responding to price. Oil is not sensitive to price at the moment, but the 2004- period when oil price starting going up without increased oil production, is the same point that coal use started to take off again.
Not now, but when someone is confident the big capital outlay that will be necessary is worth it. At the moment, expanding in areas with existing infrastructure is a much better bet than trying to restart coal mining in areas where people have forgotten how to do it, or are glad that it isn't being done any more.
I am not convinced that there ever again will be significant coal extracted from those mature regions that have run down their coal mining in the era of cheap oil. However, I also have no confidence that currently producing regions will stop at the same point rather than keeping going after rather harder to get stuff in the era of expensive oil.
The rate at which coal was being produced changed dramatically in the middle of the last decade, and I don't trust a curve fit that treats it as a non-event.
hot air,
Thank you for your comments.
"I am not convinced that there ever again will be significant coal extracted from those mature regions that have run down their coal mining in the era of cheap oil."
That is my feeling also. Underground coal mining is as much a social commitment as an economic one.
"I don't trust a curve fit that treats it as a non-event."
Lost me here. If you follow the link to the paper, it is a regional analysis, so there is no single curve fit. And there are regions where the curve fits fail. In this situation, reserves are used to make the estimates instead.
"However, I also have no confidence that currently producing regions will stop at the same point rather than keeping going after rather harder to get stuff in the era of expensive oil."
An interesting hypothesis. Could we restate it in this form, "In the future, some coal regions will outrun their curve fits, because the alternatives as not as atractive as they were when my four mature regions closed down their mines." I do not know the answer. Certainly oil is not attractive as an alternative, but natural gas is attractive in some areas, particularly the US and the EU. And in some areas, the non-fossil fuel alternatives may work out well. I do criticize some of the stupid stuff my home state politicians do, but I do believe that in the long run, solar (PV and thermal together) looks good for California.
Dave
"Lost me here. If you follow the link to the paper, it is a regional analysis, so there is no single curve fit. And there are regions where the curve fits fail. In this situation, reserves are used to make the estimates instead."
In the case of oil, you regard the Iranian revolution as a significant enough game changer that you ignore data from earlier. I think in the case of coal there was a significant game changer starting in the middle of the last decade and that you might be doing the equivalent of projecting forward oil on the basis of the data to 1985 rather than the data from 1985.
"In the future, some coal regions will outrun their curve fits, because the alternatives as not as atractive as they were when my four mature regions closed down their mines."
Not quite how I'd put it, but that sort of thing.
I think there is a long time lag between price signal and response of oil industry. In Norway for example, if companies want to explore a new area they must first secure the acreage, then shoot seismic, secure a rig and drill some wells - there goes 3 to 7 years. If they make a discovery add another 5 years to first oil production. There has been a ramping up of oil exploration and success. But this is evolution of supplies, not revolution.
The Energy Export Databrowser shows Japan's present coal production at basically zero, but that does not establish whether they mined it all or were undercut in price by foreign coal.
Suzanne; Culter in Managing Decline: Japan's Coal Industry Restructuring and Community Response gives this explanation for the demise of Japan's coal mining industry:
IEA Coal Price Statistics 2008 (PDF warning) shows on pages 9 and 10 that the price of imported coal for Japan has been generally decreasing since 1980 until 2004 when it increased to about $100 / toe. I am not sure the price has increased enough to reopen domestic mines. It looks like the coal mines in Australia are continuing to undercut Japan's domestic production.
As you mentioned coal mining is not the same as oil and gas production. For coal the cost of extraction is high, but for oil and gas the cost of exploration and initial infrastructure development dwarf the cost of production. This encourages an oil or gas well to be produced until it is depleted while a coal mine is produced until it is uneconomic but not depleted. Like a gold mine, a coal mine will probably be reopened when the economics improve.
Blue Twilight,
Thank you for the link to the Cutler book. I had not seen it.
"Like a gold mine, a coal mine will probably be reopened when the economics improve."
For most closed underground coal mines, this is not a reasonable proposition, unless the mines have been maintained for it. More commonly,the shafts are filled in, and over time the floors of the roadways come up and the roofs come down, so the area is effectively sterilized. You can track this in the UK, where there were 800 producing faces in 1973, but only six producing faces at five collieries now. One of these collieries, Hatfield,was shut down for a while and re-opened. There is only one other colliery, Harworth, that is not producing, but is being maintained, so that it could be re-opened.
Dave
I agree with you for a mine that has been filled in and abandoned because the economics would probably never be favorable compared to renewable alternatives.
Most surprising is that the solar share has been flat for ten years, even though California’s solar resources are stupendous.
Yes those figures in the table can not be correct. According to the solar industry, less than 10MW of solar was installed in the entire US back in 2001. Now California has 8-900MW of PV alone, so a least a 90X increase in California solar capacity occurred 2001 to 2010. At the same time, EIA shows total California electricity generation increased only ~38% in the same time. So it is not possible that solar has remained a flat percentage of total electric generation over the decade.
Edit: I also note that the solar figures used by the Ca. Almanac reflect only 1MW installations and above. Obviously that misses a rapidly increasing amount of small residential PV.
Falstaff,
Thank you for your comments. The solar shares come from
http://energyalmanac.ca.gov/electricity/electricity_generation.html
If the state has left something out, I am sure it will catch up eventually.
Dave
The 400+ MW of solar thermal near Kramer Corners has been around since before 2000. The folks talking about less than 10MW back then were talking PV-only. The numbers Dave references only include renewables that count against the investor owned utilities legislatively mandated "Renewable Portfolio Standard." As Dave mentioned, this does not include large hydro or nuclear. As he did not mention, it also excludes self-generation, net metering, and <1MW installations (which leaves out almost all of the distributed generation growth thru 2010). This is useful primarily in measuring CA progress toward self-imposed targets, rather than actual progress in reducing emissions. I would recommend EIA state data for the latter purpose.
The reason California failed miserably to meet the RPS targets relate primarily to transmission constraints, and lengthening licensing timeframes for high-voltage construction. When I started working for a California utility in 1998 it took 18 months to license a subtransmission project thru 131-D. Today that number is 6 years and growing. Transmission is worse. Many subtransmission projects were exempt from licensing, now very few of them are (not because the rules changed but because the application of the rules changed). ROW with existing power lines on which utility rights go back 80-100 years are routinely challenged in the courts when work is attempted.
As an example, my company started upgrading existing 66kV subtransmission lines between Ventura and Santa Barbara for reliability reasons 14 years ago. The work should have been completed in 2-3 years. The project is less than half-done, roughly triple the original estimate has been spent, and the project is currently tied up in legal, regulatory, and political proceedings. I pray that rolling blackouts ensue for several months so that the idiots will let us finish the project (one good mudslide in the right place is all it would take).
Very little wind was added in CA until 5-6 quarters ago, due to wind in the 3 CA wind pockets having been built out to the transmission capacity during CA's pioneering period in wind development. Since then CA has led the country in wind additions again, after the first phase was completed of a major transmission project designed to allow the wind capacity in Tehachapi Pass to be increased by 10X.
Very little geothermal has been added, also for transmission reasons. CA east of the Sierras and North of the San Bernardino Mountains is largely transmission constrained for generation addition (due to the massive solar, hydro, geothermal, and QF plants already in place due to PURPA).
Numerous large transmission projects are in design, licensing, and construction.
I should note that my comments are solely my own, and do not represent my employer in any fashion.
benamery,
Thank you for your very informative comments.
Dave
Have to agree with you, Falstaff. It's bad or skewed info. There were 500 home pv arrays in California in 1999. There are over 100,000 now. Sometimes, the home pv generators push 5% of grid capacity during peak hours, which is causing a bit of hubub from the utilities. As for utility solar, California installed 200 MW in 2011 alone. That's a 20% increase in total utility power from solar in just one year.
Bad info... Needs multiple sources for fact checking.
For those of you interested in small (<1MW) distributed solar in California, here's some good info tracking the incentive triggers (which change as the amount installed increases). Over 1000MW have been installed under CSI out of a total of 1800MW in incentives available until 2016 or until they are all claimed.
http://www.csi-trigger.com/
I dislike the way countries like Australia and the US pay lip service to global CO2 cuts then export Asia all the coal they want. The deal seems to be you make the stuff we need in grimy sweatshops while our conscience and our skylines remain clear. I favour carbon taxing goods imported from greenhouse rogue nations to put the brakes on this process. For example steel from China or India gets a stiff customs duty, say 20%, on importation. It means the Asian mills sell less and the Western consumers pay more. Result less global CO2 and perhaps finding lower carbon ways to make steel or get by with less.
I wonder also if global peak oil supply means peak coal demand. We can't use use as much clunky 'stuff' like buildings if the mobility dependent side of the economy lacks liquid fuels. Thus stationary and transport fuels complement each other to a large degree with so far only minor crossovers like CTL and CNG fuel and grid charged EVs. The sequence would be; PO throws the West into recession, China sells less then imports less coal which hurts coal exporters who buy less finished goods and so on. Therefore PO could have a leveraged effect on global emissions by dragging down coal as well.
BTW my Adelaide based relatives were in Scotland last week and commented how out-of-place solar panels looked.
Global CO2 levels are totally out of our (Australia's) hands. The Asian demand swamps our domestic usage of coal to a small blip. One (economic) argument is that if we dont sell coal to them, then someone else will. Or if things really turn ugly and we still dont sell it, they might decide to come and take it anyway :P Probably not the view we might aspire to, but I think a realistic and pragmatic assessment all the same.
I think it would be difficult to get the same tonnage of coal from a politically stable country in the Asian region. Australia has 9 coal loading ports which I suspect is more than Africa and North America combined. More ports are planned even if it means coal ships will scrape their way millimetres from the Great Barrier Reef. Australia's net domestic CO2e emissions were 540 Mt in 2010 and 546 Mt in 2011, a lot for a country of 22m people. OTOH I calculate CO2 from exported coking coal, thermal black coal and LNG to be about 780 Mt. Our redoubtable federal energy minister Martin Ferguson recently urged the export of pelletised brown coal. Like dude, what is the point of the carbon tax?
Worse I think white collar types are quietly looking away as jobs are lost to offshore in the steel and aluminium smelting industries. I guess they envision Australia becoming a land of outback mines and urban service industries with no factories. However something must be wrong when Australia supplies both the iron ore and the coking coal to an Asian steel mill. We then pay top dollar for the steel made from our own ingredients that has travelled vast distances and coincidentally avoided carbon tax. Carbon tariffs should correct a lot of that. When the US gets domestic carbon pricing they should do the same and bring back their steel industry.
"I think it would be difficult to get the same tonnage of coal from a politically stable country in the Asian region."
Indeed it would and no doubt the cost of coal would increase if Australia were to (theoretically) drop out of coal exports. Of course that wont happen any time soon because the economic value to Australia is simply too important at this point in time with regards to our balance of payments.
"Like dude, what is the point of the carbon tax?"
My personal estimate is that I will pay about 10% more for electricity. Which sounds a lot except that in some parts of Australia the cost of electricity has already increased around 40-50% over the last few years anyway (mainly due to increased distribution costs - poles, wires, transformers). From what I can gather low income earners will receive more compensation after the carbon tax is introduced, such that they will actually be better off under a carbon tax (wealth re-distribution tax).
Higher electricity prices (in theory) should encourage efficiency (negawatts) and make alternative energy more competitive (reduction in FF and energy security). In practice I guess we will see (bearing in mind the current government will be thrown out next election and the carbon tax probably repealed some time later anyway).
Will Australia's carbon tax have a significant impact on global CO2 ? - negligible (as you noted).
"However something must be wrong when Australia supplies both the iron ore and the coking coal to an Asian steel mill. We then pay top dollar for the steel made from our own ingredients that has travelled vast distances and coincidentally avoided carbon tax."
Imported steel is actually cheaper (before the carbon tax) than local steel (despite the freight distances). Check the shareprices of Bluescope and Onesteel (Arrium) over the last 5 years.
A lot of the Chinese steel is for their own domestic consumption (construction).
http://www.worldcoal.org/resources/coal-statistics/coal-steel-statistics/
Australia's contribution to global C02 is disproportionate. If we add say 500 Mt domestic and 800 Mt 'exported' CO2 that 1.3 Gt is a lot of the 30.6 Gt of global man made CO2, yet we have 0.3% of world population. Think of Australia as the flatulent chihuahua that can clear the room. If global CO2 is not Australia's problem then whose problem is it?
Recall at the Copenhagen climate conference Obama handed the mic to then PM Rudd. He spoke of the 'moral challenge of our time'. Must have a good speech because it convinced me but Rudd then cancelled the emissions trading scheme he had earlier proposed. In my opinion Australia can and should do plenty to reduce global carbon emissions. Not to do so is irresponsible and a copout.
I'm guilty of buying cheap Chinese steel products myself rather than Australian made. Some of it is cheap because it is low quality, for example chicken wire you can tear with your hands. But it should be carbon taxed because the Chinese won't be doing it anytime soon; look how they reacted to the EU airline charges. Of that 30.6 Gt of anthropogenic CO2 some 8.2 Gt if I recall comes from China. Again way out of proportion. It has to be penalised to make it less.
"Australia's contribution to global C02 is disproportionate."
Yes our CO2 per capita is high, but our overall contribution is very small.
It is our Asian neighbours (coal customers) that will have a much bigger impact:
Developing World Will Dictate Global CO2 Emissions
Australia is making a good start to reducing its own CO2 emissions (Renewable Energy Target 45,000 gigawatt-hours GWh), so much so that the vested interests (energy utilities) are trying to argue for a reduction in the renewable energy targets:
Origin's fickle renewables outlook
So we must be doing something right if the energy utilities are worried about the reduction in electricity demand.
The real reason for Australia having a carbon reduction target is to help make international efforts for a carbon treaty more likely to succeed. From the UN Kyoto site:
An average 5% reduction, meaning some countries get a higher target & others less: http://unfccc.int/kyoto_protocol/items/3145.php . Australia got a target of 8% - that's an 8% increase, thanks very much!
With an advanced country like Australia getting a pass for an 8% increase, the case for places like China and Brazil to is just unprosecutable. If you want rapidly industrialising countries in the Third World to sign up for carbon targets and make reduction at a global level possible, countries like Australia have to do at least as much, if not more.
In this context, the decision to have a domestic carbon target while exporting far more global warming in ships out of Newcastle & Gladstone makes sense. The domestic carbon target is not important in its own right, but as a downpayment on a global agreement.
The problem is that the denial industry has made it politically impossible for the US to sign up to a global agreement. The only thing that could make China, Brazil, India & Russia sign up if the US doesn't is if those governments decide it is necessary to begin Peak Oil mitigation under the guise of carbon reduction. I think we can rely on the US to make the worst possible decisions, courtesy of its dysfunctional political system, until a popular uprising, greater than the one that put FDR in power and ushered in the New Deal, takes place there. This makes an international treaty look very much like an outside bet.
The alternative is for Australia, as the world's biggest coal exporter, to say "Sorry, folks, but to save the planet, we're closing down our coal exports. If you invest in renewable energy, we'll phase out our exports to you as you ramp up your renewables over a realistic timeframe. If you find alternative coal markets, you'll have to go cold turkey".
This would really set the cat amongst the pigeons, changing the political calculations in all Australian coal customers. Of course, it would require the comprehensive defeat of both current major political parties in Australia - a tough ask, as Australian football comementators are wont to say. But then, in the words of a former Australian Prime Minister, "Life wasn't meant to be easy".
If only. Australia's carbon export hypocrisy is going to make the carbon tax a harder sell politically. It starts in 7 weeks and if Gillard is not re-elected in say October 2013 the replacement government promises to repeal the carbon tax. On the other hand they will probably allow nuclear power which is paradoxically banned in a country with huge uranium reserves. On the other other hand some conservative politicians see nothing wrong with coal since they claim climate change is a myth. Left leaning Gillard seems to think Aussies should burn less coal but if others burn our coal that's not our problem.
By year's end I'd expect laid off steel workers to ask why China doesn't have to pay carbon tax arising from coal from the very same mines that supplied the closed Australian mills. Things could get hysterical. Since the money is handed back in different ways I also doubt that carbon tax will make much different to emissions other than the general global downturn. Another complication is that Japan is paying such high prices for LNG that the utilities are reluctant to replace coal baseload stations with gas fired in case the fuel gets too expensive i.e. the raw gas price cancels the carbon tax advantage. It all seems so predictable.
Now, I'm no supporter of a carbon price - it's a neo-liberal approach aimed at preserving the existing distribution of wealth and income (in this case, with a tiny boost to the people at the very bottom - nothing to upset the apple-cart) and it has a fatal flaw of its own. But first, I have to defend the carbon price against the scare-mongers of the Right, including those who would like any steel workers made redundant to blame the carbon tax*, and who seem to have pulled the wool over Boof's eyes. The steel manufacturers have negotiated an amazing 97.5% allowance of free carbon permits from the Commonwealth Government, so all they need to do is increase their energy/carbon efficiency by 2.5% and they'll actually be in front. Of course, the steel manufacturing corporations are in strife, but that's because of the ridiculously high exchange rate, which is way above what's necessary to equalise prices with overseas.
No, the problem with a carbon price (and the reason I spoke instead of "carbon targets" in my earlier post) is that the funding for the compensation is dependent on the continued sale of emissions permits. If the scheme is successful in eventually eliminating greenhouse emissions in Australia, there will be no money in the coffers to pay for the tax cuts and pension increases that have been introduced as compensation. Therefore, unless the price of renewable energy falls to the level of coal-fired electricity today (adjusted for inflation in the intervening time, of course), the Government will find itself with an unfunded expenditure liability.
Because addressing global warming via a carbon price is a neo-liberal strategy, it reinforces rather than challenges neo-liberal economics. In those circumstances, the Government of the day will be looking for a neo-liberal solution to the budgetary problems they have. This means that they will either cut expenditures on social programs (e.g. health, education, etc), or increase taxes. Pensions will be pretty hard to attack - almost everybody in Australia is either an age pensioner, has one or more parents who are age pensioners, or plans to live long enough to collect one themselves. Further, the indexation mechanism is automatic. It is far easier to attack the employed working class through taxation. The mechanism is simple. A progressive income tax regime means that the government's income tax revenue rises faster than inflation, while inflation pushes people up into higher tax brackets and increases their average rate of tax. Therefore, governments periodically hand back some of this through tax cuts. If the source of the revenue to fund this July's tax cuts dries up, therefore, all that this or some future government needs to do is to delay future tax cuts till they have recovered the revenue that they've lost.
What would I do instead? Well, if I was deciding policy, we would have junked neo-liberal economics already. I would start a crash course of conversion of Australia's energy sources to renewable energy. Wind, solar thermal and rooftop solar (PV & water) would definitely be part of the mix, while I'd get the CSIRO to work on geothermal to see whether it can be made to stack up as well. I wouldn't compensate the corporations which missed out (in fact, I think they deserve prosecution, not compensation), but I would compensate the workers in the redundant industries - with jobs in the new energy industry, if possible, and with generous re-training and relocation allowances if not.
And where would the money come from? Well, a business magazine (which I won't name here) in Australia publishes a rich list, which makes a good first approximation of the people who'd need taxing. First I'd get a correct list, which should be well within the capabilities of the ATO. Next I'd levy the person at the top of the list enough to bring them down to equal number two, then levy them both enough to bring them down to equal the person at number three, and so forth, until we'd funded the transition. This, of course, would solve many other problems as well.
This is a long way short of Socialism, but nevertheless there's no political party in the Australian Parliament which would touch this program with a barge pole. We've seen from Greece, though, how drastic the political changes can be if people are determined that a different course of action is needed. What's necessary is to create the conviction in society that, to quote one of the campaign groups, "It happens to be an emergency".
* For the benefit of non-Australians on this thread, Australia is scheduled to have a carbon tax introduced in July this year and it is then scheduled to turn into a cap & trade emissions trading scheme in July 2015.
For a better modeling of future technology pathways to deep greenhouse gas cuts, I recommend the following:
http://big.assets.huffingtonpost.com/science.com.pdf
We need a better understanding of the cost structure of pollution based fuels and their historical development than has been provided in this article (and argued in a similar fashion by the American Petroleum Institute). We also need to understand that renewables have other attributes going for them: quickly built, easily financed, low risk from catastrophic failure, fully sustainable, energy independent, zero carbon cost, efficient distributed generation, low initial capital cost, fast ROI, scalability, rural development, very low technical barriers to entry, convenience and practicality for the developing world, electricity cooperatives, etc. Also, central to expanding renewables will be reforming market structure for energy in deregulated markets ... and properly pricing storage and other ancillary services. Pumped hydro is hardly the only game in town. Battery development has been brisk for the last several years, and there are several promising designs for large scale energy storage capable of backing up a metropolitan area the size of New York City for several hours (and on a cost effective basis).
http://www.ted.com/talks/donald_sadoway_the_missing_link_to_renewable_en...
Taking a bunch of old and outdated assumptions and projecting them out for the next 60 years gets us nowhere (and I agree, climate policy has not taken us where we need to go). Technology development and human innovation is the story of game changers, and we have plenty in the works at the moment. Carving out a space for fossil fuels will be a last refuge of an old money plutocracy and partisan special interests going forward (if it hasn't already become so today). Euan Mearns needs to get with the times, or get out of the way! Dinosaurs, and yesterday's "affordable" fossil fuels, have it coming. Perhaps not tomorrow, but someday (and likely far sooner than many of us think).
:-)) Are you sure you are in the right place? This is an energy and society analysis web site, not a CO2 reduction blog!
:-)) Maybe you should change your posting name to Rural Idyll
But at least you have posted something of interest and perhaps of value. I watched the showman Donald Sadoway with great interest, and its great stuff!! But I'm not quite sure how you get from his video to this:
If you want to post statements like this on TOD then you need to back them up with data! For example, Donald Sadoway describes Sb (antimony) as dirt (common as) in fact it is extremely rare - average concentration in Earth's crust of around 200 ppb (thats parts per billion), I'm guessing its also quite toxic. Have you ever visited an Aluminium smelter to see how big and dirty it is? Is this the new Green utopia you seek? Are you aware that the magnets in wind turbines are made from Nd2O3 (neodymium oxide)? These neodymium magnets are about twice as efficient as conventional ferrous magnets enabling efficiency of power production, but at huge environmental cost in China where the Nd is mined and processed. I think you need to present a pollution balance sheet.
At any rate, if Europe is to run on wind we need to be able to back up not just a cosmopolitan area but a whole continent, not just for a few hours but for a few days (the hourly wind data does exist and there are many of us who have bothered to look at it) . What have you got against pumped hydro? I'd also point out that Sadoway is focussing on the exact same problem that I highlight - storage is required to enable intermittent renewables. I have no issue with batteries - so long as they don't wreck the planet!
Ugh! Where do I start.
Your post is about climate policy … presumably CO2 has something to do with this?
Agreed. If by "showman" you mean the most popular professor at MIT, you are correct. His project was the first to receive funding by ARPA-E, and it's a favorite of Energy Secretary Chu. It currently has funding from Total and Microsoft, and is in pilot testing.
The battery will NOT be made from antimony and magnesium. This is the prototype battery (for other scientists to test). The material components of the production battery are proprietary, and have not been released yet.
Battery is entirely sealed and with no emissions, so toxic impacts on the environment are minimal.
Wind turbines do not need to be made with permanent magnets (neodymium). In fact, the largest turbine in existence today, the Enercon E-126 (at 7.5 MW), uses no permanent magnets but wound field generators. Enercon is the pioneer of the direct drive generator, none of their turbines use neodymium, and they are the most visible turbines in Europe. Neodymium is a convenience, not a requirement.
http://www.enercon.de/en-en/1337.htm
The peer reviewed paper by Williams, et. al. (2011) is by far the more substantive paper. It proposes a model of renewable energy production for primary energy consumption in California, the sixth largest global economy, and the 12th largest emitter of GHGs. If "energy and society analysis" are your main concerns, this is the paper that should merit the majority of your attention. Among one of their more important conclusions: technological alternatives involving high renewables and those involving high nuclear have equivalent long term costs. On a cost basis, there is no comparative advantage to either approach.
Utter nonsense and completely irrelevant! This is not how utility commissions do resource planning, or how independent operators manage a grid. I am aware of the guest post by Tom Murphy on this site ("A Nation-Sized Battery") and it is entirely bogus and has no basis in modern engineering design or efficient and cost effective resource utilization. It is very unfortunate that the Oil Drum has published this article, since there is nobody working from such a model (and it only serves to discredit the site when junk science is published on an otherwise excellent and credible site). 8 - 12 hours storage is entirely sufficient for a well designed grid (at some 80% of peak energy demand just to be the safe). Any seasonal shortfalls can be handled with adequate resource planning (and not operational reserves).
Energy storage has almost no representation on a modern grid because fossil fuels have been so cheap for so long, and will likely remain so for a decade or longer. But even this is starting to change (as recent new rules at FERC have highlighted). If you'd like to learn more about energy storage and available alternatives, see Sandia Labs, EPRI White Paper, and DOE Reports below. A world of scalable and cost effective energy alternatives awaits you (should you chose to be interested in long term electricity alternatives or not)!
http://prod.sandia.gov/techlib/access-control.cgi/2011/112730.pdf
http://www.electricitystorage.org/images/uploads/static_content/technolo...
http://energy.gov/sites/prod/files/oeprod/DocumentsandMedia/OE_Energy_St...
Pumped storage is a viable large scale storage system with acceptable efficiency.
French nuclear power created an economic need for pumped storage, and I believe the installed #s are
France 4 GW
Luxembourg 1 GW
Switzerland 12 GW
Oddly enough, none of the French pumped storage is in the Pyrenees. Perhaps due to lack of transmission infrastructure. Certainly there are viable sites there.
These do not appear to be "saturation" numbers for sites, but rather saturation #s for the market. Increase the economic incentives and more will appear.
Best Hopes for proven technology,
Alan
Thanks for pointing out the wind turbine with direct driven wound field alternator. Makes far more sense to me than a gearbox and neodymium alternator. What makes even more sense to me is a wind turbine with direct driven water pump. Water pump is very efficient and rugged- and is a natural for pumped storage. Big water turbines are off-the-shelf.
Dear Idyl, I do wish you would stop offering me advice. It would also be good if you would stop expressing your opinion as fact.
There's a number of statements you make here which are not backed up by any kind of data, but this is the one I'd like you to explain. My back of envelope calculation for Scotland.
Peak demand in Feb = 5GW
80% = 4GW for 10 hours = 40 GW hrs
We have two pumped storage schemes
Foyers can deliver 300 MW for 21 hours max
Cruachan can deliver 440 MW for 23 hours
Combined capacity is 16.3 GW hrs
And so to cover a short wind lull using current storage we have 740 MW available and according to you we should have 4000 MW. Furthermore, pan-European lulls can last for up to 5 days. My position is that 21/23 hour is inadequate, you seem to think that 10 hours would do. So I think we are agreed that a lot more storage is desirable the points of disagreement are scale and solution type. I'm all in favor of much more pumped hydro.
What is happening right now and will likely to continue to happen for a long while to come is that wind is being balanced against CCGTs. We are in essence heading for a doubling of our energy infrastructure which I fail to see is environmentally pleasing, very sustainable and the high cost is certainly not good for the consumer or for business.
I didn't say anything about Scotland, and your meager pumped hydro storage capacities. I also didn't say anything about an isolated grid and meeting 100% of your energy demand with energy storage. What I did write about was utilizing large shares of renewables in a diversified and "well planned" energy mix (achieving full carbon reduction goals in climate policy on a cost effective basis), modern grid operation and reliability standards, and using resource planning and operational reserves (at low capacity factors) for meeting 100% of your electricity requirements. Energy storage is an ancillary service and not an energy resource, and it's flexibility is maximized by different management approaches and grid level applications: peak shaving, dinural shifting, arbitrage, capacity, firming intermittent resources, black starts, T&D grid support, frequency regulation, and the like (described fully in the source material I cited above: Sandia Labs, EPRI, DOE).
"Simulations of scenarios with 100% renewable electricity in the Australian National Electricity Market" (Energy Policy, 2012, 45:606-613).
The Australian grid appears to be capable of delivering full reliability and 100% renewables with only a 6.5% share from pumped hydro (relative to peak demand), and an energy mix composed of 30% wind, 40% CST, 10% PV, 6% hydro, and 14% biogas.
From a feasibility standpoint, Scotland should be able to do the same with it's much reduced demand (14% that of Australia), offshore wind potential, and more abundant hydro resources?
"Pumped storage in systems with very high wind penetration" (Energy Policy 29:1965-1974).
Looks at storage requirements in a constrained Irish grid with high levels of wind penetration (up to 68%). Model sets storage target at 25% of peak demand (for 10 hours), and with all relevant reliability benchmarks met. Clearly, 80% of peak demand is a very conservative level (as referenced in the scientific literature above).
Care to show me a study (in the scientific literature) where storage amounts are recommended above those mentioned in DOE, Sandia Labs, EPRI, and the peer reviewed literature cited above?
Dear idyl, you sound like you are getting cross, and while you continue to post links to stuff that is potentially interesting, your postings are still pretty well devoid of content that would suggest to me you have the faintest clue that you understand what you are talking about. If i were a student right now I'd want to be aware that perhaps 95% of the peer reviewed literature is unreliable and that true advances are made by those with the intellect to differentiate truth from untruths and those who avoid simply cherry picking samples of the vast literature that support a particular agenda they want to promote.
I'm afraid in my eyes this is Orwellian New Speak, seductive empty language, but ultimately a potential huge risk to society. If Australia wants to make its mark on CO2 reductions then it needs to close down its coal industry and offshore gas industry with haste. If it wants to make its mark in bridging the gap to the world's energy future then it should not do this since this would cause a huge shock to the global economy (especially China, S korea and Japan) and it should open up its uranium mining industry.
If Canada wants to make its mark on global CO2 reductions then it should shut down its oil and tar sands industries.
In short, if the Sovereign wants to reduce CO2 emissions, the way to go is to shut down C production and to stop all this rubbish about appealing to consumers to stop C consumption.
You still haven't replied to the key study, Williams, et. al. (2011), discussing steep carbon reductions in primary energy use via conservation and renewables in the 6th largest economy in the world?
All you have done is dismiss 95% of the peer reviewed literature, and accuse others of empty content and Orwellian Speak … when you have offered no substantive positions (other than a defense of the status quo) of your own. Not sure if you noticed, but the status quo is a bit under siege at the moment, and the breaking point may very well be neigh:
Turning this picture into something sustainable is going to be the challenge of the next century, and you can either chose to be a part of the story, or to cling to your oil drums until your finger nails bleed fuel, and you can say with a significant degree of haughty schadenfreude: "not in my lifetime."
Just wondering how an HV DC connection to Iceland might work, with specs like:
- Absorb 600 MW of excess wind power from Scotland (except during spring melt, when hydro cannot be held back). 250 of this 600 MW would be replacing Icelandic base load (kept your power up north).
- Supply 250 MW of base load (new Icelandic geothermal) and 750 MW of peaking power, Some of this would need to be scheduled hours in advance and be for 8 to 10 hour minimums (climb up & down)# and some would have more typical hydro response times (5 - 10 minutes advance warning would be nice).
# from a second 40 km long tunnel and second power plant at Karahnjukar. They have a steady 560 MW load and enough water in Halslon to service that load for a 5.5 month long winter (no water inflow).
If some of that 560 MW came from other sources, they could cut back on the water inflow for xxx hours. With a second tunnel & power plant they could then pull extra water out as needed.
45 to 65 meters of head are lost (of 599 m) to tunnel friction. Operating two tunnels at an average 100 m3/sec would significantly decrease tunnel friction losses for more net electrical power.
Although Karahnjukar is designed to supply 540 MW from five of it's six turbines, in reality they run all six all the time at 100% since water projections were conservative. And they get a few extra MW above specs despite higher head losses due to tunnel friction.
A larger diameter second tunnel and a 650 - 750 MW second power plant could supply Scotland with 1,000 MW for a winter (or summer) month. 750 MW from Halslon, 250 MW geothermal - as long as the water/power deficit was made up before or later by Scottish imports (or small run-of-river Icelandic hydro),
Larger schemes than this are feasible (a 1970s design for Karahnjukar called for 2,000 MW of peaking power for export to Scotland). Add Icelandic wind, geothermal and other hydro (existing & new) and the above could be Phase I.
Best Hopes,
Alan
Very nice article, with a lot of helpful information in it. Kudos.
Two things that I note as missing, however, in the article and in the comments so far:
1) Any discussion of carbon capture and storage (CCS) and its relevance or non-relevance to the climate issue;
2) The "cliff" that oil producers are probably most concerned about: the point at which non-fossil energy becomes cheap enough to make it more productive to synthesize liquid hydrocarbons from CO2 and water than it is to extract them from the ground.
Yeah, yeah, I know. This forum is a haunt for graduates of the "dieoff" school of thought, who are convinced that the second point above is a logical impossibility. They maintain that the cost of everything is ultimately rooted in the cost of fossil fuels, and that non-fossil energy can never become cheaper than fossil energy.
It's a case that I've heard reiterated over and over, but never with any substantive backing. Not that I've been able to discover, anyway. If any of you care to make another try, please, fire away.
I am not sure if one could economically use electricity from a PV panel or wind turbine to combine CO2 and water to produce hydrocarbons for burning. One would have to beat the cost of using electricity to power an electric train or car. The following paper suggests it is possible.
Abstract for Sustainable hydrocarbon fuels by recycling CO2 and H2O with renewable or nuclear energy, Christopher Gravesa, Sune D. Ebbesenb, Mogens Mogensenb & Klaus S. Lacknera; Renewable and Sustainable Energy Reviews, v15, i1, January 2011, Pages 1–23:
If oil is around 200 $ per barrel and electricity by PV is around 5 cent/kWh the German Fraunhoferinstitut, usually quite good in the field of applied science, estimated economic parity. There are the first field studies.
The background is, that solar excess production during summer time has to be stored for the higher demand during winter, when there only a relatively small contribution of PV in Germany. The overall efficiency (electricity-methan-electricity) is quite low.
Direct consumption of electricity is of course much better, therefore, first storage systems for consumer with PV panels on the roof will enter the market this year. It would help a lot if you can store the daily demand, it reduces production peaks at noon and allows storage of wind energy during nighttime. However, storage of electricity (from day to day) does not solve the long term storage problem.
Roger - You bring up valid points IMHO. I'm certainly not the best TODster to respond but I've never let that stop me before. CCS: I'm not sure what else there is to say. CCS technology is out there and the benefit seems obvious. OTHO so what? It will cost $X amount to seq. Y tons of CO2. To make a substantial difference in AGW many time $X capex will be required. So who is going to VOLUNTARIALLY pony up those bucks? And there's the seeming insurmountable hump that stops most potential solutions for many of our problems. Just like putting every US driver in an EV in a few years would greatly relieve the price pressure on oil. But who is going to VOLUNTARIALLY pay for that conversion and, equally important, is there enough capex available in the system to do it?
Notice how I emphasized "voluntarily"? Many solutions could be implemented if govts forced folks to make whatever change is required to reach a goal. In the case of CCS it would just be the cost of doing business. In Texas the oil patch has spent $billions to properly dispose of nasty fluids in deep injection wells. Would we have done it if it were optional? I think not. Does spending those $'s bother me personally? Not at all. My 12 yo daughter drinks well water every day. And all operators are subject to the same costs so the playing field is level. Every coal fired power plant in the US could be applying CCS anytime the govt FORCES them to do it. Might cause some to shut down and would certainly raise the cost of that power to the consumers. Easy to understand why we don't see many politicians making serious efforts to push CCS IMHO. In that sense the CCS tech isn't so much the focus as is the public's position on maintaining BAU at what they consider an acceptable cost. And that's the main reason I don't usually join in discussions on the tech chats about EV, solar, wind, CSS, etc. As long as the public judges everything through their personal economics filter and the political forces resists going against that view the technical sides of the issue aren't very interesting to me.
Point 2: "the point at which non-fossil energy becomes cheap enough to make it more productive to synthesize liquid hydrocarbons from CO2 and water than it is to extract them from the ground." Am I and the rest of the oil patch "concerned" about this coming to past? It's not even a passing thought let alone a concern. Do you have an economic model that comes within a million miles of that ever happening? Either some miracle process needs to be developed to make that conversion cheap or you have to push oil prices so high that economies would be so crippled it couldn't sustain even simple functions let alone such a conversion IMHO.
No reason to not disucss such technology. Just in many cases it's similar to tech chats about mining hydrocarbons on distant planets and their moons. I found "Avatar" very intertaining but it doesn't really have much to offer on a practical level.
In Australia, we have two major political parties - Labor & Liberal. Both are big fans of Carbon Capture & Storage and have made lots of money available for it. The idea is to protect Australia's coal mining industry into the future. Despite this, however, there has been dead silence in the media on the topic for a couple of years. I haven't even heard stories of companies taking up the government money for pilot projects.
Why is this? My guess is that CCS, even if it can overcome its technical and safety concerns (and they are in no way minor), puts the price of coal fired electricity up so far that renewables beat it hands down. PV Solar is predicted to reach grid parity in Australia without subsidies in a year or two, so CCS would mean large and unnecessary increases in power prices.
A - An interesting perspective. Makes me wonder with the current low NG price in the US causing many utilities to switch from coal may make any CCS efforts more difficult to progress. Lower cash flow to the coal industry isn't going to encourage them to invest in CSS or push the politicians to subsidize efforts in the face on continued deficit spending
The EPA recently passed rules limiting CO2 emissions for new power plants to 1000 pounds (or was it kg?) per MWh. It's a level than can be easily met by NGCC plants, but is impossible for coal-fired plants to meet without CCS. If the rules actually go into effect, they effectively prohibit any new coal-fired plants in the US without CCS. The coal industry is hopping mad about it -- or at least they're running TV ads saying that "Obama's EPA has killed the coal industry".
In practice, it's much ado about not much. The rules don't apply to existing plants, and with natural gas so cheap, utilities that had previously planned to build new coal-fired plants had already scrapped them in favor of NGCC.
"The EPA recently passed rules limiting CO2 emissions for new power plants to 1000 pounds (or was it kg?) per MWh."
Pounds. Even coal plants could probably meet a 1000 kg limit.
http://www.washingtonpost.com/national/health-science/epa-to-impose-firs...
ROCKMAN - Thanks. Your common sense, experience grounded comments are always refreshing.
Synthesis of liquid fuels may be closer than you think. If natural gas weren't so cheap, then synthesis of methanol from CO2 and electrolytic hydrogen would already be competetive with oil. As it is, it's cheaper to synthesize methanol from CO2 and hydrogen made by steam reforming of natural gas. I believe current cost is under $1.00 a gallon, equivalent to about $1.50 a gallon for gasoline on the basis of energy content. It's a wonder that we're not seeing a rush to convert vehicles to run on methanol. Probably because no one really expects $2.00 / MMBtu natural gas to continue for long.
On the horizon are a couple of developments that together hold promise for cheap butanol made from CO2, water, and electricity. Butanol is very close to gasoline in energy density and compatibility with infrastructure. The first development is a catalyst that allows efficient electrolytic production of formic acid -- HCOOH -- from CO2 and water. The second is a strain of genetically engineered bugs that efficiently convert formic acid to butanol.
The cost of electricity needed to make this hybrid bio-butanol competetive with gasoline can't be pinned down yet. Development hasn't gotten far enough to give a realistic basis for estimating plant capital cost. But if the capital isn't totally dominant, then a COE in the range of 5 - 8 cents / kWh is all that's needed to compete with gasoline at $3.00 / gallon.
Roger - I think you hit the nail right on the head re: price stability. The transition to any of the alternatives which look feasible on a per unit cost basis butts heads with the scalability issue IMHO. To make even a modest dent in the system will take $trillions of capex and decades. And there's the problem: to make those capex investments requires confidence in the cost factors. Not only for the raw materials but for the product sales price. Spend $15 billion on an LNG plant and you need a reliable projection of not just NG prices/availability for the next 10+ years but also the price/demand of your LNG in the market place. Anyone can make those predictions but no one can guarantee those predictions.
I’ve never seen an exploratory drilling prospect that didn’t have a good economic return PREDICTED. But the majority of those prospects didn’t just fail to deliver a return close to the projection but actually lost the entire investment. The last Deep Water well I worked on cost $148 million. Not only was it a dry hole but also completely condemned the entire structure. It’s easy for us armchair commandos to say Alt X makes economic sense. Another matter to convince someone else to invest $billions in the plan or put our on investments at risk.
With nothing changing, we'll be replacing all our power plants in 20 - 100 years (with hydro as the longest operating life). The only price that matters for alternatives is the price above (or below) projected infrastructure rollover costs. If you see these as being excessively large (and the risks outweighing the rewards), they probably don't have a chance. If the opposite is true ... it may just be a matter of time (and less of dollars).
And if that doesn't give you an answer, a $148 million dollar hole at the bottom of the ocean just might!
Roger,
"Any discussion of carbon capture and storage (CCS) and its relevance or non-relevance to the climate issue"
At this stage, power-plant CCS is not a practical option. It is a well-funded research topic with poor results so far.
Dave
Depends on the definition of "practical option". If "practical" means zero cost -- which is effectively the criterion used if adoption is voluntary -- then no, it's not a practical option, and probably never will be. But the technology (or "a" technology) for post-combustion capture of CO2 is well established; it's basically the same technology already in common use in the gas industry for removing CO2 from raw natural gas before sending it into distribution pipelines. So projections for the cost of carbon capture on coal plant operations can be made with reasonable confidence.
The projections aren't pretty: roughly a 50% increase in capital cost of the plant, and a parasitic power drain of 24% on the plant's power output. Companies active in research are hopeful that better technologies for flue gas scrubbing (e.g., based on ammonia rather than monoethanolamine) can get those numbers down to a 30% increase in capital cost and a 15% parasitic power drain. That would lower the cost premium on electricity from coal plants from roughly 50% to a less daunting 25 - 30%.
If a coal-fired plant with CC capability is located in the vicinity of oil fields that can benefit from CO2 injection for enhanced oil recovery (EOR), then the cost premium for electricity can be negative. I.e., the plant can sell its captured CO2 to the oil field operators at a price that more than pays for the CC system and operation. That's how a few pilot CCS projects that are in the works are supposed to be funded. But the risk premium for pilot projects means that the utilities still require DOE support before they're willing to buy in. The real problem is that EOR operations aren't a large enough CO2 market to cover more than a few percent of emissions from existing coal-fired plants.
Roger,
CCS may be technically possible for an individual plant, but it is not practical at the national level, which is the context for climate policy. If the capture is in the form of a gas, one would need a pipeline system of comparable capacity to the current natural gas network. If the capture were in the form of a solid, one would need additional rail capacity comparable to the existing rail network.
Dave
True, and a very good point. In fact, you've probably understated the magnitude of the problem if CO2 were to be transported by rail. The tonnage of CO2 that would need to be hauled is more than three times the tonnage of coal. A large coal-fired power plant already consumes around one trainload of coal daily -- and those are large trains, 60 to 100 carloads. One coal train arriving and three CO2 trains leaving the plant every day!
In practice, transport of CO2 would be done via pipeline. They're more efficient than rails for that purpose. The volume of CO2 that would need to be transported is several times higher than the volume of natural gas that moves through our system, but if the average distance from power plant to sequestration site were less than 100 miles, it could conceivably be built.
The bottom line, though, is that CCS is not something we can realistically rely on to arrest rising atmospheric CO2 levels and avoid severe climate change. We really need to move toward efficiency and conservation to cut energy use, and toward non-fossil energy resources to supply what we would still need.
Distance variable?
I'm really quite surprised to see so much controversy over renewable energy in this forum.
Has anyone got a better idea?
Are we going to kick the can down the road to the next generation, handicapped by our generation's folly of burning the furniture to stay warm in the winter -- just because we are too lazy to go out and chop wood in the cold?
Are we waiting for cold fusion to save our bacon? Are we waiting for "over unity" hucksters to finish their work so we can stay warm by burning their stock certificates?
Economics is an instrument of policy. If solar is expensive, it's the policy that needs changing, not the solar. We are going off fossil fuels willy nilly. So what's the whining all about?! Get over it and get busy!
If policy is shaped in ignorance of long term consequences causing ice sheets to melt, then priceless ice sheets will melt. Solar will seem cheaper than dirt when your coastal real estate is 10 meters under water.
It costs money to have a truck come by to pick up the garbage every week. Is the alternative to throw it out on the streets?
Our ancestors lived within a solar budget. We have so much more science and technology than they did. What's holding up the works?
Solarevolution,
I for one think it's important that we have a good understanding of what we're planning for. Mostly here on TOD we are focussed on technology but, as Rockman points out, the economics of the conversion are possibly more important. I keep reminding people of that, too.
We have three monetary trajectories available to us: a) cascading debt defaults b) hyperinflation or c) the former followed by the latter (that's what I think is going to happen). We are not going to gently wind down the current overabundance of credit we have built up because each stakeholder will defend their piece of the pie.
We have built a worldwide monetary system that is unsustainable. What people don't understand is that "unsustainable" means that someday it will actually stop working. When exactly is hard to know but the point that fossil fuel production stops increasing seems to be the beginning of the endgame.
By all means keep working on the technology while the current system is in place. I for one want a high-quality, inexpensive solar system to run my home. But let's let go of this fantasy that as fossil fuels decline we will be able to continue operating our industrial society as we do now. Who knows? Maybe with the hundreds of millions of unemployed people we'll soon have it will be more economic to hire them to ride electricity-generating bicycles in exchange for some food.
aAngel
Agreed, 101%! Whether it's electricity-generating bicycles (renewable energy) or solar panels on every roof (renewable energy), the time to get started on renewables is not after the monetary system collapses around our heads. Instead of sitting here wringing our hands and finding fault with what we don't like (or know) about renewables, either come up with something else ("I'm all ears") or get busy figuring out how to make and use renewables, learn to "get by" if we must -- in whatever form plausible, whether on the generation side or the application side ...
... and get ready for that world beyond oil.
The time is now.
I take it to be a pretty good indication that the paradigm shift has already taken place, and what we experience today as recalcitrance is rigid adherence to empty forms, mindless special interests, and a passing away of the old guard.
http://www.jstor.org/stable/2764185
"Old cultural forms, habitual types of action, tend to persist through the force of inertia. The maladjustment of these habitual reactions to their new civilizational environment brings with it a measure of spiritual disharmony, which the more sensitive individuals feel eventually as a fundamental lack of culture. Sometimes the maladjustment corrects itself with great rapidity, at other times times is may persist for generations, as in the case of America, where a chronic state of cultural maladjustment has for so long a period reduced much of our higher life to sterile externality" (p. 413).
Starting with Benjamin Franklin ("I'd put my money on sun and solar energy … I hope we don't have to wait till oil and coal run out"), and Jimmy Carter ("this solar heater can either be a curiosity, a museum piece, an example of a road not taken") … I take it we have a few more pendulum swings to go yet, and then we'll be ready for an entirely new paradigm shift (cf. Thomas Kuhn) to come before us (and upend conventional practices and thinking).
Euan, I think this article needs a follow up article answering the points made by those in defence of renewables.
It sems that many posters here have not actually taken anything you've said in this post into account and just gone off on one about renewables!
It needs an ""Energy Supplies and Climate Policy readers reposte""!!
Marco.
Marco, I believe the saying "horses for courses" is appropriate here. Euan comments that PV is bad idea in Scotland. He is right. But the renewable case for offshore wind in Scotland is undeniably strong and attractive. Scotland has substantial hydroelectric dam capacity and together with some natural gas peaking Scotland can use this to close the gaps when the wind is not blowing. An all-out campaign to permanently reduce peak electricity demand as well as reduce average demand will only improve the situation. Any attempt to allow BAU for growth in electricity consumption is doomed to fail. This is self-evident and needs no further support.
But just because PV is a bad idea for Scotland does not mean that PV is in general a bad idea! PV can easily provide in a very cost-effective way all the mid-day-to-late afternoon from Feb.-Sep. electricity needs of all Mediterranean countries. The rest can be provided by nat. gas, legacy nuclear, some storage and a little local biomass burning (modern, clean-burning wood stove) on the coldest days in Dec-Feb. If southern Europe is willing to invest in and depend on PV in northern Africa with high-voltage DC long-distance connections, they could probably extend the time of day and the month of year contribution of PV to meeting their needs. As an example, there is a subsea transmission cable from Norway to the Netherlands (580 km) with about 700 MW capacity in operation for 2 years now. Same potential for very large market penetration of PV for the entire southwest USA. Same for all of Australia. Same for most of India. Same for very large parts of Africa. Same for large parts of China. Same for the Middle East.
The PV industry is still innovating at a very impressive pace, and its costs will continue to fall. This cannot be said for FF or nuclear, which may be innovating but their costs are skyrocketing as some of their worst-case disaster scenarios have been realized in the last 2 years.
Marco / Decarbonizer, guest posts are always welcome, though they do need to pass our review system requiring three yes votes from our editorial board.
I spent a lot of time last year looking at the Scottish electricity supply system in some detail developing monthly models using hourly data based on supply scenarios from a government report. I actually wrote to our First Minister (Alex Salmond) asking for the technical work upon which our energy policy is based and was rather surprised when one of his officials responded and sent me three reports, two of which I'd classify as Green Comic Books produced by Green lobby groups. This is taking us in a very dangerous direction IMO.
The model below is based upon a huge amount of wind capacity (I don't have time right now to look up exactly how much) but it should be glaringly obvious that we have periods of great over-supply and periods of undersupply that need to be bridged using mothballed FF plant. At times of high wind there is no where for this surplus to go since there is a high degree of correlation in wind distribution on the continent scale. The assertion that it is always windy somewhere and that intermittency does not matter is just plane rubbish - the regional wind data exists to demonstrate this.
And so it seems quite obvious that "we" need to build storage and in Scotland pumped storage is the best option IMO, but the scale required is quite staggering. I see us heading for a scenario where we maintain at high cost legacy FF plants that are run intermittently at greatly reduced efficiency, we spend a fortune increasing grid connectivity, we have wind mills everywhere, we build storage that is still inadequate and the grid is still unreliable and business moves else where. And then we decide to replace our existing nukes with 3*1 GW nukes - job done but too late.
Longannet = 2.4 GW coal
Peterhead = 1.2 GW CCGT
Torness = 1.2 GW nuclear
Existing plant that will be closed: Cockenzie 0.9 GW coal, Hunterstone B 0.9 GW nuclear. We currently export about 40% of the electricity we produce, which I think is a good thing.
I would personally prefer to see the money being wasted on installing solar in an around Scotland right now being spent on storage that would greatly enhance the value of current wind capacity. But you are right, it is horses for courses - solar is great where it is sunny, wind is great where it is windy - but the cost of mitigating for intermittency needs to be confronted and not swept under the carpet.
Was this one of the reports that the First Minister's office sent you?
"Matching Renewable Electricity Generation With Demand: Produced by the University of Edinburgh" (February 2006)
I really don't see much of a problem with the graphic you have provided above. You've massively overbuilt wind, to the point where you are exporting 40% of your electricity (or curtailing it for an economic loss), and you have maybe 18 hours of unmet demand. 1.2 GW reserve capacity of CCGT (or biofuels or something else) is obviously not enough available capacity for when wind is not present, and energy demand is at it's peak. You're already running your CCGT plant at a low capacity factor which is not adding much to your costs. Why not build another CCGT plant (which will also burn very little fuel), add some solar (are these peaks during the day), or bite the bullet and import some electricity. And if you're really in a pinch, call up some of your large industrial or municipal users and do some demand management.
This looks like another day at the office, and not an impending crisis threatening doom and gloom for Scottish rate payers and to implode the economy. The cost of intermittency is very small here: roughly the cost of any efficiency losses from stand-by reserves (typically £2 - £3/MWh), and O&M on two CCGT plants that you fire up about 15% of the time. Any additional storage you would build would likely offset your consumption of natural gas.
What are the implications of 90% fossil fuel exhaustion by 2070 on ocean acidification?
It seems like the faster we are able to burn through our fossil fuel reserves, the harder it will be for the creatures at the bottom of the food chain (i.e. those with calciferous shells, plankton, etc)., to adapt, leading to a potentially massive oceanic extinction (and add to the 6th mass extinction already underway).
On the other hand, how long would wars, civil unrest, oil shocks disrupting supply chains, pandemics, economic depressions, Mongolian and other remote coal not exploited, and so on, need to delay production enough to make a difference with ocean acidification (and global warming)? 500, 3000, 50,000 years?
Are you saying it's already too late to make much of a difference on temperature rise, but that it won't be as bad as IPCC projections, with a maximum temperature rise just under 2 degrees C?
If we could make a difference by sequestering fossil fuel deposits on federal land, how long would we have to wait to develop them?
If a max of 680 Gt rather than 3,500+ (IPCC) is burned, isn't that still enough to push us into the runaway greenhouse effect? I wonder how much CO2 could be released by methane hydrates and methane from permafrost melting?
I've been trying to understand for years if we have enough fossil fuels to drive ourselves and most other life forms extinct as in the Permian extinction. This seems to me to be the big question, and I am grateful to you for trying to answer it!
Your answer appears to be no -- should I break out the champagne?
Alice
energyskeptic.com
Ardnassac,
I see no reason to let champagne go to waste.
Dave
Of course there may not be much reason to celebrate either
If renewables and/or nuclear don't step up as oil winds down I'd strongly suspect there will be great pressure to develop not only coal that has been set off limits in national monuments but also to develop the frontier regions where there is no coal production record but are huge hypothetical coal resources. They aren't hypothetical resources because we aren't sure they are there but rather because we aren't sure it will ever pay to mine them. Deep water oil would have been considered a hypothetical resource in the 1950s and we are burning it driving our rigs around now.
Your analysis ignored the huge northern coal deposits as we've had no call to mine them, I truly hope that will be the way it stays, but I don't see us winding down our power use world wide. The arctic seas summer minimum ice extent has been racing toward zero with the shipping lanes open longer and longer. A whole lot of coal is getting a whole lot closer to open tidewater.
I don't know if Canada and Russia have similar resources or just how much of the Alaska resource could be recovered assuming shipping became viable but I certainly can visualize a scenario where the coal gets burned as quick as we can blast it out and move it, not a real pretty picture.
Luke H,
Thank you for your comments. There is some discussion of Alaskan coal in my paper that I linked at
http://rutledge.caltech.edu
Alaskan coal might have made a better example of walling off coal resources by making parks than the Kaiparowits. The main Alaska coal resources are north of the Brooks range and if you look on a map, there is a band of parks, preserves, even a falcon refuge, right across the Brooks Range. Politicians love to make parks in states with small populations. It is not easy to see how permissions could be obtained for coal ports and coal trains north of the Brooks Range either. Or predicting long-term ice conditions,
http://news.yahoo.com/bering-sea-sees-surprising-record-ice-cover-185125...
I do not think that coal is going anywhere.
Dave
I of course am very aware of the record Bering Sea ice cover this year as I check it at least several times a week on both the NSIDC and NOAA sites (map below).
I've family who could not crab fish this season because of that ice--but it is thin and will very, very likely disappear soon enough to have virtually no effect on this summer's minimum arctic sea ice extent--though it won't leave soon enough for people weathered into Cold Bay with snow and fog today. It is keeping it pretty cool out in 'Aleutia' at the moment. No place better to understand the difference between weather and climate than there.
I don't think that coal will go anywhere either, if something else cheaper than it comes on line in large enough quantities soon enough, but what oilman or analyst in the 1950s would have thought we'd be drilling deep water Brazil today? A real squeeze on the industrial world's power output and you will watch all environmental concerns subverted to the 'feed me now imperative.'
Tadeusz certainly reminds of us of how important that imperative is and how BAU can change quite completely for human groups in relatively short order.
Your analysis looked at coal production when oil was coming in big and cheap to take its place--the analysis will hold just fine if something does that to oil.
Luke,
Thanks for your comments.
"Your analysis looked at coal production when oil was coming in big and cheap to take its place."
An interesting proposal. We may be able to test it. I do have historical UK coal prices, and it appears that on an energy basis, oil has been more expensive than coal since 1974. The high relative price of coal should have given production a chance to recover, if minable coal were available. Here is the ratio of production in 1974 to that of 2010 for the four regions in Table 1.
UK 6:1
PA 4:1
FB 340:1
JK 12:1
None of these four regions have any reserves to speak of. You can contrast this situation with coal mining in the western United States, where production declined by a factor of 3 from 1918 to 1962. However, the west has stupendous reserves (note that the Alaskan numbers you gave were resources rather than reserves), and production came back when the market returned. Western coal production is now 30 times larger than in 1962.
Dave
Thanks for the replies Dave.
I do have historical UK coal prices, and it appears that on an energy basis, oil has been more expensive than coal since 1974.The high relative price of coal should have given production a chance to recover, if mineable coal were available
No doubt if any of those beat up coal regions were using oil for electrical generation higher oil should have re-stimulated their mines--well maybe not in the US if western coal could still be shipped in cheaper than PA coal could be mined. Of course coal and oil don't compare on a per energy basis in transport.
However I'm not suggesting that the UK, PA, FB and JK coal industries will rise from the dead, but rather that the caveat--that some producing regions may well produce a higher percentage of their reserves than those four did because the alternatives are not as attractive as they were for those early big producers--may be large enough to roll thousands of miles of coal cars through daily for decades more than projected.
Of course I realize the big North Slope number is classified resource, what else could it be if it is not yet economical to mine the coal--and as I said earlier I've no idea how much could feasibly be mined if shipping were no longer an issue.
If things go well with efficiency/conservation and renewables/nuclear that coal will always remain a resource. If things don't go well on the efficiency/conservation and renewables/nuclear front and the techno industrial world implodes and ceases to function long term because the financial sector completely unwinds the frontier coal will forever stay in the ground as well. My point is that I see the latter scenario as highly unlikely. People and machines do the actual work, not money. The industrial world will pull all stops to keep its 'food' supply intact if it gets in a real bind, and in that situation it won't matter how much coal it takes to get the rest of the coal to where energy is desperately needed.
Luke,
Thank you for the comments. You suggest lots of interesting leads to follow to try get a better understanding of the uncertainties.
"some producing regions may well produce a higher percentage of their reserves than those four did because the alternatives are not as attractive as they were for those early big producers--may be large enough to roll thousands of miles of coal cars through daily for decades more than projected."
One way we could think about this is to ask how steep the long-term supply price curve gets as a region matures. If it looks like oil in Figure 1 after 2004, you would not get any more production. My suspicion is that underground mining has a steep supply curve. If you watch Michael Glawoggen's documentary that was linked in the post, this might give some insight as to what happens when you are really up against the wall. I would guess that these people are only producing 100kg a day, and they are not changing the long-term production by much.
On the other hand, it is possible that surface mining has a flatter supply curve, and your idea may be important there. One limitation of my work is that none of my mature regions are surface miners. The Powder River Basin has a large amount of coal that is classified as resources because it is deeper than surface miners like to go. To me, it seems quite possible that a significant amount of this coal could be made accessible at the right price. This kind of consideration is important for the US, where most of the production is by surface mining. At the world level, it may be less important, because Chinese production is primarily from underground mining.
Dave
Thanks for the comeback Dave.
No doubt my US centric point of view came through loud and clear. I am envisioning either large surface operations or some operation that uses a lot of coal energy at the surface to do some sort of deep operation (in huge deposits) that does not include human deep underground presence. No doubt it would be a different world which would allow the latter to happen.
I haven't watched the Glawoggen video yet as my end of the DSL line connection can make downloading painful. My great-grandfather was a PA underground miner. Early in the 20th century he was in a strike for improved pay and conditions that lasted better than a year but as so, so many others did (do?), he succumbed to black lung in the end.
Luke,
The Glawoggen video is worth the download wait.
The Power River Basin would be a good place to watch to test your idea. I have driven through the area, and there are several aspects of the place that indicated to me that it will be an important long-term coal supplier. The operations are probably much safer than for underground mining, possibly safer on an energy basis than the roofers that do PV installations. It is a high plains area with severe winters so it has limited attractiveness as a place to live. Absent energy production, the economy is low-productivity ranching, and my sense is that the restoration following mining will be adequate for this purpose.
Dave
There's also the very real promise(?) / threat of in-situ gasification for the huge quantities of un-minable coal that exist. There's definitely enough carbon there to push CO2 levels into the red zone -- if we're not already there.
Roger,
Time will tell on this one. I believe this technology dates back to just after the Second World War in the Soviet Union. The advocates of the technology have had plenty of time to show useful results. I have not seen any. I personally have my doubts about whether one could get the environmental permits to do this kind of large-scale chemistry underground.
Dave
Late to the article.
Quote
I disagree. For both human societies and natural ecosystems, slowing down the rate of change makes adaptation MUCH easier.
And since some natural sequestration occurs every year (just not nearly enough !) a half century or century delay in emissions will have a material impact of peak CO2 and the ultimate impact of Climate Change (or I prefer Climate Chaos).
Alan
Alan,
Thank you for your comment. Please go back to my original post.
http://www.theoildrum.com/node/2697
You commented on it several times. Figure 12 is still appropriate. I ran the model assuming world production would be stretched out by 50% in time. There is nothing in the history so far that says we would get even half that slowing. However, with the 50% stretchout, you only gain 0.15 degree and only while the temperature is rising. The peak is the same. Little adaptation advantage there.
Dave
Using paper straight edge on computer screen technology -
The maximum "Super-Kyoto" temperature is in 2145. That same temperature is reached under "Producer Limited" in 2105 before climbing to a higher peak in 2020 or so.
There appears to be about a 10 year delay in temperature increases later in this century.
A 40 year delay and a slightly lower peak.
Worthwhile.
We have a catastrophe on our hands and mitigation is our only viable strategy.
As an aside, for forwarding to some members of the Icelandic Forestry Service (Skogur). Reforesting Iceland with larger trees should capture 10 to 12 Gt of carbon (not CO2) over about a century.
How would that affect Figure 12 ?
Thanks,
Alan
40 years also allows for human reactions.
China's "One Child Policy" has been in effect for less than 40 years. Significant technological breakthroughs can occur in that time (fusion ?) as well as much better understanding of geo-engineering (UGH !! But we will be desperate - better done well than badly).
And every year of delay allows ecosystems to better adapt (perhaps just from very poorly to poorly).
Alan,
Please let me respond only on the Icelandic trees. By themselves, 10-12GtC is around 1% of fossil-fuel carbon given in Table 2, so the change in Figure 12 would be of the order of a hundredth of a degree.
It is interesting to compare the Icelandic proposal to current world forest numbers. I like the 2010 FAO Global Forests Resources Assessment
http://www.fao.org/forestry/fra/fra2010/en/
In Table 2.22, they give world forest biomass as 289GtC. They reckon it has decreased 10Gt over the last 20 years, so this is comparable to the proposed Icelandic forest project.
Dave
Your source attributes most of the loss of forest biomass carbon to declining forest area. They point out that the average net rate of decline from 2000-2010 was dramatically lower than from 1990-2000. If the same linear rate of progress is extrapolated, we would start gaining global forest area on net in about 2027.